Immigrants from South Africa vs Burmese Unemployment Among Women with Children Ages 6 to 17 years

COMPARE

Immigrants from South Africa
Race
Ancestry
AfghanAfricanAlaska NativeAlaskan AthabascanAlbanianAleutAlsatianAmericanApacheArabArapahoArgentineanArmenianAssyrian/Chaldean/SyriacAustralianAustrianBahamianBangladeshiBarbadianBasqueBelgianBelizeanBermudanBhutaneseBlackfeetBolivianBrazilianBritishBritish West IndianBulgarianCajunCambodianCanadianCape VerdeanCarpatho RusynCelticCentral AmericanCentral American IndianCherokeeCheyenneChickasawChileanChineseChippewaChoctawColombianColvilleComancheCosta RicanCreeCreekCroatianCrowCubanCypriotCzechCzechoslovakianDanishDelawareDominicanDutchDutch West IndianEastern EuropeanEcuadorianEgyptianEnglishEstonianEthiopianEuropeanFijianFilipinoFinnishFrenchFrench American IndianFrench CanadianGermanGerman RussianGhanaianGreekGuamanian/ChamorroGuatemalanGuyaneseHaitianHmongHonduranHopiHoumaHungarianIcelanderIndian (Asian)IndonesianInupiatIranianIraqiIrishIroquoisIsraeliItalianJamaicanJapaneseJordanianKenyanKiowaKoreanLaotianLatvianLebaneseLiberianLithuanianLumbeeLuxembourgerMacedonianMalaysianMalteseMarshalleseMenomineeMexicanMexican American IndianMongolianMoroccanNative HawaiianNavajoNepaleseNew ZealanderNicaraguanNigerianNorthern EuropeanNorwegianOkinawanOsageOttawaPaiutePakistaniPalestinianPanamanianParaguayanPennsylvania GermanPeruvianPimaPolishPortuguesePotawatomiPuebloPuerto RicanPuget Sound SalishRomanianRussianSalvadoranSamoanScandinavianScotch-IrishScottishSeminoleSenegaleseSerbianShoshoneSierra LeoneanSiouxSlavicSlovakSloveneSomaliSouth AfricanSouth AmericanSouth American IndianSoviet UnionSpaniardSpanishSpanish AmericanSpanish American IndianSri LankanSubsaharan AfricanSudaneseSwedishSwissSyrianTaiwaneseThaiTlingit-HaidaTohono O'OdhamTonganTrinidadian and TobagonianTsimshianTurkishU.S. Virgin IslanderUgandanUkrainianUruguayanUteVenezuelanVietnameseWelshWest IndianYakamaYaquiYugoslavianYumanYup'ikZimbabwean
Immigration
NonimmigrantsImmigrantsAfghanistanAfricaAlbaniaArgentinaArmeniaAsiaAustraliaAustriaBahamasBangladeshBarbadosBelarusBelgiumBelizeBoliviaBosnia and HerzegovinaBrazilBulgariaBurma/MyanmarCabo VerdeCambodiaCameroonCanadaCaribbeanCentral AmericaChileChinaColombiaCongoCosta RicaCroatiaCubaCzechoslovakiaDenmarkDominicaDominican RepublicEastern AfricaEastern AsiaEastern EuropeEcuadorEgyptEl SalvadorEnglandEritreaEthiopiaEuropeFijiFranceGermanyGhanaGreeceGrenadaGuatemalaGuyanaHaitiHondurasHong KongHungaryIndiaIndonesiaIranIraqIrelandIsraelItalyJamaicaJapanJordanKazakhstanKenyaKoreaKuwaitLaosLatin AmericaLatviaLebanonLiberiaLithuaniaMalaysiaMexicoMicronesiaMiddle AfricaMoldovaMoroccoNepalNetherlandsNicaraguaNigeriaNorth AmericaNorth MacedoniaNorthern AfricaNorthern EuropeNorwayOceaniaPakistanPanamaPeruPhilippinesPolandPortugalRomaniaRussiaSaudi ArabiaScotlandSenegalSerbiaSierra LeoneSingaporeSomaliaSouth AfricaSouth AmericaSouth Central AsiaSouth Eastern AsiaSouthern EuropeSpainSri LankaSt. Vincent and the GrenadinesSudanSwedenSwitzerlandSyriaTaiwanThailandTrinidad and TobagoTurkeyUgandaUkraineUruguayUzbekistanVenezuelaVietnamWest IndiesWestern AfricaWestern AsiaWestern EuropeYemenZaireZimbabweAzores
Burmese
Race
Ancestry
AfghanAfricanAlaska NativeAlaskan AthabascanAlbanianAleutAlsatianAmericanApacheArabArapahoArgentineanArmenianAssyrian/Chaldean/SyriacAustralianAustrianBahamianBangladeshiBarbadianBasqueBelgianBelizeanBermudanBhutaneseBlackfeetBolivianBrazilianBritishBritish West IndianBulgarianBurmeseCajunCambodianCanadianCape VerdeanCarpatho RusynCelticCentral AmericanCentral American IndianCherokeeCheyenneChickasawChileanChineseChippewaChoctawColombianColvilleComancheCosta RicanCreeCreekCroatianCrowCubanCypriotCzechCzechoslovakianDanishDelawareDominicanDutchDutch West IndianEastern EuropeanEcuadorianEgyptianEnglishEstonianEthiopianEuropeanFijianFilipinoFinnishFrenchFrench American IndianFrench CanadianGermanGerman RussianGhanaianGreekGuamanian/ChamorroGuatemalanGuyaneseHaitianHmongHonduranHopiHoumaHungarianIcelanderIndian (Asian)IndonesianInupiatIranianIraqiIrishIroquoisIsraeliItalianJamaicanJapaneseJordanianKenyanKiowaKoreanLaotianLatvianLebaneseLiberianLithuanianLumbeeLuxembourgerMacedonianMalaysianMalteseMarshalleseMenomineeMexicanMexican American IndianMongolianMoroccanNative HawaiianNavajoNepaleseNew ZealanderNicaraguanNigerianNorthern EuropeanNorwegianOkinawanOsageOttawaPaiutePakistaniPalestinianPanamanianParaguayanPennsylvania GermanPeruvianPimaPolishPortuguesePotawatomiPuebloPuerto RicanPuget Sound SalishRomanianRussianSalvadoranSamoanScandinavianScotch-IrishScottishSeminoleSenegaleseSerbianShoshoneSierra LeoneanSiouxSlavicSlovakSloveneSomaliSouth AfricanSouth AmericanSouth American IndianSoviet UnionSpaniardSpanishSpanish AmericanSpanish American IndianSri LankanSubsaharan AfricanSudaneseSwedishSwissSyrianTaiwaneseThaiTlingit-HaidaTohono O'OdhamTonganTrinidadian and TobagonianTsimshianTurkishU.S. Virgin IslanderUgandanUkrainianUruguayanUteVenezuelanVietnameseWelshWest IndianYakamaYaquiYugoslavianYumanYup'ikZimbabwean
Immigration
NonimmigrantsImmigrantsAfghanistanAfricaAlbaniaArgentinaArmeniaAsiaAustraliaAustriaBahamasBangladeshBarbadosBelarusBelgiumBelizeBoliviaBosnia and HerzegovinaBrazilBulgariaBurma/MyanmarCabo VerdeCambodiaCameroonCanadaCaribbeanCentral AmericaChileChinaColombiaCongoCosta RicaCroatiaCubaCzechoslovakiaDenmarkDominicaDominican RepublicEastern AfricaEastern AsiaEastern EuropeEcuadorEgyptEl SalvadorEnglandEritreaEthiopiaEuropeFijiFranceGermanyGhanaGreeceGrenadaGuatemalaGuyanaHaitiHondurasHong KongHungaryIndiaIndonesiaIranIraqIrelandIsraelItalyJamaicaJapanJordanKazakhstanKenyaKoreaKuwaitLaosLatin AmericaLatviaLebanonLiberiaLithuaniaMalaysiaMexicoMicronesiaMiddle AfricaMoldovaMoroccoNepalNetherlandsNicaraguaNigeriaNorth AmericaNorth MacedoniaNorthern AfricaNorthern EuropeNorwayOceaniaPakistanPanamaPeruPhilippinesPolandPortugalRomaniaRussiaSaudi ArabiaScotlandSenegalSerbiaSierra LeoneSingaporeSomaliaSouth AmericaSouth Central AsiaSouth Eastern AsiaSouthern EuropeSpainSri LankaSt. Vincent and the GrenadinesSudanSwedenSwitzerlandSyriaTaiwanThailandTrinidad and TobagoTurkeyUgandaUkraineUruguayUzbekistanVenezuelaVietnamWest IndiesWestern AfricaWestern AsiaWestern EuropeYemenZaireZimbabweAzores
Unemployment Among Women with Children Ages 6 to 17 years
Income
Poverty
Unemployment
Labor Participation
Family Structure
Vehicle Availability
Education Level
Disability

Unemployment Among Women with Children Ages 6 to 17 years Comparison

Immigrants from South Africa

Burmese

Exceptional
Exceptional
8.6%
UNEMPLOYMENT AMONG WOMEN WITH CHILDREN AGES 6 TO 17 YEARS
98.3/ 100
METRIC RATING
102nd/ 347
METRIC RANK
8.0%
UNEMPLOYMENT AMONG WOMEN WITH CHILDREN AGES 6 TO 17 YEARS
100.0/ 100
METRIC RATING
36th/ 347
METRIC RANK

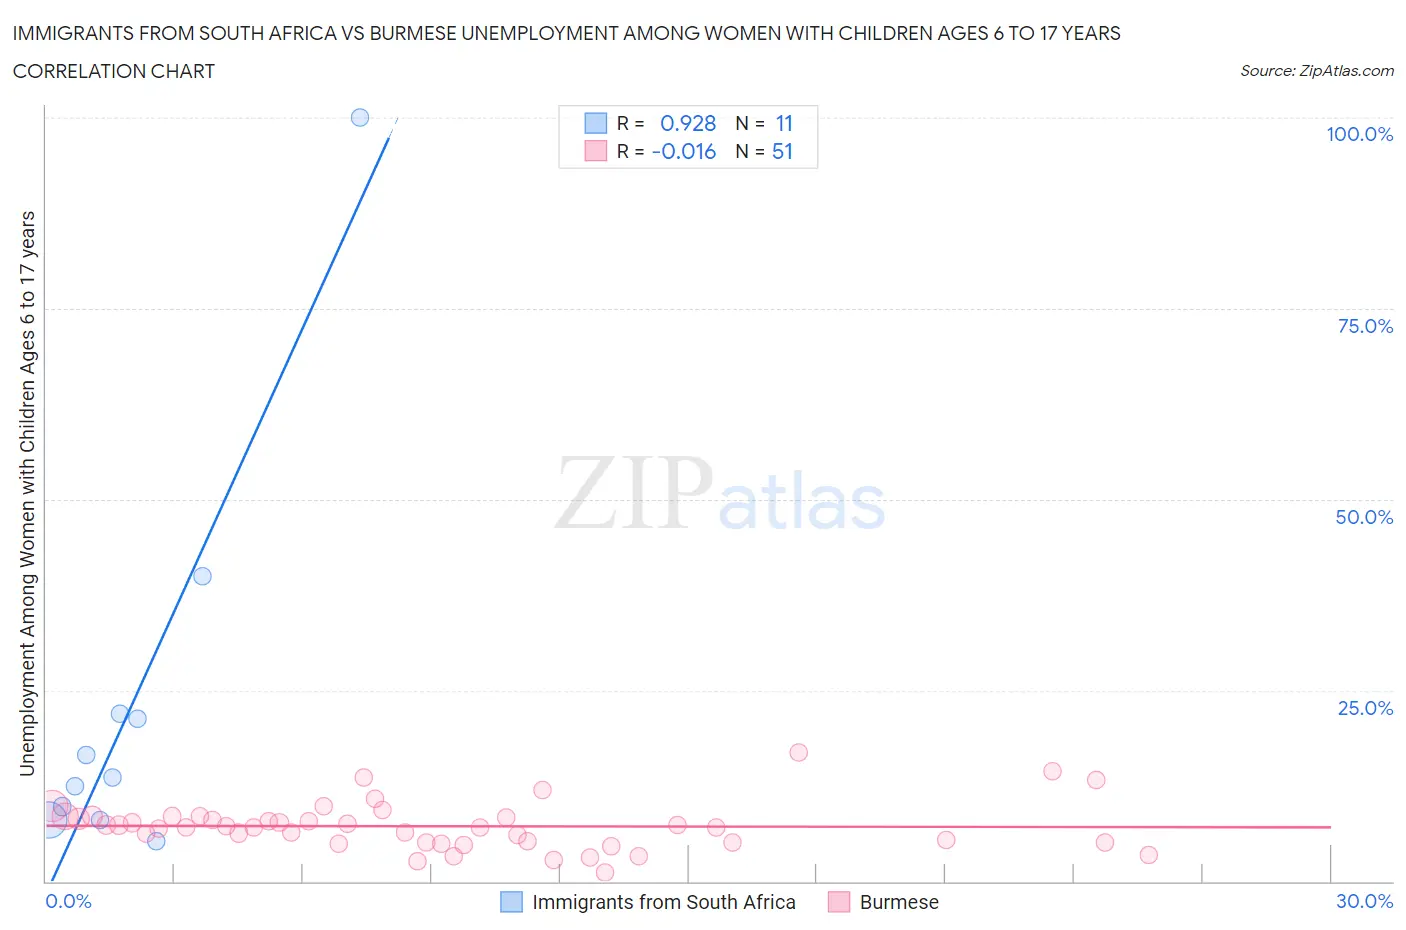
Immigrants from South Africa vs Burmese Unemployment Among Women with Children Ages 6 to 17 years Correlation Chart

The statistical analysis conducted on geographies consisting of 179,401,659 people shows a near-perfect positive correlation between the proportion of Immigrants from South Africa and unemployment rate among women with children between the ages 6 and 17 in the United States with a correlation coefficient (R) of 0.928 and weighted average of 8.6%. Similarly, the statistical analysis conducted on geographies consisting of 320,179,112 people shows no correlation between the proportion of Burmese and unemployment rate among women with children between the ages 6 and 17 in the United States with a correlation coefficient (R) of -0.016 and weighted average of 8.0%, a difference of 7.6%.
Immigrants from South Africa vs Burmese Unemployment Among Women with Children Ages 6 to 17 years

Unemployment Among Women with Children Ages 6 to 17 years Correlation Summary

MeasurementImmigrants from South AfricaBurmese
Minimum5.3%1.2%
Maximum100.0%16.8%
Range94.7%15.6%
Mean23.4%7.2%
Median13.6%7.1%
Interquartile 25% (IQ1)8.1%5.1%
Interquartile 75% (IQ3)21.9%8.4%
Interquartile Range (IQR)13.8%3.3%
Standard Deviation (Sample)27.2%3.1%
Standard Deviation (Population)25.9%3.1%

Similar Demographics by Unemployment Among Women with Children Ages 6 to 17 years

Demographics Similar to Immigrants from South Africa by Unemployment Among Women with Children Ages 6 to 17 years

In terms of unemployment among women with children ages 6 to 17 years, the demographic groups most similar to Immigrants from South Africa are Scandinavian (8.6%, a difference of 0.010%), Immigrants from Pakistan (8.6%, a difference of 0.020%), Immigrants from Lithuania (8.6%, a difference of 0.030%), New Zealander (8.6%, a difference of 0.030%), and Malaysian (8.6%, a difference of 0.10%).
DemographicsRating | RankUnemployment Among Women with Children Ages 6 to 17 years
Sri Lankans
98.7
/100
|
#95
Exceptional
8.5%
German Russians
98.6
/100
|
#96
Exceptional
8.5%
Bolivians
98.5
/100
|
#97
Exceptional
8.5%
Malaysians
98.5
/100
|
#98
Exceptional
8.6%
Immigrants | Lithuania
98.4
/100
|
#99
Exceptional
8.6%
New Zealanders
98.4
/100
|
#100
Exceptional
8.6%
Immigrants | Pakistan
98.4
/100
|
#101
Exceptional
8.6%
Immigrants | South Africa
98.3
/100
|
#102
Exceptional
8.6%
Scandinavians
98.3
/100
|
#103
Exceptional
8.6%
Immigrants | France
98.0
/100
|
#104
Exceptional
8.6%
Immigrants | Norway
97.8
/100
|
#105
Exceptional
8.6%
Immigrants | Serbia
97.7
/100
|
#106
Exceptional
8.6%
Chickasaw
97.6
/100
|
#107
Exceptional
8.6%
Swedes
97.6
/100
|
#108
Exceptional
8.6%
Immigrants | Romania
97.5
/100
|
#109
Exceptional
8.6%

Demographics Similar to Burmese by Unemployment Among Women with Children Ages 6 to 17 years

In terms of unemployment among women with children ages 6 to 17 years, the demographic groups most similar to Burmese are Asian (8.0%, a difference of 0.030%), Immigrants from South Central Asia (7.9%, a difference of 0.080%), Native Hawaiian (7.9%, a difference of 0.18%), Alsatian (8.0%, a difference of 0.36%), and Immigrants from Korea (7.9%, a difference of 0.47%).
DemographicsRating | RankUnemployment Among Women with Children Ages 6 to 17 years
Thais
100.0
/100
|
#29
Exceptional
7.8%
Immigrants | Iran
100.0
/100
|
#30
Exceptional
7.9%
Laotians
100.0
/100
|
#31
Exceptional
7.9%
Immigrants | Cambodia
100.0
/100
|
#32
Exceptional
7.9%
Immigrants | Korea
100.0
/100
|
#33
Exceptional
7.9%
Native Hawaiians
100.0
/100
|
#34
Exceptional
7.9%
Immigrants | South Central Asia
100.0
/100
|
#35
Exceptional
7.9%
Burmese
100.0
/100
|
#36
Exceptional
8.0%
Asians
100.0
/100
|
#37
Exceptional
8.0%
Alsatians
100.0
/100
|
#38
Exceptional
8.0%
Somalis
100.0
/100
|
#39
Exceptional
8.0%
Immigrants | Zimbabwe
100.0
/100
|
#40
Exceptional
8.0%
Iranians
100.0
/100
|
#41
Exceptional
8.0%
Immigrants | Somalia
100.0
/100
|
#42
Exceptional
8.0%
Bhutanese
100.0
/100
|
#43
Exceptional
8.1%