Immigrants from Belize vs Immigrants from Haiti Unemployment Among Women with Children Ages 6 to 17 years
COMPARE
Immigrants from Belize
Immigrants from Haiti
Unemployment Among Women with Children Ages 6 to 17 years
Unemployment Among Women with Children Ages 6 to 17 years Comparison
Immigrants from Belize
Immigrants from Haiti
9.3%
UNEMPLOYMENT AMONG WOMEN WITH CHILDREN AGES 6 TO 17 YEARS
2.8/ 100
METRIC RATING
237th/ 347
METRIC RANK
10.1%
UNEMPLOYMENT AMONG WOMEN WITH CHILDREN AGES 6 TO 17 YEARS
0.0/ 100
METRIC RATING
298th/ 347
METRIC RANK
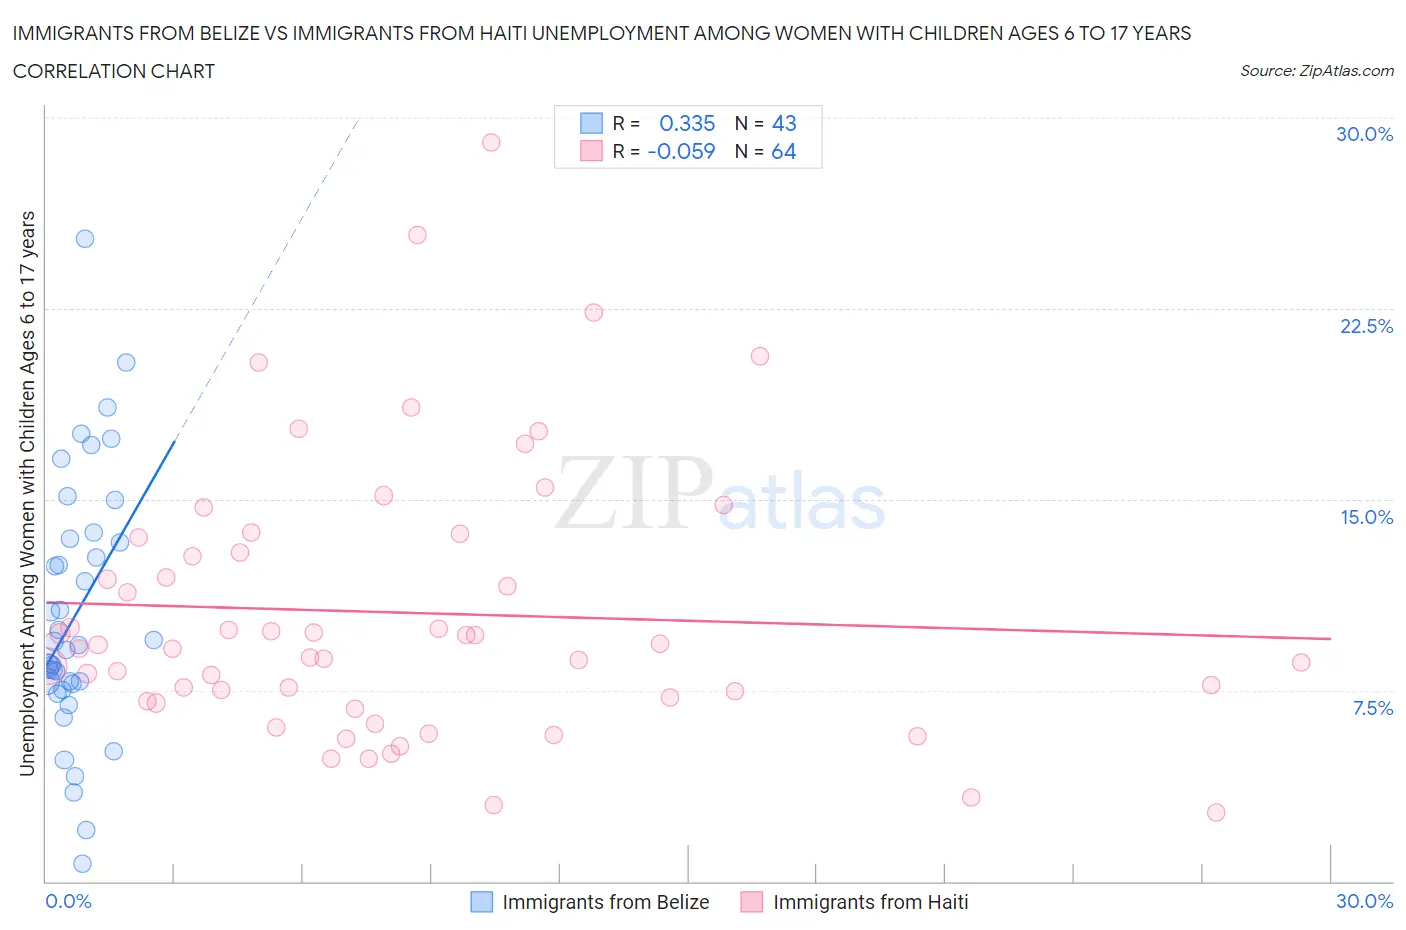
Immigrants from Belize vs Immigrants from Haiti Unemployment Among Women with Children Ages 6 to 17 years Correlation Chart
The statistical analysis conducted on geographies consisting of 113,544,654 people shows a mild positive correlation between the proportion of Immigrants from Belize and unemployment rate among women with children between the ages 6 and 17 in the United States with a correlation coefficient (R) of 0.335 and weighted average of 9.3%. Similarly, the statistical analysis conducted on geographies consisting of 177,744,488 people shows a slight negative correlation between the proportion of Immigrants from Haiti and unemployment rate among women with children between the ages 6 and 17 in the United States with a correlation coefficient (R) of -0.059 and weighted average of 10.1%, a difference of 8.4%.
Unemployment Among Women with Children Ages 6 to 17 years Correlation Summary
| Measurement | Immigrants from Belize | Immigrants from Haiti |
| Minimum | 0.70% | 2.7% |
| Maximum | 25.2% | 29.0% |
| Range | 24.5% | 26.3% |
| Mean | 10.5% | 10.6% |
| Median | 9.3% | 9.2% |
| Interquartile 25% (IQ1) | 7.8% | 7.1% |
| Interquartile 75% (IQ3) | 13.5% | 13.2% |
| Interquartile Range (IQR) | 5.7% | 6.1% |
| Standard Deviation (Sample) | 5.1% | 5.4% |
| Standard Deviation (Population) | 5.0% | 5.3% |
Similar Demographics by Unemployment Among Women with Children Ages 6 to 17 years
Demographics Similar to Immigrants from Belize by Unemployment Among Women with Children Ages 6 to 17 years
In terms of unemployment among women with children ages 6 to 17 years, the demographic groups most similar to Immigrants from Belize are Hungarian (9.3%, a difference of 0.050%), Uruguayan (9.3%, a difference of 0.070%), Arab (9.3%, a difference of 0.080%), Immigrants from Saudi Arabia (9.3%, a difference of 0.080%), and Mexican (9.3%, a difference of 0.14%).
| Demographics | Rating | Rank | Unemployment Among Women with Children Ages 6 to 17 years |
| Welsh | 4.0 /100 | #230 | Tragic 9.3% |
| Macedonians | 3.9 /100 | #231 | Tragic 9.3% |
| French American Indians | 3.7 /100 | #232 | Tragic 9.3% |
| Immigrants | St. Vincent and the Grenadines | 3.3 /100 | #233 | Tragic 9.3% |
| Mexicans | 3.2 /100 | #234 | Tragic 9.3% |
| Uruguayans | 3.0 /100 | #235 | Tragic 9.3% |
| Hungarians | 3.0 /100 | #236 | Tragic 9.3% |
| Immigrants | Belize | 2.8 /100 | #237 | Tragic 9.3% |
| Arabs | 2.7 /100 | #238 | Tragic 9.3% |
| Immigrants | Saudi Arabia | 2.7 /100 | #239 | Tragic 9.3% |
| Guatemalans | 2.3 /100 | #240 | Tragic 9.3% |
| Colombians | 2.2 /100 | #241 | Tragic 9.3% |
| Immigrants | Colombia | 2.1 /100 | #242 | Tragic 9.3% |
| Scottish | 2.0 /100 | #243 | Tragic 9.4% |
| English | 1.9 /100 | #244 | Tragic 9.4% |
Demographics Similar to Immigrants from Haiti by Unemployment Among Women with Children Ages 6 to 17 years
In terms of unemployment among women with children ages 6 to 17 years, the demographic groups most similar to Immigrants from Haiti are Immigrants from Honduras (10.1%, a difference of 0.020%), Nigerian (10.1%, a difference of 0.040%), Immigrants from Bahamas (10.1%, a difference of 0.20%), Immigrants from Caribbean (10.1%, a difference of 0.30%), and Immigrants from Western Africa (10.1%, a difference of 0.32%).
| Demographics | Rating | Rank | Unemployment Among Women with Children Ages 6 to 17 years |
| Immigrants | Nonimmigrants | 0.0 /100 | #291 | Tragic 10.0% |
| Carpatho Rusyns | 0.0 /100 | #292 | Tragic 10.0% |
| Haitians | 0.0 /100 | #293 | Tragic 10.0% |
| Ecuadorians | 0.0 /100 | #294 | Tragic 10.0% |
| Cherokee | 0.0 /100 | #295 | Tragic 10.0% |
| Immigrants | Western Africa | 0.0 /100 | #296 | Tragic 10.1% |
| Immigrants | Caribbean | 0.0 /100 | #297 | Tragic 10.1% |
| Immigrants | Haiti | 0.0 /100 | #298 | Tragic 10.1% |
| Immigrants | Honduras | 0.0 /100 | #299 | Tragic 10.1% |
| Nigerians | 0.0 /100 | #300 | Tragic 10.1% |
| Immigrants | Bahamas | 0.0 /100 | #301 | Tragic 10.1% |
| Venezuelans | 0.0 /100 | #302 | Tragic 10.2% |
| Immigrants | Ecuador | 0.0 /100 | #303 | Tragic 10.2% |
| Immigrants | Venezuela | 0.0 /100 | #304 | Tragic 10.2% |
| Immigrants | Nigeria | 0.0 /100 | #305 | Tragic 10.2% |