Zip Codes with the Highest Percentage of Population Employed in Real Estate, Rental & Leasing in Cleburne, TX
RELATED REPORTS & OPTIONS
Real Estate, Rental & Leasing
Cleburne
Compare Zip Codes
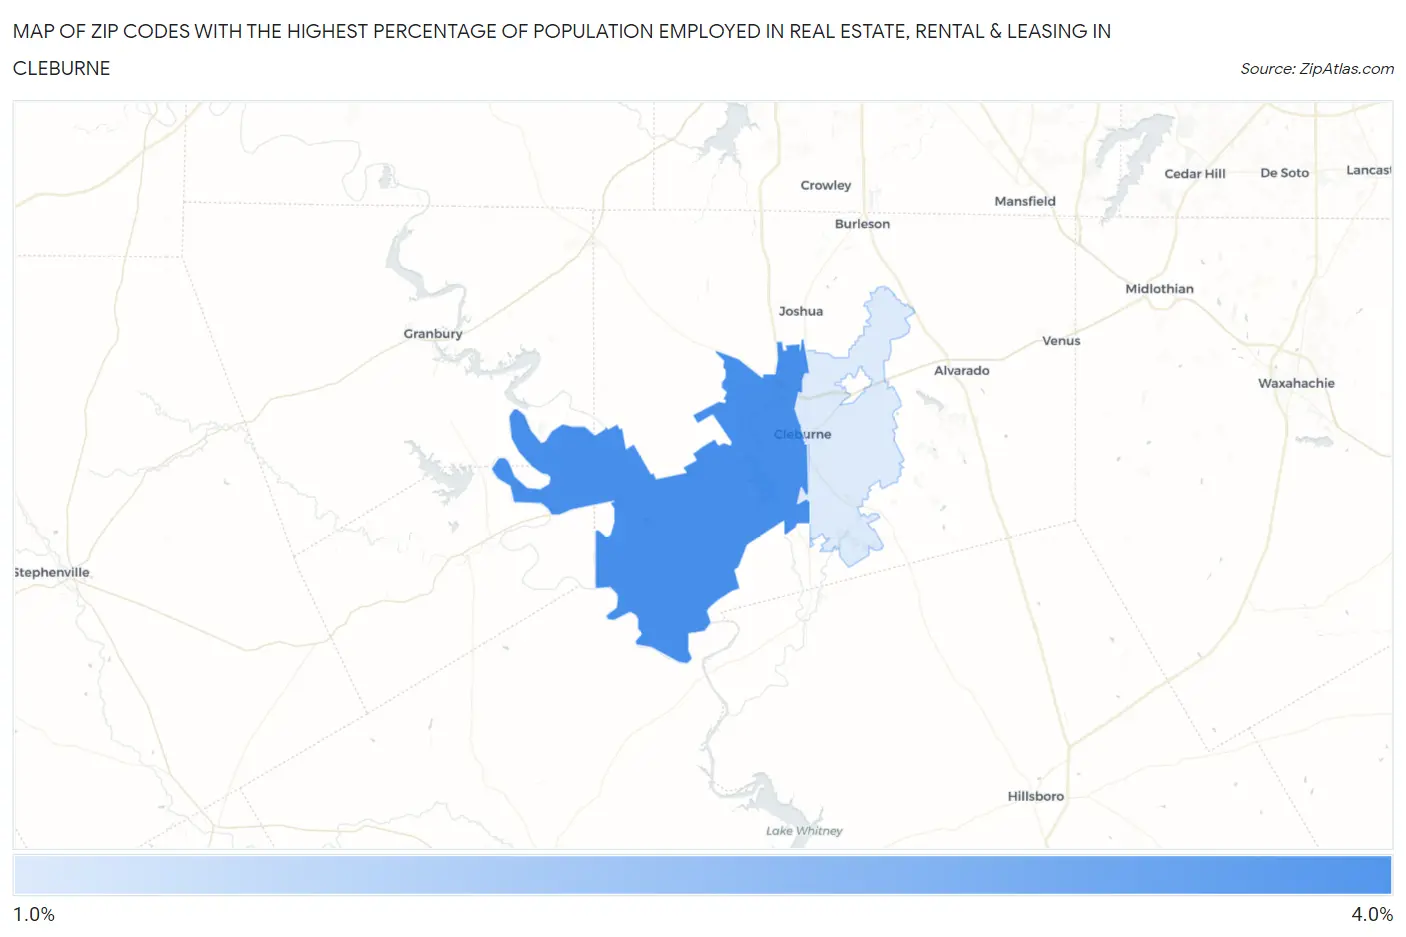
Map of Zip Codes with the Highest Percentage of Population Employed in Real Estate, Rental & Leasing in Cleburne
0.0%
4.0%
Zip Codes with the Highest Percentage of Population Employed in Real Estate, Rental & Leasing in Cleburne, TX
| Zip Code | % Employed | vs State | vs National | |
| 1. | 76033 | 3.3% | 2.0%(+1.27)#207 | 1.9%(+1.38)#3,269 |
| 2. | 76031 | 1.6% | 2.0%(-0.393)#740 | 1.9%(-0.277)#10,354 |
1
Common Questions
What are the Top Zip Codes with the Highest Percentage of Population Employed in Real Estate, Rental & Leasing in Cleburne, TX?
Top Zip Codes with the Highest Percentage of Population Employed in Real Estate, Rental & Leasing in Cleburne, TX are:
What zip code has the Highest Percentage of Population Employed in Real Estate, Rental & Leasing in Cleburne, TX?
76033 has the Highest Percentage of Population Employed in Real Estate, Rental & Leasing in Cleburne, TX with 3.3%.
What is the Percentage of Population Employed in Real Estate, Rental & Leasing in Cleburne, TX?
Percentage of Population Employed in Real Estate, Rental & Leasing in Cleburne is 2.9%.
What is the Percentage of Population Employed in Real Estate, Rental & Leasing in Texas?
Percentage of Population Employed in Real Estate, Rental & Leasing in Texas is 2.0%.
What is the Percentage of Population Employed in Real Estate, Rental & Leasing in the United States?
Percentage of Population Employed in Real Estate, Rental & Leasing in the United States is 1.9%.