Zip Codes with the Highest Percentage of Population with a Degree in Visual and Performing Arts in Mount Pleasant, SC
RELATED REPORTS & OPTIONS
Visual and Performing Arts
Mount Pleasant
Compare Zip Codes
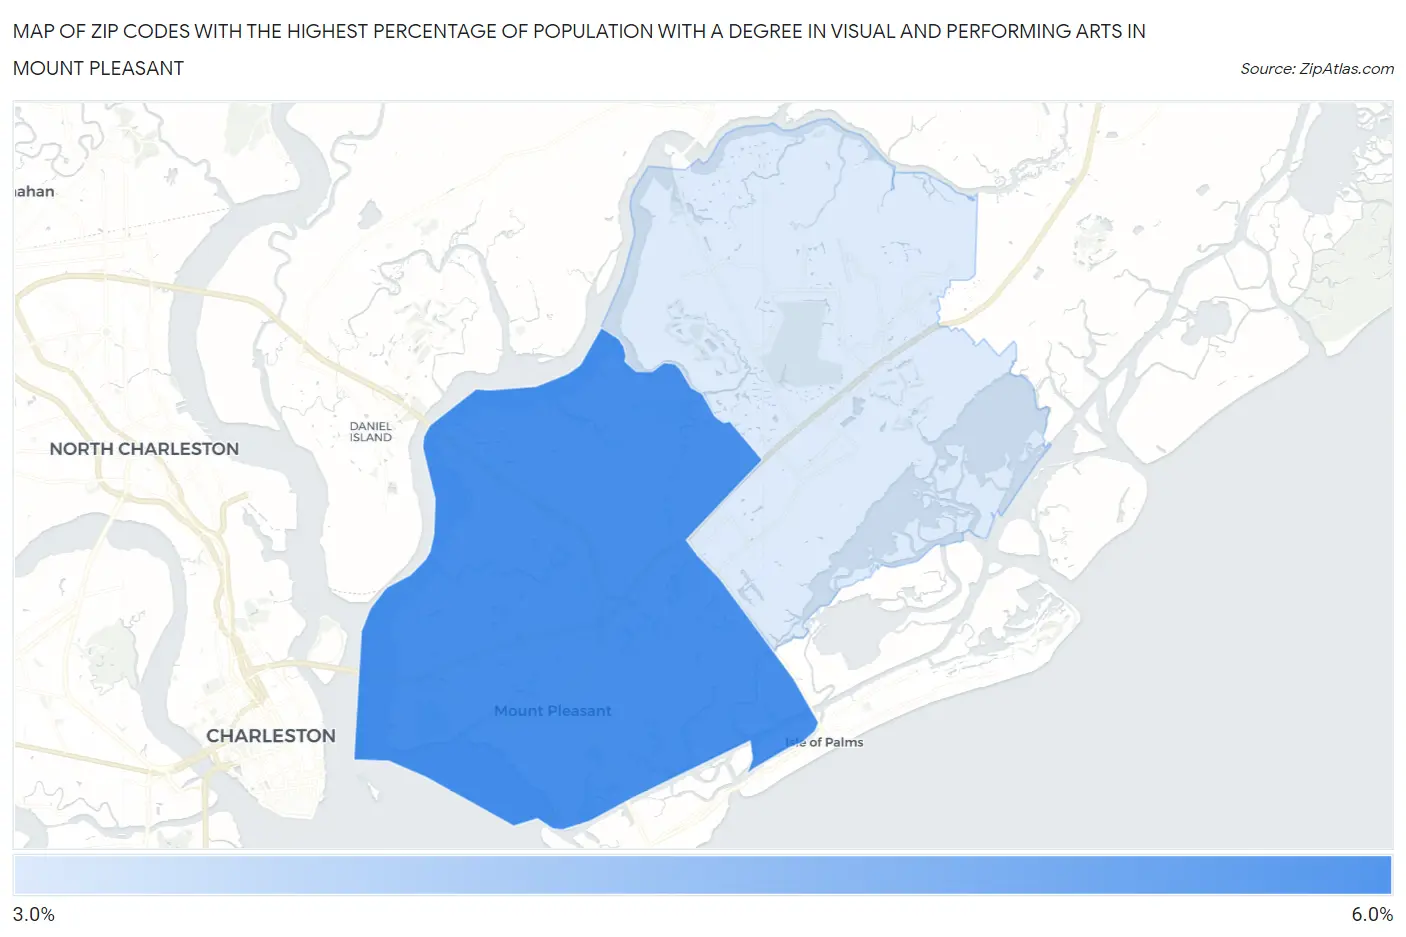
Map of Zip Codes with the Highest Percentage of Population with a Degree in Visual and Performing Arts in Mount Pleasant
0.0%
6.0%
Zip Codes with the Highest Percentage of Population with a Degree in Visual and Performing Arts in Mount Pleasant, SC
| Zip Code | % Graduates | vs State | vs National | |
| 1. | 29464 | 5.3% | 3.3%(+2.07)#54 | 4.3%(+1.08)#5,998 |
| 2. | 29466 | 3.2% | 3.3%(-0.041)#126 | 4.3%(-1.03)#11,902 |
1
Common Questions
What are the Top Zip Codes with the Highest Percentage of Population with a Degree in Visual and Performing Arts in Mount Pleasant, SC?
Top Zip Codes with the Highest Percentage of Population with a Degree in Visual and Performing Arts in Mount Pleasant, SC are:
What zip code has the Highest Percentage of Population with a Degree in Visual and Performing Arts in Mount Pleasant, SC?
29464 has the Highest Percentage of Population with a Degree in Visual and Performing Arts in Mount Pleasant, SC with 5.3%.
What is the Percentage of Population with a Degree in Visual and Performing Arts in Mount Pleasant, SC?
Percentage of Population with a Degree in Visual and Performing Arts in Mount Pleasant is 4.5%.
What is the Percentage of Population with a Degree in Visual and Performing Arts in South Carolina?
Percentage of Population with a Degree in Visual and Performing Arts in South Carolina is 3.3%.
What is the Percentage of Population with a Degree in Visual and Performing Arts in the United States?
Percentage of Population with a Degree in Visual and Performing Arts in the United States is 4.3%.