Zip Codes with the Highest Percentage of Population with a Degree in Science and Engineering in Mount Pleasant, SC
RELATED REPORTS & OPTIONS
Science and Engineering
Mount Pleasant
Compare Zip Codes
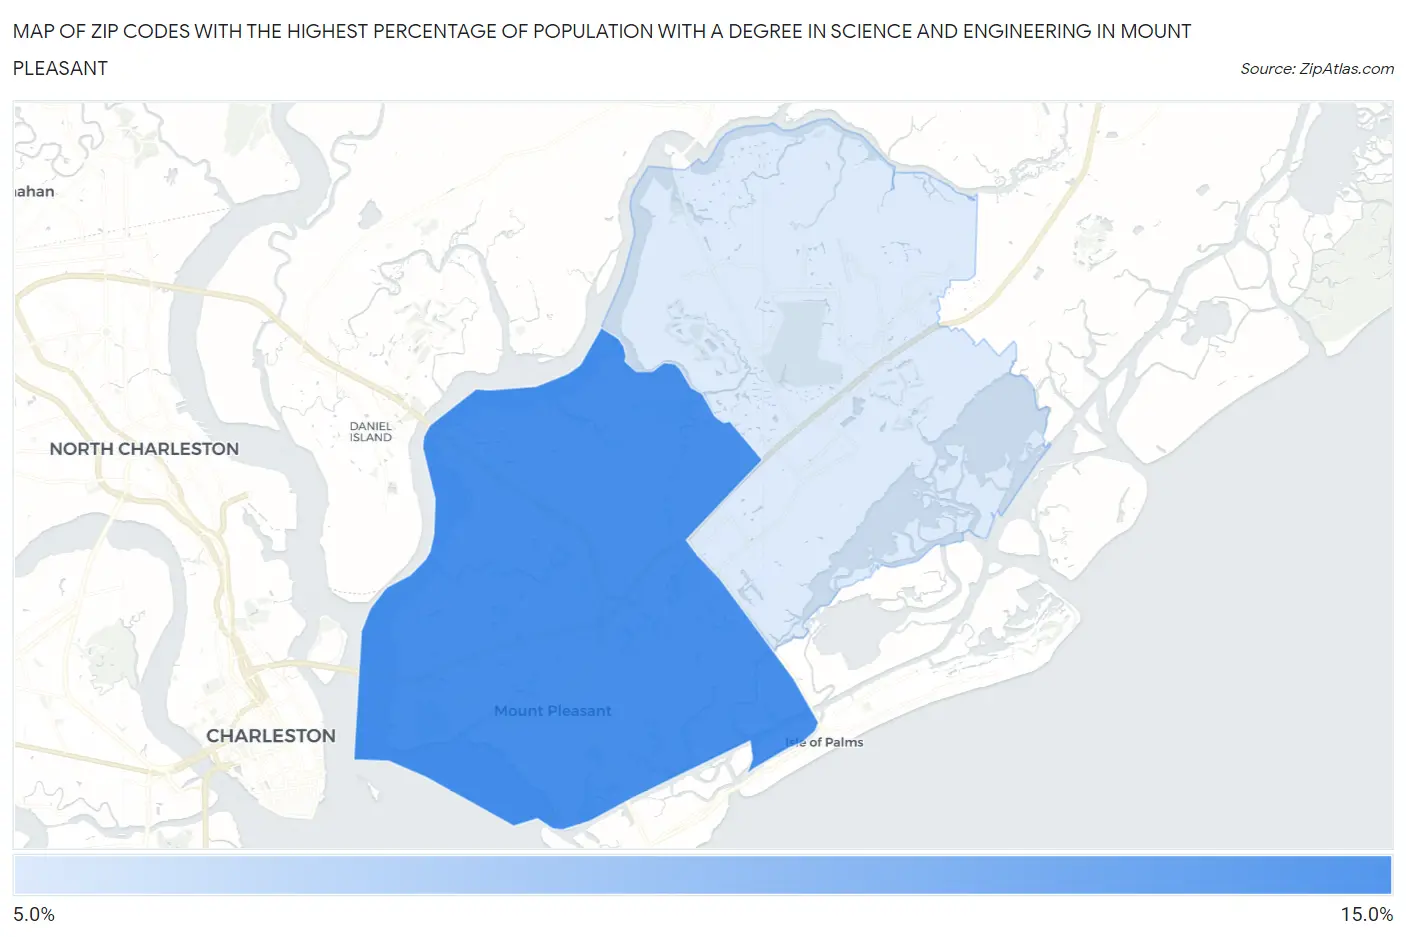
Map of Zip Codes with the Highest Percentage of Population with a Degree in Science and Engineering in Mount Pleasant
0.0%
15.0%
Zip Codes with the Highest Percentage of Population with a Degree in Science and Engineering in Mount Pleasant, SC
| Zip Code | % Graduates | vs State | vs National | |
| 1. | 29464 | 11.0% | 10.2%(+0.816)#154 | 9.8%(+1.25)#12,812 |
| 2. | 29466 | 9.0% | 10.2%(-1.20)#218 | 9.8%(-0.761)#17,296 |
1
Common Questions
What are the Top Zip Codes with the Highest Percentage of Population with a Degree in Science and Engineering in Mount Pleasant, SC?
Top Zip Codes with the Highest Percentage of Population with a Degree in Science and Engineering in Mount Pleasant, SC are:
What zip code has the Highest Percentage of Population with a Degree in Science and Engineering in Mount Pleasant, SC?
29464 has the Highest Percentage of Population with a Degree in Science and Engineering in Mount Pleasant, SC with 11.0%.
What is the Percentage of Population with a Degree in Science and Engineering in Mount Pleasant, SC?
Percentage of Population with a Degree in Science and Engineering in Mount Pleasant is 10.4%.
What is the Percentage of Population with a Degree in Science and Engineering in South Carolina?
Percentage of Population with a Degree in Science and Engineering in South Carolina is 10.2%.
What is the Percentage of Population with a Degree in Science and Engineering in the United States?
Percentage of Population with a Degree in Science and Engineering in the United States is 9.8%.