Zip Codes with the Highest Percentage of Population Employed in Installation, Maintenance & Repair in Mount Pleasant, SC
RELATED REPORTS & OPTIONS
Installation, Maintenance & Repair
Mount Pleasant
Compare Zip Codes
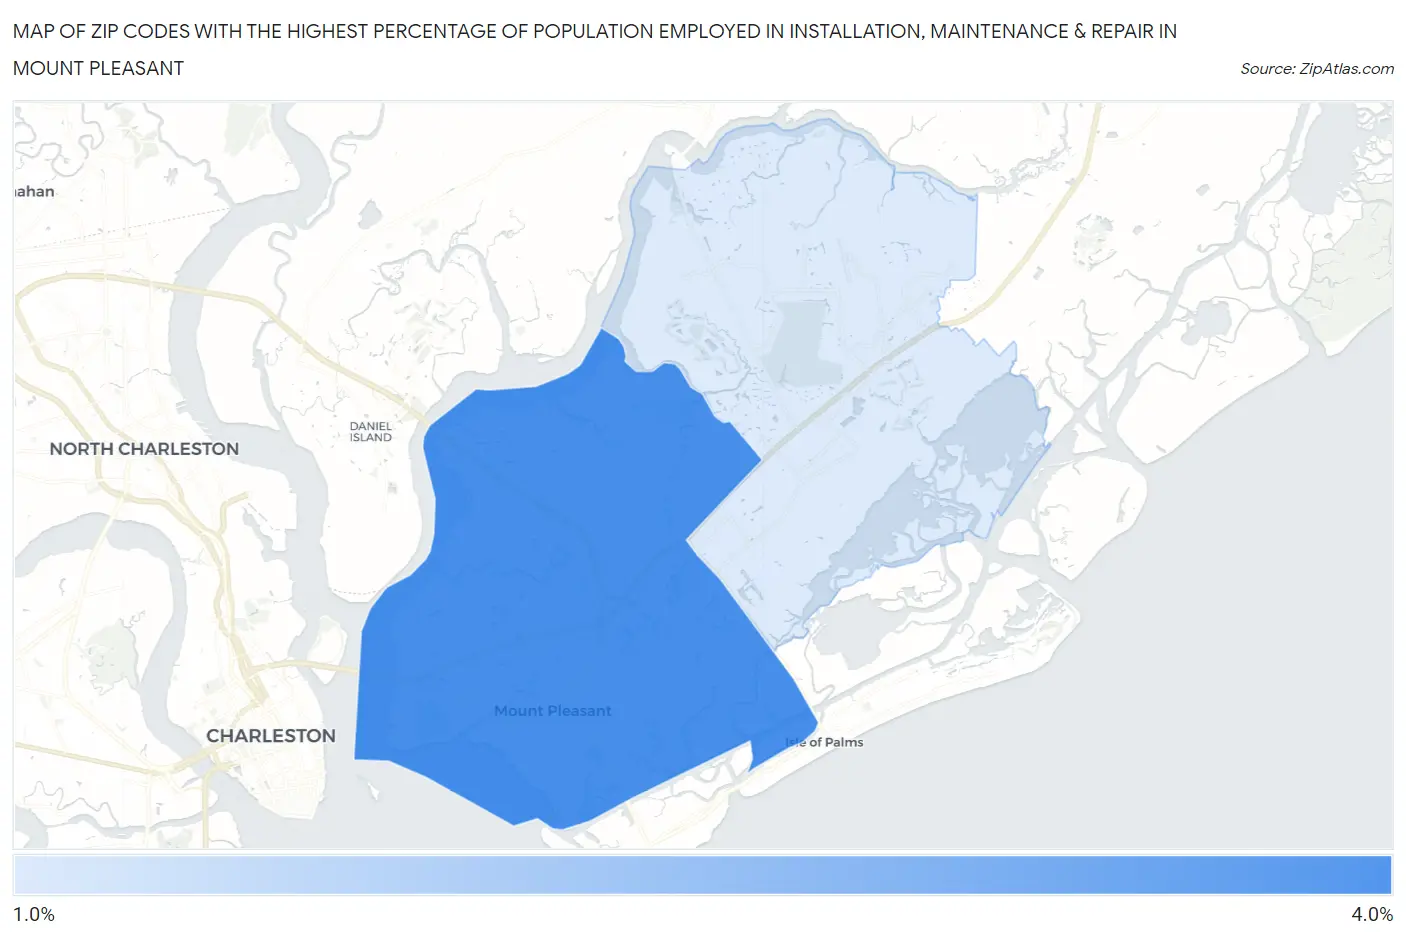
Map of Zip Codes with the Highest Percentage of Population Employed in Installation, Maintenance & Repair in Mount Pleasant
0.0%
4.0%
Zip Codes with the Highest Percentage of Population Employed in Installation, Maintenance & Repair in Mount Pleasant, SC
| Zip Code | % Employed | vs State | vs National | |
| 1. | 29464 | 3.2% | 3.8%(-0.562)#227 | 3.1%(+0.176)#15,819 |
| 2. | 29466 | 1.0% | 3.8%(-2.80)#352 | 3.1%(-2.07)#25,925 |
1
Common Questions
What are the Top Zip Codes with the Highest Percentage of Population Employed in Installation, Maintenance & Repair in Mount Pleasant, SC?
Top Zip Codes with the Highest Percentage of Population Employed in Installation, Maintenance & Repair in Mount Pleasant, SC are:
What zip code has the Highest Percentage of Population Employed in Installation, Maintenance & Repair in Mount Pleasant, SC?
29464 has the Highest Percentage of Population Employed in Installation, Maintenance & Repair in Mount Pleasant, SC with 3.2%.
What is the Percentage of Population Employed in Installation, Maintenance & Repair in Mount Pleasant, SC?
Percentage of Population Employed in Installation, Maintenance & Repair in Mount Pleasant is 2.3%.
What is the Percentage of Population Employed in Installation, Maintenance & Repair in South Carolina?
Percentage of Population Employed in Installation, Maintenance & Repair in South Carolina is 3.8%.
What is the Percentage of Population Employed in Installation, Maintenance & Repair in the United States?
Percentage of Population Employed in Installation, Maintenance & Repair in the United States is 3.1%.