Zip Codes with the Highest Percentage of Population with a Degree in Liberal Arts and History in Mount Pleasant, SC
RELATED REPORTS & OPTIONS
Liberal Arts and History
Mount Pleasant
Compare Zip Codes
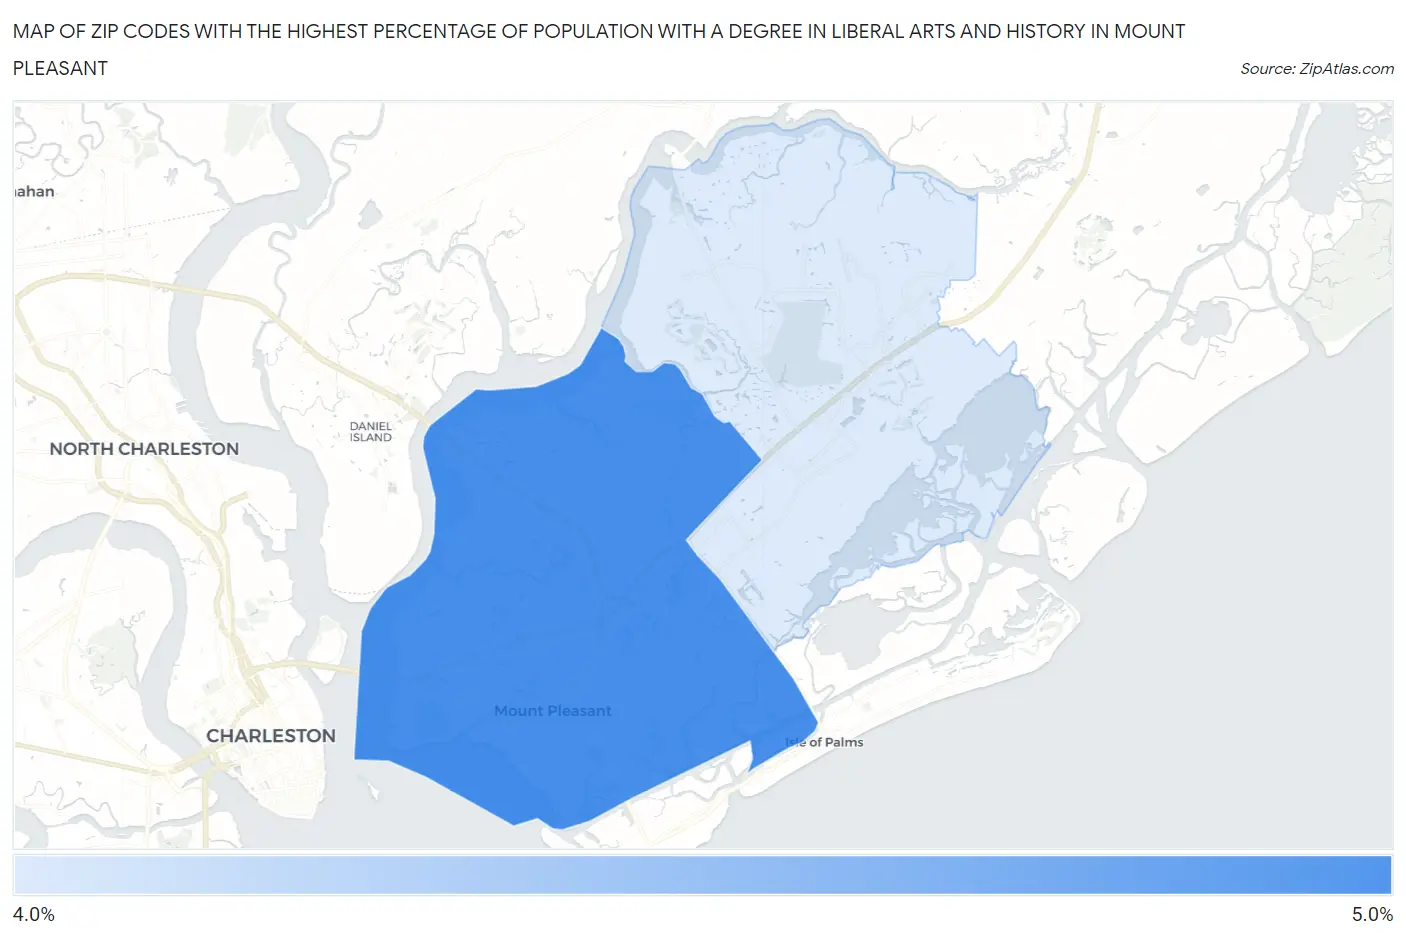
Map of Zip Codes with the Highest Percentage of Population with a Degree in Liberal Arts and History in Mount Pleasant
0.0%
5.0%
Zip Codes with the Highest Percentage of Population with a Degree in Liberal Arts and History in Mount Pleasant, SC
| Zip Code | % Graduates | vs State | vs National | |
| 1. | 29464 | 4.6% | 5.2%(-0.580)#195 | 4.9%(-0.254)#12,587 |
| 2. | 29466 | 4.6% | 5.2%(-0.593)#196 | 4.9%(-0.267)#12,629 |
1
Common Questions
What are the Top Zip Codes with the Highest Percentage of Population with a Degree in Liberal Arts and History in Mount Pleasant, SC?
Top Zip Codes with the Highest Percentage of Population with a Degree in Liberal Arts and History in Mount Pleasant, SC are:
What zip code has the Highest Percentage of Population with a Degree in Liberal Arts and History in Mount Pleasant, SC?
29464 has the Highest Percentage of Population with a Degree in Liberal Arts and History in Mount Pleasant, SC with 4.6%.
What is the Percentage of Population with a Degree in Liberal Arts and History in Mount Pleasant, SC?
Percentage of Population with a Degree in Liberal Arts and History in Mount Pleasant is 4.6%.
What is the Percentage of Population with a Degree in Liberal Arts and History in South Carolina?
Percentage of Population with a Degree in Liberal Arts and History in South Carolina is 5.2%.
What is the Percentage of Population with a Degree in Liberal Arts and History in the United States?
Percentage of Population with a Degree in Liberal Arts and History in the United States is 4.9%.