Zip Codes with the Highest Percentage of Population with a Degree in Visual and Performing Arts in Simpsonville, SC
RELATED REPORTS & OPTIONS
Visual and Performing Arts
Simpsonville
Compare Zip Codes
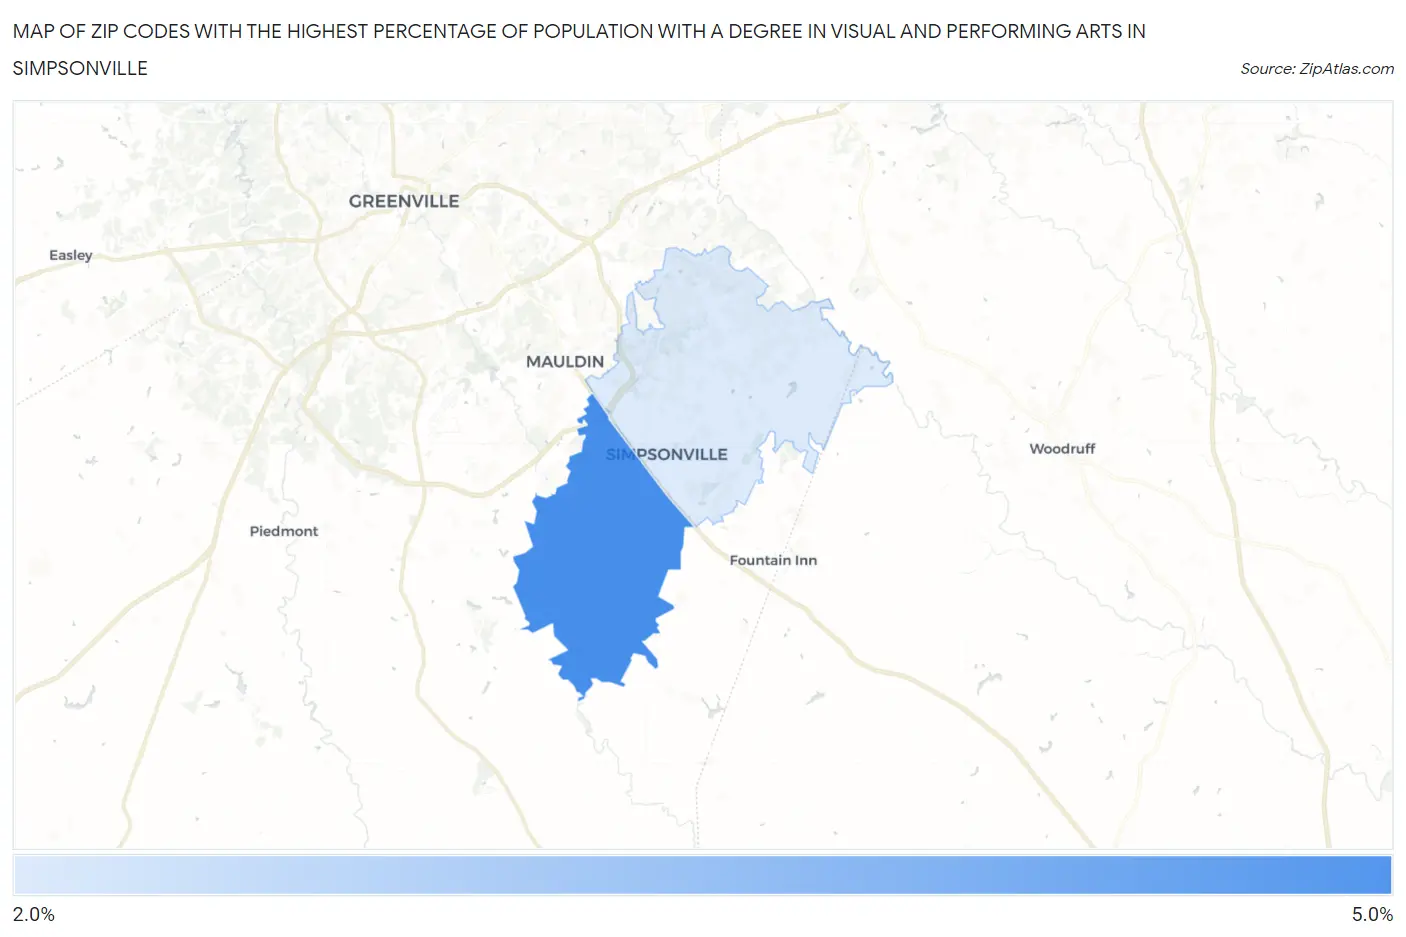
Map of Zip Codes with the Highest Percentage of Population with a Degree in Visual and Performing Arts in Simpsonville
0.0%
5.0%
Zip Codes with the Highest Percentage of Population with a Degree in Visual and Performing Arts in Simpsonville, SC
| Zip Code | % Graduates | vs State | vs National | |
| 1. | 29680 | 4.1% | 3.3%(+0.880)#72 | 4.3%(-0.108)#8,784 |
| 2. | 29681 | 2.8% | 3.3%(-0.476)#151 | 4.3%(-1.46)#13,546 |
1
Common Questions
What are the Top Zip Codes with the Highest Percentage of Population with a Degree in Visual and Performing Arts in Simpsonville, SC?
Top Zip Codes with the Highest Percentage of Population with a Degree in Visual and Performing Arts in Simpsonville, SC are:
What zip code has the Highest Percentage of Population with a Degree in Visual and Performing Arts in Simpsonville, SC?
29680 has the Highest Percentage of Population with a Degree in Visual and Performing Arts in Simpsonville, SC with 4.1%.
What is the Percentage of Population with a Degree in Visual and Performing Arts in Simpsonville, SC?
Percentage of Population with a Degree in Visual and Performing Arts in Simpsonville is 3.7%.
What is the Percentage of Population with a Degree in Visual and Performing Arts in South Carolina?
Percentage of Population with a Degree in Visual and Performing Arts in South Carolina is 3.3%.
What is the Percentage of Population with a Degree in Visual and Performing Arts in the United States?
Percentage of Population with a Degree in Visual and Performing Arts in the United States is 4.3%.