Zip Codes with the Highest Percentage of Population with a Degree in Visual and Performing Arts in Anderson, SC
RELATED REPORTS & OPTIONS
Visual and Performing Arts
Anderson
Compare Zip Codes
Map of Zip Codes with the Highest Percentage of Population with a Degree in Visual and Performing Arts in Anderson
0.0%
6.0%
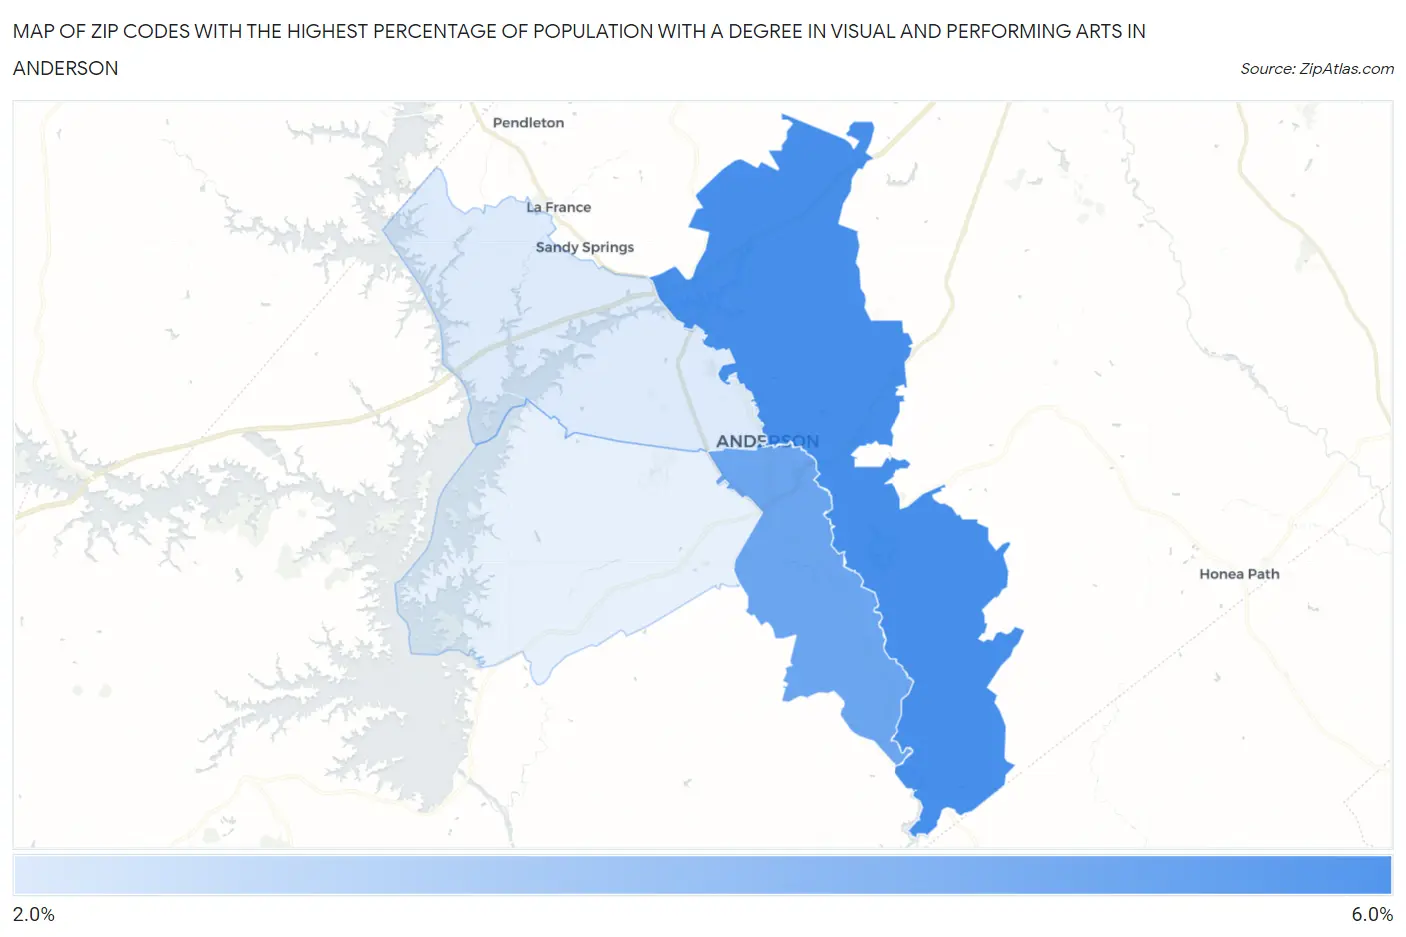
Zip Codes with the Highest Percentage of Population with a Degree in Visual and Performing Arts in Anderson, SC
| Zip Code | % Graduates | vs State | vs National | |
| 1. | 29621 | 5.9% | 3.3%(+2.68)#39 | 4.3%(+1.69)#4,942 |
| 2. | 29624 | 5.0% | 3.3%(+1.69)#61 | 4.3%(+0.698)#6,766 |
| 3. | 29625 | 2.0% | 3.3%(-1.22)#199 | 4.3%(-2.21)#16,283 |
1
Common Questions
What are the Top 3 Zip Codes with the Highest Percentage of Population with a Degree in Visual and Performing Arts in Anderson, SC?
Top 3 Zip Codes with the Highest Percentage of Population with a Degree in Visual and Performing Arts in Anderson, SC are:
What zip code has the Highest Percentage of Population with a Degree in Visual and Performing Arts in Anderson, SC?
29621 has the Highest Percentage of Population with a Degree in Visual and Performing Arts in Anderson, SC with 5.9%.
What is the Percentage of Population with a Degree in Visual and Performing Arts in Anderson, SC?
Percentage of Population with a Degree in Visual and Performing Arts in Anderson is 3.5%.
What is the Percentage of Population with a Degree in Visual and Performing Arts in South Carolina?
Percentage of Population with a Degree in Visual and Performing Arts in South Carolina is 3.3%.
What is the Percentage of Population with a Degree in Visual and Performing Arts in the United States?
Percentage of Population with a Degree in Visual and Performing Arts in the United States is 4.3%.