Zip Codes with the Highest Percentage of Population with a Degree in Visual and Performing Arts in Florence, SC
RELATED REPORTS & OPTIONS
Visual and Performing Arts
Florence
Compare Zip Codes
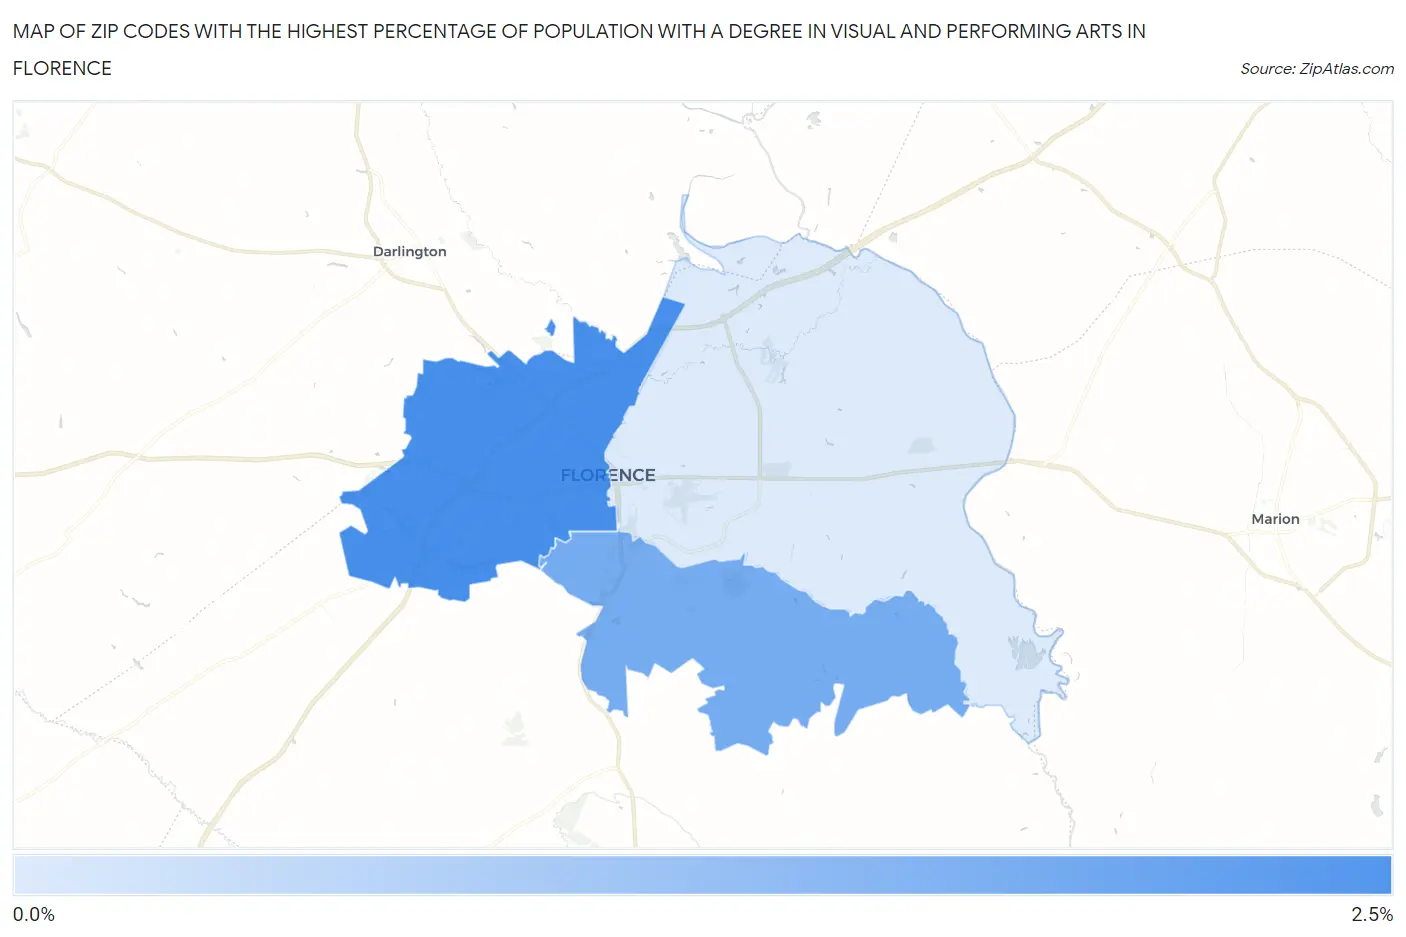
Map of Zip Codes with the Highest Percentage of Population with a Degree in Visual and Performing Arts in Florence
0.0%
2.5%
Zip Codes with the Highest Percentage of Population with a Degree in Visual and Performing Arts in Florence, SC
| Zip Code | % Graduates | vs State | vs National | |
| 1. | 29501 | 2.4% | 3.3%(-0.862)#176 | 4.3%(-1.85)#14,995 |
| 2. | 29505 | 1.8% | 3.3%(-1.50)#213 | 4.3%(-2.48)#17,254 |
| 3. | 29506 | 0.32% | 3.3%(-2.94)#272 | 4.3%(-3.93)#21,053 |
1
Common Questions
What are the Top Zip Codes with the Highest Percentage of Population with a Degree in Visual and Performing Arts in Florence, SC?
Top Zip Codes with the Highest Percentage of Population with a Degree in Visual and Performing Arts in Florence, SC are:
What zip code has the Highest Percentage of Population with a Degree in Visual and Performing Arts in Florence, SC?
29501 has the Highest Percentage of Population with a Degree in Visual and Performing Arts in Florence, SC with 2.4%.
What is the Percentage of Population with a Degree in Visual and Performing Arts in Florence, SC?
Percentage of Population with a Degree in Visual and Performing Arts in Florence is 1.8%.
What is the Percentage of Population with a Degree in Visual and Performing Arts in South Carolina?
Percentage of Population with a Degree in Visual and Performing Arts in South Carolina is 3.3%.
What is the Percentage of Population with a Degree in Visual and Performing Arts in the United States?
Percentage of Population with a Degree in Visual and Performing Arts in the United States is 4.3%.