Zip Codes with the Highest Percentage of Population Employed in Security & Protection in Mount Pleasant, SC
RELATED REPORTS & OPTIONS
Security & Protection
Mount Pleasant
Compare Zip Codes
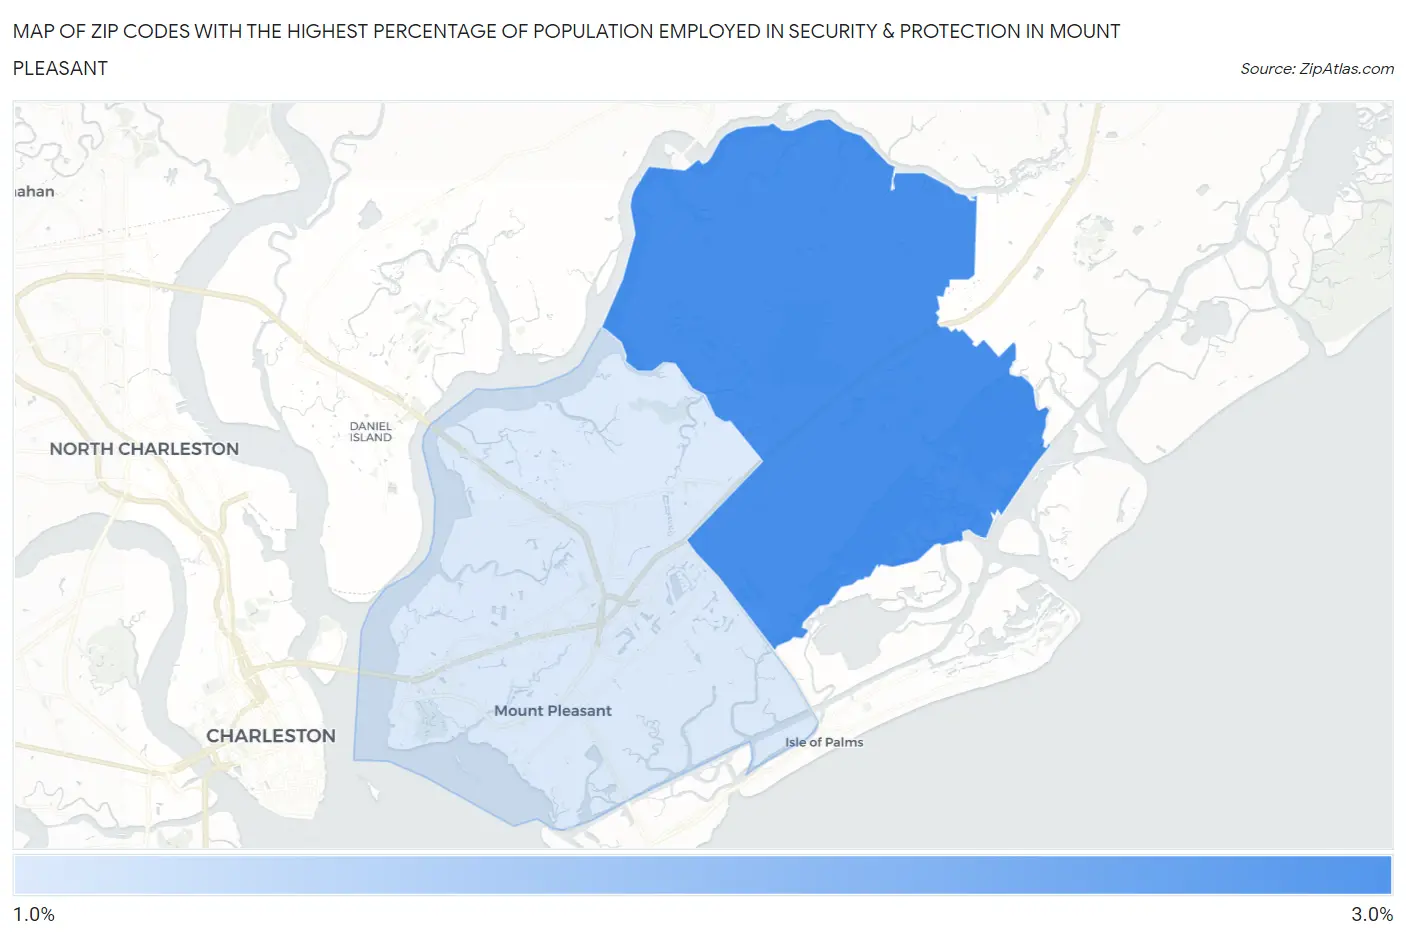
Map of Zip Codes with the Highest Percentage of Population Employed in Security & Protection in Mount Pleasant
0.0%
3.0%
Zip Codes with the Highest Percentage of Population Employed in Security & Protection in Mount Pleasant, SC
| Zip Code | % Employed | vs State | vs National | |
| 1. | 29466 | 2.7% | 2.1%(+0.645)#126 | 2.1%(+0.597)#8,330 |
| 2. | 29464 | 1.5% | 2.1%(-0.594)#230 | 2.1%(-0.643)#16,148 |
1
Common Questions
What are the Top Zip Codes with the Highest Percentage of Population Employed in Security & Protection in Mount Pleasant, SC?
Top Zip Codes with the Highest Percentage of Population Employed in Security & Protection in Mount Pleasant, SC are:
What zip code has the Highest Percentage of Population Employed in Security & Protection in Mount Pleasant, SC?
29466 has the Highest Percentage of Population Employed in Security & Protection in Mount Pleasant, SC with 2.7%.
What is the Percentage of Population Employed in Security & Protection in Mount Pleasant, SC?
Percentage of Population Employed in Security & Protection in Mount Pleasant is 2.1%.
What is the Percentage of Population Employed in Security & Protection in South Carolina?
Percentage of Population Employed in Security & Protection in South Carolina is 2.1%.
What is the Percentage of Population Employed in Security & Protection in the United States?
Percentage of Population Employed in Security & Protection in the United States is 2.1%.