San Felipe Pueblo, NM
San Felipe Pueblo Map
San Felipe Pueblo Overview
1,430
TOTAL POPULATION
763
MALE POPULATION
667
FEMALE POPULATION
114.39
MALES / 100 FEMALES
87.42
FEMALES / 100 MALES
33.0
MEDIAN AGE
5.6
AVG FAMILY SIZE
4.3
AVG HOUSEHOLD SIZE
$14,125
PER CAPITA INCOME
$39,803
AVG FAMILY INCOME
$33,000
AVG HOUSEHOLD INCOME
1.0%
WAGE / INCOME GAP [ % ]
99.0¢/ $1
WAGE / INCOME GAP [ $ ]
0.54
INEQUALITY / GINI INDEX
613
LABOR FORCE [ PEOPLE ]
53.2%
PERCENT IN LABOR FORCE
24.0%
UNEMPLOYMENT RATE
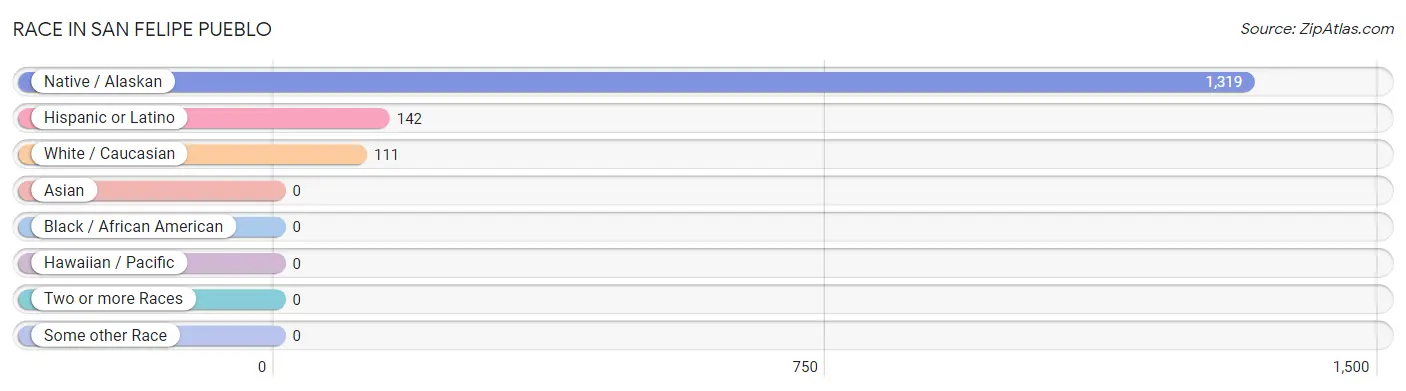
Race in San Felipe Pueblo
The most populous races in San Felipe Pueblo are Native / Alaskan (1,319 | 92.2%), Hispanic or Latino (142 | 9.9%), and White / Caucasian (111 | 7.8%).
| Race | # Population | % Population |
| Asian | 0 | 0.0% |
| Black / African American | 0 | 0.0% |
| Hawaiian / Pacific | 0 | 0.0% |
| Hispanic or Latino | 142 | 9.9% |
| Native / Alaskan | 1,319 | 92.2% |
| White / Caucasian | 111 | 7.8% |
| Two or more Races | 0 | 0.0% |
| Some other Race | 0 | 0.0% |
| Total | 1,430 | 100.0% |
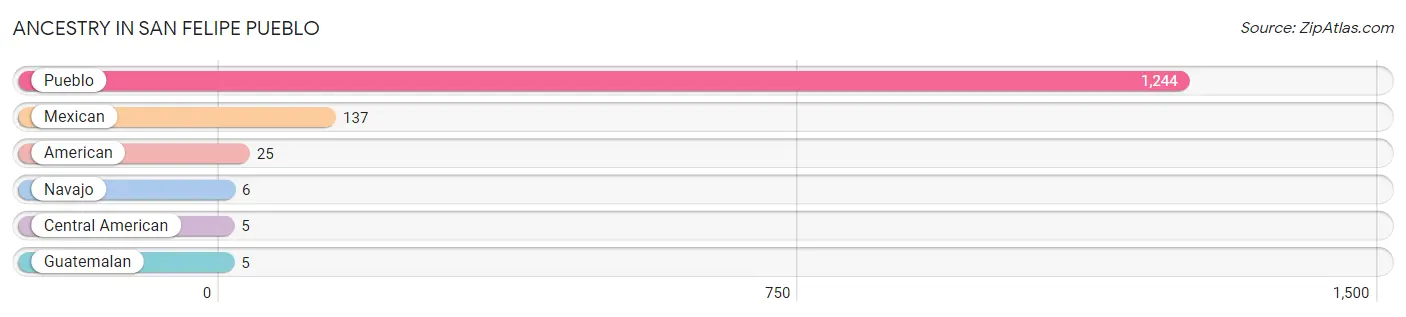
Ancestry in San Felipe Pueblo
The most populous ancestries reported in San Felipe Pueblo are Pueblo (1,244 | 87.0%), Mexican (137 | 9.6%), American (25 | 1.8%), Navajo (6 | 0.4%), and Central American (5 | 0.4%), together accounting for 99.1% of all San Felipe Pueblo residents.
| Ancestry | # Population | % Population |
| American | 25 | 1.8% |
| Central American | 5 | 0.4% |
| Guatemalan | 5 | 0.4% |
| Mexican | 137 | 9.6% |
| Navajo | 6 | 0.4% |
| Pueblo | 1,244 | 87.0% | View All 6 Rows |
Immigrants in San Felipe Pueblo

| Immigration Origin | # Population | % Population | View All 0 Rows |
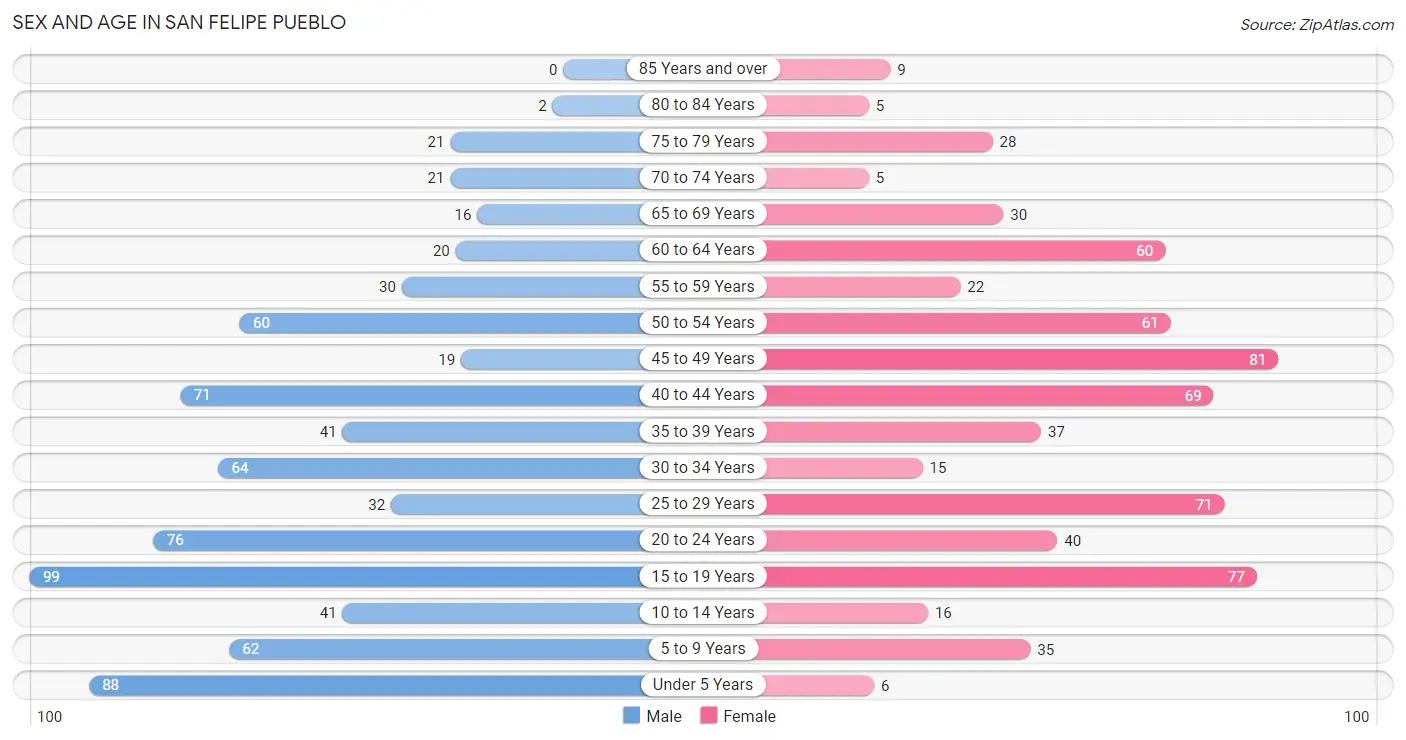
Sex and Age in San Felipe Pueblo
Sex and Age in San Felipe Pueblo
The most populous age groups in San Felipe Pueblo are 15 to 19 Years (99 | 13.0%) for men and 45 to 49 Years (81 | 12.1%) for women.
| Age Bracket | Male | Female |
| Under 5 Years | 88 (11.5%) | 6 (0.9%) |
| 5 to 9 Years | 62 (8.1%) | 35 (5.2%) |
| 10 to 14 Years | 41 (5.4%) | 16 (2.4%) |
| 15 to 19 Years | 99 (13.0%) | 77 (11.5%) |
| 20 to 24 Years | 76 (10.0%) | 40 (6.0%) |
| 25 to 29 Years | 32 (4.2%) | 71 (10.6%) |
| 30 to 34 Years | 64 (8.4%) | 15 (2.2%) |
| 35 to 39 Years | 41 (5.4%) | 37 (5.6%) |
| 40 to 44 Years | 71 (9.3%) | 69 (10.3%) |
| 45 to 49 Years | 19 (2.5%) | 81 (12.1%) |
| 50 to 54 Years | 60 (7.9%) | 61 (9.1%) |
| 55 to 59 Years | 30 (3.9%) | 22 (3.3%) |
| 60 to 64 Years | 20 (2.6%) | 60 (9.0%) |
| 65 to 69 Years | 16 (2.1%) | 30 (4.5%) |
| 70 to 74 Years | 21 (2.8%) | 5 (0.7%) |
| 75 to 79 Years | 21 (2.8%) | 28 (4.2%) |
| 80 to 84 Years | 2 (0.3%) | 5 (0.7%) |
| 85 Years and over | 0 (0.0%) | 9 (1.3%) |
| Total | 763 (100.0%) | 667 (100.0%) |
Families and Households in San Felipe Pueblo
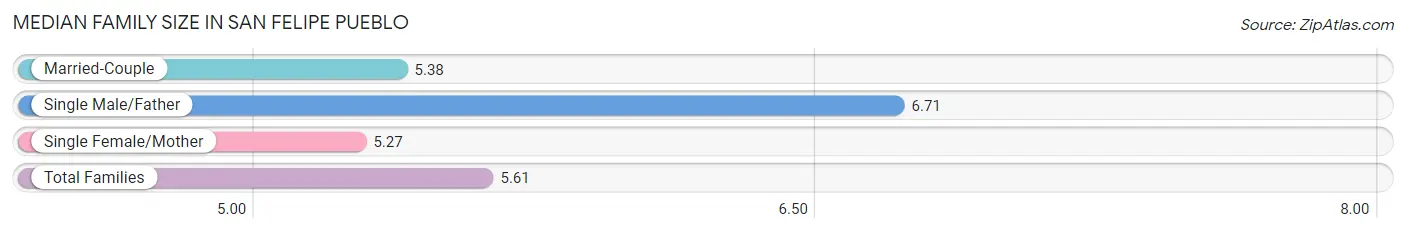
Median Family Size in San Felipe Pueblo
The median family size in San Felipe Pueblo is 5.61 persons per family, with single male/father families (45 | 20.2%) accounting for the largest median family size of 6.71 persons per family. On the other hand, single female/mother families (77 | 34.5%) represent the smallest median family size with 5.27 persons per family.
| Family Type | # Families | Family Size |
| Married-Couple | 101 (45.3%) | 5.38 |
| Single Male/Father | 45 (20.2%) | 6.71 |
| Single Female/Mother | 77 (34.5%) | 5.27 |
| Total Families | 223 (100.0%) | 5.61 |
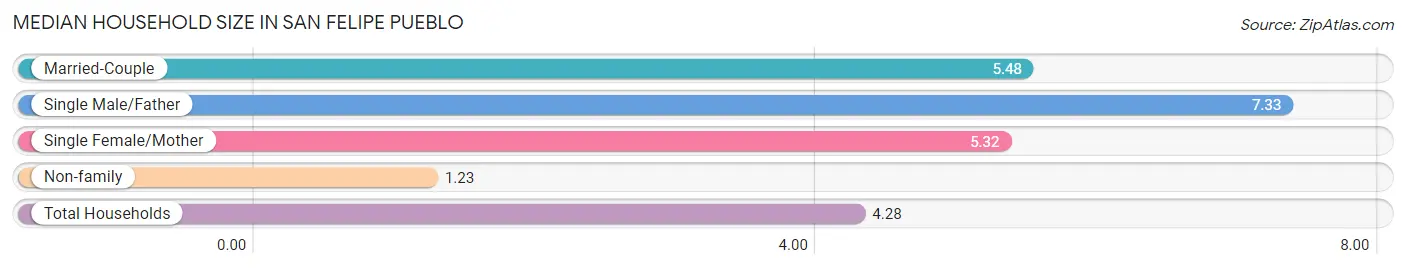
Median Household Size in San Felipe Pueblo
The median household size in San Felipe Pueblo is 4.28 persons per household, with single male/father households (45 | 13.5%) accounting for the largest median household size of 7.33 persons per household. non-family households (111 | 33.2%) represent the smallest median household size with 1.23 persons per household.
| Household Type | # Households | Household Size |
| Married-Couple | 101 (30.2%) | 5.48 |
| Single Male/Father | 45 (13.5%) | 7.33 |
| Single Female/Mother | 77 (23.1%) | 5.32 |
| Non-family | 111 (33.2%) | 1.23 |
| Total Households | 334 (100.0%) | 4.28 |
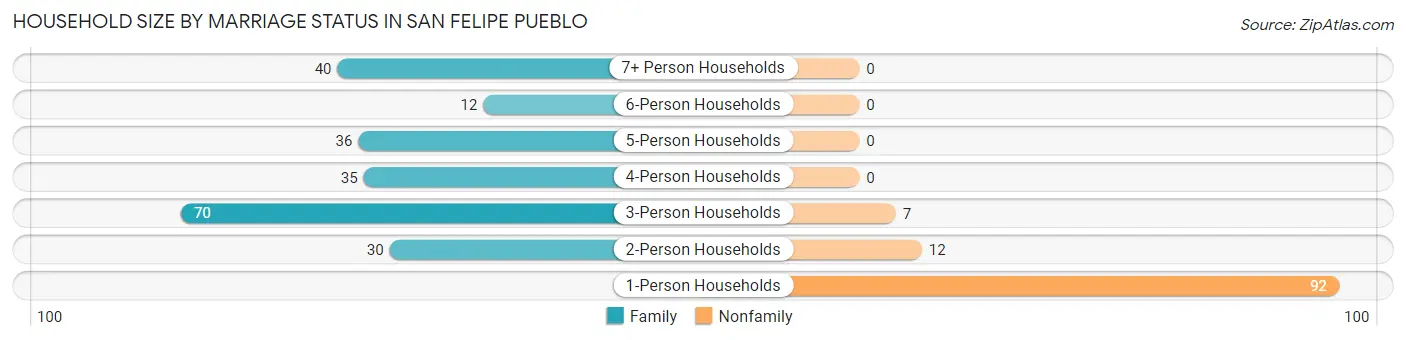
Household Size by Marriage Status in San Felipe Pueblo
Out of a total of 334 households in San Felipe Pueblo, 223 (66.8%) are family households, while 111 (33.2%) are nonfamily households. The most numerous type of family households are 3-person households, comprising 70, and the most common type of nonfamily households are 1-person households, comprising 92.
| Household Size | Family Households | Nonfamily Households |
| 1-Person Households | - | 92 (27.5%) |
| 2-Person Households | 30 (9.0%) | 12 (3.6%) |
| 3-Person Households | 70 (21.0%) | 7 (2.1%) |
| 4-Person Households | 35 (10.5%) | 0 (0.0%) |
| 5-Person Households | 36 (10.8%) | 0 (0.0%) |
| 6-Person Households | 12 (3.6%) | 0 (0.0%) |
| 7+ Person Households | 40 (12.0%) | 0 (0.0%) |
| Total | 223 (66.8%) | 111 (33.2%) |
Female Fertility in San Felipe Pueblo
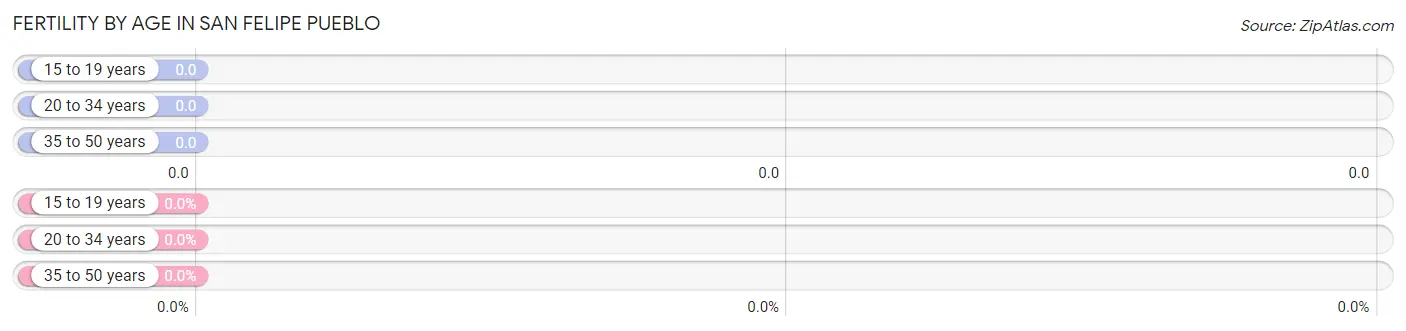
Fertility by Age in San Felipe Pueblo
| Age Bracket | Women with Births | Births / 1,000 Women |
| 15 to 19 years | 0 (0.0%) | 0.0 |
| 20 to 34 years | 0 (0.0%) | 0.0 |
| 35 to 50 years | 0 (0.0%) | 0.0 |
| Total | 0 (0.0%) | 0.0 |
Fertility by Age by Marriage Status in San Felipe Pueblo
| Age Bracket | Married | Unmarried |
| 15 to 19 years | 0 (0.0%) | 0 (0.0%) |
| 20 to 34 years | 0 (0.0%) | 0 (0.0%) |
| 35 to 50 years | 0 (0.0%) | 0 (0.0%) |
| Total | 0 (0.0%) | 0 (0.0%) |
Fertility by Education in San Felipe Pueblo
| Educational Attainment | Women with Births | Births / 1,000 Women |
| Less than High School | 0 (0.0%) | 0.0 |
| High School Diploma | 0 (0.0%) | 0.0 |
| College or Associate's Degree | 0 (0.0%) | 0.0 |
| Bachelor's Degree | 0 (0.0%) | 0.0 |
| Graduate Degree | 0 (0.0%) | 0.0 |
| Total | 0 (0.0%) | 0.0 |
Fertility by Education by Marriage Status in San Felipe Pueblo
| Educational Attainment | Married | Unmarried |
| Less than High School | 0 (0.0%) | 0 (0.0%) |
| High School Diploma | 0 (0.0%) | 0 (0.0%) |
| College or Associate's Degree | 0 (0.0%) | 0 (0.0%) |
| Bachelor's Degree | 0 (0.0%) | 0 (0.0%) |
| Graduate Degree | 0 (0.0%) | 0 (0.0%) |
| Total | 0 (0.0%) | 0 (0.0%) |
Income in San Felipe Pueblo
Income Overview in San Felipe Pueblo
Per Capita Income in San Felipe Pueblo is $14,125, while median incomes of families and households are $39,803 and $33,000 respectively.
| Characteristic | Number | Measure |
| Per Capita Income | 1,430 | $14,125 |
| Median Family Income | 223 | $39,803 |
| Mean Family Income | 223 | $66,677 |
| Median Household Income | 334 | $33,000 |
| Mean Household Income | 334 | $53,191 |
| Income Deficit | 223 | $0 |
| Wage / Income Gap (%) | 1,430 | 0.97% |
| Wage / Income Gap ($) | 1,430 | 99.03¢ per $1 |
| Gini / Inequality Index | 1,430 | 0.54 |
Earnings by Sex in San Felipe Pueblo
Average Earnings in San Felipe Pueblo are $22,684, $22,500 for men and $22,721 for women, a difference of 1.0%.
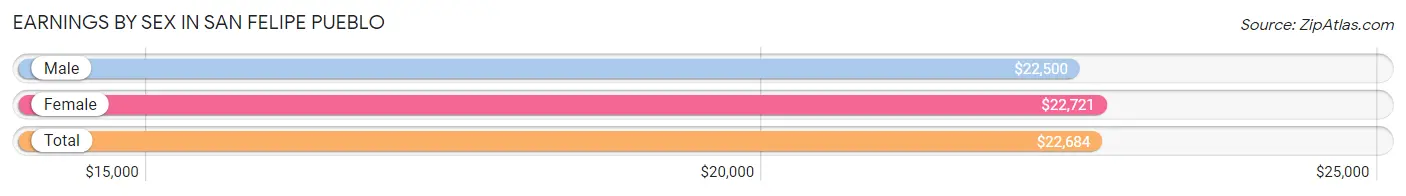
| Sex | Number | Average Earnings |
| Male | 246 (44.0%) | $22,500 |
| Female | 313 (56.0%) | $22,721 |
| Total | 559 (100.0%) | $22,684 |
Earnings by Sex by Income Bracket in San Felipe Pueblo
The most common earnings brackets in San Felipe Pueblo are $2,499 or less for men (32 | 13.0%) and $22,500 to $24,999 for women (51 | 16.3%).
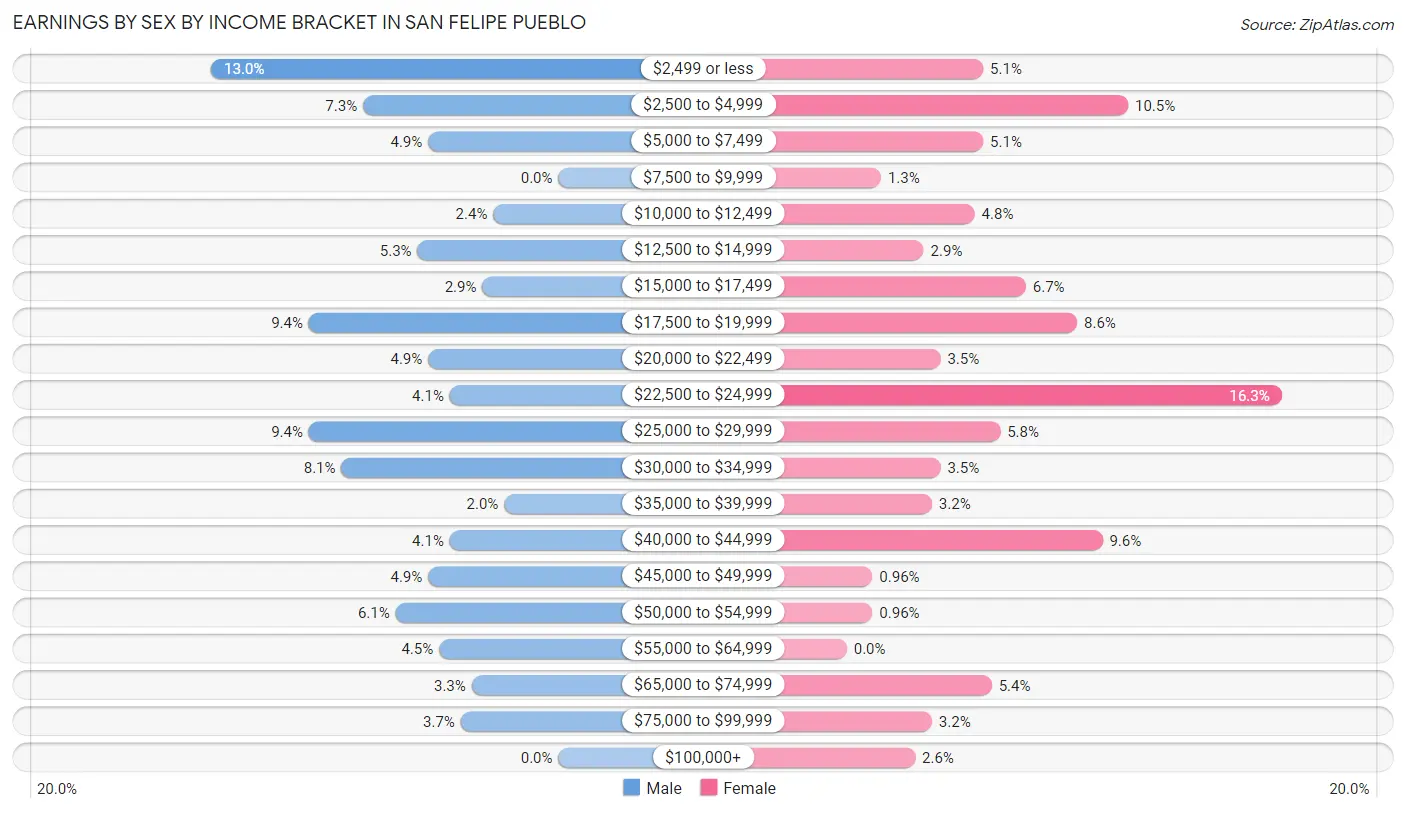
| Income | Male | Female |
| $2,499 or less | 32 (13.0%) | 16 (5.1%) |
| $2,500 to $4,999 | 18 (7.3%) | 33 (10.5%) |
| $5,000 to $7,499 | 12 (4.9%) | 16 (5.1%) |
| $7,500 to $9,999 | 0 (0.0%) | 4 (1.3%) |
| $10,000 to $12,499 | 6 (2.4%) | 15 (4.8%) |
| $12,500 to $14,999 | 13 (5.3%) | 9 (2.9%) |
| $15,000 to $17,499 | 7 (2.9%) | 21 (6.7%) |
| $17,500 to $19,999 | 23 (9.3%) | 27 (8.6%) |
| $20,000 to $22,499 | 12 (4.9%) | 11 (3.5%) |
| $22,500 to $24,999 | 10 (4.1%) | 51 (16.3%) |
| $25,000 to $29,999 | 23 (9.3%) | 18 (5.8%) |
| $30,000 to $34,999 | 20 (8.1%) | 11 (3.5%) |
| $35,000 to $39,999 | 5 (2.0%) | 10 (3.2%) |
| $40,000 to $44,999 | 10 (4.1%) | 30 (9.6%) |
| $45,000 to $49,999 | 12 (4.9%) | 3 (1.0%) |
| $50,000 to $54,999 | 15 (6.1%) | 3 (1.0%) |
| $55,000 to $64,999 | 11 (4.5%) | 0 (0.0%) |
| $65,000 to $74,999 | 8 (3.3%) | 17 (5.4%) |
| $75,000 to $99,999 | 9 (3.7%) | 10 (3.2%) |
| $100,000+ | 0 (0.0%) | 8 (2.6%) |
| Total | 246 (100.0%) | 313 (100.0%) |
Earnings by Sex by Educational Attainment in San Felipe Pueblo
Average earnings in San Felipe Pueblo are $24,500 for men and $23,375 for women, a difference of 4.6%. Men with an educational attainment of college or associate's degree enjoy the highest average annual earnings of $28,854, while those with less than high school education earn the least with $17,875. Women with an educational attainment of college or associate's degree earn the most with the average annual earnings of $23,421, while those with high school diploma education have the smallest earnings of $22,875.
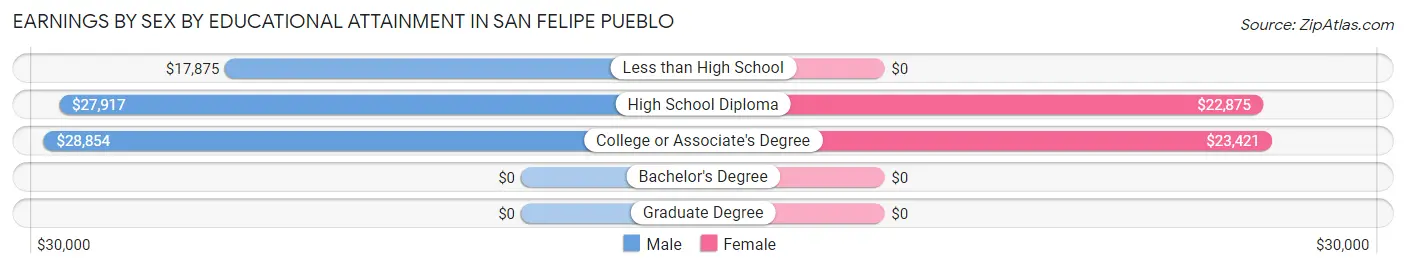
| Educational Attainment | Male Income | Female Income |
| Less than High School | $17,875 | $0 |
| High School Diploma | $27,917 | $22,875 |
| College or Associate's Degree | $28,854 | $23,421 |
| Bachelor's Degree | - | - |
| Graduate Degree | - | - |
| Total | $24,500 | $23,375 |
Family Income in San Felipe Pueblo
Family Income Brackets in San Felipe Pueblo
According to the San Felipe Pueblo family income data, there are 39 families falling into the less than $10,000 income range, which is the most common income bracket and makes up 17.5% of all families. Conversely, the $25,000 to $34,999 income bracket is the least frequent group with only 5 families (2.2%) belonging to this category.
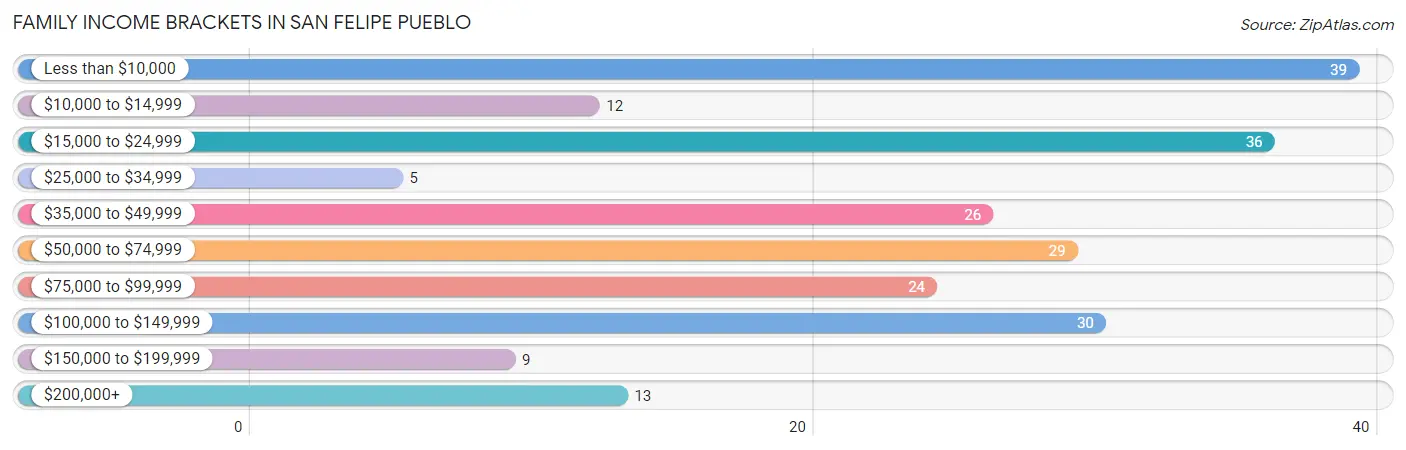
| Income Bracket | # Families | % Families |
| Less than $10,000 | 39 | 17.5% |
| $10,000 to $14,999 | 12 | 5.4% |
| $15,000 to $24,999 | 36 | 16.1% |
| $25,000 to $34,999 | 5 | 2.2% |
| $35,000 to $49,999 | 26 | 11.7% |
| $50,000 to $74,999 | 29 | 13.0% |
| $75,000 to $99,999 | 24 | 10.8% |
| $100,000 to $149,999 | 30 | 13.5% |
| $150,000 to $199,999 | 9 | 4.0% |
| $200,000+ | 13 | 5.8% |
Family Income by Famaliy Size in San Felipe Pueblo
7+ person families (33 | 14.8%) account for the highest median family income in San Felipe Pueblo with $198,542 per family, while 7+ person families (33 | 14.8%) have the highest median income of $28,363 per family member.
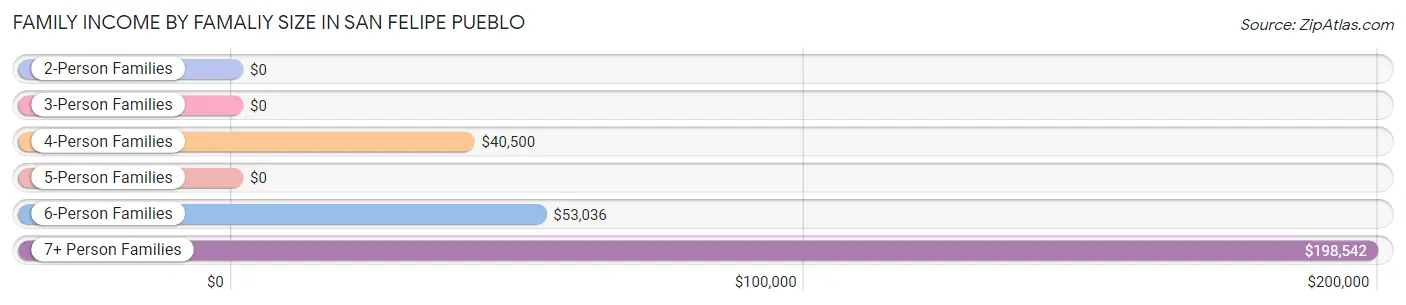
| Income Bracket | # Families | Median Income |
| 2-Person Families | 46 (20.6%) | $0 |
| 3-Person Families | 54 (24.2%) | $0 |
| 4-Person Families | 36 (16.1%) | $40,500 |
| 5-Person Families | 35 (15.7%) | $0 |
| 6-Person Families | 19 (8.5%) | $53,036 |
| 7+ Person Families | 33 (14.8%) | $198,542 |
| Total | 223 (100.0%) | $39,803 |
Family Income by Number of Earners in San Felipe Pueblo
The median family income in San Felipe Pueblo is $39,803, with families comprising 3+ earners (35) having the highest median family income of $132,875, while families with no earners (57) have the lowest median family income of $7,350, accounting for 15.7% and 25.6% of families, respectively.
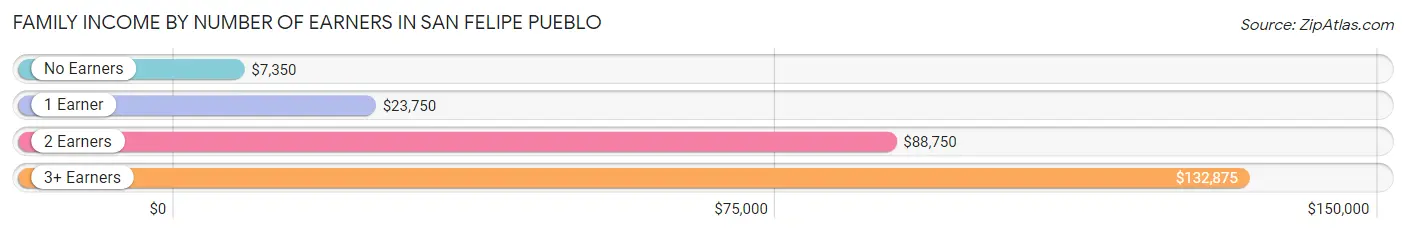
| Number of Earners | # Families | Median Income |
| No Earners | 57 (25.6%) | $7,350 |
| 1 Earner | 43 (19.3%) | $23,750 |
| 2 Earners | 88 (39.5%) | $88,750 |
| 3+ Earners | 35 (15.7%) | $132,875 |
| Total | 223 (100.0%) | $39,803 |
Household Income in San Felipe Pueblo
Household Income Brackets in San Felipe Pueblo
With 77 households falling in the category, the less than $10,000 income range is the most frequent in San Felipe Pueblo, accounting for 23.1% of all households. In contrast, only 9 households (2.7%) fall into the $150,000 to $199,999 income bracket, making it the least populous group.
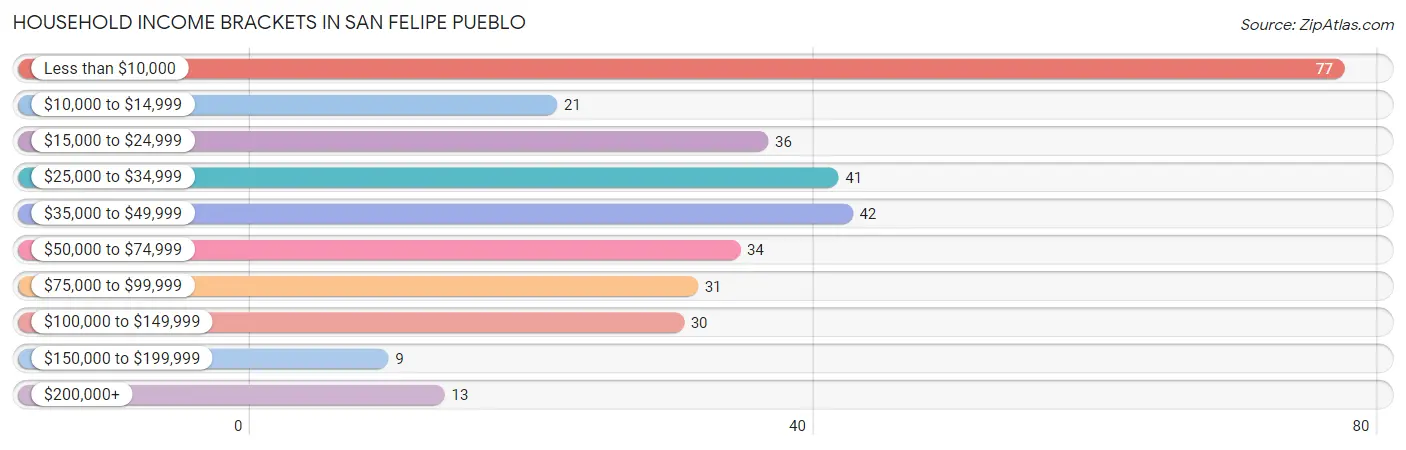
| Income Bracket | # Households | % Households |
| Less than $10,000 | 77 | 23.1% |
| $10,000 to $14,999 | 21 | 6.3% |
| $15,000 to $24,999 | 36 | 10.8% |
| $25,000 to $34,999 | 41 | 12.3% |
| $35,000 to $49,999 | 42 | 12.6% |
| $50,000 to $74,999 | 34 | 10.2% |
| $75,000 to $99,999 | 31 | 9.3% |
| $100,000 to $149,999 | 30 | 9.0% |
| $150,000 to $199,999 | 9 | 2.7% |
| $200,000+ | 13 | 3.9% |
Household Income by Householder Age in San Felipe Pueblo
The median household income in San Felipe Pueblo is $33,000, with the highest median household income of $39,417 found in the 45 to 64 years age bracket for the primary householder. A total of 161 households (48.2%) fall into this category. Meanwhile, the 15 to 24 years age bracket for the primary householder has the lowest median household income of $0, with 13 households (3.9%) in this group.
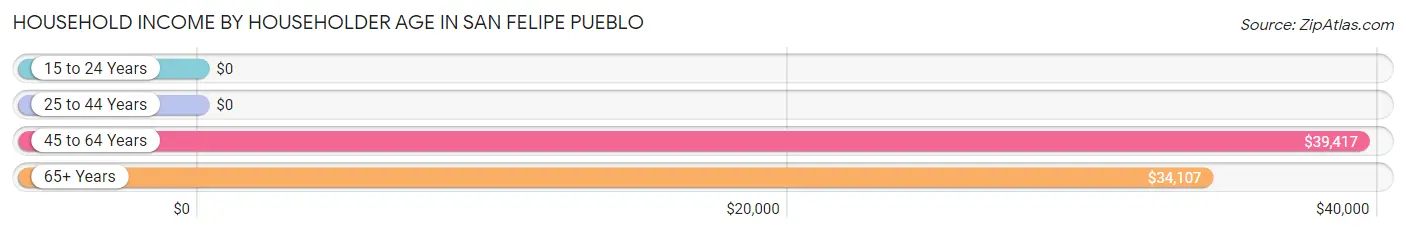
| Income Bracket | # Households | Median Income |
| 15 to 24 Years | 13 (3.9%) | $0 |
| 25 to 44 Years | 65 (19.5%) | $0 |
| 45 to 64 Years | 161 (48.2%) | $39,417 |
| 65+ Years | 95 (28.4%) | $34,107 |
| Total | 334 (100.0%) | $33,000 |
Poverty in San Felipe Pueblo
Income Below Poverty by Sex and Age in San Felipe Pueblo
With 34.0% poverty level for males and 30.3% for females among the residents of San Felipe Pueblo, 65 to 74 year old males and under 5 year old females are the most vulnerable to poverty, with 23 males (62.2%) and 6 females (100.0%) in their respective age groups living below the poverty level.
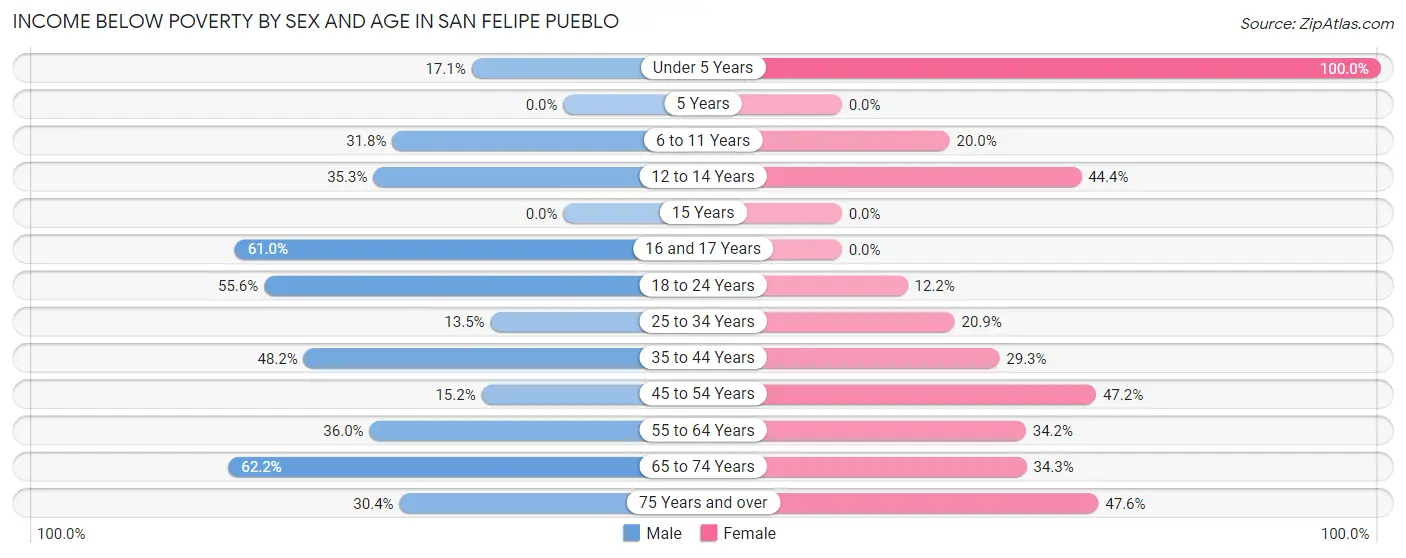
| Age Bracket | Male | Female |
| Under 5 Years | 15 (17.1%) | 6 (100.0%) |
| 5 Years | 0 (0.0%) | 0 (0.0%) |
| 6 to 11 Years | 20 (31.8%) | 5 (20.0%) |
| 12 to 14 Years | 6 (35.3%) | 4 (44.4%) |
| 15 Years | 0 (0.0%) | 0 (0.0%) |
| 16 and 17 Years | 25 (61.0%) | 0 (0.0%) |
| 18 to 24 Years | 65 (55.6%) | 11 (12.2%) |
| 25 to 34 Years | 13 (13.5%) | 18 (20.9%) |
| 35 to 44 Years | 54 (48.2%) | 31 (29.2%) |
| 45 to 54 Years | 12 (15.2%) | 67 (47.2%) |
| 55 to 64 Years | 18 (36.0%) | 28 (34.2%) |
| 65 to 74 Years | 23 (62.2%) | 12 (34.3%) |
| 75 Years and over | 7 (30.4%) | 20 (47.6%) |
| Total | 258 (34.0%) | 202 (30.3%) |
Income Above Poverty by Sex and Age in San Felipe Pueblo
According to the poverty statistics in San Felipe Pueblo, males aged 5 years and females aged 5 years are the age groups that are most secure financially, with 100.0% of males and 100.0% of females in these age groups living above the poverty line.
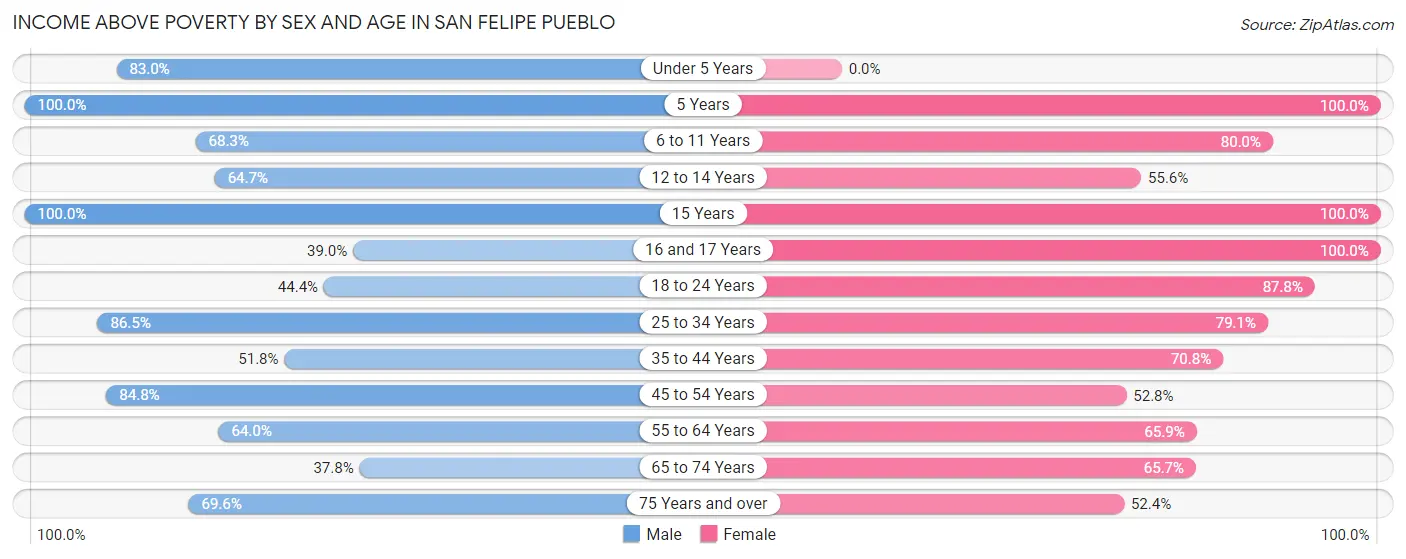
| Age Bracket | Male | Female |
| Under 5 Years | 73 (83.0%) | 0 (0.0%) |
| 5 Years | 18 (100.0%) | 17 (100.0%) |
| 6 to 11 Years | 43 (68.2%) | 20 (80.0%) |
| 12 to 14 Years | 11 (64.7%) | 5 (55.6%) |
| 15 Years | 17 (100.0%) | 12 (100.0%) |
| 16 and 17 Years | 16 (39.0%) | 15 (100.0%) |
| 18 to 24 Years | 52 (44.4%) | 79 (87.8%) |
| 25 to 34 Years | 83 (86.5%) | 68 (79.1%) |
| 35 to 44 Years | 58 (51.8%) | 75 (70.8%) |
| 45 to 54 Years | 67 (84.8%) | 75 (52.8%) |
| 55 to 64 Years | 32 (64.0%) | 54 (65.8%) |
| 65 to 74 Years | 14 (37.8%) | 23 (65.7%) |
| 75 Years and over | 16 (69.6%) | 22 (52.4%) |
| Total | 500 (66.0%) | 465 (69.7%) |
Income Below Poverty Among Married-Couple Families in San Felipe Pueblo
The poverty statistics for married-couple families in San Felipe Pueblo show that 39.6% or 40 of the total 101 families live below the poverty line. Families with no children have the highest poverty rate of 72.4%, comprising of 21 families. On the other hand, families with 3 or 4 children have the lowest poverty rate of 25.0%, which includes 5 families.
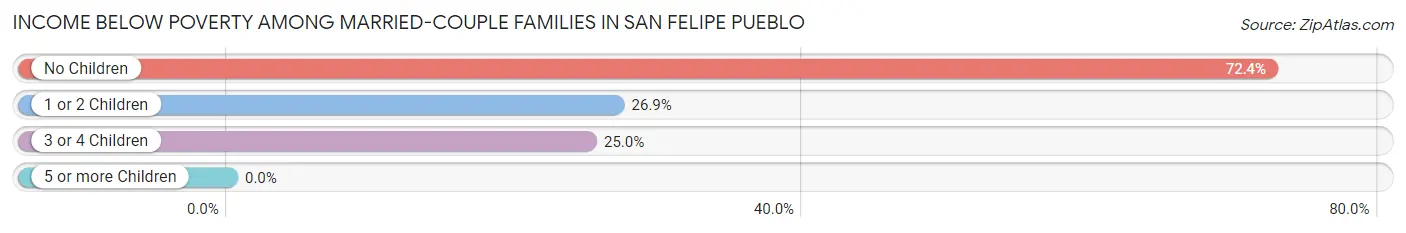
| Children | Above Poverty | Below Poverty |
| No Children | 8 (27.6%) | 21 (72.4%) |
| 1 or 2 Children | 38 (73.1%) | 14 (26.9%) |
| 3 or 4 Children | 15 (75.0%) | 5 (25.0%) |
| 5 or more Children | 0 (0.0%) | 0 (0.0%) |
| Total | 61 (60.4%) | 40 (39.6%) |
Income Below Poverty Among Single-Parent Households in San Felipe Pueblo
According to the poverty data in San Felipe Pueblo, 20.0% or 9 single-father households and 50.6% or 39 single-mother households are living below the poverty line. Among single-father households, those with 1 or 2 children have the highest poverty rate, with 9 households (100.0%) experiencing poverty. Likewise, among single-mother households, those with no children have the highest poverty rate, with 25 households (78.1%) falling below the poverty line.
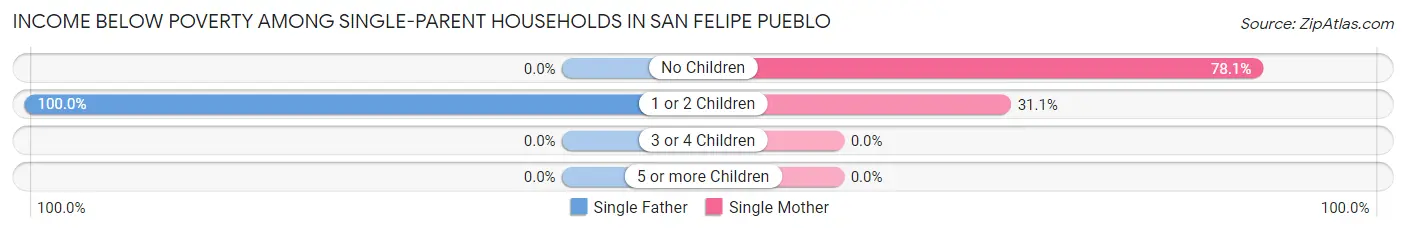
| Children | Single Father | Single Mother |
| No Children | 0 (0.0%) | 25 (78.1%) |
| 1 or 2 Children | 9 (100.0%) | 14 (31.1%) |
| 3 or 4 Children | 0 (0.0%) | 0 (0.0%) |
| 5 or more Children | 0 (0.0%) | 0 (0.0%) |
| Total | 9 (20.0%) | 39 (50.6%) |
Income Below Poverty Among Married-Couple vs Single-Parent Households in San Felipe Pueblo
The poverty data for San Felipe Pueblo shows that 40 of the married-couple family households (39.6%) and 48 of the single-parent households (39.3%) are living below the poverty level. Within the married-couple family households, those with no children have the highest poverty rate, with 21 households (72.4%) falling below the poverty line. Among the single-parent households, those with 1 or 2 children have the highest poverty rate, with 23 household (42.6%) living below poverty.
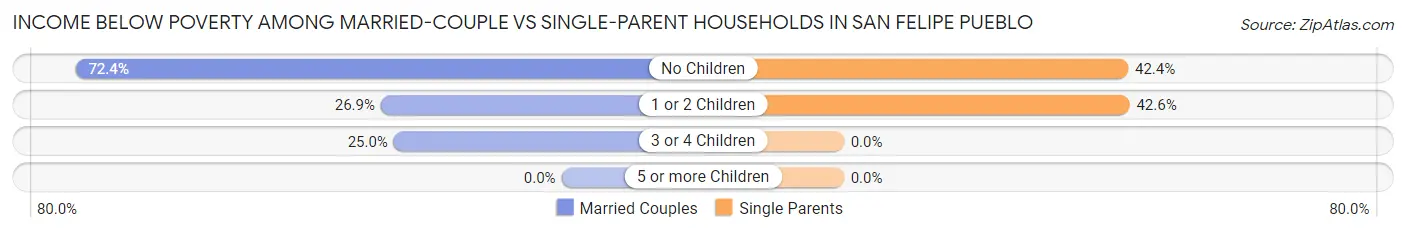
| Children | Married-Couple Families | Single-Parent Households |
| No Children | 21 (72.4%) | 25 (42.4%) |
| 1 or 2 Children | 14 (26.9%) | 23 (42.6%) |
| 3 or 4 Children | 5 (25.0%) | 0 (0.0%) |
| 5 or more Children | 0 (0.0%) | 0 (0.0%) |
| Total | 40 (39.6%) | 48 (39.3%) |
Employment Characteristics in San Felipe Pueblo
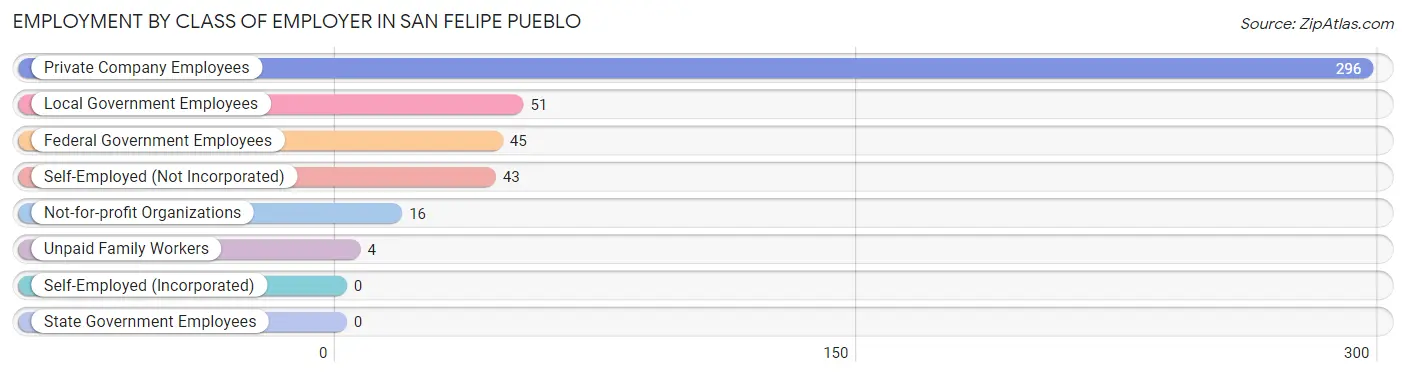
Employment by Class of Employer in San Felipe Pueblo
Among the 455 employed individuals in San Felipe Pueblo, private company employees (296 | 65.0%), local government employees (51 | 11.2%), and federal government employees (45 | 9.9%) make up the most common classes of employment.
| Employer Class | # Employees | % Employees |
| Private Company Employees | 296 | 65.0% |
| Self-Employed (Incorporated) | 0 | 0.0% |
| Self-Employed (Not Incorporated) | 43 | 9.5% |
| Not-for-profit Organizations | 16 | 3.5% |
| Local Government Employees | 51 | 11.2% |
| State Government Employees | 0 | 0.0% |
| Federal Government Employees | 45 | 9.9% |
| Unpaid Family Workers | 4 | 0.9% |
| Total | 455 | 100.0% |
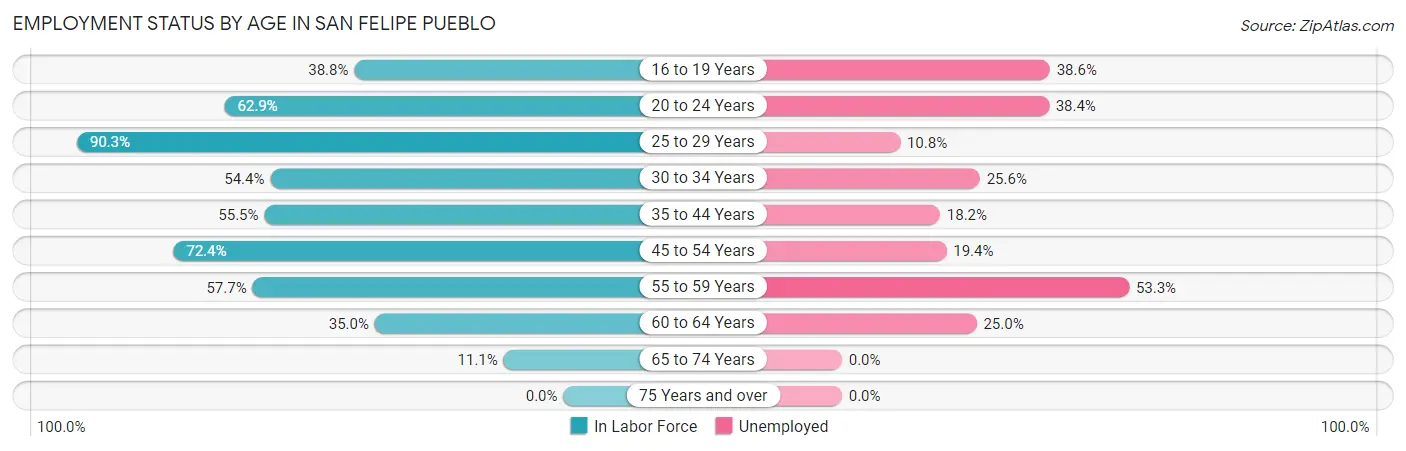
Employment Status by Age in San Felipe Pueblo
According to the labor force statistics for San Felipe Pueblo, out of the total population over 16 years of age (1,153), 53.2% or 613 individuals are in the labor force, with 24.0% or 147 of them unemployed. The age group with the highest labor force participation rate is 25 to 29 years, with 90.3% or 93 individuals in the labor force. Within the labor force, the 55 to 59 years age range has the highest percentage of unemployed individuals, with 53.3% or 16 of them being unemployed.
| Age Bracket | In Labor Force | Unemployed |
| 16 to 19 Years | 57 (38.8%) | 22 (38.6%) |
| 20 to 24 Years | 73 (62.9%) | 28 (38.4%) |
| 25 to 29 Years | 93 (90.3%) | 10 (10.8%) |
| 30 to 34 Years | 43 (54.4%) | 11 (25.6%) |
| 35 to 44 Years | 121 (55.5%) | 22 (18.2%) |
| 45 to 54 Years | 160 (72.4%) | 31 (19.4%) |
| 55 to 59 Years | 30 (57.7%) | 16 (53.3%) |
| 60 to 64 Years | 28 (35.0%) | 7 (25.0%) |
| 65 to 74 Years | 8 (11.1%) | 0 (0.0%) |
| 75 Years and over | 0 (0.0%) | 0 (0.0%) |
| Total | 613 (53.2%) | 147 (24.0%) |
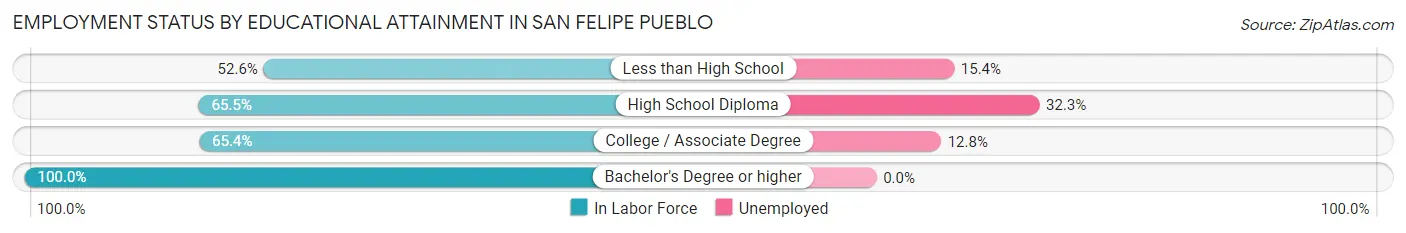
Employment Status by Educational Attainment in San Felipe Pueblo
According to labor force statistics for San Felipe Pueblo, 63.1% of individuals (475) out of the total population between 25 and 64 years of age (753) are in the labor force, with 20.4% or 97 of them being unemployed. The group with the highest labor force participation rate are those with the educational attainment of bachelor's degree or higher, with 100.0% or 35 individuals in the labor force. Within the labor force, individuals with high school diploma education have the highest percentage of unemployment, with 32.3% or 62 of them being unemployed.
| Educational Attainment | In Labor Force | Unemployed |
| Less than High School | 123 (52.6%) | 36 (15.4%) |
| High School Diploma | 192 (65.5%) | 95 (32.3%) |
| College / Associate Degree | 125 (65.4%) | 24 (12.8%) |
| Bachelor's Degree or higher | 35 (100.0%) | 0 (0.0%) |
| Total | 475 (63.1%) | 154 (20.4%) |
Employment Occupations by Sex in San Felipe Pueblo
Management, Business, Science and Arts Occupations
The most common Management, Business, Science and Arts occupations in San Felipe Pueblo are Community & Social Service (65 | 14.0%), Education Instruction & Library (56 | 12.0%), Health Diagnosing & Treating (18 | 3.9%), Management (9 | 1.9%), and Arts, Media & Entertainment (9 | 1.9%).
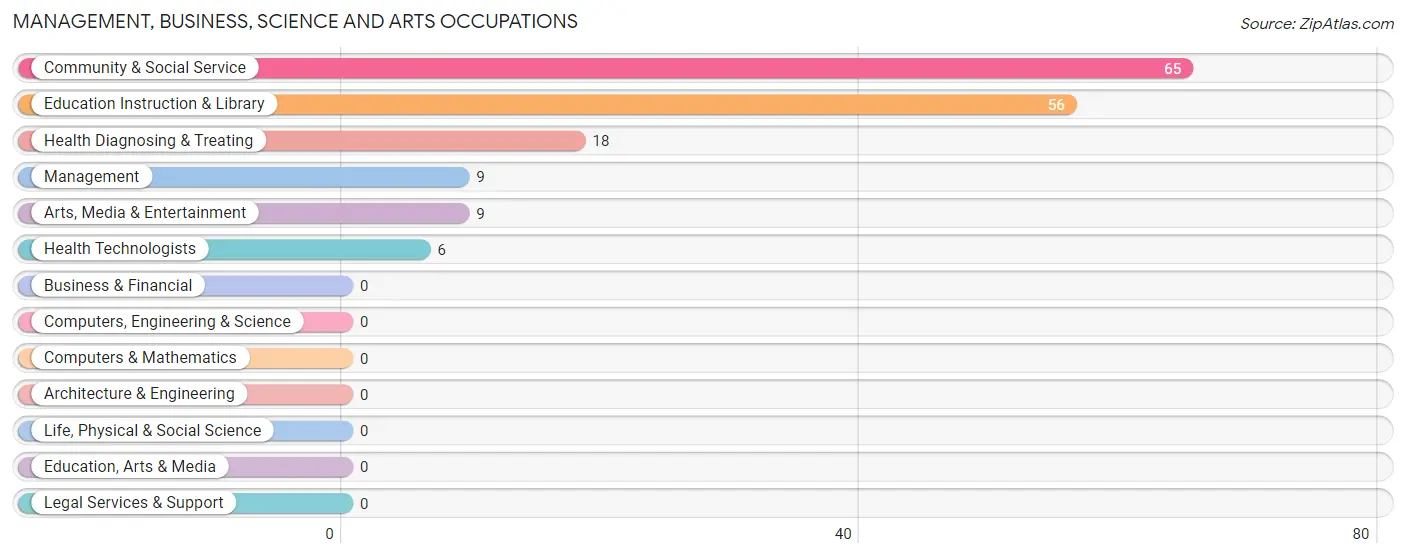
Management, Business, Science and Arts Occupations by Sex
Within the Management, Business, Science and Arts occupations in San Felipe Pueblo, the most male-oriented occupations are Management (100.0%), Health Technologists (100.0%), and Arts, Media & Entertainment (55.6%), while the most female-oriented occupations are Education Instruction & Library (82.1%), Community & Social Service (76.9%), and Health Diagnosing & Treating (66.7%).
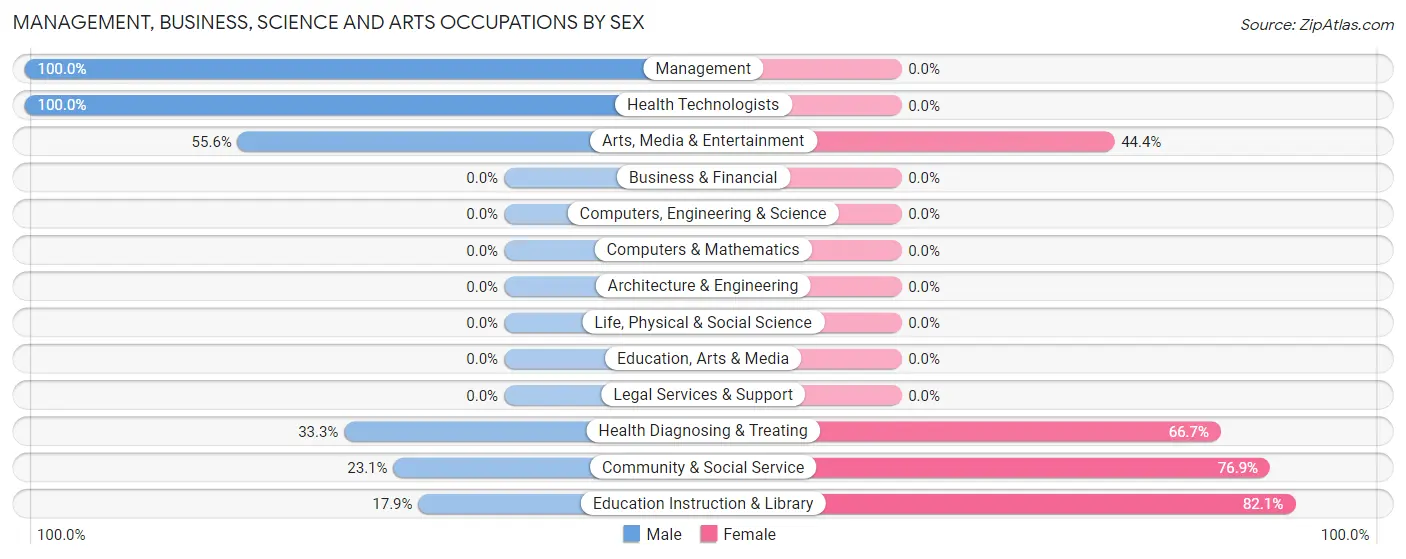
| Occupation | Male | Female |
| Management | 9 (100.0%) | 0 (0.0%) |
| Business & Financial | 0 (0.0%) | 0 (0.0%) |
| Computers, Engineering & Science | 0 (0.0%) | 0 (0.0%) |
| Computers & Mathematics | 0 (0.0%) | 0 (0.0%) |
| Architecture & Engineering | 0 (0.0%) | 0 (0.0%) |
| Life, Physical & Social Science | 0 (0.0%) | 0 (0.0%) |
| Community & Social Service | 15 (23.1%) | 50 (76.9%) |
| Education, Arts & Media | 0 (0.0%) | 0 (0.0%) |
| Legal Services & Support | 0 (0.0%) | 0 (0.0%) |
| Education Instruction & Library | 10 (17.9%) | 46 (82.1%) |
| Arts, Media & Entertainment | 5 (55.6%) | 4 (44.4%) |
| Health Diagnosing & Treating | 6 (33.3%) | 12 (66.7%) |
| Health Technologists | 6 (100.0%) | 0 (0.0%) |
| Total (Category) | 30 (32.6%) | 62 (67.4%) |
| Total (Overall) | 203 (43.6%) | 263 (56.4%) |
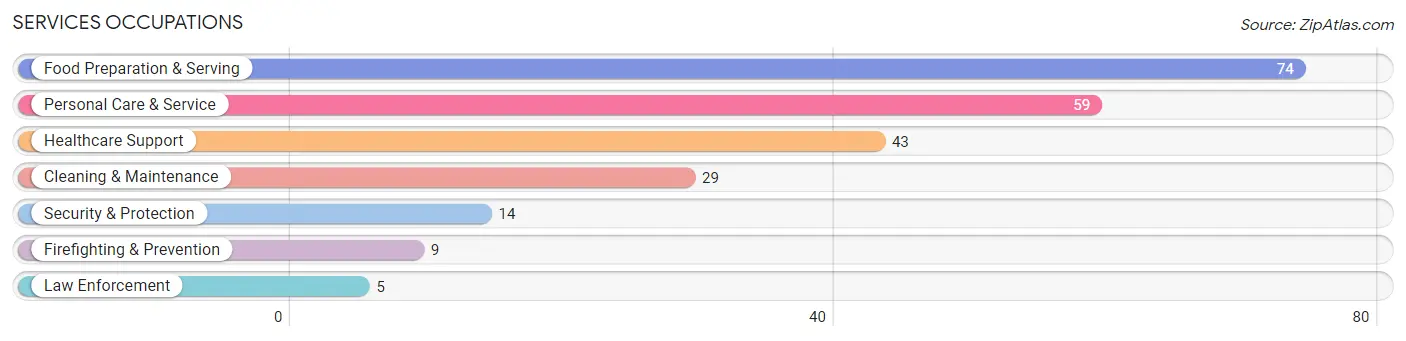
Services Occupations
The most common Services occupations in San Felipe Pueblo are Food Preparation & Serving (74 | 15.9%), Personal Care & Service (59 | 12.7%), Healthcare Support (43 | 9.2%), Cleaning & Maintenance (29 | 6.2%), and Security & Protection (14 | 3.0%).
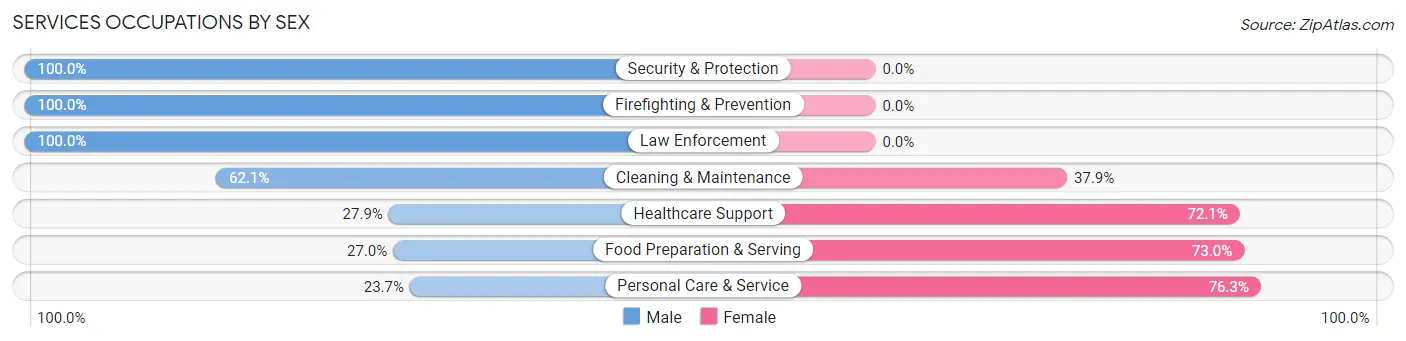
Services Occupations by Sex
Within the Services occupations in San Felipe Pueblo, the most male-oriented occupations are Security & Protection (100.0%), Firefighting & Prevention (100.0%), and Law Enforcement (100.0%), while the most female-oriented occupations are Personal Care & Service (76.3%), Food Preparation & Serving (73.0%), and Healthcare Support (72.1%).
| Occupation | Male | Female |
| Healthcare Support | 12 (27.9%) | 31 (72.1%) |
| Security & Protection | 14 (100.0%) | 0 (0.0%) |
| Firefighting & Prevention | 9 (100.0%) | 0 (0.0%) |
| Law Enforcement | 5 (100.0%) | 0 (0.0%) |
| Food Preparation & Serving | 20 (27.0%) | 54 (73.0%) |
| Cleaning & Maintenance | 18 (62.1%) | 11 (37.9%) |
| Personal Care & Service | 14 (23.7%) | 45 (76.3%) |
| Total (Category) | 78 (35.6%) | 141 (64.4%) |
| Total (Overall) | 203 (43.6%) | 263 (56.4%) |
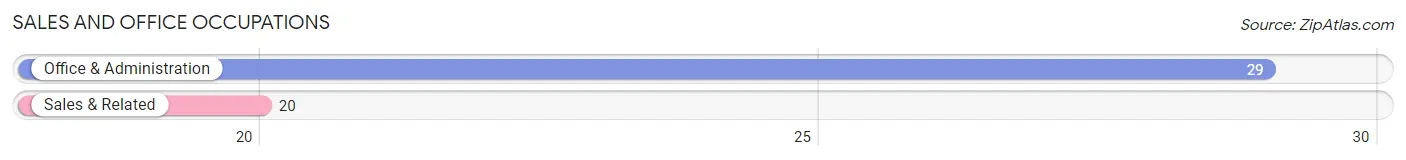
Sales and Office Occupations
The most common Sales and Office occupations in San Felipe Pueblo are Office & Administration (29 | 6.2%), and Sales & Related (20 | 4.3%).
Sales and Office Occupations by Sex
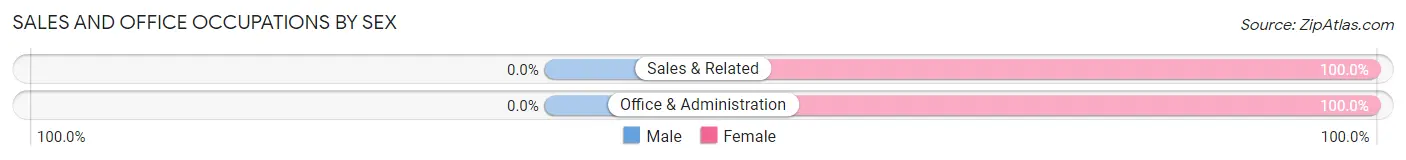
| Occupation | Male | Female |
| Sales & Related | 0 (0.0%) | 20 (100.0%) |
| Office & Administration | 0 (0.0%) | 29 (100.0%) |
| Total (Category) | 0 (0.0%) | 49 (100.0%) |
| Total (Overall) | 203 (43.6%) | 263 (56.4%) |
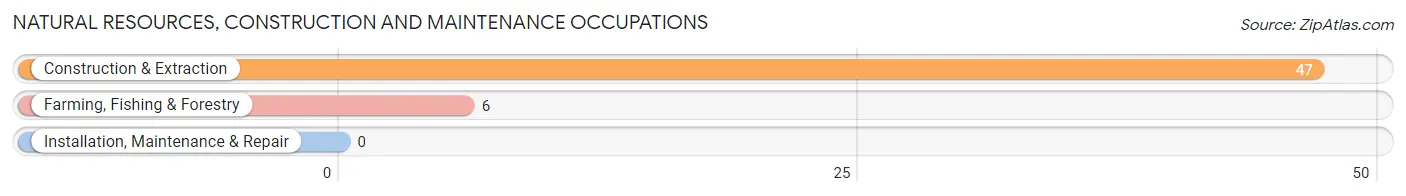
Natural Resources, Construction and Maintenance Occupations
The most common Natural Resources, Construction and Maintenance occupations in San Felipe Pueblo are Construction & Extraction (47 | 10.1%), and Farming, Fishing & Forestry (6 | 1.3%).
Natural Resources, Construction and Maintenance Occupations by Sex
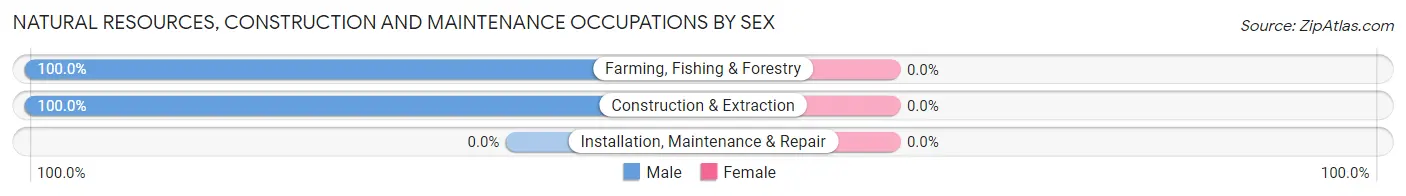
| Occupation | Male | Female |
| Farming, Fishing & Forestry | 6 (100.0%) | 0 (0.0%) |
| Construction & Extraction | 47 (100.0%) | 0 (0.0%) |
| Installation, Maintenance & Repair | 0 (0.0%) | 0 (0.0%) |
| Total (Category) | 53 (100.0%) | 0 (0.0%) |
| Total (Overall) | 203 (43.6%) | 263 (56.4%) |
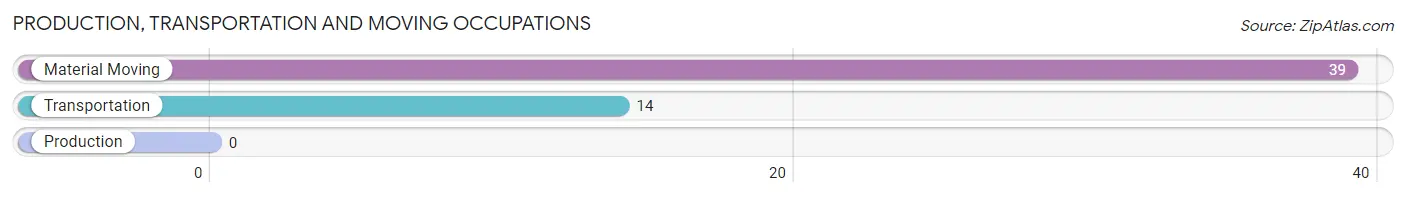
Production, Transportation and Moving Occupations
The most common Production, Transportation and Moving occupations in San Felipe Pueblo are Material Moving (39 | 8.4%), and Transportation (14 | 3.0%).
Production, Transportation and Moving Occupations by Sex
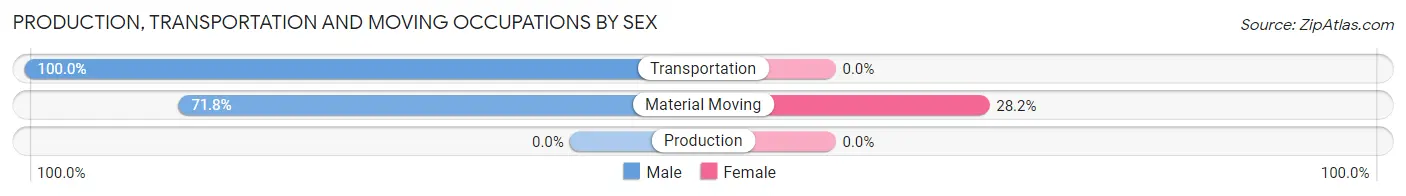
| Occupation | Male | Female |
| Production | 0 (0.0%) | 0 (0.0%) |
| Transportation | 14 (100.0%) | 0 (0.0%) |
| Material Moving | 28 (71.8%) | 11 (28.2%) |
| Total (Category) | 42 (79.2%) | 11 (20.7%) |
| Total (Overall) | 203 (43.6%) | 263 (56.4%) |
Employment Industries by Sex in San Felipe Pueblo
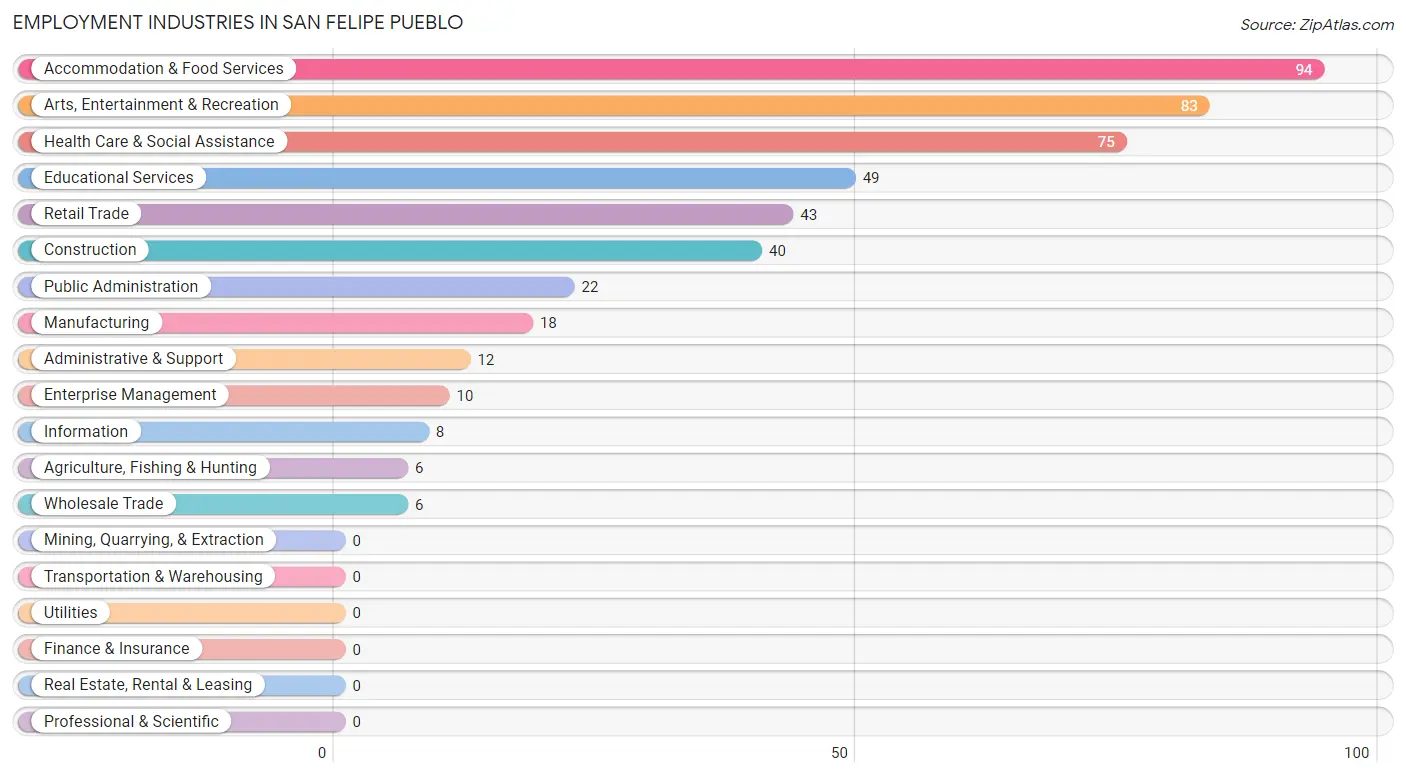
Employment Industries in San Felipe Pueblo
The major employment industries in San Felipe Pueblo include Accommodation & Food Services (94 | 20.2%), Arts, Entertainment & Recreation (83 | 17.8%), Health Care & Social Assistance (75 | 16.1%), Educational Services (49 | 10.5%), and Retail Trade (43 | 9.2%).
Employment Industries by Sex in San Felipe Pueblo
The San Felipe Pueblo industries that see more men than women are Agriculture, Fishing & Hunting (100.0%), Construction (100.0%), and Manufacturing (100.0%), whereas the industries that tend to have a higher number of women are Information (100.0%), Enterprise Management (100.0%), and Educational Services (79.6%).
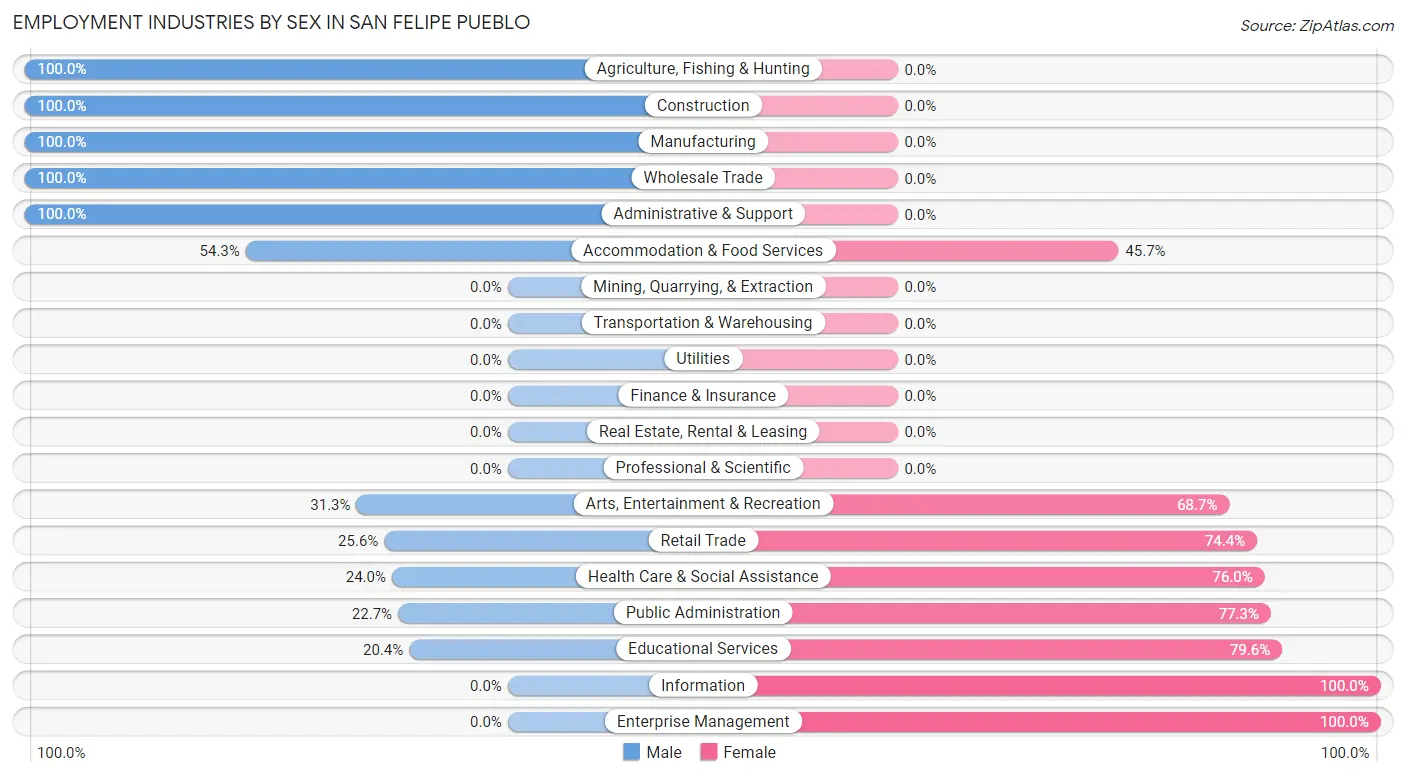
| Industry | Male | Female |
| Agriculture, Fishing & Hunting | 6 (100.0%) | 0 (0.0%) |
| Mining, Quarrying, & Extraction | 0 (0.0%) | 0 (0.0%) |
| Construction | 40 (100.0%) | 0 (0.0%) |
| Manufacturing | 18 (100.0%) | 0 (0.0%) |
| Wholesale Trade | 6 (100.0%) | 0 (0.0%) |
| Retail Trade | 11 (25.6%) | 32 (74.4%) |
| Transportation & Warehousing | 0 (0.0%) | 0 (0.0%) |
| Utilities | 0 (0.0%) | 0 (0.0%) |
| Information | 0 (0.0%) | 8 (100.0%) |
| Finance & Insurance | 0 (0.0%) | 0 (0.0%) |
| Real Estate, Rental & Leasing | 0 (0.0%) | 0 (0.0%) |
| Professional & Scientific | 0 (0.0%) | 0 (0.0%) |
| Enterprise Management | 0 (0.0%) | 10 (100.0%) |
| Administrative & Support | 12 (100.0%) | 0 (0.0%) |
| Educational Services | 10 (20.4%) | 39 (79.6%) |
| Health Care & Social Assistance | 18 (24.0%) | 57 (76.0%) |
| Arts, Entertainment & Recreation | 26 (31.3%) | 57 (68.7%) |
| Accommodation & Food Services | 51 (54.3%) | 43 (45.7%) |
| Public Administration | 5 (22.7%) | 17 (77.3%) |
| Total | 203 (43.6%) | 263 (56.4%) |
Education in San Felipe Pueblo
School Enrollment in San Felipe Pueblo
The most common levels of schooling among the 301 students in San Felipe Pueblo are high school (98 | 32.6%), elementary school (58 | 19.3%), and middle school (56 | 18.6%).
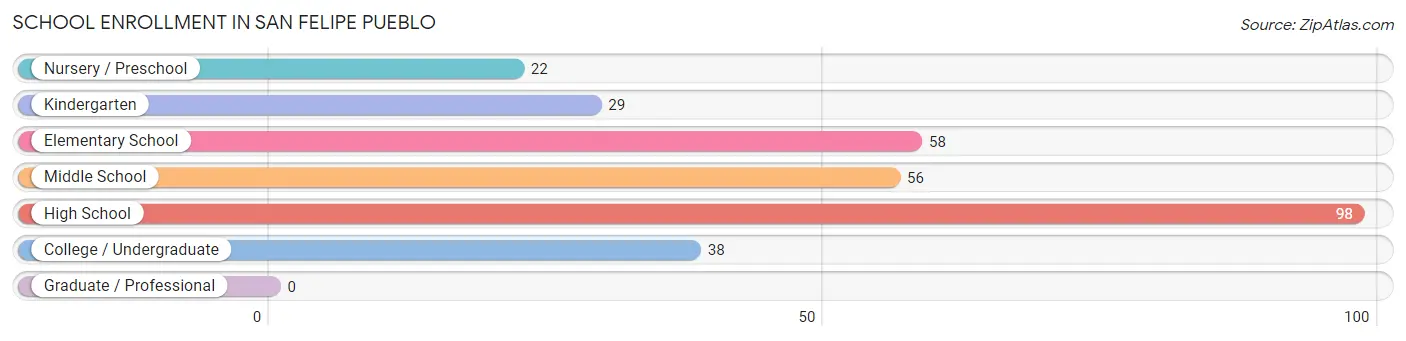
| School Level | # Students | % Students |
| Nursery / Preschool | 22 | 7.3% |
| Kindergarten | 29 | 9.6% |
| Elementary School | 58 | 19.3% |
| Middle School | 56 | 18.6% |
| High School | 98 | 32.6% |
| College / Undergraduate | 38 | 12.6% |
| Graduate / Professional | 0 | 0.0% |
| Total | 301 | 100.0% |
School Enrollment by Age by Funding Source in San Felipe Pueblo
Out of a total of 301 students who are enrolled in schools in San Felipe Pueblo, 28 (9.3%) attend a private institution, while the remaining 273 (90.7%) are enrolled in public schools. The age group of 18 to 19 year olds has the highest likelihood of being enrolled in private schools, with 19 (55.9% in the age bracket) enrolled. Conversely, the age group of 3 to 4 year olds has the lowest likelihood of being enrolled in a private school, with 22 (100.0% in the age bracket) attending a public institution.
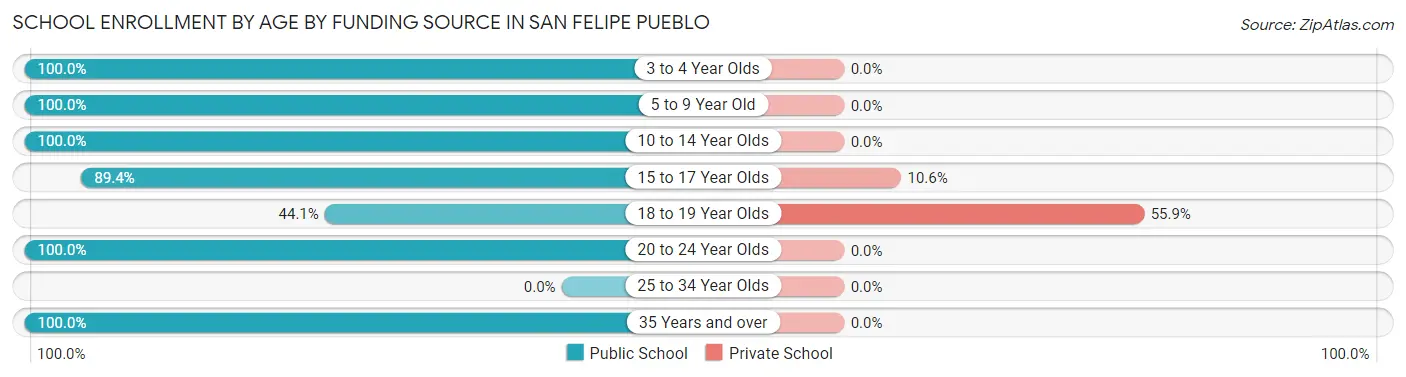
| Age Bracket | Public School | Private School |
| 3 to 4 Year Olds | 22 (100.0%) | 0 (0.0%) |
| 5 to 9 Year Old | 85 (100.0%) | 0 (0.0%) |
| 10 to 14 Year Olds | 53 (100.0%) | 0 (0.0%) |
| 15 to 17 Year Olds | 76 (89.4%) | 9 (10.6%) |
| 18 to 19 Year Olds | 15 (44.1%) | 19 (55.9%) |
| 20 to 24 Year Olds | 17 (100.0%) | 0 (0.0%) |
| 25 to 34 Year Olds | 0 (0.0%) | 0 (0.0%) |
| 35 Years and over | 5 (100.0%) | 0 (0.0%) |
| Total | 273 (90.7%) | 28 (9.3%) |
Educational Attainment by Field of Study in San Felipe Pueblo
Education (30 | 60.0%), engineering (12 | 24.0%), social sciences (5 | 10.0%), and business (3 | 6.0%) are the most common fields of study among 50 individuals in San Felipe Pueblo who have obtained a bachelor's degree or higher.
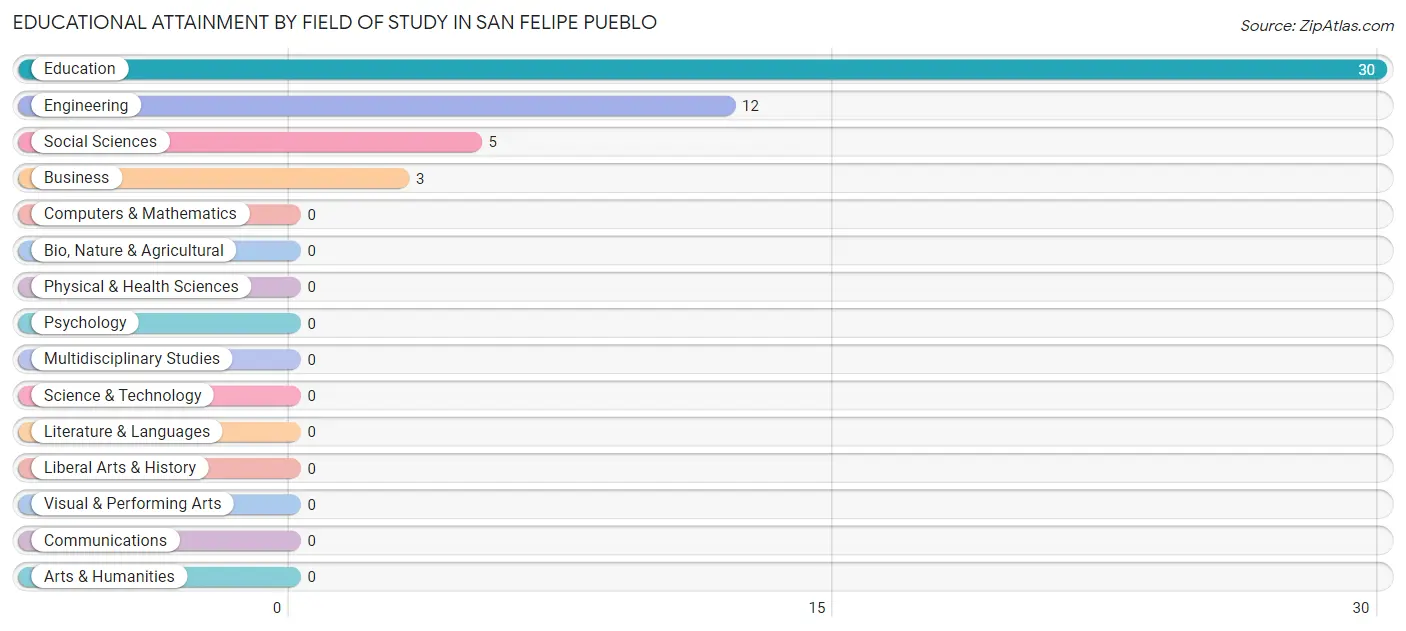
| Field of Study | # Graduates | % Graduates |
| Computers & Mathematics | 0 | 0.0% |
| Bio, Nature & Agricultural | 0 | 0.0% |
| Physical & Health Sciences | 0 | 0.0% |
| Psychology | 0 | 0.0% |
| Social Sciences | 5 | 10.0% |
| Engineering | 12 | 24.0% |
| Multidisciplinary Studies | 0 | 0.0% |
| Science & Technology | 0 | 0.0% |
| Business | 3 | 6.0% |
| Education | 30 | 60.0% |
| Literature & Languages | 0 | 0.0% |
| Liberal Arts & History | 0 | 0.0% |
| Visual & Performing Arts | 0 | 0.0% |
| Communications | 0 | 0.0% |
| Arts & Humanities | 0 | 0.0% |
| Total | 50 | 100.0% |
Transportation & Commute in San Felipe Pueblo
Vehicle Availability by Sex in San Felipe Pueblo
The most prevalent vehicle ownership categories in San Felipe Pueblo are males with 3 vehicles (71, accounting for 35.0%) and females with 3 vehicles (44, making up 28.2%).
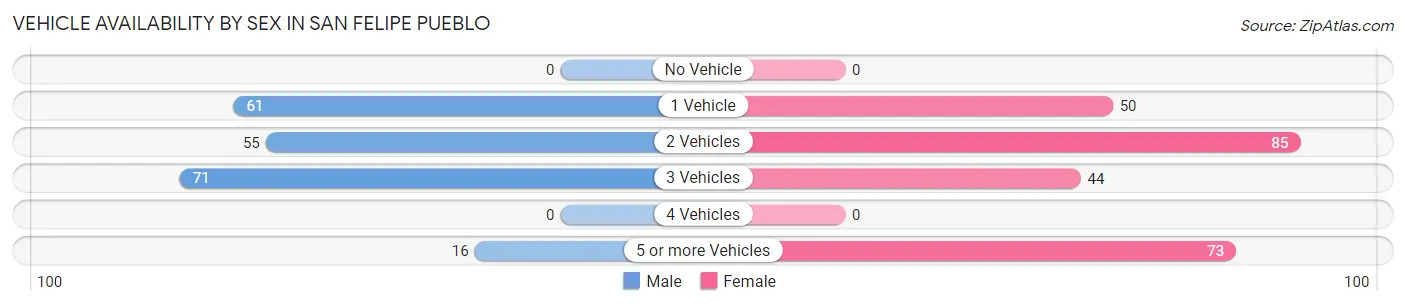
| Vehicles Available | Male | Female |
| No Vehicle | 0 (0.0%) | 0 (0.0%) |
| 1 Vehicle | 61 (30.0%) | 50 (19.8%) |
| 2 Vehicles | 55 (27.1%) | 85 (33.7%) |
| 3 Vehicles | 71 (35.0%) | 44 (17.5%) |
| 4 Vehicles | 0 (0.0%) | 0 (0.0%) |
| 5 or more Vehicles | 16 (7.9%) | 73 (29.0%) |
| Total | 203 (100.0%) | 252 (100.0%) |
Commute Time in San Felipe Pueblo
The most frequently occuring commute durations in San Felipe Pueblo are 20 to 24 minutes (79 commuters, 19.2%), 15 to 19 minutes (74 commuters, 18.0%), and 30 to 34 minutes (61 commuters, 14.8%).
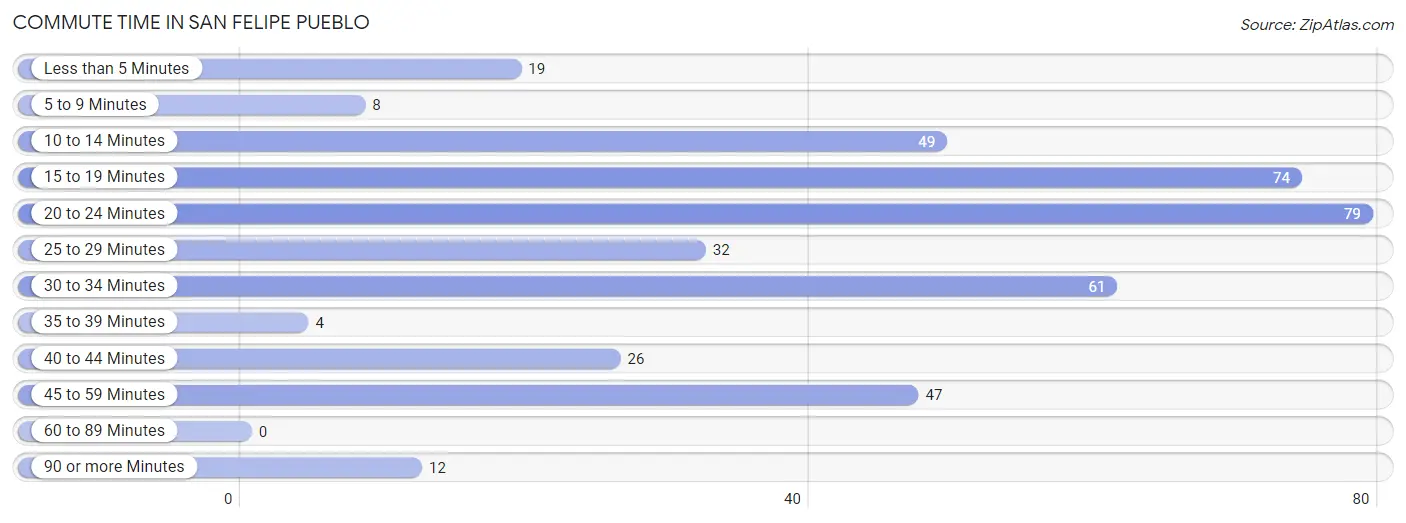
| Commute Time | # Commuters | % Commuters |
| Less than 5 Minutes | 19 | 4.6% |
| 5 to 9 Minutes | 8 | 1.9% |
| 10 to 14 Minutes | 49 | 11.9% |
| 15 to 19 Minutes | 74 | 18.0% |
| 20 to 24 Minutes | 79 | 19.2% |
| 25 to 29 Minutes | 32 | 7.8% |
| 30 to 34 Minutes | 61 | 14.8% |
| 35 to 39 Minutes | 4 | 1.0% |
| 40 to 44 Minutes | 26 | 6.3% |
| 45 to 59 Minutes | 47 | 11.4% |
| 60 to 89 Minutes | 0 | 0.0% |
| 90 or more Minutes | 12 | 2.9% |
Commute Time by Sex in San Felipe Pueblo
The most common commute times in San Felipe Pueblo are 15 to 19 minutes (53 commuters, 27.6%) for males and 30 to 34 minutes (59 commuters, 26.9%) for females.
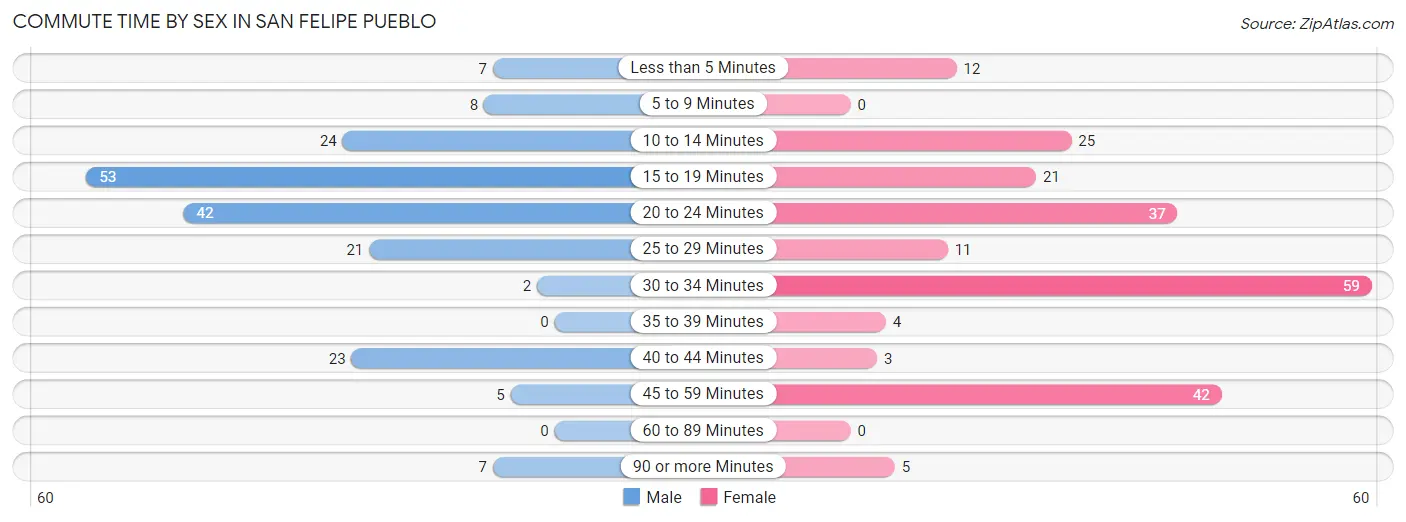
| Commute Time | Male | Female |
| Less than 5 Minutes | 7 (3.6%) | 12 (5.5%) |
| 5 to 9 Minutes | 8 (4.2%) | 0 (0.0%) |
| 10 to 14 Minutes | 24 (12.5%) | 25 (11.4%) |
| 15 to 19 Minutes | 53 (27.6%) | 21 (9.6%) |
| 20 to 24 Minutes | 42 (21.9%) | 37 (16.9%) |
| 25 to 29 Minutes | 21 (10.9%) | 11 (5.0%) |
| 30 to 34 Minutes | 2 (1.0%) | 59 (26.9%) |
| 35 to 39 Minutes | 0 (0.0%) | 4 (1.8%) |
| 40 to 44 Minutes | 23 (12.0%) | 3 (1.4%) |
| 45 to 59 Minutes | 5 (2.6%) | 42 (19.2%) |
| 60 to 89 Minutes | 0 (0.0%) | 0 (0.0%) |
| 90 or more Minutes | 7 (3.6%) | 5 (2.3%) |
Time of Departure to Work by Sex in San Felipe Pueblo
The most frequent times of departure to work in San Felipe Pueblo are 6:00 AM to 6:29 AM (33, 17.2%) for males and 12:00 PM to 3:59 PM (61, 27.9%) for females.
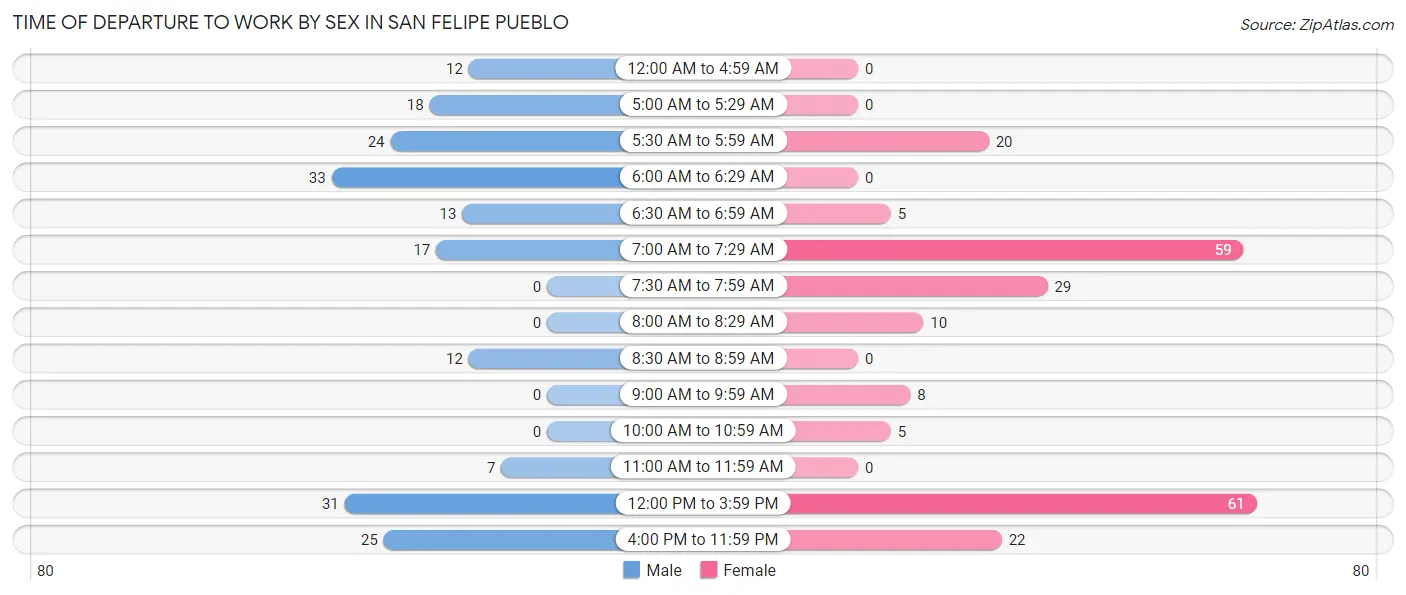
| Time of Departure | Male | Female |
| 12:00 AM to 4:59 AM | 12 (6.2%) | 0 (0.0%) |
| 5:00 AM to 5:29 AM | 18 (9.4%) | 0 (0.0%) |
| 5:30 AM to 5:59 AM | 24 (12.5%) | 20 (9.1%) |
| 6:00 AM to 6:29 AM | 33 (17.2%) | 0 (0.0%) |
| 6:30 AM to 6:59 AM | 13 (6.8%) | 5 (2.3%) |
| 7:00 AM to 7:29 AM | 17 (8.8%) | 59 (26.9%) |
| 7:30 AM to 7:59 AM | 0 (0.0%) | 29 (13.2%) |
| 8:00 AM to 8:29 AM | 0 (0.0%) | 10 (4.6%) |
| 8:30 AM to 8:59 AM | 12 (6.2%) | 0 (0.0%) |
| 9:00 AM to 9:59 AM | 0 (0.0%) | 8 (3.6%) |
| 10:00 AM to 10:59 AM | 0 (0.0%) | 5 (2.3%) |
| 11:00 AM to 11:59 AM | 7 (3.6%) | 0 (0.0%) |
| 12:00 PM to 3:59 PM | 31 (16.2%) | 61 (27.9%) |
| 4:00 PM to 11:59 PM | 25 (13.0%) | 22 (10.1%) |
| Total | 192 (100.0%) | 219 (100.0%) |
Housing Occupancy in San Felipe Pueblo
Occupancy by Ownership in San Felipe Pueblo
Of the total 334 dwellings in San Felipe Pueblo, owner-occupied units account for 170 (50.9%), while renter-occupied units make up 164 (49.1%).
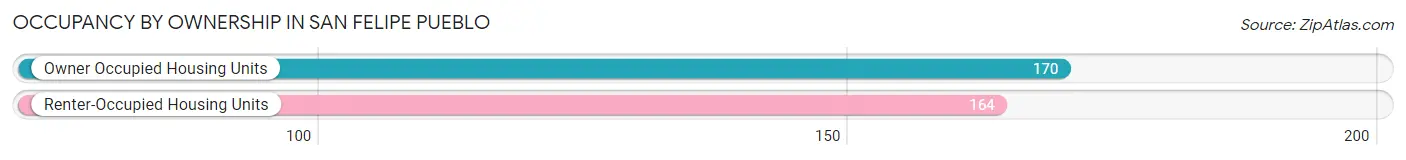
| Occupancy | # Housing Units | % Housing Units |
| Owner Occupied Housing Units | 170 | 50.9% |
| Renter-Occupied Housing Units | 164 | 49.1% |
| Total Occupied Housing Units | 334 | 100.0% |
Occupancy by Household Size in San Felipe Pueblo
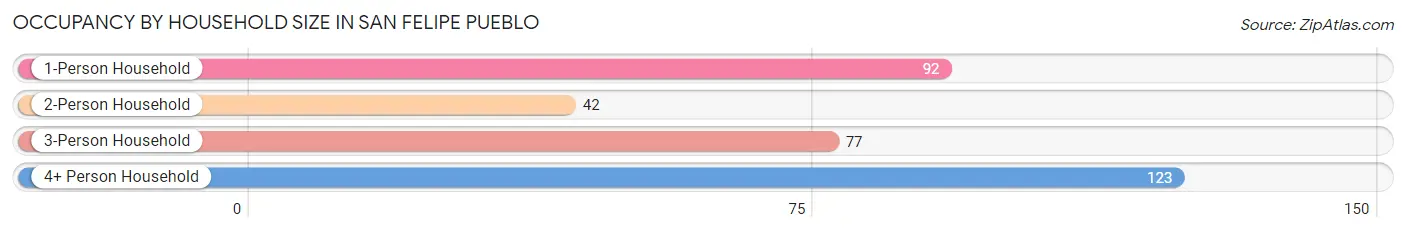
| Household Size | # Housing Units | % Housing Units |
| 1-Person Household | 92 | 27.5% |
| 2-Person Household | 42 | 12.6% |
| 3-Person Household | 77 | 23.1% |
| 4+ Person Household | 123 | 36.8% |
| Total Housing Units | 334 | 100.0% |
Occupancy by Ownership by Household Size in San Felipe Pueblo
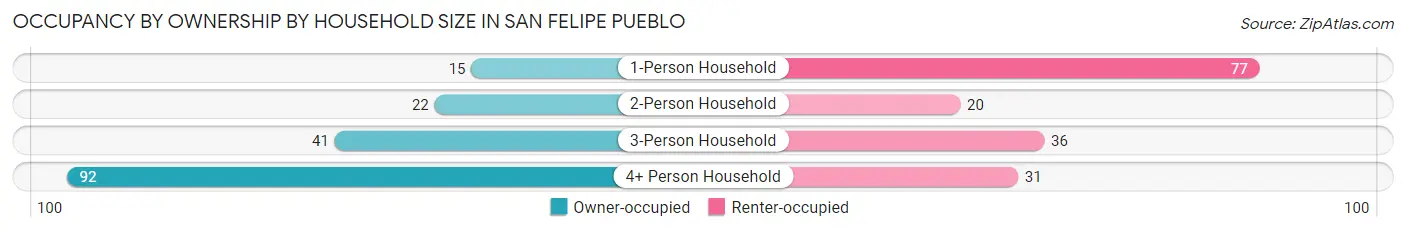
| Household Size | Owner-occupied | Renter-occupied |
| 1-Person Household | 15 (16.3%) | 77 (83.7%) |
| 2-Person Household | 22 (52.4%) | 20 (47.6%) |
| 3-Person Household | 41 (53.2%) | 36 (46.8%) |
| 4+ Person Household | 92 (74.8%) | 31 (25.2%) |
| Total Housing Units | 170 (50.9%) | 164 (49.1%) |
Occupancy by Educational Attainment in San Felipe Pueblo
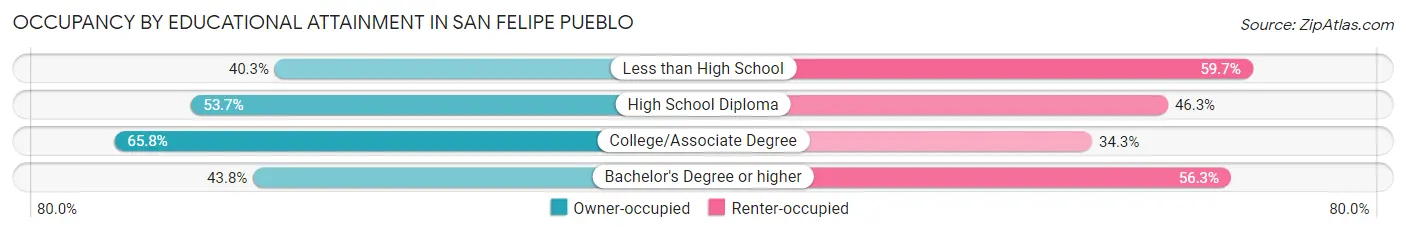
| Household Size | Owner-occupied | Renter-occupied |
| Less than High School | 50 (40.3%) | 74 (59.7%) |
| High School Diploma | 65 (53.7%) | 56 (46.3%) |
| College/Associate Degree | 48 (65.7%) | 25 (34.3%) |
| Bachelor's Degree or higher | 7 (43.8%) | 9 (56.2%) |
Occupancy by Age of Householder in San Felipe Pueblo
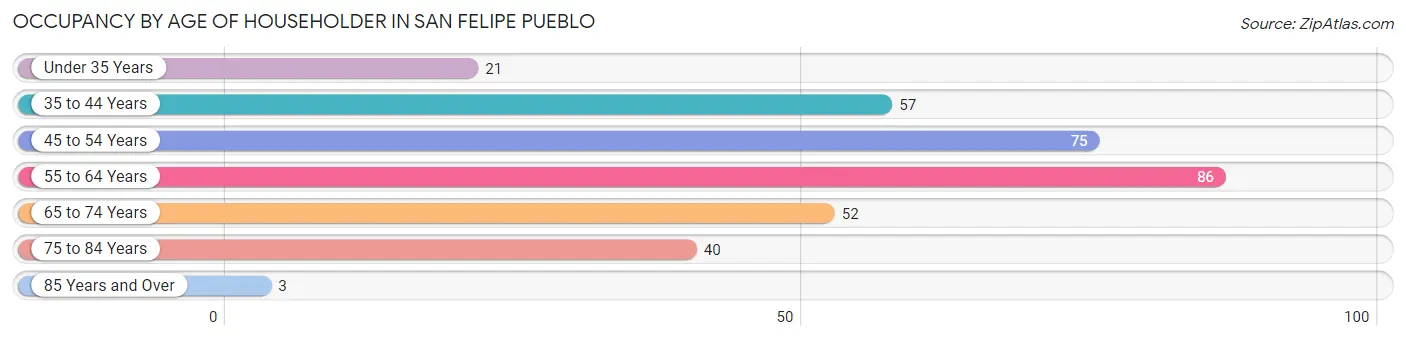
| Age Bracket | # Households | % Households |
| Under 35 Years | 21 | 6.3% |
| 35 to 44 Years | 57 | 17.1% |
| 45 to 54 Years | 75 | 22.5% |
| 55 to 64 Years | 86 | 25.8% |
| 65 to 74 Years | 52 | 15.6% |
| 75 to 84 Years | 40 | 12.0% |
| 85 Years and Over | 3 | 0.9% |
| Total | 334 | 100.0% |
Housing Finances in San Felipe Pueblo
Median Income by Occupancy in San Felipe Pueblo
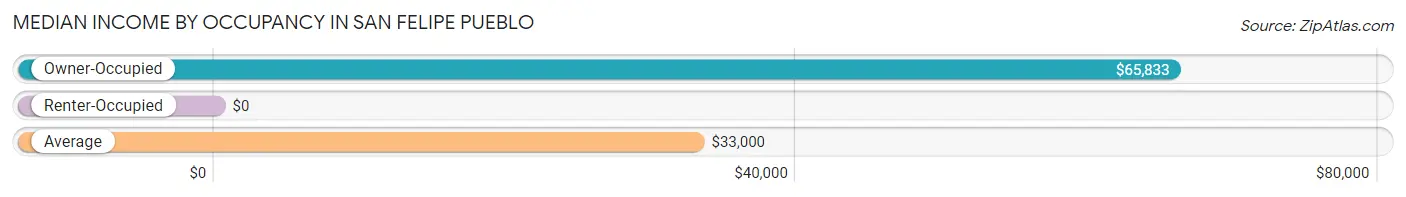
| Occupancy Type | # Households | Median Income |
| Owner-Occupied | 170 (50.9%) | $65,833 |
| Renter-Occupied | 164 (49.1%) | $0 |
| Average | 334 (100.0%) | $33,000 |
Occupancy by Householder Income Bracket in San Felipe Pueblo
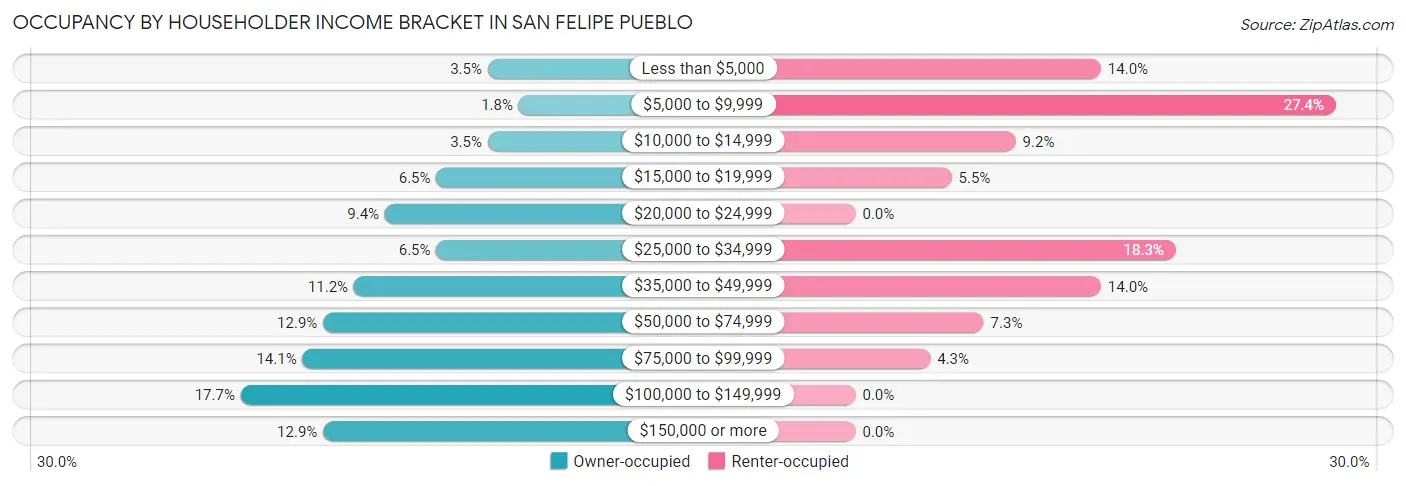
| Income Bracket | Owner-occupied | Renter-occupied |
| Less than $5,000 | 6 (3.5%) | 23 (14.0%) |
| $5,000 to $9,999 | 3 (1.8%) | 45 (27.4%) |
| $10,000 to $14,999 | 6 (3.5%) | 15 (9.1%) |
| $15,000 to $19,999 | 11 (6.5%) | 9 (5.5%) |
| $20,000 to $24,999 | 16 (9.4%) | 0 (0.0%) |
| $25,000 to $34,999 | 11 (6.5%) | 30 (18.3%) |
| $35,000 to $49,999 | 19 (11.2%) | 23 (14.0%) |
| $50,000 to $74,999 | 22 (12.9%) | 12 (7.3%) |
| $75,000 to $99,999 | 24 (14.1%) | 7 (4.3%) |
| $100,000 to $149,999 | 30 (17.6%) | 0 (0.0%) |
| $150,000 or more | 22 (12.9%) | 0 (0.0%) |
| Total | 170 (100.0%) | 164 (100.0%) |
Monthly Housing Cost Tiers in San Felipe Pueblo
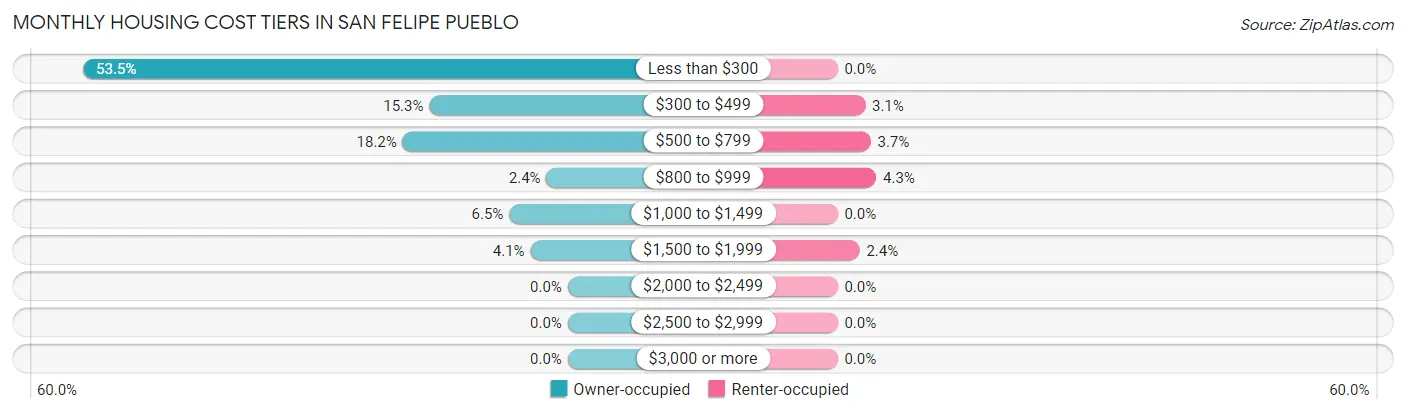
| Monthly Cost | Owner-occupied | Renter-occupied |
| Less than $300 | 91 (53.5%) | 0 (0.0%) |
| $300 to $499 | 26 (15.3%) | 5 (3.0%) |
| $500 to $799 | 31 (18.2%) | 6 (3.7%) |
| $800 to $999 | 4 (2.4%) | 7 (4.3%) |
| $1,000 to $1,499 | 11 (6.5%) | 0 (0.0%) |
| $1,500 to $1,999 | 7 (4.1%) | 4 (2.4%) |
| $2,000 to $2,499 | 0 (0.0%) | 0 (0.0%) |
| $2,500 to $2,999 | 0 (0.0%) | 0 (0.0%) |
| $3,000 or more | 0 (0.0%) | 0 (0.0%) |
| Total | 170 (100.0%) | 164 (100.0%) |
Physical Housing Characteristics in San Felipe Pueblo
Housing Structures in San Felipe Pueblo
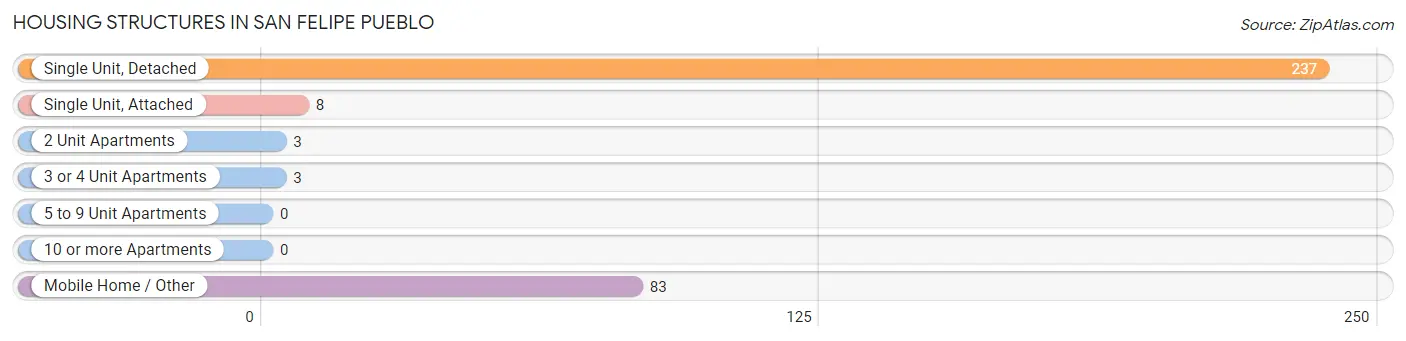
| Structure Type | # Housing Units | % Housing Units |
| Single Unit, Detached | 237 | 71.0% |
| Single Unit, Attached | 8 | 2.4% |
| 2 Unit Apartments | 3 | 0.9% |
| 3 or 4 Unit Apartments | 3 | 0.9% |
| 5 to 9 Unit Apartments | 0 | 0.0% |
| 10 or more Apartments | 0 | 0.0% |
| Mobile Home / Other | 83 | 24.8% |
| Total | 334 | 100.0% |
Housing Structures by Occupancy in San Felipe Pueblo
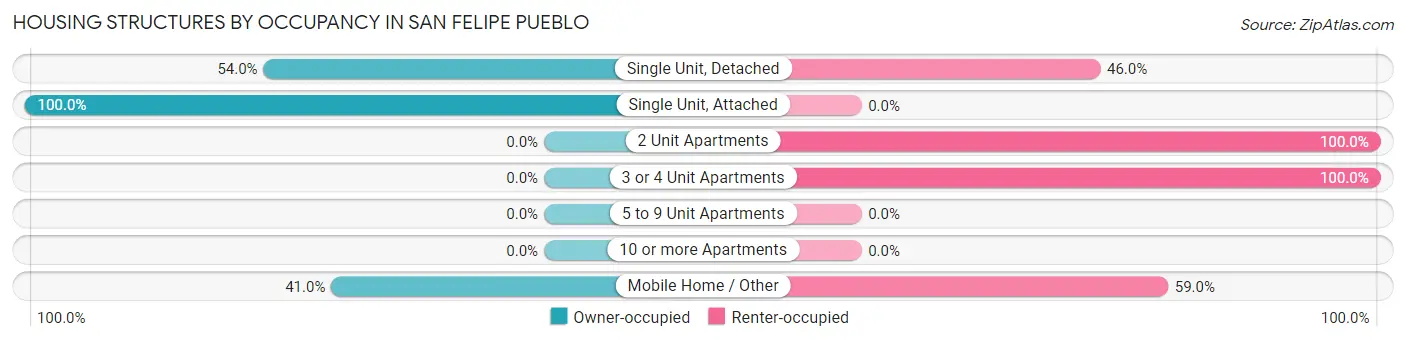
| Structure Type | Owner-occupied | Renter-occupied |
| Single Unit, Detached | 128 (54.0%) | 109 (46.0%) |
| Single Unit, Attached | 8 (100.0%) | 0 (0.0%) |
| 2 Unit Apartments | 0 (0.0%) | 3 (100.0%) |
| 3 or 4 Unit Apartments | 0 (0.0%) | 3 (100.0%) |
| 5 to 9 Unit Apartments | 0 (0.0%) | 0 (0.0%) |
| 10 or more Apartments | 0 (0.0%) | 0 (0.0%) |
| Mobile Home / Other | 34 (41.0%) | 49 (59.0%) |
| Total | 170 (50.9%) | 164 (49.1%) |
Housing Structures by Number of Rooms in San Felipe Pueblo
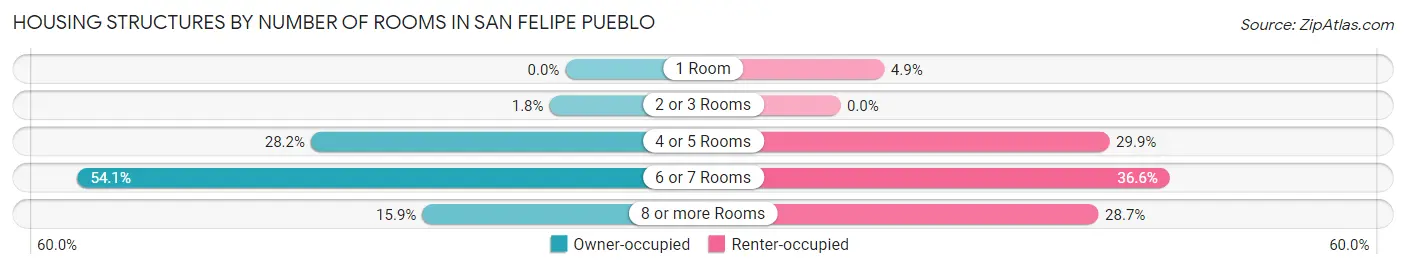
| Number of Rooms | Owner-occupied | Renter-occupied |
| 1 Room | 0 (0.0%) | 8 (4.9%) |
| 2 or 3 Rooms | 3 (1.8%) | 0 (0.0%) |
| 4 or 5 Rooms | 48 (28.2%) | 49 (29.9%) |
| 6 or 7 Rooms | 92 (54.1%) | 60 (36.6%) |
| 8 or more Rooms | 27 (15.9%) | 47 (28.7%) |
| Total | 170 (100.0%) | 164 (100.0%) |
Housing Structure by Heating Type in San Felipe Pueblo
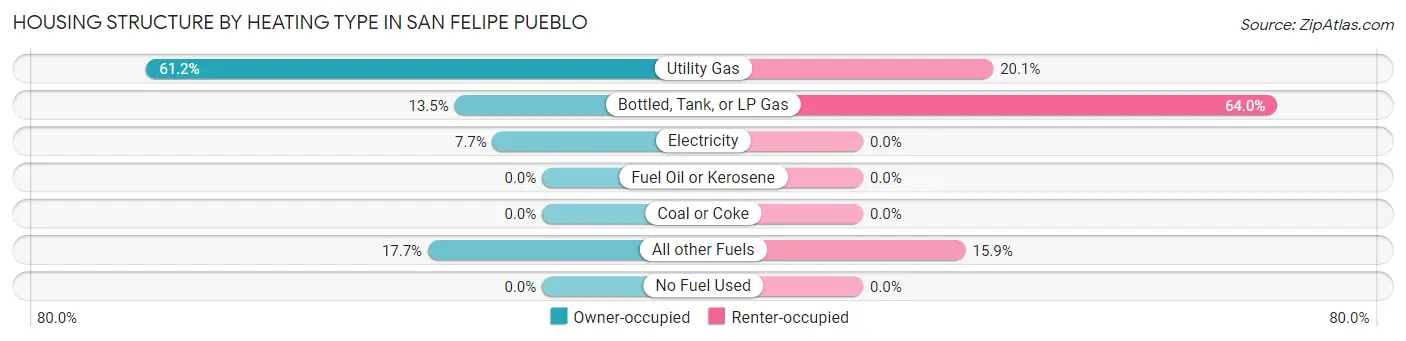
| Heating Type | Owner-occupied | Renter-occupied |
| Utility Gas | 104 (61.2%) | 33 (20.1%) |
| Bottled, Tank, or LP Gas | 23 (13.5%) | 105 (64.0%) |
| Electricity | 13 (7.6%) | 0 (0.0%) |
| Fuel Oil or Kerosene | 0 (0.0%) | 0 (0.0%) |
| Coal or Coke | 0 (0.0%) | 0 (0.0%) |
| All other Fuels | 30 (17.6%) | 26 (15.9%) |
| No Fuel Used | 0 (0.0%) | 0 (0.0%) |
| Total | 170 (100.0%) | 164 (100.0%) |
Household Vehicle Usage in San Felipe Pueblo
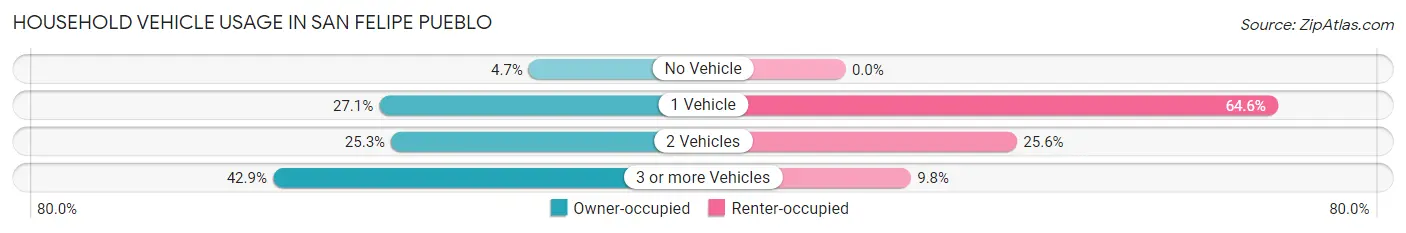
| Vehicles per Household | Owner-occupied | Renter-occupied |
| No Vehicle | 8 (4.7%) | 0 (0.0%) |
| 1 Vehicle | 46 (27.1%) | 106 (64.6%) |
| 2 Vehicles | 43 (25.3%) | 42 (25.6%) |
| 3 or more Vehicles | 73 (42.9%) | 16 (9.8%) |
| Total | 170 (100.0%) | 164 (100.0%) |
Real Estate & Mortgages in San Felipe Pueblo
Real Estate and Mortgage Overview in San Felipe Pueblo
| Characteristic | Without Mortgage | With Mortgage |
| Housing Units | 134 | 36 |
| Median Property Value | $268,200 | $0 |
| Median Household Income | $39,342 | $3 |
| Monthly Housing Costs | $240 | $0 |
| Real Estate Taxes | - | - |
Property Value by Mortgage Status in San Felipe Pueblo
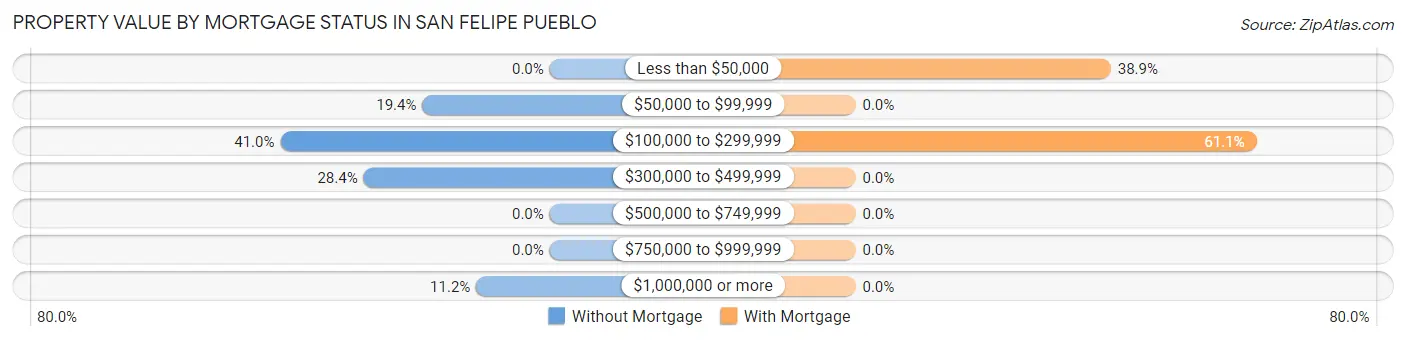
| Property Value | Without Mortgage | With Mortgage |
| Less than $50,000 | 0 (0.0%) | 14 (38.9%) |
| $50,000 to $99,999 | 26 (19.4%) | 0 (0.0%) |
| $100,000 to $299,999 | 55 (41.0%) | 22 (61.1%) |
| $300,000 to $499,999 | 38 (28.4%) | 0 (0.0%) |
| $500,000 to $749,999 | 0 (0.0%) | 0 (0.0%) |
| $750,000 to $999,999 | 0 (0.0%) | 0 (0.0%) |
| $1,000,000 or more | 15 (11.2%) | 0 (0.0%) |
| Total | 134 (100.0%) | 36 (100.0%) |
Household Income by Mortgage Status in San Felipe Pueblo
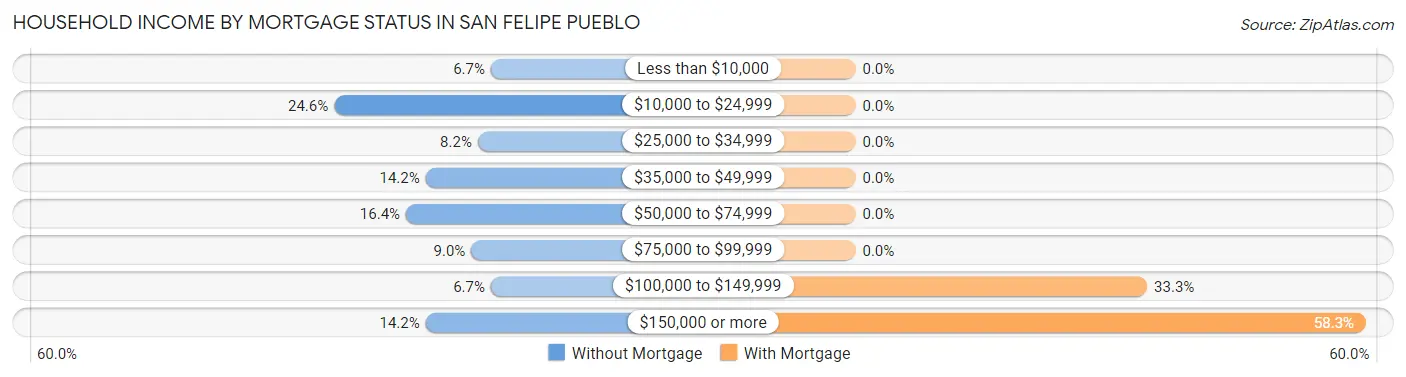
| Household Income | Without Mortgage | With Mortgage |
| Less than $10,000 | 9 (6.7%) | 0 (0.0%) |
| $10,000 to $24,999 | 33 (24.6%) | 0 (0.0%) |
| $25,000 to $34,999 | 11 (8.2%) | 0 (0.0%) |
| $35,000 to $49,999 | 19 (14.2%) | 0 (0.0%) |
| $50,000 to $74,999 | 22 (16.4%) | 0 (0.0%) |
| $75,000 to $99,999 | 12 (9.0%) | 0 (0.0%) |
| $100,000 to $149,999 | 9 (6.7%) | 12 (33.3%) |
| $150,000 or more | 19 (14.2%) | 21 (58.3%) |
| Total | 134 (100.0%) | 36 (100.0%) |
Property Value to Household Income Ratio in San Felipe Pueblo
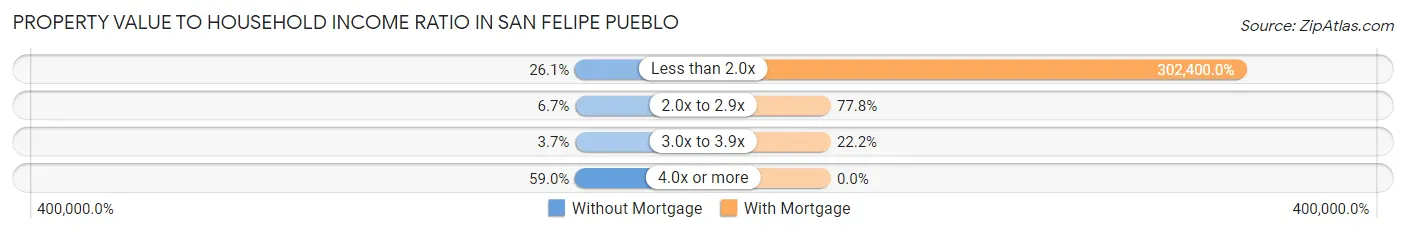
| Value-to-Income Ratio | Without Mortgage | With Mortgage |
| Less than 2.0x | 35 (26.1%) | 108,864 (302,400.0%) |
| 2.0x to 2.9x | 9 (6.7%) | 28 (77.8%) |
| 3.0x to 3.9x | 5 (3.7%) | 8 (22.2%) |
| 4.0x or more | 79 (59.0%) | 0 (0.0%) |
| Total | 134 (100.0%) | 36 (100.0%) |
Real Estate Taxes by Mortgage Status in San Felipe Pueblo
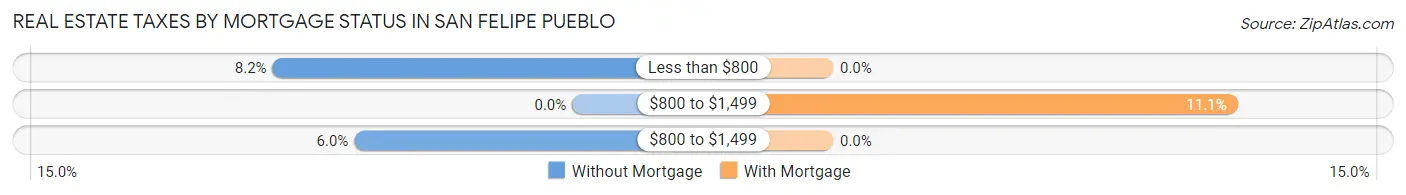
| Property Taxes | Without Mortgage | With Mortgage |
| Less than $800 | 11 (8.2%) | 0 (0.0%) |
| $800 to $1,499 | 0 (0.0%) | 4 (11.1%) |
| $800 to $1,499 | 8 (6.0%) | 0 (0.0%) |
| Total | 134 (100.0%) | 36 (100.0%) |
Health & Disability in San Felipe Pueblo
Health Insurance Coverage by Age in San Felipe Pueblo
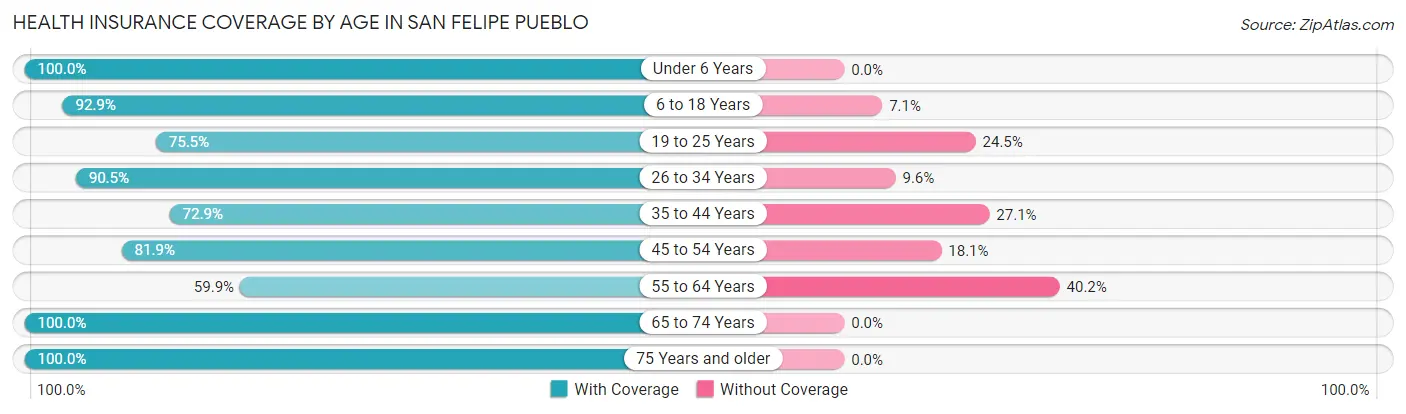
| Age Bracket | With Coverage | Without Coverage |
| Under 6 Years | 129 (100.0%) | 0 (0.0%) |
| 6 to 18 Years | 223 (92.9%) | 17 (7.1%) |
| 19 to 25 Years | 148 (75.5%) | 48 (24.5%) |
| 26 to 34 Years | 142 (90.4%) | 15 (9.6%) |
| 35 to 44 Years | 159 (72.9%) | 59 (27.1%) |
| 45 to 54 Years | 181 (81.9%) | 40 (18.1%) |
| 55 to 64 Years | 79 (59.9%) | 53 (40.2%) |
| 65 to 74 Years | 72 (100.0%) | 0 (0.0%) |
| 75 Years and older | 65 (100.0%) | 0 (0.0%) |
| Total | 1,198 (83.8%) | 232 (16.2%) |
Health Insurance Coverage by Citizenship Status in San Felipe Pueblo
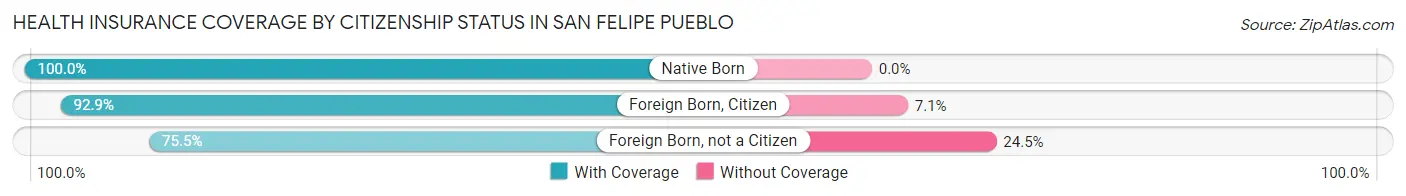
| Citizenship Status | With Coverage | Without Coverage |
| Native Born | 129 (100.0%) | 0 (0.0%) |
| Foreign Born, Citizen | 223 (92.9%) | 17 (7.1%) |
| Foreign Born, not a Citizen | 148 (75.5%) | 48 (24.5%) |
Health Insurance Coverage by Household Income in San Felipe Pueblo
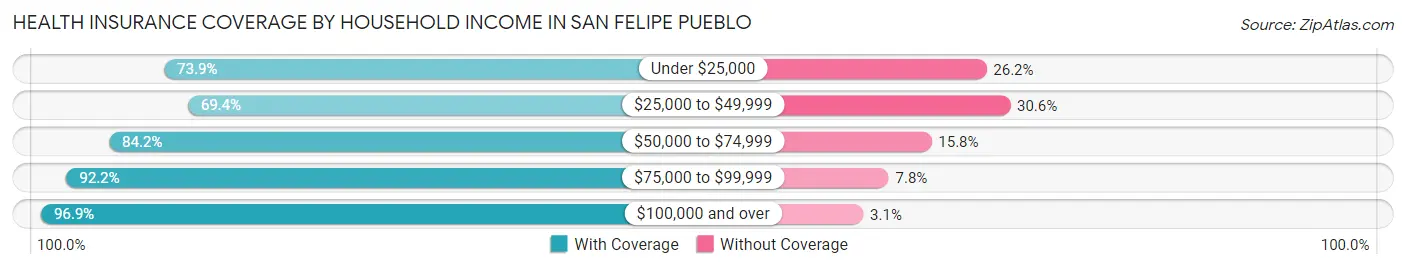
| Household Income | With Coverage | Without Coverage |
| Under $25,000 | 305 (73.9%) | 108 (26.2%) |
| $25,000 to $49,999 | 143 (69.4%) | 63 (30.6%) |
| $50,000 to $74,999 | 186 (84.2%) | 35 (15.8%) |
| $75,000 to $99,999 | 153 (92.2%) | 13 (7.8%) |
| $100,000 and over | 411 (96.9%) | 13 (3.1%) |
Public vs Private Health Insurance Coverage by Age in San Felipe Pueblo
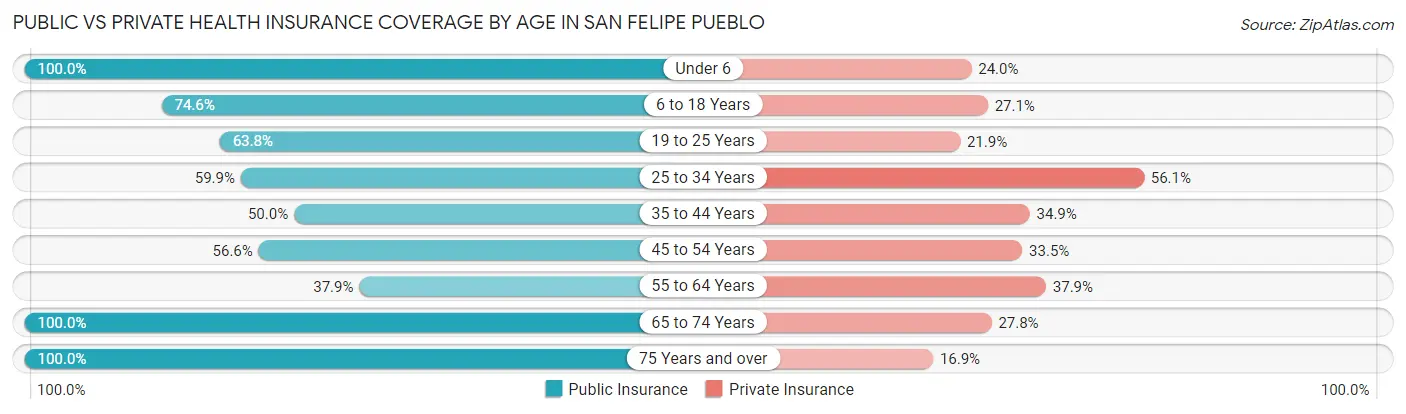
| Age Bracket | Public Insurance | Private Insurance |
| Under 6 | 129 (100.0%) | 31 (24.0%) |
| 6 to 18 Years | 179 (74.6%) | 65 (27.1%) |
| 19 to 25 Years | 125 (63.8%) | 43 (21.9%) |
| 25 to 34 Years | 94 (59.9%) | 88 (56.0%) |
| 35 to 44 Years | 109 (50.0%) | 76 (34.9%) |
| 45 to 54 Years | 125 (56.6%) | 74 (33.5%) |
| 55 to 64 Years | 50 (37.9%) | 50 (37.9%) |
| 65 to 74 Years | 72 (100.0%) | 20 (27.8%) |
| 75 Years and over | 65 (100.0%) | 11 (16.9%) |
| Total | 948 (66.3%) | 458 (32.0%) |
Disability Status by Sex by Age in San Felipe Pueblo
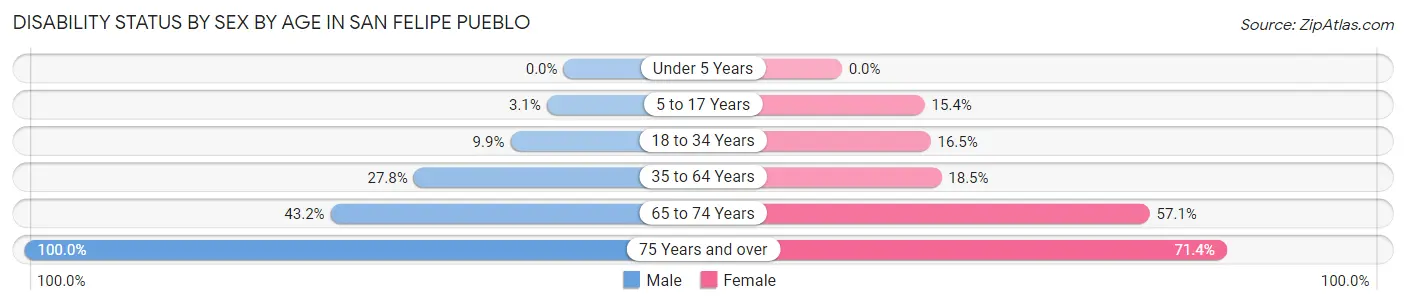
| Age Bracket | Male | Female |
| Under 5 Years | 0 (0.0%) | 0 (0.0%) |
| 5 to 17 Years | 5 (3.1%) | 12 (15.4%) |
| 18 to 34 Years | 21 (9.9%) | 29 (16.5%) |
| 35 to 64 Years | 67 (27.8%) | 61 (18.5%) |
| 65 to 74 Years | 16 (43.2%) | 20 (57.1%) |
| 75 Years and over | 23 (100.0%) | 30 (71.4%) |
Disability Class by Sex by Age in San Felipe Pueblo
Disability Class: Hearing Difficulty
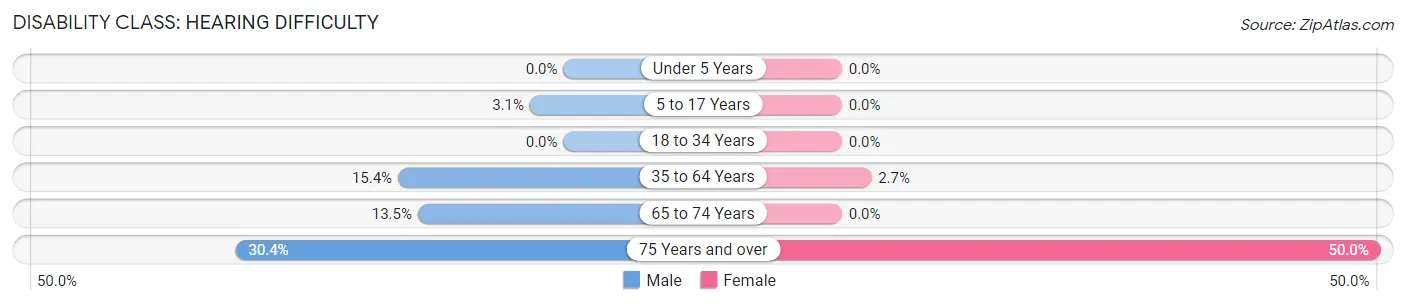
| Age Bracket | Male | Female |
| Under 5 Years | 0 (0.0%) | 0 (0.0%) |
| 5 to 17 Years | 5 (3.1%) | 0 (0.0%) |
| 18 to 34 Years | 0 (0.0%) | 0 (0.0%) |
| 35 to 64 Years | 37 (15.3%) | 9 (2.7%) |
| 65 to 74 Years | 5 (13.5%) | 0 (0.0%) |
| 75 Years and over | 7 (30.4%) | 21 (50.0%) |
Disability Class: Vision Difficulty

| Age Bracket | Male | Female |
| Under 5 Years | 0 (0.0%) | 0 (0.0%) |
| 5 to 17 Years | 5 (3.1%) | 12 (15.4%) |
| 18 to 34 Years | 0 (0.0%) | 19 (10.8%) |
| 35 to 64 Years | 19 (7.9%) | 19 (5.8%) |
| 65 to 74 Years | 4 (10.8%) | 5 (14.3%) |
| 75 Years and over | 7 (30.4%) | 0 (0.0%) |
Disability Class: Cognitive Difficulty
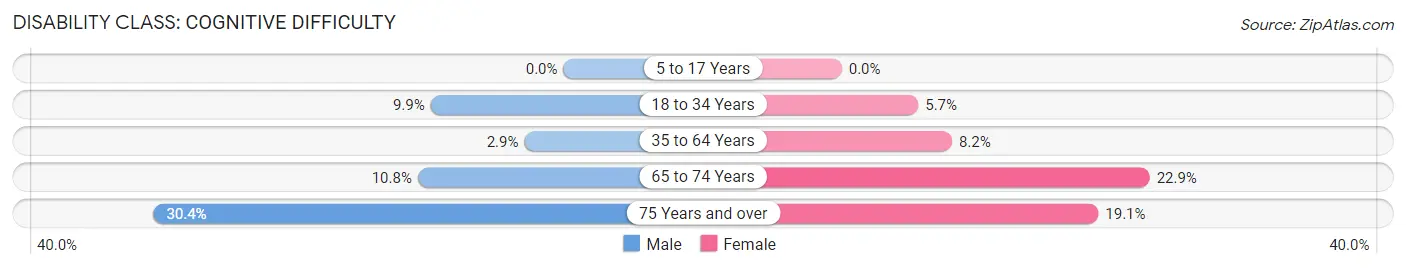
| Age Bracket | Male | Female |
| 5 to 17 Years | 0 (0.0%) | 0 (0.0%) |
| 18 to 34 Years | 21 (9.9%) | 10 (5.7%) |
| 35 to 64 Years | 7 (2.9%) | 27 (8.2%) |
| 65 to 74 Years | 4 (10.8%) | 8 (22.9%) |
| 75 Years and over | 7 (30.4%) | 8 (19.1%) |
Disability Class: Ambulatory Difficulty
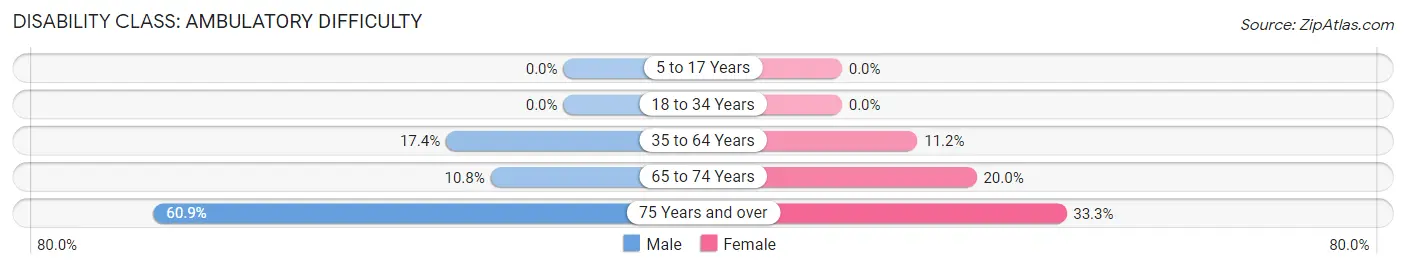
| Age Bracket | Male | Female |
| 5 to 17 Years | 0 (0.0%) | 0 (0.0%) |
| 18 to 34 Years | 0 (0.0%) | 0 (0.0%) |
| 35 to 64 Years | 42 (17.4%) | 37 (11.2%) |
| 65 to 74 Years | 4 (10.8%) | 7 (20.0%) |
| 75 Years and over | 14 (60.9%) | 14 (33.3%) |
Disability Class: Self-Care Difficulty
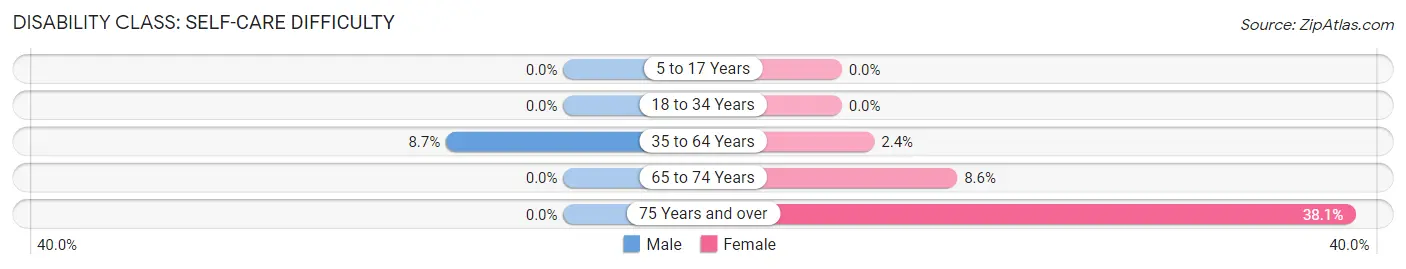
| Age Bracket | Male | Female |
| 5 to 17 Years | 0 (0.0%) | 0 (0.0%) |
| 18 to 34 Years | 0 (0.0%) | 0 (0.0%) |
| 35 to 64 Years | 21 (8.7%) | 8 (2.4%) |
| 65 to 74 Years | 0 (0.0%) | 3 (8.6%) |
| 75 Years and over | 0 (0.0%) | 16 (38.1%) |
Technology Access in San Felipe Pueblo
Computing Device Access in San Felipe Pueblo
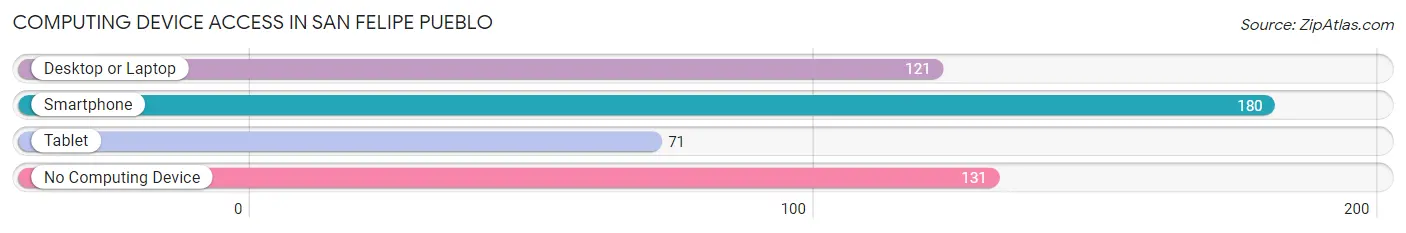
| Device Type | # Households | % Households |
| Desktop or Laptop | 121 | 36.2% |
| Smartphone | 180 | 53.9% |
| Tablet | 71 | 21.3% |
| No Computing Device | 131 | 39.2% |
| Total | 334 | 100.0% |
Internet Access in San Felipe Pueblo
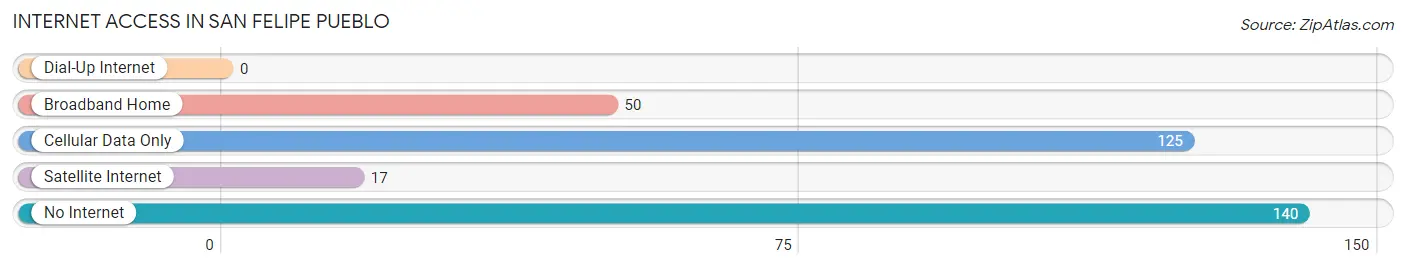
| Internet Type | # Households | % Households |
| Dial-Up Internet | 0 | 0.0% |
| Broadband Home | 50 | 15.0% |
| Cellular Data Only | 125 | 37.4% |
| Satellite Internet | 17 | 5.1% |
| No Internet | 140 | 41.9% |
| Total | 334 | 100.0% |
San Felipe Pueblo Summary
San Felipe Pueblo is a Native American Pueblo located in the Rio Grande Valley of New Mexico. It is one of the 19 Pueblos of New Mexico and is home to the San Felipe people, a tribe of the Keresan language family. The Pueblo is located approximately 25 miles north of Albuquerque and is situated on the banks of the Rio Grande.
Geography
San Felipe Pueblo is located in the Rio Grande Valley of New Mexico, approximately 25 miles north of Albuquerque. The Pueblo is situated on the banks of the Rio Grande, and is surrounded by the Sandia Mountains to the east and the Jemez Mountains to the west. The Pueblo is located at an elevation of 5,400 feet and covers an area of approximately 8,000 acres.
History
The San Felipe people have lived in the Rio Grande Valley for centuries, and the Pueblo was established in the late 1600s. The Pueblo was originally inhabited by the Tewa people, who were later joined by the Keresan-speaking San Felipe people. The Pueblo was part of the Spanish colonial empire until the Mexican War of Independence in 1821. After the war, the Pueblo was part of the newly independent Mexico until the United States annexed the area in 1848.
The San Felipe people have a long history of resistance to outside forces, and the Pueblo has been the site of several conflicts between the Pueblo and the United States government. In 1847, the Pueblo was attacked by the U.S. Army in an attempt to force the Pueblo to accept American rule. The Pueblo was also the site of the San Felipe Massacre in 1854, when U.S. troops attacked the Pueblo in retaliation for the Pueblo's refusal to accept American rule.
Economy
The economy of San Felipe Pueblo is largely based on agriculture and tourism. The Pueblo is home to a number of farms and ranches, which produce a variety of crops, including corn, beans, squash, and chile. The Pueblo also has a number of small businesses, including restaurants, gift shops, and art galleries.
Tourism is an important part of the economy of San Felipe Pueblo. The Pueblo is home to a number of cultural attractions, including the San Felipe Cultural Center, which features traditional dances, music, and art. The Pueblo also hosts a number of annual festivals, including the San Felipe Fiesta, which celebrates the Pueblo's culture and history.
Demographics
As of the 2010 census, the population of San Felipe Pueblo was 2,719. The population is primarily Native American, with the majority of the population identifying as Keresan-speaking San Felipe people. The Pueblo also has a small population of Hispanic and non-Native American residents.
The median household income in San Felipe Pueblo is $30,000, and the median age is 33. The Pueblo has a high rate of poverty, with nearly 40% of the population living below the poverty line. The Pueblo also has a high rate of unemployment, with nearly 20% of the population unemployed.
Conclusion
San Felipe Pueblo is a Native American Pueblo located in the Rio Grande Valley of New Mexico. The Pueblo is home to the San Felipe people, a tribe of the Keresan language family, and has a long history of resistance to outside forces. The economy of San Felipe Pueblo is largely based on agriculture and tourism, and the population is primarily Native American. The Pueblo has a high rate of poverty and unemployment, but is home to a number of cultural attractions and hosts a number of annual festivals.
Common Questions
What is the Total Population of San Felipe Pueblo?
Total Population of San Felipe Pueblo is 1,430.
What is the Total Male Population of San Felipe Pueblo?
Total Male Population of San Felipe Pueblo is 763.
What is the Total Female Population of San Felipe Pueblo?
Total Female Population of San Felipe Pueblo is 667.
What is the Ratio of Males per 100 Females in San Felipe Pueblo?
There are 114.39 Males per 100 Females in San Felipe Pueblo.
What is the Ratio of Females per 100 Males in San Felipe Pueblo?
There are 87.42 Females per 100 Males in San Felipe Pueblo.
What is the Median Population Age in San Felipe Pueblo?
Median Population Age in San Felipe Pueblo is 33.0 Years.
What is the Average Family Size in San Felipe Pueblo
Average Family Size in San Felipe Pueblo is 5.6 People.
What is the Average Household Size in San Felipe Pueblo
Average Household Size in San Felipe Pueblo is 4.3 People.
What is Per Capita Income in San Felipe Pueblo?
Per Capita income in San Felipe Pueblo is $14,125.
What is the Median Family Income in San Felipe Pueblo?
Median Family Income in San Felipe Pueblo is $39,803.
What is the Median Household income in San Felipe Pueblo?
Median Household Income in San Felipe Pueblo is $33,000.
What is Income or Wage Gap in San Felipe Pueblo?
Income or Wage Gap in San Felipe Pueblo is 1.0%.
Women in San Felipe Pueblo earn 99.0 cents for every dollar earned by a man.
What is Inequality or Gini Index in San Felipe Pueblo?
Inequality or Gini Index in San Felipe Pueblo is 0.54.
How Large is the Labor Force in San Felipe Pueblo?
There are 613 People in the Labor Forcein in San Felipe Pueblo.
What is the Percentage of People in the Labor Force in San Felipe Pueblo?
53.2% of People are in the Labor Force in San Felipe Pueblo.
What is the Unemployment Rate in San Felipe Pueblo?
Unemployment Rate in San Felipe Pueblo is 24.0%.