Piltzville, MT
Piltzville Map
Piltzville Overview
650
TOTAL POPULATION
377
MALE POPULATION
273
FEMALE POPULATION
138.10
MALES / 100 FEMALES
72.41
FEMALES / 100 MALES
35.6
MEDIAN AGE
2.7
AVG FAMILY SIZE
3.1
AVG HOUSEHOLD SIZE
$29,329
PER CAPITA INCOME
$94,256
AVG FAMILY INCOME
$94,851
AVG HOUSEHOLD INCOME
37.3%
WAGE / INCOME GAP [ % ]
62.7¢/ $1
WAGE / INCOME GAP [ $ ]
0.16
INEQUALITY / GINI INDEX
436
LABOR FORCE [ PEOPLE ]
76.6%
PERCENT IN LABOR FORCE
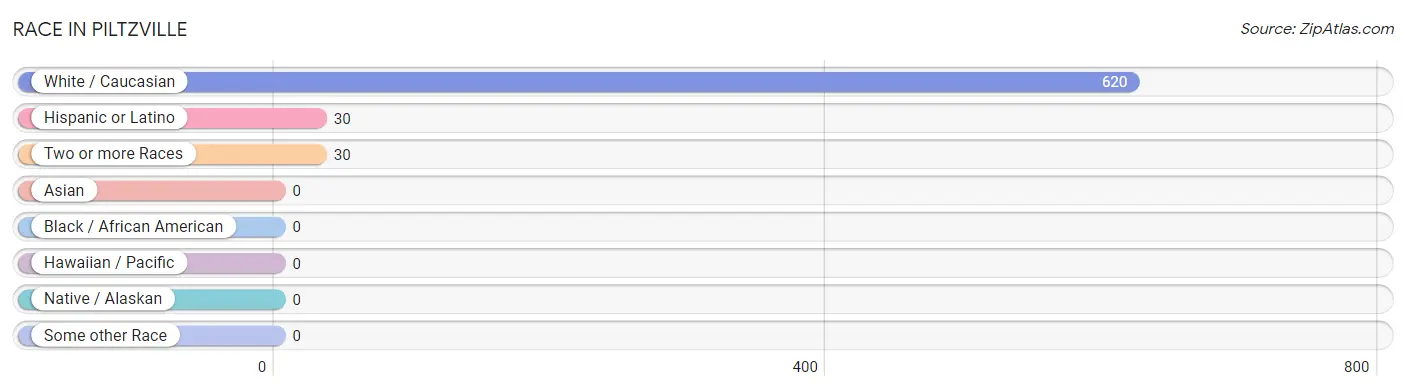
Race in Piltzville
The most populous races in Piltzville are White / Caucasian (620 | 95.4%), Hispanic or Latino (30 | 4.6%), and Two or more Races (30 | 4.6%).
| Race | # Population | % Population |
| Asian | 0 | 0.0% |
| Black / African American | 0 | 0.0% |
| Hawaiian / Pacific | 0 | 0.0% |
| Hispanic or Latino | 30 | 4.6% |
| Native / Alaskan | 0 | 0.0% |
| White / Caucasian | 620 | 95.4% |
| Two or more Races | 30 | 4.6% |
| Some other Race | 0 | 0.0% |
| Total | 650 | 100.0% |
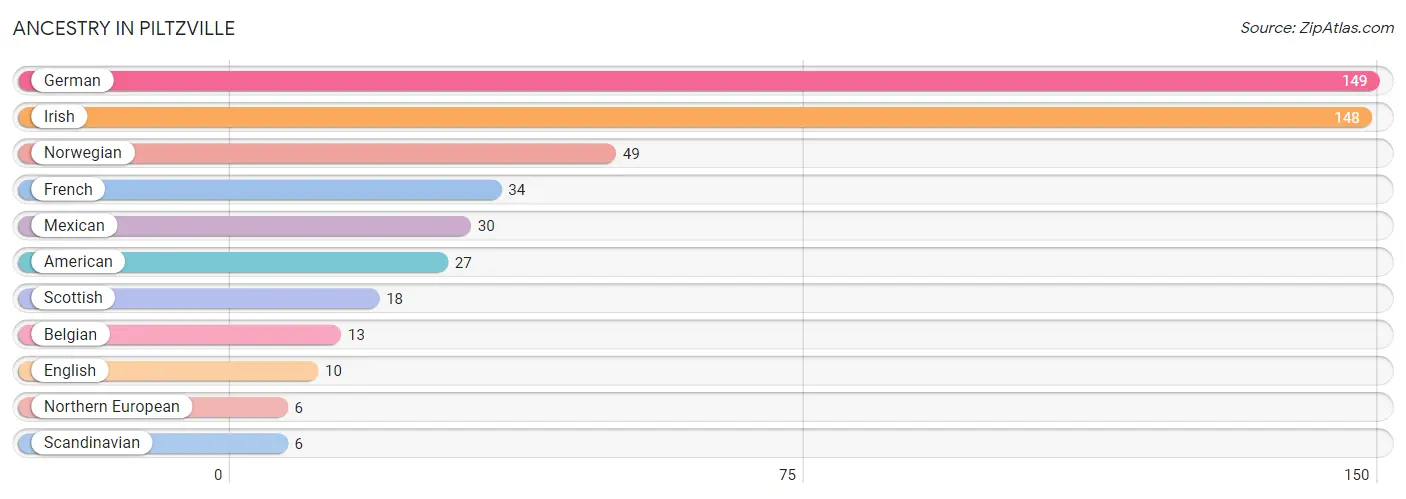
Ancestry in Piltzville
The most populous ancestries reported in Piltzville are German (149 | 22.9%), Irish (148 | 22.8%), Norwegian (49 | 7.5%), French (34 | 5.2%), and Mexican (30 | 4.6%), together accounting for 63.1% of all Piltzville residents.
| Ancestry | # Population | % Population |
| American | 27 | 4.2% |
| Belgian | 13 | 2.0% |
| English | 10 | 1.5% |
| French | 34 | 5.2% |
| German | 149 | 22.9% |
| Irish | 148 | 22.8% |
| Mexican | 30 | 4.6% |
| Northern European | 6 | 0.9% |
| Norwegian | 49 | 7.5% |
| Scandinavian | 6 | 0.9% |
| Scottish | 18 | 2.8% | View All 11 Rows |
Immigrants in Piltzville

| Immigration Origin | # Population | % Population | View All 0 Rows |
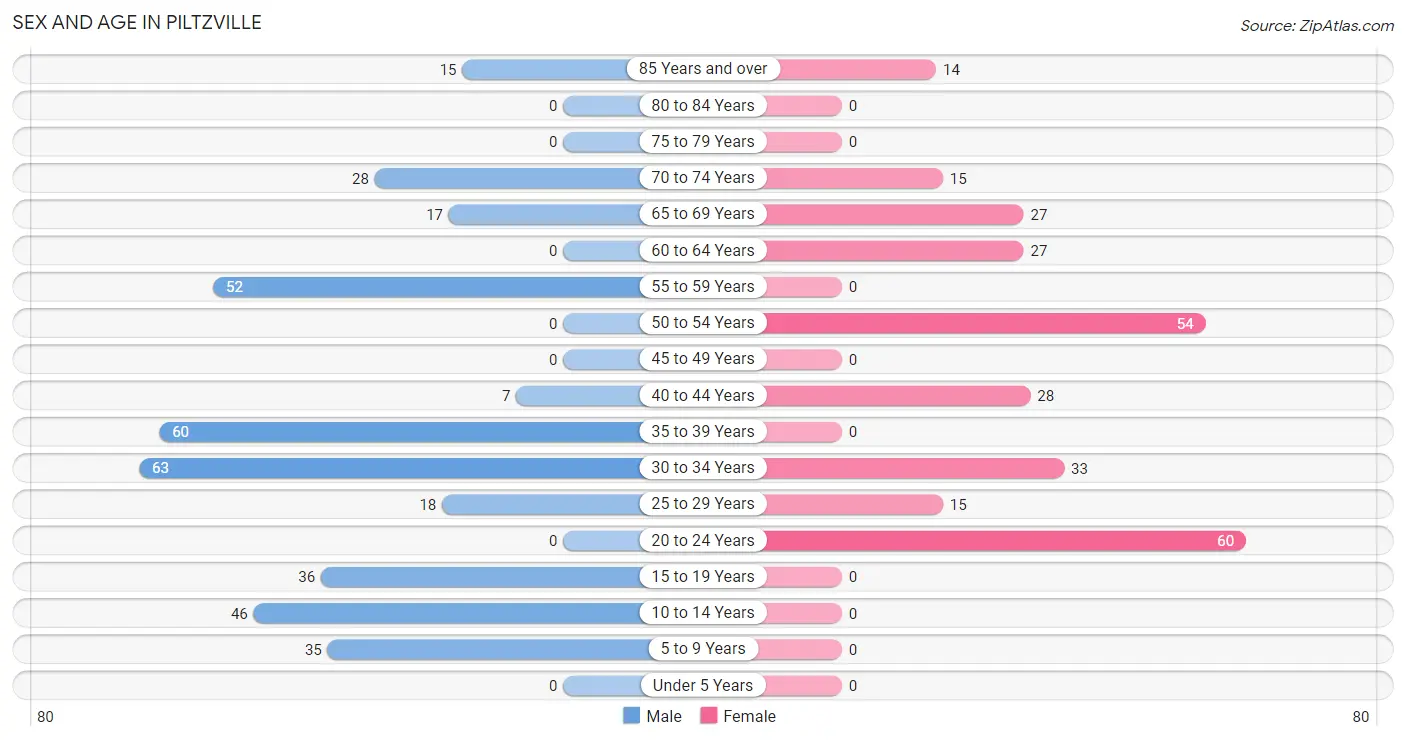
Sex and Age in Piltzville
Sex and Age in Piltzville
The most populous age groups in Piltzville are 30 to 34 Years (63 | 16.7%) for men and 20 to 24 Years (60 | 22.0%) for women.
| Age Bracket | Male | Female |
| Under 5 Years | 0 (0.0%) | 0 (0.0%) |
| 5 to 9 Years | 35 (9.3%) | 0 (0.0%) |
| 10 to 14 Years | 46 (12.2%) | 0 (0.0%) |
| 15 to 19 Years | 36 (9.6%) | 0 (0.0%) |
| 20 to 24 Years | 0 (0.0%) | 60 (22.0%) |
| 25 to 29 Years | 18 (4.8%) | 15 (5.5%) |
| 30 to 34 Years | 63 (16.7%) | 33 (12.1%) |
| 35 to 39 Years | 60 (15.9%) | 0 (0.0%) |
| 40 to 44 Years | 7 (1.9%) | 28 (10.3%) |
| 45 to 49 Years | 0 (0.0%) | 0 (0.0%) |
| 50 to 54 Years | 0 (0.0%) | 54 (19.8%) |
| 55 to 59 Years | 52 (13.8%) | 0 (0.0%) |
| 60 to 64 Years | 0 (0.0%) | 27 (9.9%) |
| 65 to 69 Years | 17 (4.5%) | 27 (9.9%) |
| 70 to 74 Years | 28 (7.4%) | 15 (5.5%) |
| 75 to 79 Years | 0 (0.0%) | 0 (0.0%) |
| 80 to 84 Years | 0 (0.0%) | 0 (0.0%) |
| 85 Years and over | 15 (4.0%) | 14 (5.1%) |
| Total | 377 (100.0%) | 273 (100.0%) |
Families and Households in Piltzville
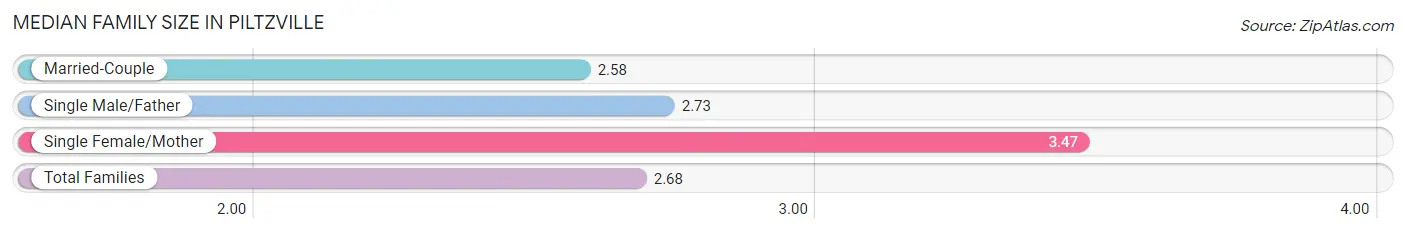
Median Family Size in Piltzville
The median family size in Piltzville is 2.68 persons per family, with single female/mother families (15 | 8.1%) accounting for the largest median family size of 3.47 persons per family. On the other hand, married-couple families (133 | 71.9%) represent the smallest median family size with 2.58 persons per family.
| Family Type | # Families | Family Size |
| Married-Couple | 133 (71.9%) | 2.58 |
| Single Male/Father | 37 (20.0%) | 2.73 |
| Single Female/Mother | 15 (8.1%) | 3.47 |
| Total Families | 185 (100.0%) | 2.68 |
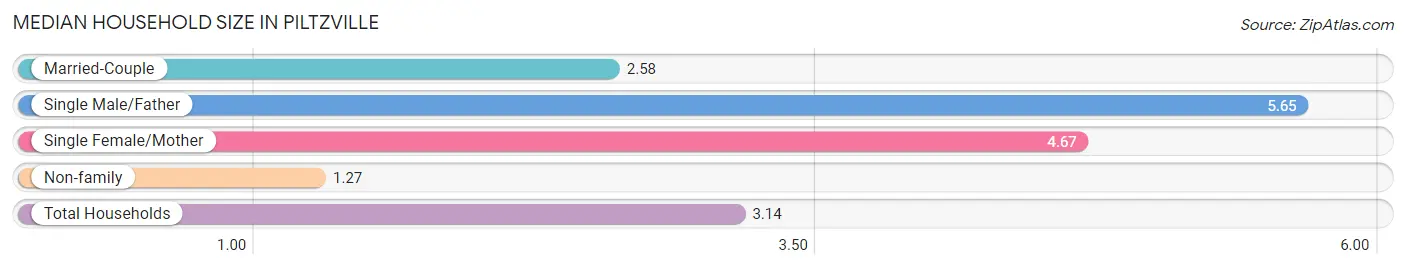
Median Household Size in Piltzville
The median household size in Piltzville is 3.14 persons per household, with single male/father households (37 | 17.9%) accounting for the largest median household size of 5.65 persons per household. non-family households (22 | 10.6%) represent the smallest median household size with 1.27 persons per household.
| Household Type | # Households | Household Size |
| Married-Couple | 133 (64.2%) | 2.58 |
| Single Male/Father | 37 (17.9%) | 5.65 |
| Single Female/Mother | 15 (7.2%) | 4.67 |
| Non-family | 22 (10.6%) | 1.27 |
| Total Households | 207 (100.0%) | 3.14 |
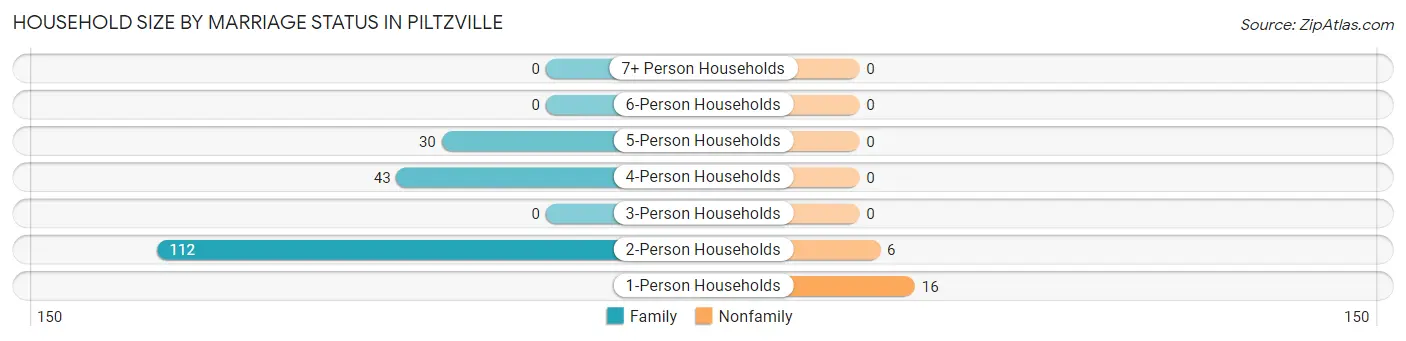
Household Size by Marriage Status in Piltzville
Out of a total of 207 households in Piltzville, 185 (89.4%) are family households, while 22 (10.6%) are nonfamily households. The most numerous type of family households are 2-person households, comprising 112, and the most common type of nonfamily households are 1-person households, comprising 16.
| Household Size | Family Households | Nonfamily Households |
| 1-Person Households | - | 16 (7.7%) |
| 2-Person Households | 112 (54.1%) | 6 (2.9%) |
| 3-Person Households | 0 (0.0%) | 0 (0.0%) |
| 4-Person Households | 43 (20.8%) | 0 (0.0%) |
| 5-Person Households | 30 (14.5%) | 0 (0.0%) |
| 6-Person Households | 0 (0.0%) | 0 (0.0%) |
| 7+ Person Households | 0 (0.0%) | 0 (0.0%) |
| Total | 185 (89.4%) | 22 (10.6%) |
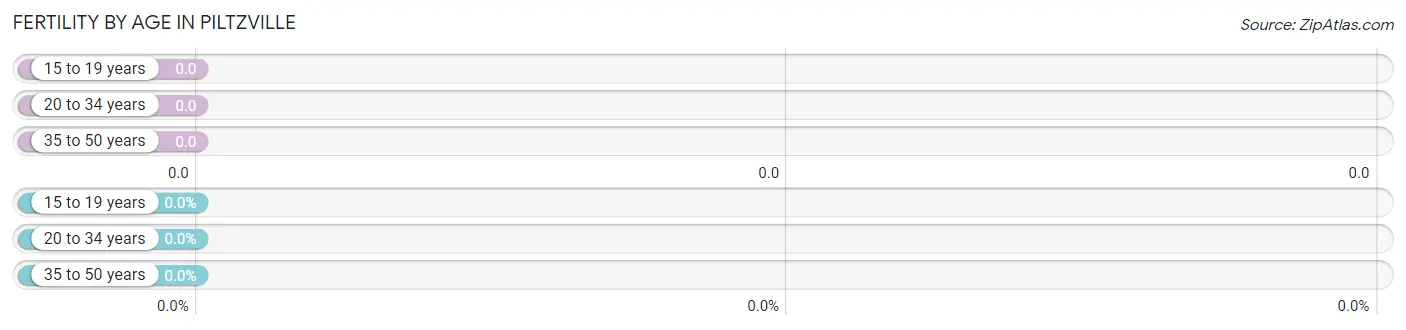
Female Fertility in Piltzville
Fertility by Age in Piltzville
| Age Bracket | Women with Births | Births / 1,000 Women |
| 15 to 19 years | 0 (0.0%) | 0.0 |
| 20 to 34 years | 0 (0.0%) | 0.0 |
| 35 to 50 years | 0 (0.0%) | 0.0 |
| Total | 0 (0.0%) | 0.0 |
Fertility by Age by Marriage Status in Piltzville
| Age Bracket | Married | Unmarried |
| 15 to 19 years | 0 (0.0%) | 0 (0.0%) |
| 20 to 34 years | 0 (0.0%) | 0 (0.0%) |
| 35 to 50 years | 0 (0.0%) | 0 (0.0%) |
| Total | 0 (0.0%) | 0 (0.0%) |
Fertility by Education in Piltzville
| Educational Attainment | Women with Births | Births / 1,000 Women |
| Less than High School | 0 (0.0%) | 0.0 |
| High School Diploma | 0 (0.0%) | 0.0 |
| College or Associate's Degree | 0 (0.0%) | 0.0 |
| Bachelor's Degree | 0 (0.0%) | 0.0 |
| Graduate Degree | 0 (0.0%) | 0.0 |
| Total | 0 (0.0%) | 0.0 |
Fertility by Education by Marriage Status in Piltzville
| Educational Attainment | Married | Unmarried |
| Less than High School | 0 (0.0%) | 0 (0.0%) |
| High School Diploma | 0 (0.0%) | 0 (0.0%) |
| College or Associate's Degree | 0 (0.0%) | 0 (0.0%) |
| Bachelor's Degree | 0 (0.0%) | 0 (0.0%) |
| Graduate Degree | 0 (0.0%) | 0 (0.0%) |
| Total | 0 (0.0%) | 0 (0.0%) |
Income in Piltzville
Income Overview in Piltzville
Per Capita Income in Piltzville is $29,329, while median incomes of families and households are $94,256 and $94,851 respectively.
| Characteristic | Number | Measure |
| Per Capita Income | 650 | $29,329 |
| Median Family Income | 185 | $94,256 |
| Mean Family Income | 185 | $87,848 |
| Median Household Income | 207 | $94,851 |
| Mean Household Income | 207 | $86,557 |
| Income Deficit | 185 | $0 |
| Wage / Income Gap (%) | 650 | 37.35% |
| Wage / Income Gap ($) | 650 | 62.65¢ per $1 |
| Gini / Inequality Index | 650 | 0.16 |
Earnings by Sex in Piltzville
Average Earnings in Piltzville are $27,127, $36,542 for men and $22,894 for women, a difference of 37.3%.
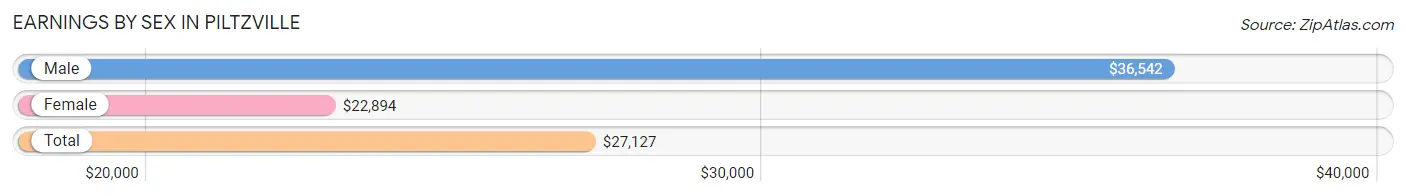
| Sex | Number | Average Earnings |
| Male | 260 (56.2%) | $36,542 |
| Female | 203 (43.8%) | $22,894 |
| Total | 463 (100.0%) | $27,127 |
Earnings by Sex by Income Bracket in Piltzville
The most common earnings brackets in Piltzville are $35,000 to $39,999 for men (60 | 23.1%) and $22,500 to $24,999 for women (54 | 26.6%).
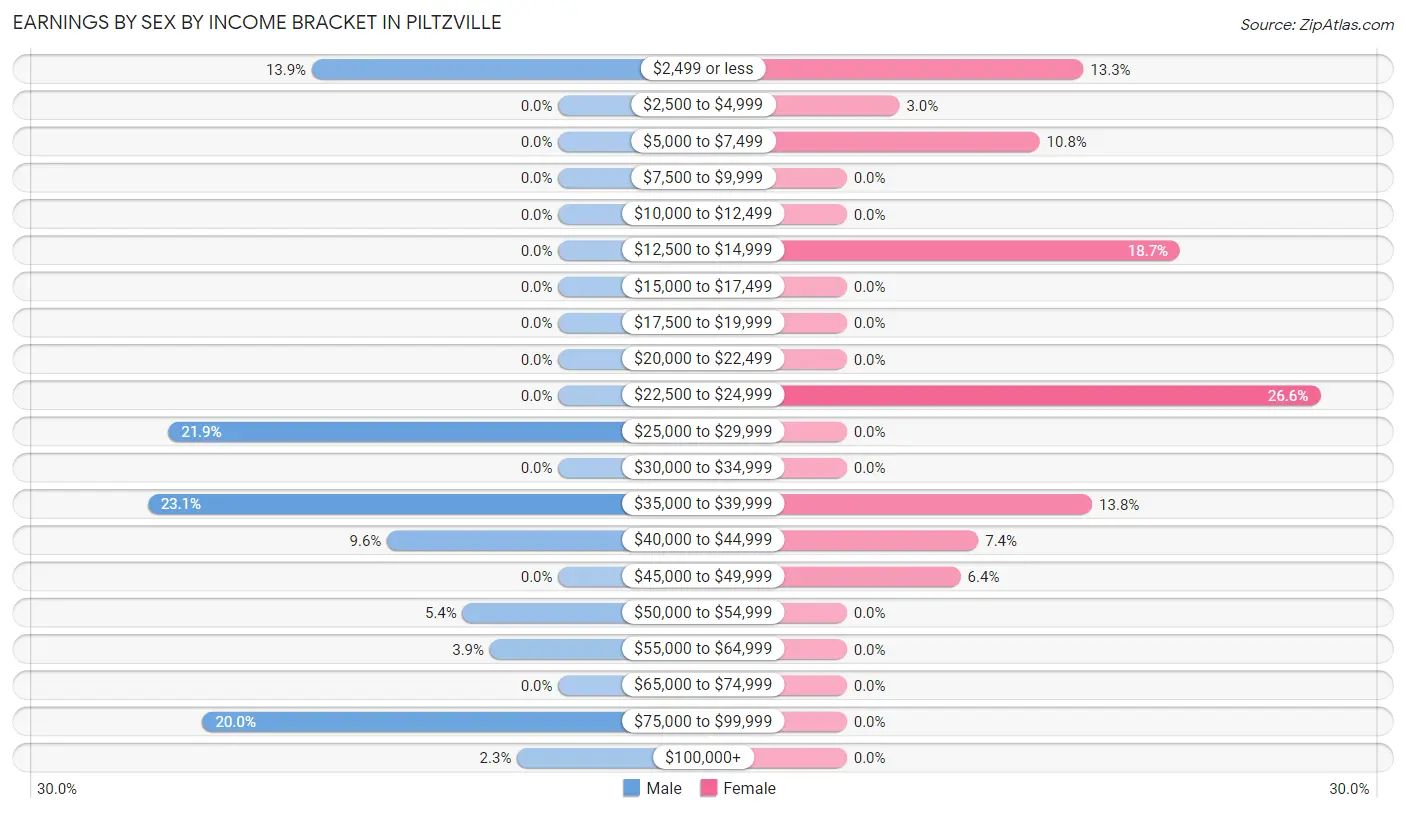
| Income | Male | Female |
| $2,499 or less | 36 (13.9%) | 27 (13.3%) |
| $2,500 to $4,999 | 0 (0.0%) | 6 (3.0%) |
| $5,000 to $7,499 | 0 (0.0%) | 22 (10.8%) |
| $7,500 to $9,999 | 0 (0.0%) | 0 (0.0%) |
| $10,000 to $12,499 | 0 (0.0%) | 0 (0.0%) |
| $12,500 to $14,999 | 0 (0.0%) | 38 (18.7%) |
| $15,000 to $17,499 | 0 (0.0%) | 0 (0.0%) |
| $17,500 to $19,999 | 0 (0.0%) | 0 (0.0%) |
| $20,000 to $22,499 | 0 (0.0%) | 0 (0.0%) |
| $22,500 to $24,999 | 0 (0.0%) | 54 (26.6%) |
| $25,000 to $29,999 | 57 (21.9%) | 0 (0.0%) |
| $30,000 to $34,999 | 0 (0.0%) | 0 (0.0%) |
| $35,000 to $39,999 | 60 (23.1%) | 28 (13.8%) |
| $40,000 to $44,999 | 25 (9.6%) | 15 (7.4%) |
| $45,000 to $49,999 | 0 (0.0%) | 13 (6.4%) |
| $50,000 to $54,999 | 14 (5.4%) | 0 (0.0%) |
| $55,000 to $64,999 | 10 (3.8%) | 0 (0.0%) |
| $65,000 to $74,999 | 0 (0.0%) | 0 (0.0%) |
| $75,000 to $99,999 | 52 (20.0%) | 0 (0.0%) |
| $100,000+ | 6 (2.3%) | 0 (0.0%) |
| Total | 260 (100.0%) | 203 (100.0%) |
Earnings by Sex by Educational Attainment in Piltzville
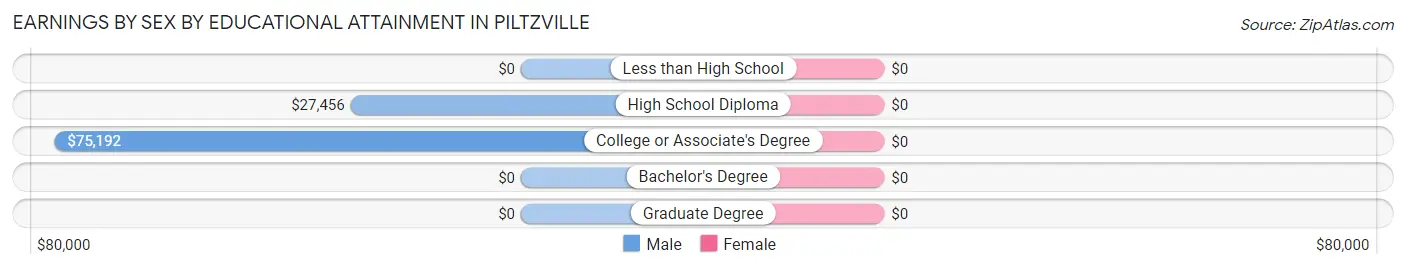
| Educational Attainment | Male Income | Female Income |
| Less than High School | - | - |
| High School Diploma | $27,456 | $0 |
| College or Associate's Degree | $75,192 | $0 |
| Bachelor's Degree | - | - |
| Graduate Degree | - | - |
| Total | $37,292 | $24,282 |
Family Income in Piltzville
Family Income Brackets in Piltzville
According to the Piltzville family income data, there are 66 families falling into the $100,000 to $149,999 income range, which is the most common income bracket and makes up 35.7% of all families.
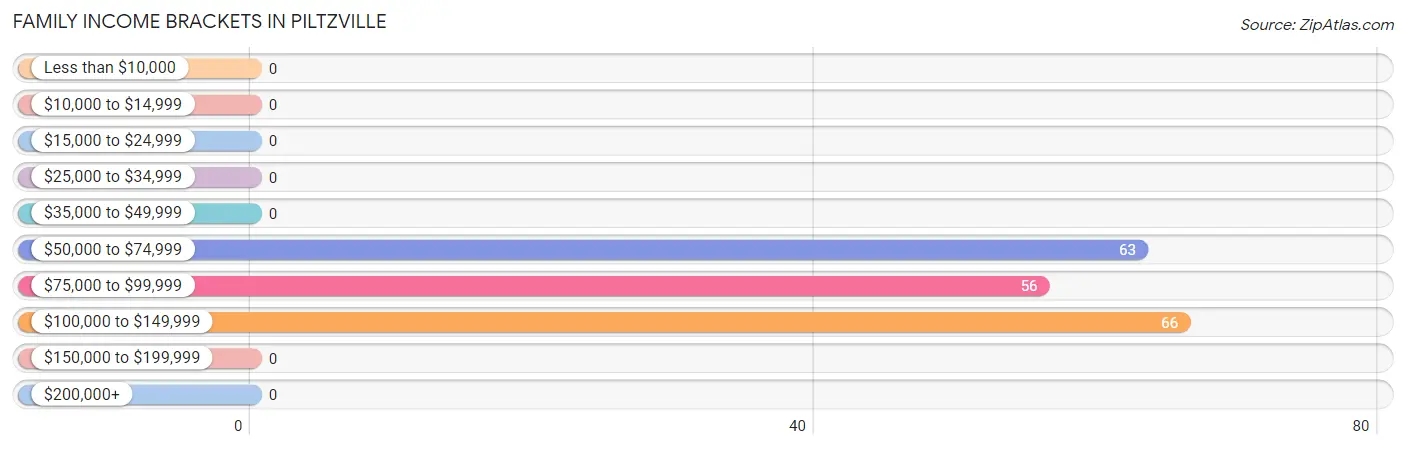
| Income Bracket | # Families | % Families |
| Less than $10,000 | 0 | 0.0% |
| $10,000 to $14,999 | 0 | 0.0% |
| $15,000 to $24,999 | 0 | 0.0% |
| $25,000 to $34,999 | 0 | 0.0% |
| $35,000 to $49,999 | 0 | 0.0% |
| $50,000 to $74,999 | 63 | 34.1% |
| $75,000 to $99,999 | 56 | 30.3% |
| $100,000 to $149,999 | 66 | 35.7% |
| $150,000 to $199,999 | 0 | 0.0% |
| $200,000+ | 0 | 0.0% |
Family Income by Famaliy Size in Piltzville
2-person families (142 | 76.8%) account for the highest median family income in Piltzville with $96,607 per family, while 2-person families (142 | 76.8%) have the highest median income of $48,304 per family member.
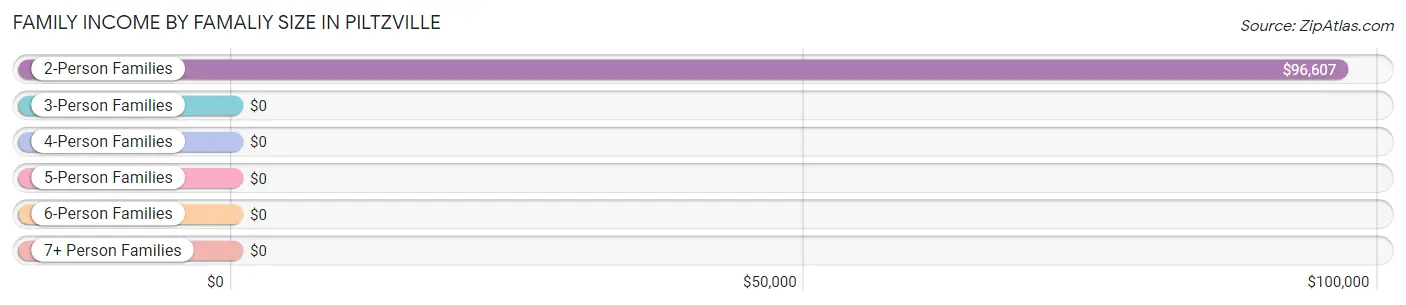
| Income Bracket | # Families | Median Income |
| 2-Person Families | 142 (76.8%) | $96,607 |
| 3-Person Families | 15 (8.1%) | $0 |
| 4-Person Families | 28 (15.1%) | $0 |
| 5-Person Families | 0 (0.0%) | $0 |
| 6-Person Families | 0 (0.0%) | $0 |
| 7+ Person Families | 0 (0.0%) | $0 |
| Total | 185 (100.0%) | $94,256 |
Family Income by Number of Earners in Piltzville
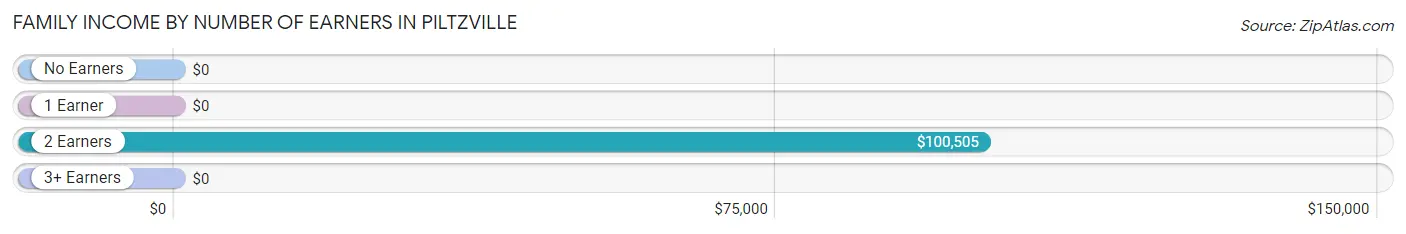
| Number of Earners | # Families | Median Income |
| No Earners | 28 (15.1%) | $0 |
| 1 Earner | 18 (9.7%) | $0 |
| 2 Earners | 111 (60.0%) | $100,505 |
| 3+ Earners | 28 (15.1%) | $0 |
| Total | 185 (100.0%) | $94,256 |
Household Income in Piltzville
Household Income Brackets in Piltzville
With 87 households falling in the category, the $100,000 to $149,999 income range is the most frequent in Piltzville, accounting for 42.0% of all households.
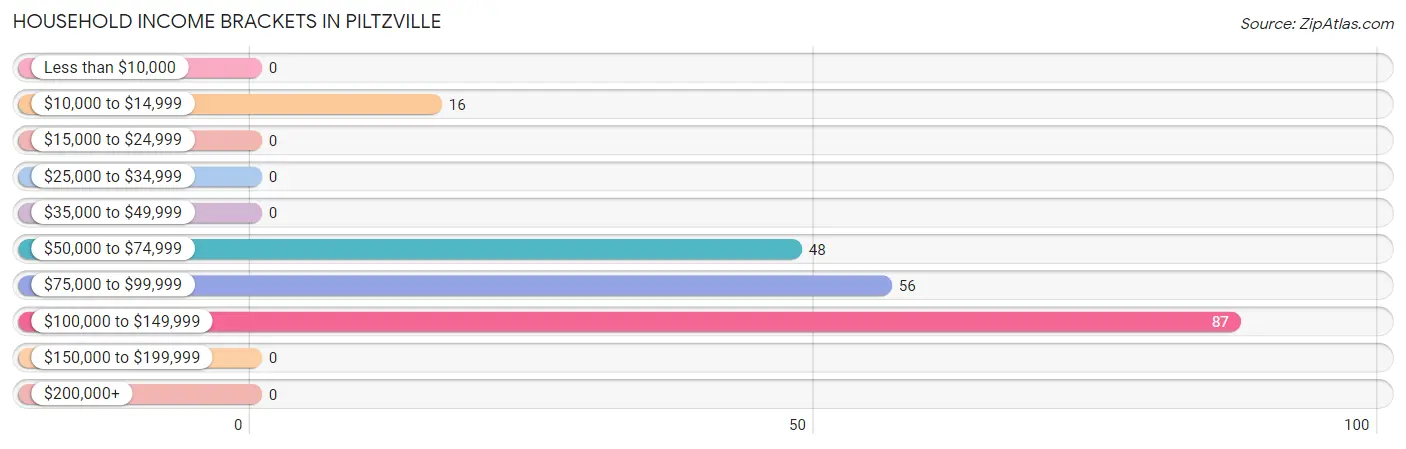
| Income Bracket | # Households | % Households |
| Less than $10,000 | 0 | 0.0% |
| $10,000 to $14,999 | 16 | 7.7% |
| $15,000 to $24,999 | 0 | 0.0% |
| $25,000 to $34,999 | 0 | 0.0% |
| $35,000 to $49,999 | 0 | 0.0% |
| $50,000 to $74,999 | 48 | 23.2% |
| $75,000 to $99,999 | 56 | 27.1% |
| $100,000 to $149,999 | 87 | 42.0% |
| $150,000 to $199,999 | 0 | 0.0% |
| $200,000+ | 0 | 0.0% |
Household Income by Householder Age in Piltzville
The median household income in Piltzville is $94,851, with the highest median household income of $100,601 found in the 45 to 64 years age bracket for the primary householder. A total of 79 households (38.2%) fall into this category.
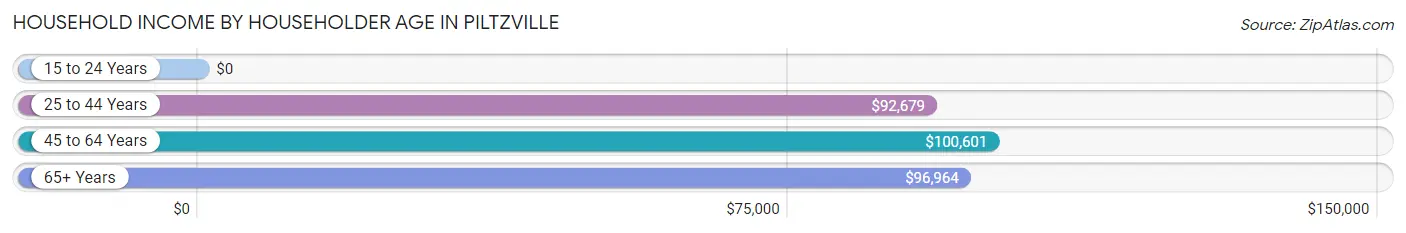
| Income Bracket | # Households | Median Income |
| 15 to 24 Years | 0 (0.0%) | $0 |
| 25 to 44 Years | 64 (30.9%) | $92,679 |
| 45 to 64 Years | 79 (38.2%) | $100,601 |
| 65+ Years | 64 (30.9%) | $96,964 |
| Total | 207 (100.0%) | $94,851 |
Poverty in Piltzville
Income Below Poverty by Sex and Age in Piltzville
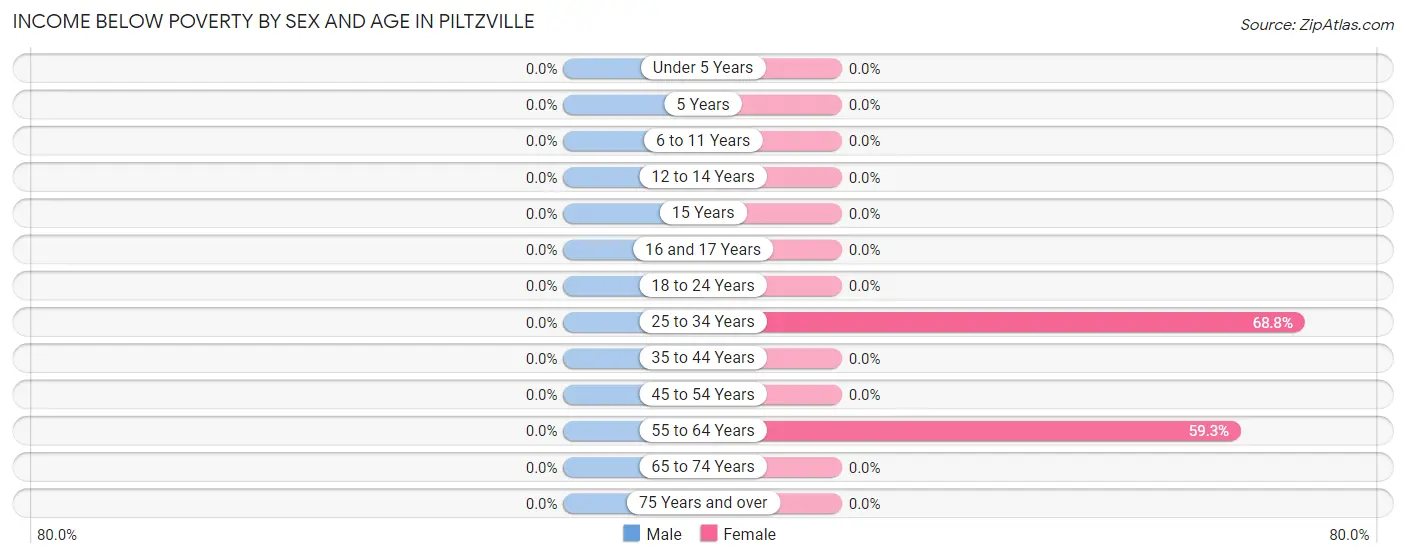
| Age Bracket | Male | Female |
| Under 5 Years | 0 (0.0%) | 0 (0.0%) |
| 5 Years | 0 (0.0%) | 0 (0.0%) |
| 6 to 11 Years | 0 (0.0%) | 0 (0.0%) |
| 12 to 14 Years | 0 (0.0%) | 0 (0.0%) |
| 15 Years | 0 (0.0%) | 0 (0.0%) |
| 16 and 17 Years | 0 (0.0%) | 0 (0.0%) |
| 18 to 24 Years | 0 (0.0%) | 0 (0.0%) |
| 25 to 34 Years | 0 (0.0%) | 33 (68.8%) |
| 35 to 44 Years | 0 (0.0%) | 0 (0.0%) |
| 45 to 54 Years | 0 (0.0%) | 0 (0.0%) |
| 55 to 64 Years | 0 (0.0%) | 16 (59.3%) |
| 65 to 74 Years | 0 (0.0%) | 0 (0.0%) |
| 75 Years and over | 0 (0.0%) | 0 (0.0%) |
| Total | 0 (0.0%) | 49 (17.9%) |
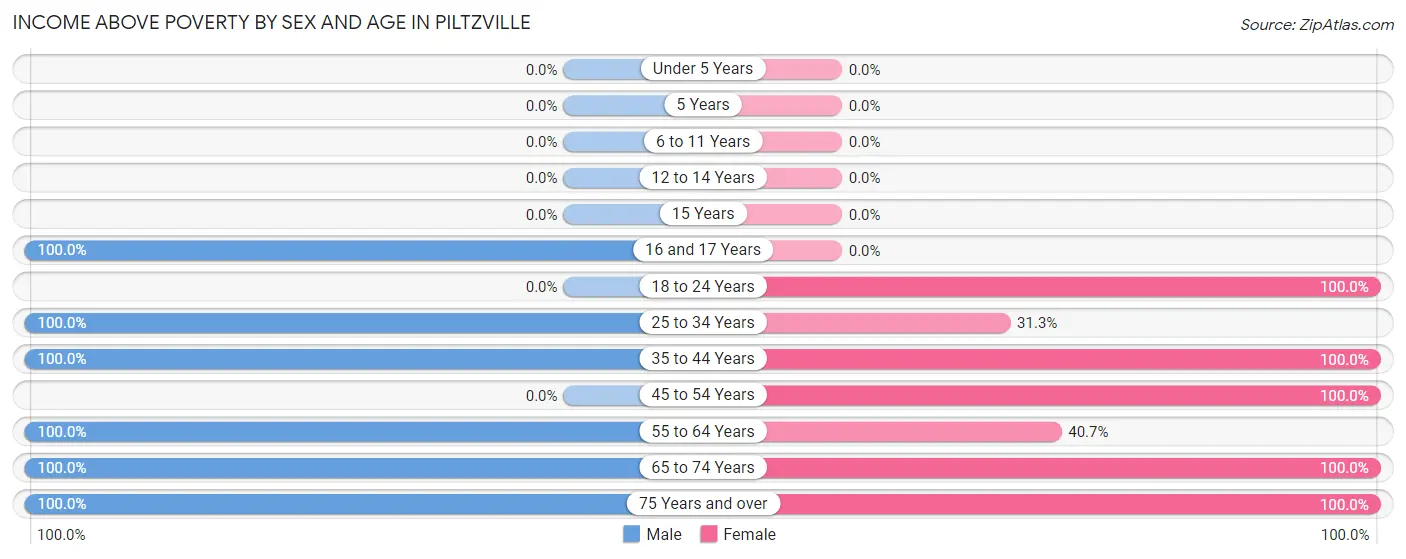
Income Above Poverty by Sex and Age in Piltzville
According to the poverty statistics in Piltzville, males aged 16 and 17 years and females aged 18 to 24 years are the age groups that are most secure financially, with 100.0% of males and 100.0% of females in these age groups living above the poverty line.
| Age Bracket | Male | Female |
| Under 5 Years | 0 (0.0%) | 0 (0.0%) |
| 5 Years | 0 (0.0%) | 0 (0.0%) |
| 6 to 11 Years | 0 (0.0%) | 0 (0.0%) |
| 12 to 14 Years | 0 (0.0%) | 0 (0.0%) |
| 15 Years | 0 (0.0%) | 0 (0.0%) |
| 16 and 17 Years | 36 (100.0%) | 0 (0.0%) |
| 18 to 24 Years | 0 (0.0%) | 60 (100.0%) |
| 25 to 34 Years | 81 (100.0%) | 15 (31.2%) |
| 35 to 44 Years | 67 (100.0%) | 28 (100.0%) |
| 45 to 54 Years | 0 (0.0%) | 54 (100.0%) |
| 55 to 64 Years | 52 (100.0%) | 11 (40.7%) |
| 65 to 74 Years | 45 (100.0%) | 42 (100.0%) |
| 75 Years and over | 15 (100.0%) | 14 (100.0%) |
| Total | 296 (100.0%) | 224 (82.1%) |
Income Below Poverty Among Married-Couple Families in Piltzville
| Children | Above Poverty | Below Poverty |
| No Children | 105 (100.0%) | 0 (0.0%) |
| 1 or 2 Children | 28 (100.0%) | 0 (0.0%) |
| 3 or 4 Children | 0 (0.0%) | 0 (0.0%) |
| 5 or more Children | 0 (0.0%) | 0 (0.0%) |
| Total | 133 (100.0%) | 0 (0.0%) |
Income Below Poverty Among Single-Parent Households in Piltzville
| Children | Single Father | Single Mother |
| No Children | 0 (0.0%) | 0 (0.0%) |
| 1 or 2 Children | 0 (0.0%) | 0 (0.0%) |
| 3 or 4 Children | 0 (0.0%) | 0 (0.0%) |
| 5 or more Children | 0 (0.0%) | 0 (0.0%) |
| Total | 0 (0.0%) | 0 (0.0%) |
Income Below Poverty Among Married-Couple vs Single-Parent Households in Piltzville
| Children | Married-Couple Families | Single-Parent Households |
| No Children | 0 (0.0%) | 0 (0.0%) |
| 1 or 2 Children | 0 (0.0%) | 0 (0.0%) |
| 3 or 4 Children | 0 (0.0%) | 0 (0.0%) |
| 5 or more Children | 0 (0.0%) | 0 (0.0%) |
| Total | 0 (0.0%) | 0 (0.0%) |
Employment Characteristics in Piltzville
Employment by Class of Employer in Piltzville
Among the 436 employed individuals in Piltzville, private company employees (259 | 59.4%), not-for-profit organizations (109 | 25.0%), and state government employees (38 | 8.7%) make up the most common classes of employment.
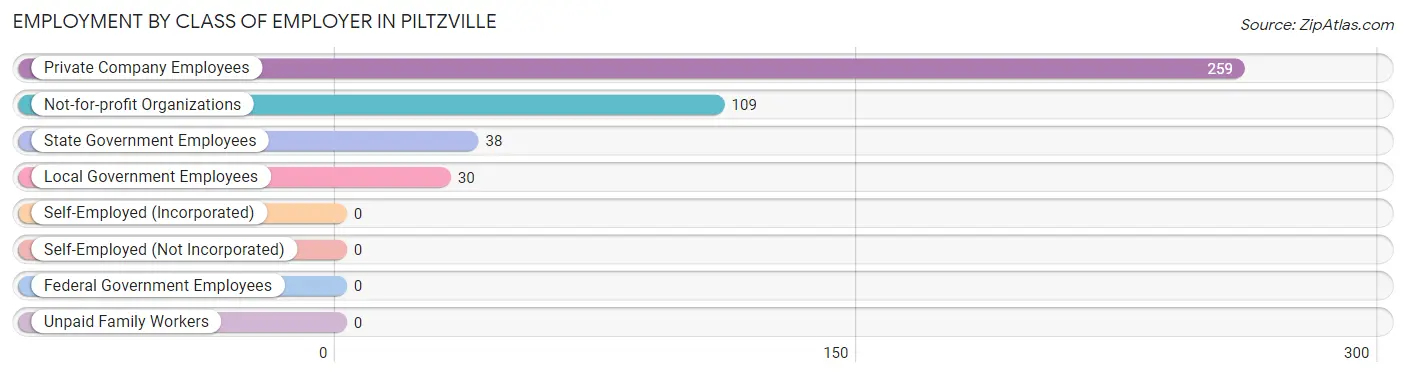
| Employer Class | # Employees | % Employees |
| Private Company Employees | 259 | 59.4% |
| Self-Employed (Incorporated) | 0 | 0.0% |
| Self-Employed (Not Incorporated) | 0 | 0.0% |
| Not-for-profit Organizations | 109 | 25.0% |
| Local Government Employees | 30 | 6.9% |
| State Government Employees | 38 | 8.7% |
| Federal Government Employees | 0 | 0.0% |
| Unpaid Family Workers | 0 | 0.0% |
| Total | 436 | 100.0% |
Employment Status by Age in Piltzville
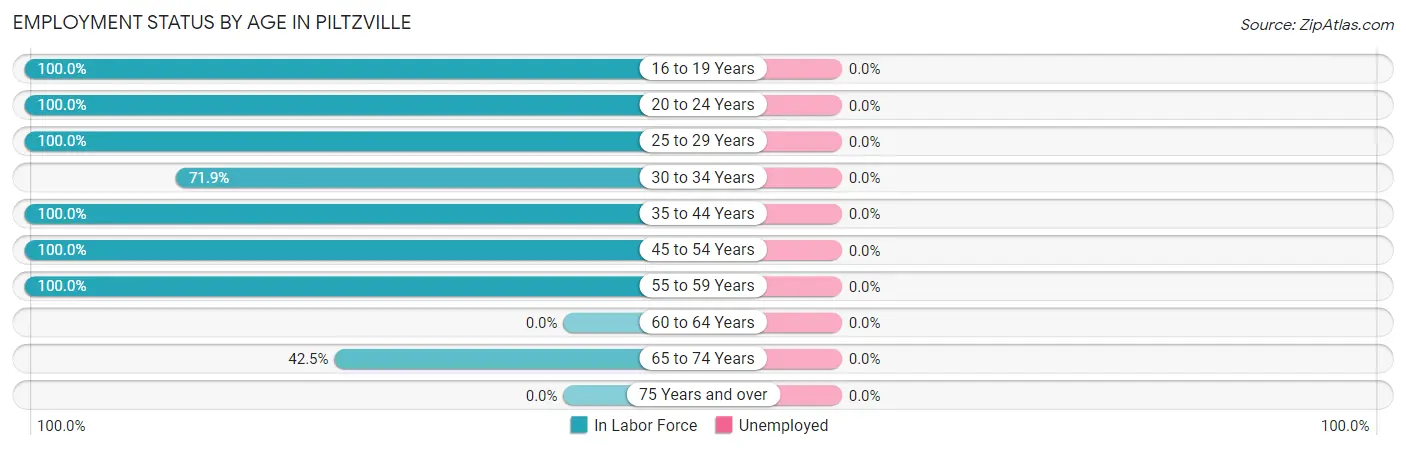
| Age Bracket | In Labor Force | Unemployed |
| 16 to 19 Years | 36 (100.0%) | 0 (0.0%) |
| 20 to 24 Years | 60 (100.0%) | 0 (0.0%) |
| 25 to 29 Years | 33 (100.0%) | 0 (0.0%) |
| 30 to 34 Years | 69 (71.9%) | 0 (0.0%) |
| 35 to 44 Years | 95 (100.0%) | 0 (0.0%) |
| 45 to 54 Years | 54 (100.0%) | 0 (0.0%) |
| 55 to 59 Years | 52 (100.0%) | 0 (0.0%) |
| 60 to 64 Years | 0 (0.0%) | 0 (0.0%) |
| 65 to 74 Years | 37 (42.5%) | 0 (0.0%) |
| 75 Years and over | 0 (0.0%) | 0 (0.0%) |
| Total | 436 (76.6%) | 0 (0.0%) |
Employment Status by Educational Attainment in Piltzville
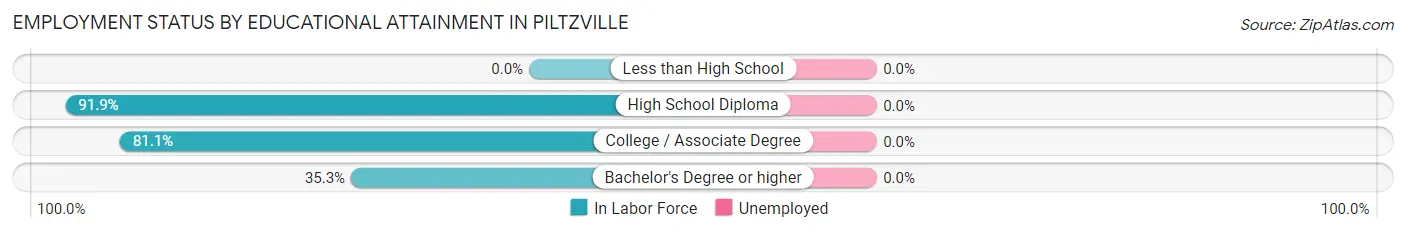
| Educational Attainment | In Labor Force | Unemployed |
| Less than High School | 0 (0.0%) | 0 (0.0%) |
| High School Diploma | 181 (91.9%) | 0 (0.0%) |
| College / Associate Degree | 116 (81.1%) | 0 (0.0%) |
| Bachelor's Degree or higher | 6 (35.3%) | 0 (0.0%) |
| Total | 303 (84.9%) | 0 (0.0%) |
Employment Occupations by Sex in Piltzville
Management, Business, Science and Arts Occupations
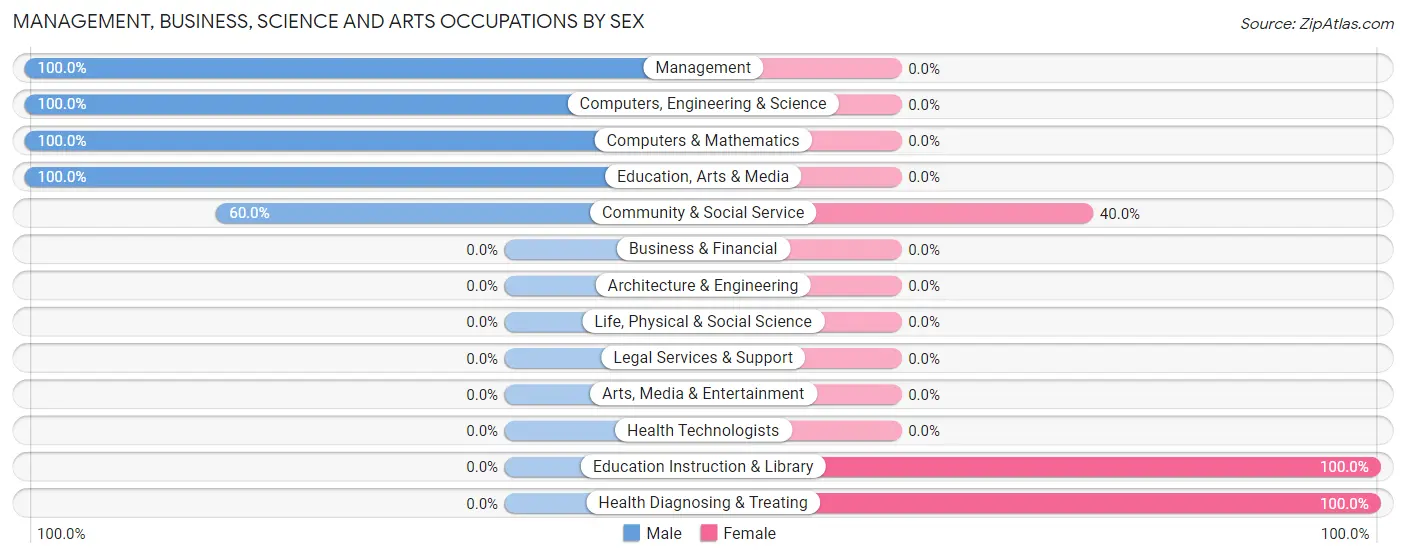
The most common Management, Business, Science and Arts occupations in Piltzville are Community & Social Service (95 | 21.8%), Management (62 | 14.2%), Education, Arts & Media (57 | 13.1%), Education Instruction & Library (38 | 8.7%), and Computers, Engineering & Science (30 | 6.9%).
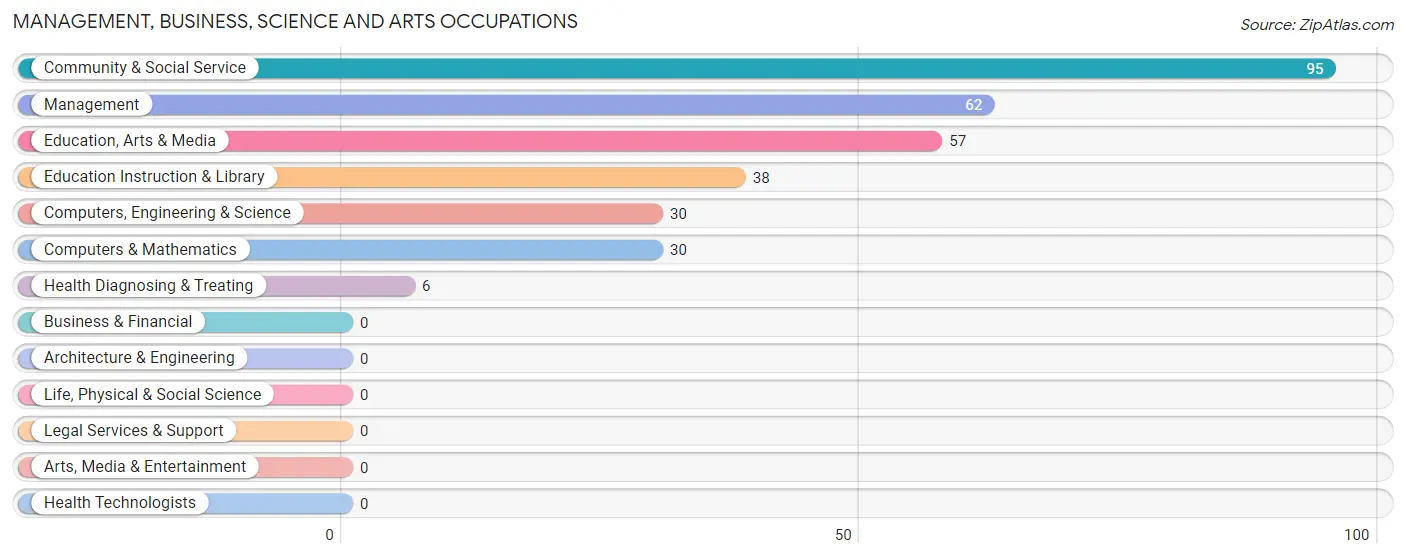
Management, Business, Science and Arts Occupations by Sex
Within the Management, Business, Science and Arts occupations in Piltzville, the most male-oriented occupations are Management (100.0%), Computers, Engineering & Science (100.0%), and Computers & Mathematics (100.0%), while the most female-oriented occupations are Education Instruction & Library (100.0%), Health Diagnosing & Treating (100.0%), and Community & Social Service (40.0%).
| Occupation | Male | Female |
| Management | 62 (100.0%) | 0 (0.0%) |
| Business & Financial | 0 (0.0%) | 0 (0.0%) |
| Computers, Engineering & Science | 30 (100.0%) | 0 (0.0%) |
| Computers & Mathematics | 30 (100.0%) | 0 (0.0%) |
| Architecture & Engineering | 0 (0.0%) | 0 (0.0%) |
| Life, Physical & Social Science | 0 (0.0%) | 0 (0.0%) |
| Community & Social Service | 57 (60.0%) | 38 (40.0%) |
| Education, Arts & Media | 57 (100.0%) | 0 (0.0%) |
| Legal Services & Support | 0 (0.0%) | 0 (0.0%) |
| Education Instruction & Library | 0 (0.0%) | 38 (100.0%) |
| Arts, Media & Entertainment | 0 (0.0%) | 0 (0.0%) |
| Health Diagnosing & Treating | 0 (0.0%) | 6 (100.0%) |
| Health Technologists | 0 (0.0%) | 0 (0.0%) |
| Total (Category) | 149 (77.2%) | 44 (22.8%) |
| Total (Overall) | 260 (59.6%) | 176 (40.4%) |
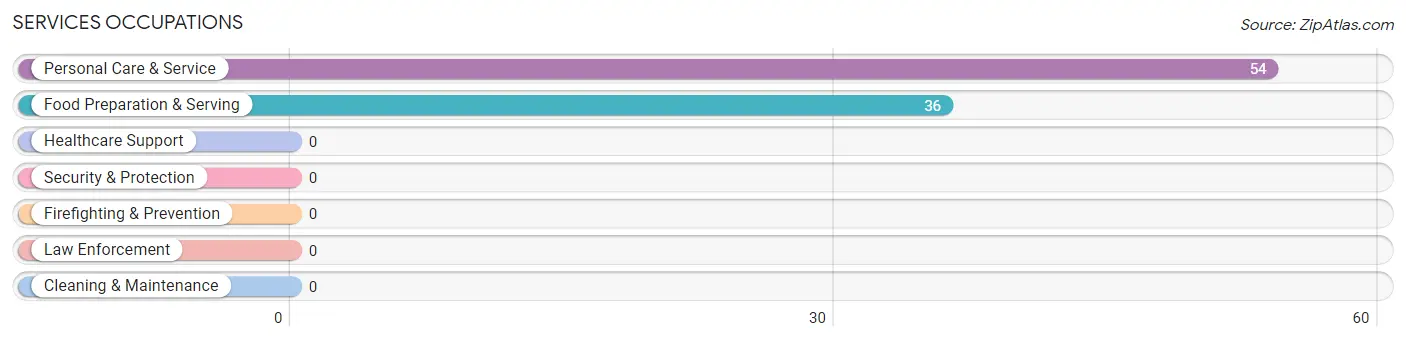
Services Occupations
The most common Services occupations in Piltzville are Personal Care & Service (54 | 12.4%), and Food Preparation & Serving (36 | 8.3%).
Services Occupations by Sex
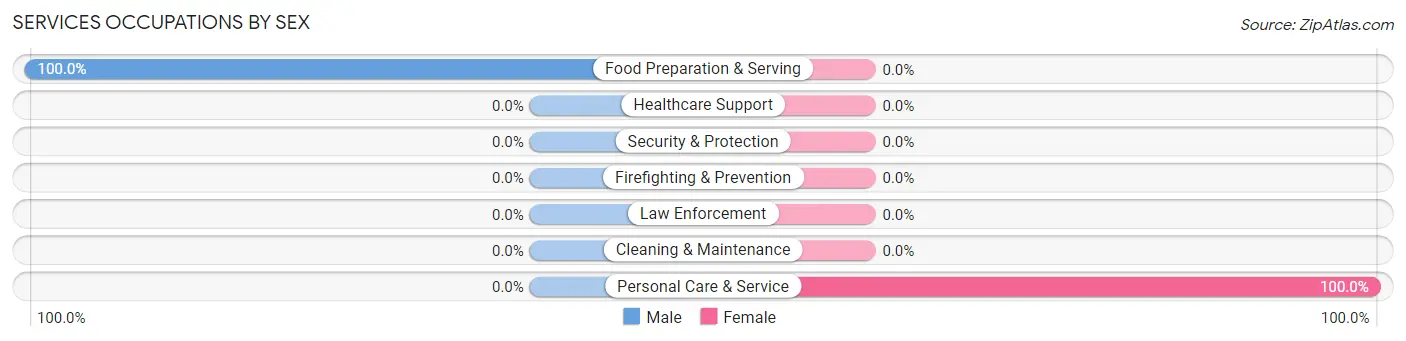
| Occupation | Male | Female |
| Healthcare Support | 0 (0.0%) | 0 (0.0%) |
| Security & Protection | 0 (0.0%) | 0 (0.0%) |
| Firefighting & Prevention | 0 (0.0%) | 0 (0.0%) |
| Law Enforcement | 0 (0.0%) | 0 (0.0%) |
| Food Preparation & Serving | 36 (100.0%) | 0 (0.0%) |
| Cleaning & Maintenance | 0 (0.0%) | 0 (0.0%) |
| Personal Care & Service | 0 (0.0%) | 54 (100.0%) |
| Total (Category) | 36 (40.0%) | 54 (60.0%) |
| Total (Overall) | 260 (59.6%) | 176 (40.4%) |
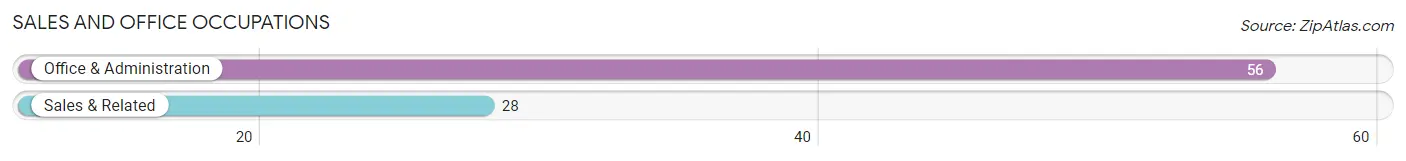
Sales and Office Occupations
The most common Sales and Office occupations in Piltzville are Office & Administration (56 | 12.8%), and Sales & Related (28 | 6.4%).
Sales and Office Occupations by Sex

| Occupation | Male | Female |
| Sales & Related | 6 (21.4%) | 22 (78.6%) |
| Office & Administration | 0 (0.0%) | 56 (100.0%) |
| Total (Category) | 6 (7.1%) | 78 (92.9%) |
| Total (Overall) | 260 (59.6%) | 176 (40.4%) |
Natural Resources, Construction and Maintenance Occupations
The most common Natural Resources, Construction and Maintenance occupations in Piltzville are , and Construction & Extraction (30 | 6.9%).
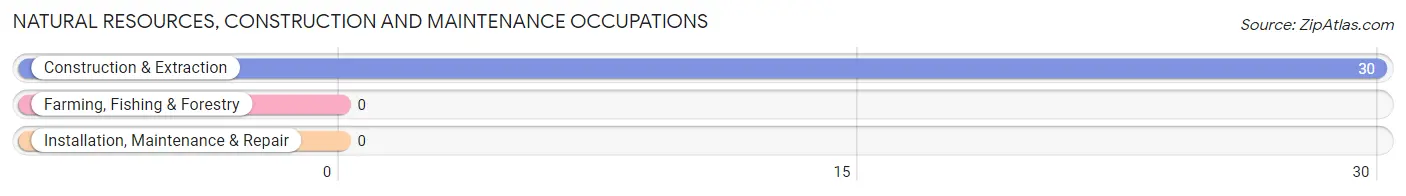
Natural Resources, Construction and Maintenance Occupations by Sex

| Occupation | Male | Female |
| Farming, Fishing & Forestry | 0 (0.0%) | 0 (0.0%) |
| Construction & Extraction | 30 (100.0%) | 0 (0.0%) |
| Installation, Maintenance & Repair | 0 (0.0%) | 0 (0.0%) |
| Total (Category) | 30 (100.0%) | 0 (0.0%) |
| Total (Overall) | 260 (59.6%) | 176 (40.4%) |
Production, Transportation and Moving Occupations
The most common Production, Transportation and Moving occupations in Piltzville are Production (25 | 5.7%), and Material Moving (14 | 3.2%).
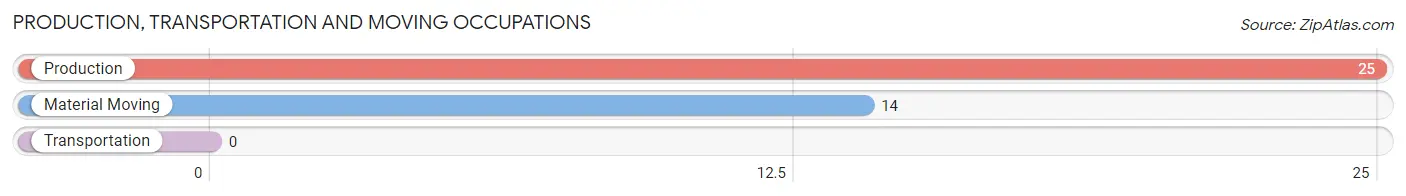
Production, Transportation and Moving Occupations by Sex
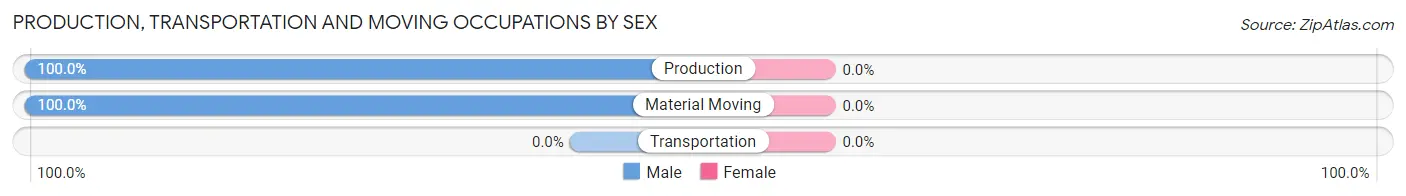
| Occupation | Male | Female |
| Production | 25 (100.0%) | 0 (0.0%) |
| Transportation | 0 (0.0%) | 0 (0.0%) |
| Material Moving | 14 (100.0%) | 0 (0.0%) |
| Total (Category) | 39 (100.0%) | 0 (0.0%) |
| Total (Overall) | 260 (59.6%) | 176 (40.4%) |
Employment Industries by Sex in Piltzville
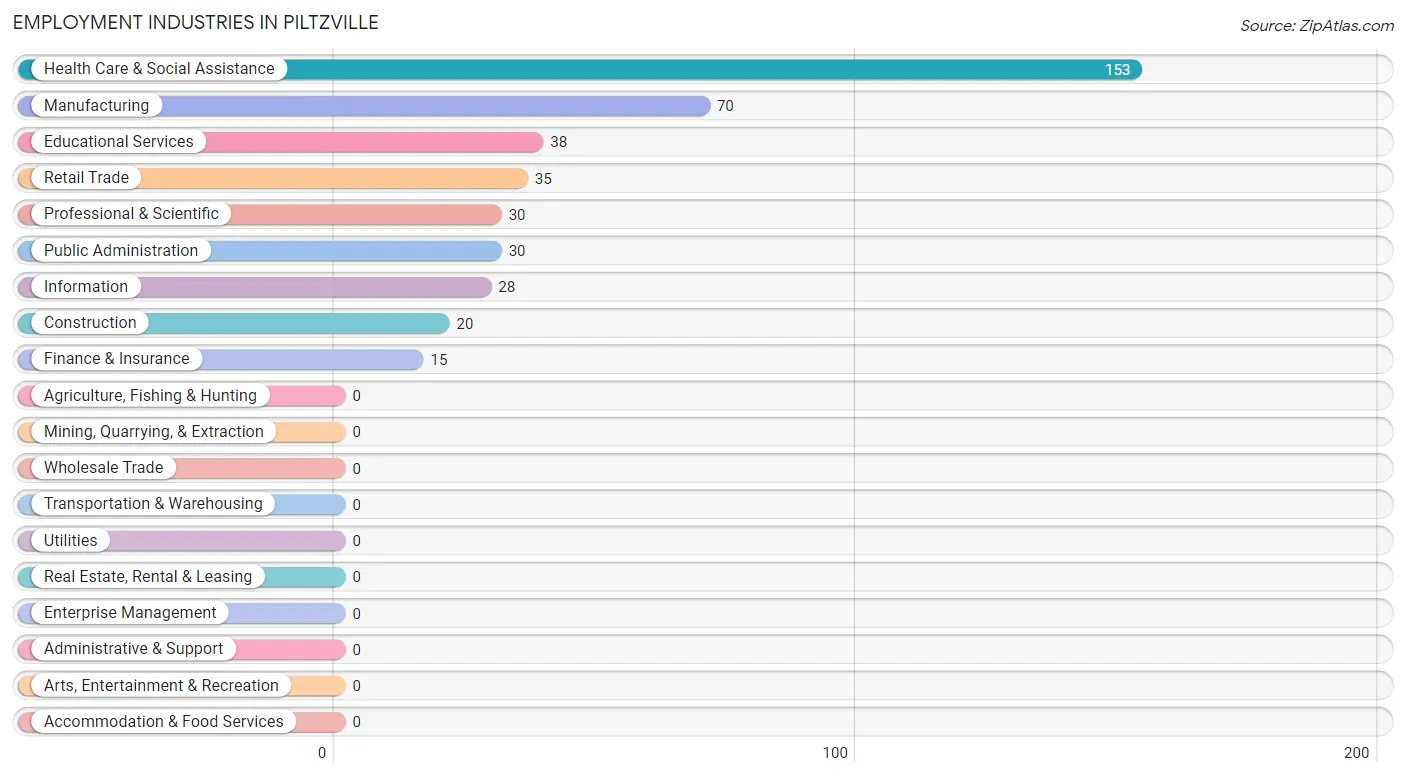
Employment Industries in Piltzville
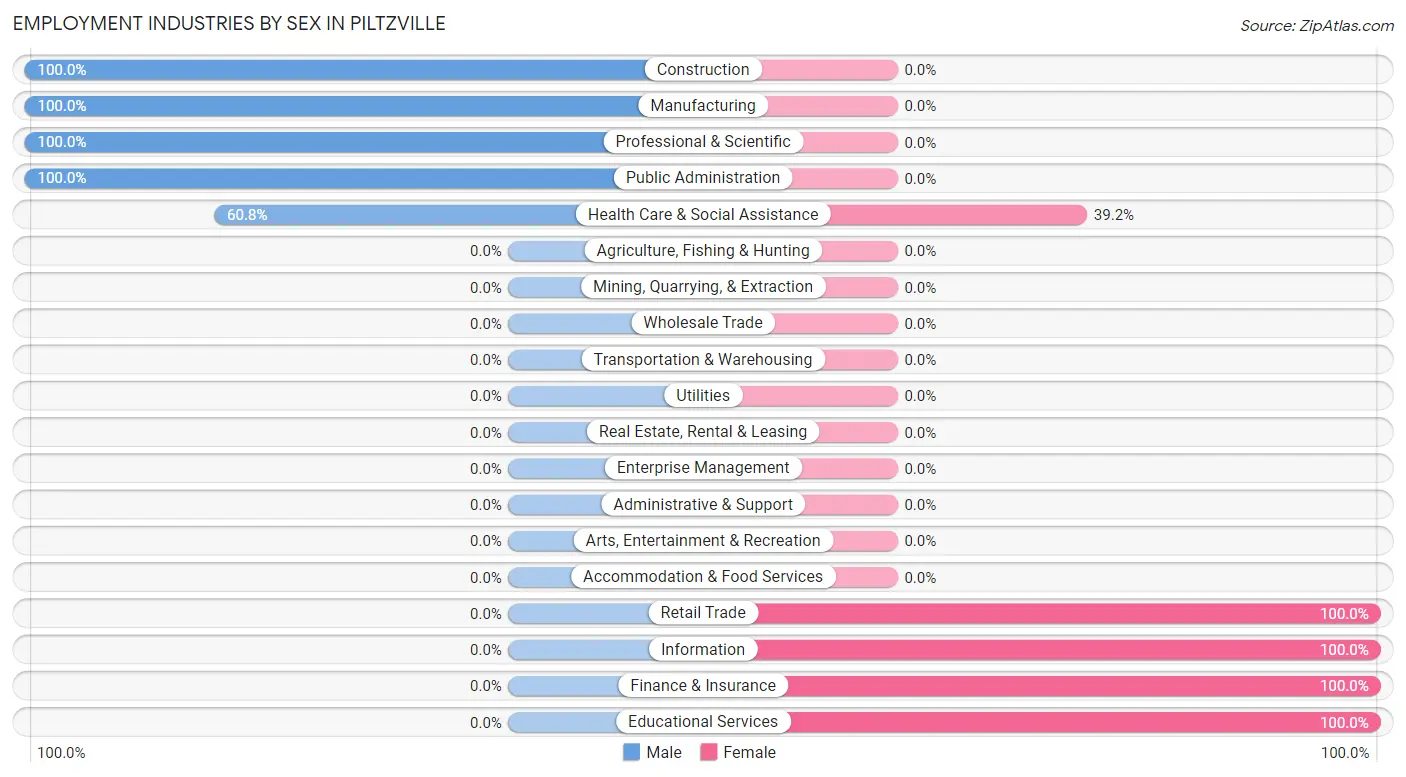
The major employment industries in Piltzville include Health Care & Social Assistance (153 | 35.1%), Manufacturing (70 | 16.1%), Educational Services (38 | 8.7%), Retail Trade (35 | 8.0%), and Professional & Scientific (30 | 6.9%).
Employment Industries by Sex in Piltzville
The Piltzville industries that see more men than women are Construction (100.0%), Manufacturing (100.0%), and Professional & Scientific (100.0%), whereas the industries that tend to have a higher number of women are Retail Trade (100.0%), Information (100.0%), and Finance & Insurance (100.0%).
| Industry | Male | Female |
| Agriculture, Fishing & Hunting | 0 (0.0%) | 0 (0.0%) |
| Mining, Quarrying, & Extraction | 0 (0.0%) | 0 (0.0%) |
| Construction | 20 (100.0%) | 0 (0.0%) |
| Manufacturing | 70 (100.0%) | 0 (0.0%) |
| Wholesale Trade | 0 (0.0%) | 0 (0.0%) |
| Retail Trade | 0 (0.0%) | 35 (100.0%) |
| Transportation & Warehousing | 0 (0.0%) | 0 (0.0%) |
| Utilities | 0 (0.0%) | 0 (0.0%) |
| Information | 0 (0.0%) | 28 (100.0%) |
| Finance & Insurance | 0 (0.0%) | 15 (100.0%) |
| Real Estate, Rental & Leasing | 0 (0.0%) | 0 (0.0%) |
| Professional & Scientific | 30 (100.0%) | 0 (0.0%) |
| Enterprise Management | 0 (0.0%) | 0 (0.0%) |
| Administrative & Support | 0 (0.0%) | 0 (0.0%) |
| Educational Services | 0 (0.0%) | 38 (100.0%) |
| Health Care & Social Assistance | 93 (60.8%) | 60 (39.2%) |
| Arts, Entertainment & Recreation | 0 (0.0%) | 0 (0.0%) |
| Accommodation & Food Services | 0 (0.0%) | 0 (0.0%) |
| Public Administration | 30 (100.0%) | 0 (0.0%) |
| Total | 260 (59.6%) | 176 (40.4%) |
Education in Piltzville
School Enrollment in Piltzville
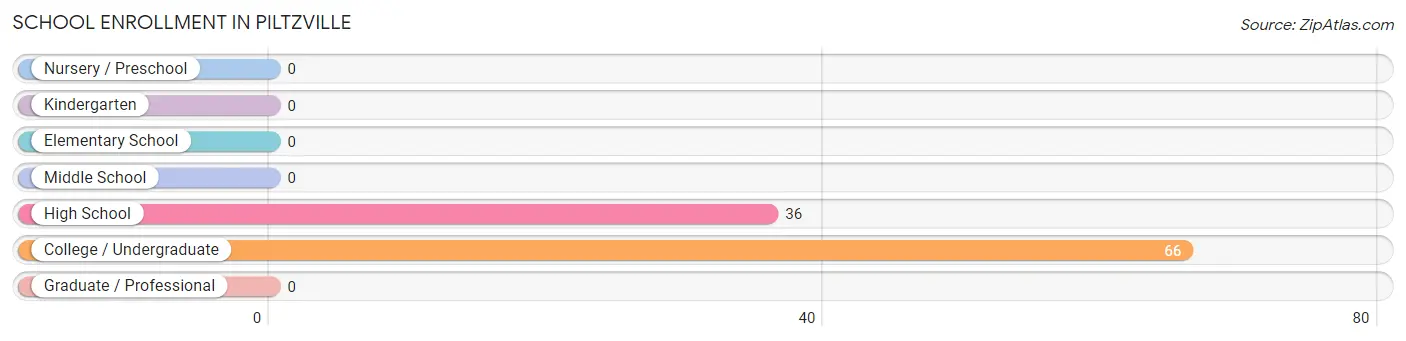
The most common levels of schooling among the 102 students in Piltzville are college / undergraduate (66 | 64.7%), and high school (36 | 35.3%).
| School Level | # Students | % Students |
| Nursery / Preschool | 0 | 0.0% |
| Kindergarten | 0 | 0.0% |
| Elementary School | 0 | 0.0% |
| Middle School | 0 | 0.0% |
| High School | 36 | 35.3% |
| College / Undergraduate | 66 | 64.7% |
| Graduate / Professional | 0 | 0.0% |
| Total | 102 | 100.0% |
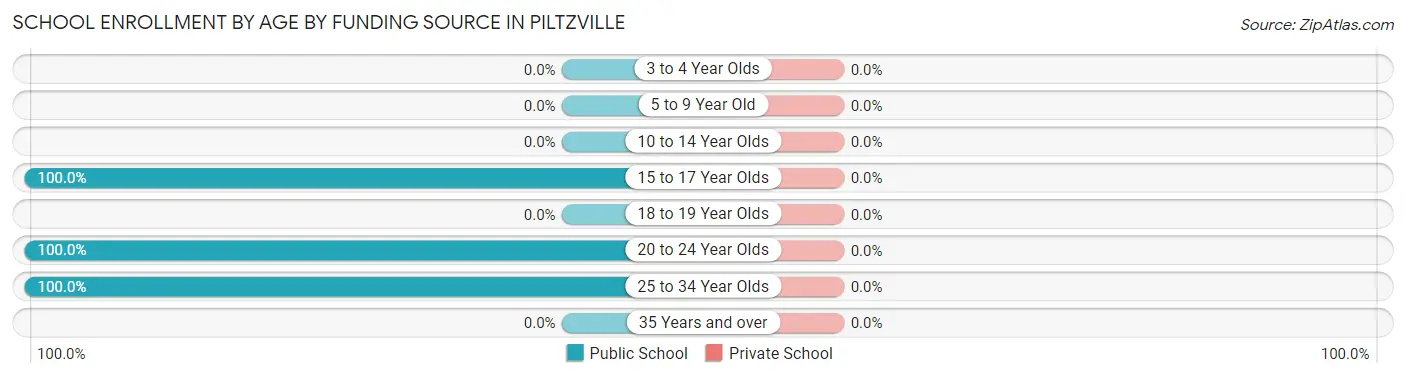
School Enrollment by Age by Funding Source in Piltzville
| Age Bracket | Public School | Private School |
| 3 to 4 Year Olds | 0 (0.0%) | 0 (0.0%) |
| 5 to 9 Year Old | 0 (0.0%) | 0 (0.0%) |
| 10 to 14 Year Olds | 0 (0.0%) | 0 (0.0%) |
| 15 to 17 Year Olds | 36 (100.0%) | 0 (0.0%) |
| 18 to 19 Year Olds | 0 (0.0%) | 0 (0.0%) |
| 20 to 24 Year Olds | 60 (100.0%) | 0 (0.0%) |
| 25 to 34 Year Olds | 6 (100.0%) | 0 (0.0%) |
| 35 Years and over | 0 (0.0%) | 0 (0.0%) |
| Total | 102 (100.0%) | 0 (0.0%) |
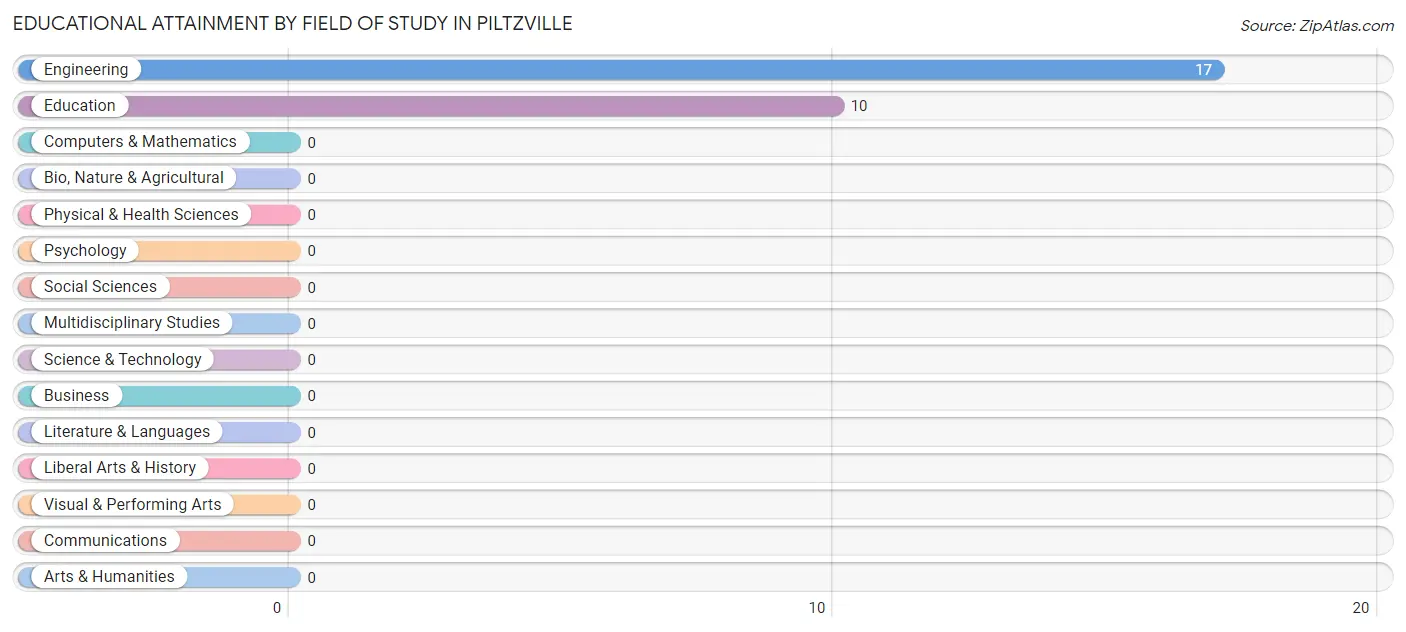
Educational Attainment by Field of Study in Piltzville
Engineering (17 | 63.0%), and education (10 | 37.0%) are the most common fields of study among 27 individuals in Piltzville who have obtained a bachelor's degree or higher.
| Field of Study | # Graduates | % Graduates |
| Computers & Mathematics | 0 | 0.0% |
| Bio, Nature & Agricultural | 0 | 0.0% |
| Physical & Health Sciences | 0 | 0.0% |
| Psychology | 0 | 0.0% |
| Social Sciences | 0 | 0.0% |
| Engineering | 17 | 63.0% |
| Multidisciplinary Studies | 0 | 0.0% |
| Science & Technology | 0 | 0.0% |
| Business | 0 | 0.0% |
| Education | 10 | 37.0% |
| Literature & Languages | 0 | 0.0% |
| Liberal Arts & History | 0 | 0.0% |
| Visual & Performing Arts | 0 | 0.0% |
| Communications | 0 | 0.0% |
| Arts & Humanities | 0 | 0.0% |
| Total | 27 | 100.0% |
Transportation & Commute in Piltzville
Vehicle Availability by Sex in Piltzville
The most prevalent vehicle ownership categories in Piltzville are males with 4 vehicles (171, accounting for 65.8%) and females with 4 vehicles (103, making up 97.2%).
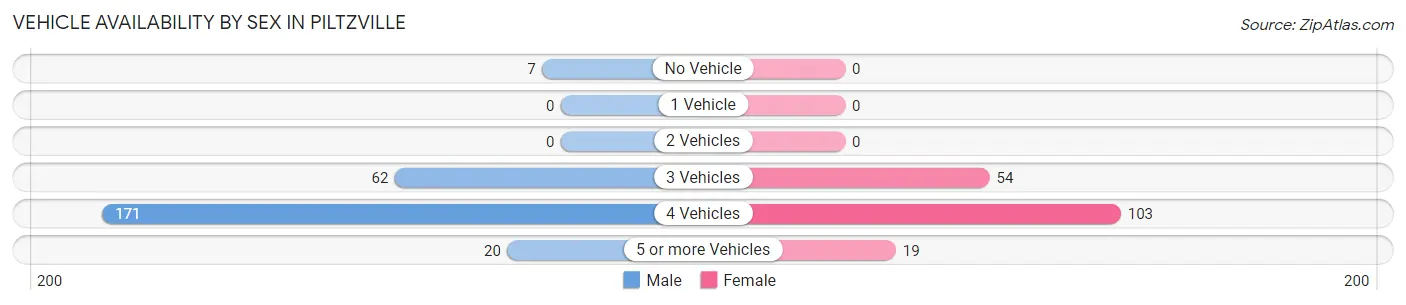
| Vehicles Available | Male | Female |
| No Vehicle | 7 (2.7%) | 0 (0.0%) |
| 1 Vehicle | 0 (0.0%) | 0 (0.0%) |
| 2 Vehicles | 0 (0.0%) | 0 (0.0%) |
| 3 Vehicles | 62 (23.8%) | 54 (30.7%) |
| 4 Vehicles | 171 (65.8%) | 103 (58.5%) |
| 5 or more Vehicles | 20 (7.7%) | 19 (10.8%) |
| Total | 260 (100.0%) | 176 (100.0%) |
Commute Time in Piltzville
The most frequently occuring commute durations in Piltzville are 20 to 24 minutes (255 commuters, 58.5%), 30 to 34 minutes (90 commuters, 20.6%), and 15 to 19 minutes (43 commuters, 9.9%).
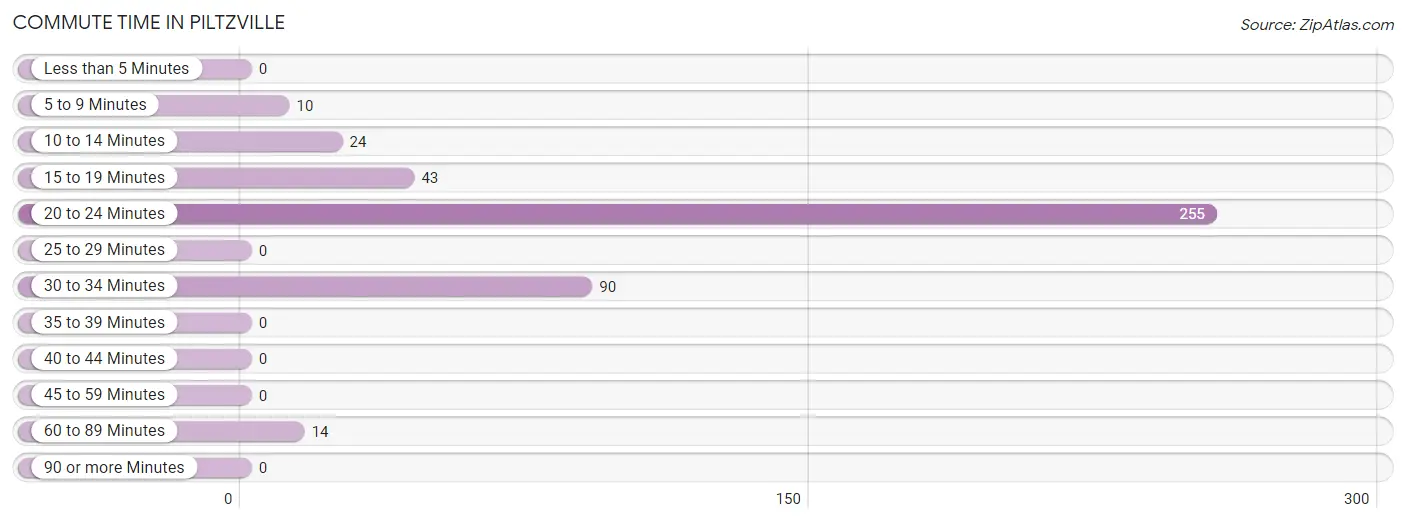
| Commute Time | # Commuters | % Commuters |
| Less than 5 Minutes | 0 | 0.0% |
| 5 to 9 Minutes | 10 | 2.3% |
| 10 to 14 Minutes | 24 | 5.5% |
| 15 to 19 Minutes | 43 | 9.9% |
| 20 to 24 Minutes | 255 | 58.5% |
| 25 to 29 Minutes | 0 | 0.0% |
| 30 to 34 Minutes | 90 | 20.6% |
| 35 to 39 Minutes | 0 | 0.0% |
| 40 to 44 Minutes | 0 | 0.0% |
| 45 to 59 Minutes | 0 | 0.0% |
| 60 to 89 Minutes | 14 | 3.2% |
| 90 or more Minutes | 0 | 0.0% |
Commute Time by Sex in Piltzville
The most common commute times in Piltzville are 20 to 24 minutes (139 commuters, 53.5%) for males and 20 to 24 minutes (116 commuters, 65.9%) for females.
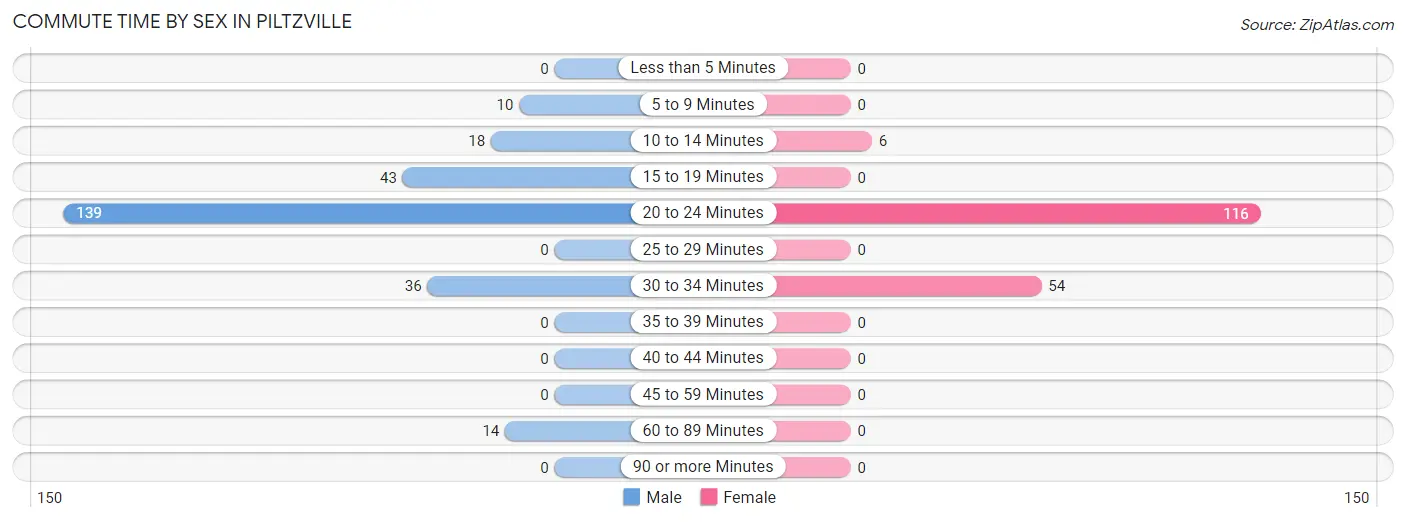
| Commute Time | Male | Female |
| Less than 5 Minutes | 0 (0.0%) | 0 (0.0%) |
| 5 to 9 Minutes | 10 (3.8%) | 0 (0.0%) |
| 10 to 14 Minutes | 18 (6.9%) | 6 (3.4%) |
| 15 to 19 Minutes | 43 (16.5%) | 0 (0.0%) |
| 20 to 24 Minutes | 139 (53.5%) | 116 (65.9%) |
| 25 to 29 Minutes | 0 (0.0%) | 0 (0.0%) |
| 30 to 34 Minutes | 36 (13.9%) | 54 (30.7%) |
| 35 to 39 Minutes | 0 (0.0%) | 0 (0.0%) |
| 40 to 44 Minutes | 0 (0.0%) | 0 (0.0%) |
| 45 to 59 Minutes | 0 (0.0%) | 0 (0.0%) |
| 60 to 89 Minutes | 14 (5.4%) | 0 (0.0%) |
| 90 or more Minutes | 0 (0.0%) | 0 (0.0%) |
Time of Departure to Work by Sex in Piltzville
The most frequent times of departure to work in Piltzville are 7:30 AM to 7:59 AM (63, 24.2%) for males and 5:30 AM to 5:59 AM (120, 68.2%) for females.
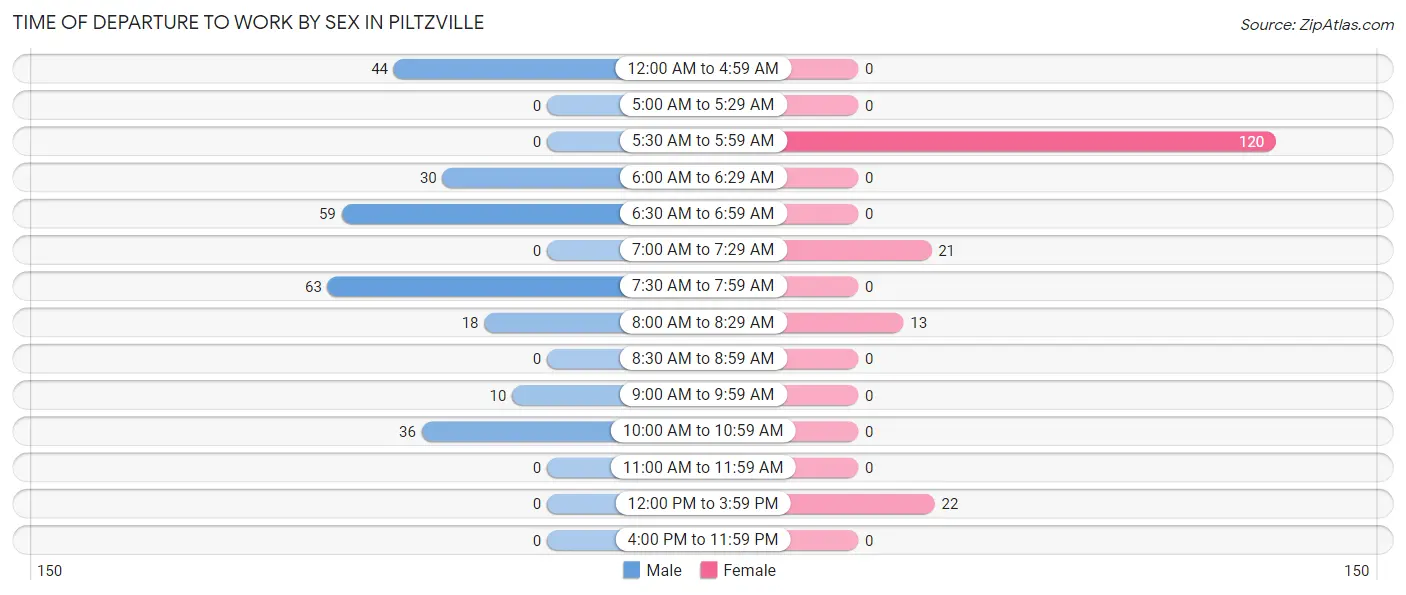
| Time of Departure | Male | Female |
| 12:00 AM to 4:59 AM | 44 (16.9%) | 0 (0.0%) |
| 5:00 AM to 5:29 AM | 0 (0.0%) | 0 (0.0%) |
| 5:30 AM to 5:59 AM | 0 (0.0%) | 120 (68.2%) |
| 6:00 AM to 6:29 AM | 30 (11.5%) | 0 (0.0%) |
| 6:30 AM to 6:59 AM | 59 (22.7%) | 0 (0.0%) |
| 7:00 AM to 7:29 AM | 0 (0.0%) | 21 (11.9%) |
| 7:30 AM to 7:59 AM | 63 (24.2%) | 0 (0.0%) |
| 8:00 AM to 8:29 AM | 18 (6.9%) | 13 (7.4%) |
| 8:30 AM to 8:59 AM | 0 (0.0%) | 0 (0.0%) |
| 9:00 AM to 9:59 AM | 10 (3.8%) | 0 (0.0%) |
| 10:00 AM to 10:59 AM | 36 (13.9%) | 0 (0.0%) |
| 11:00 AM to 11:59 AM | 0 (0.0%) | 0 (0.0%) |
| 12:00 PM to 3:59 PM | 0 (0.0%) | 22 (12.5%) |
| 4:00 PM to 11:59 PM | 0 (0.0%) | 0 (0.0%) |
| Total | 260 (100.0%) | 176 (100.0%) |
Housing Occupancy in Piltzville
Occupancy by Ownership in Piltzville
Of the total 207 dwellings in Piltzville, owner-occupied units account for 112 (54.1%), while renter-occupied units make up 95 (45.9%).
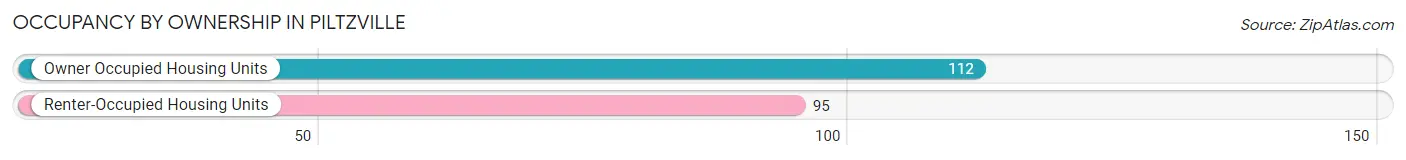
| Occupancy | # Housing Units | % Housing Units |
| Owner Occupied Housing Units | 112 | 54.1% |
| Renter-Occupied Housing Units | 95 | 45.9% |
| Total Occupied Housing Units | 207 | 100.0% |
Occupancy by Household Size in Piltzville
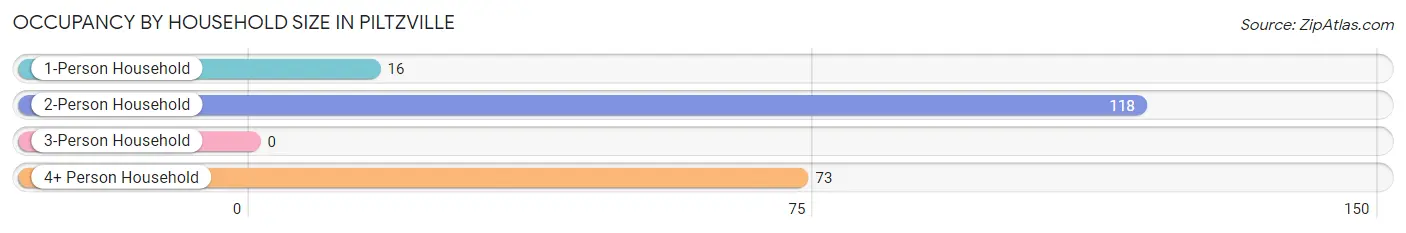
| Household Size | # Housing Units | % Housing Units |
| 1-Person Household | 16 | 7.7% |
| 2-Person Household | 118 | 57.0% |
| 3-Person Household | 0 | 0.0% |
| 4+ Person Household | 73 | 35.3% |
| Total Housing Units | 207 | 100.0% |
Occupancy by Ownership by Household Size in Piltzville
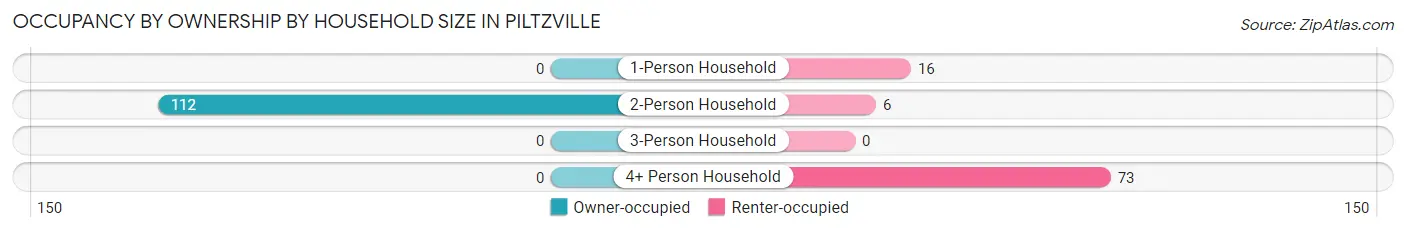
| Household Size | Owner-occupied | Renter-occupied |
| 1-Person Household | 0 (0.0%) | 16 (100.0%) |
| 2-Person Household | 112 (94.9%) | 6 (5.1%) |
| 3-Person Household | 0 (0.0%) | 0 (0.0%) |
| 4+ Person Household | 0 (0.0%) | 73 (100.0%) |
| Total Housing Units | 112 (54.1%) | 95 (45.9%) |
Occupancy by Educational Attainment in Piltzville

| Household Size | Owner-occupied | Renter-occupied |
| Less than High School | 0 (0.0%) | 0 (0.0%) |
| High School Diploma | 21 (25.6%) | 61 (74.4%) |
| College/Associate Degree | 80 (70.2%) | 34 (29.8%) |
| Bachelor's Degree or higher | 11 (100.0%) | 0 (0.0%) |
Occupancy by Age of Householder in Piltzville
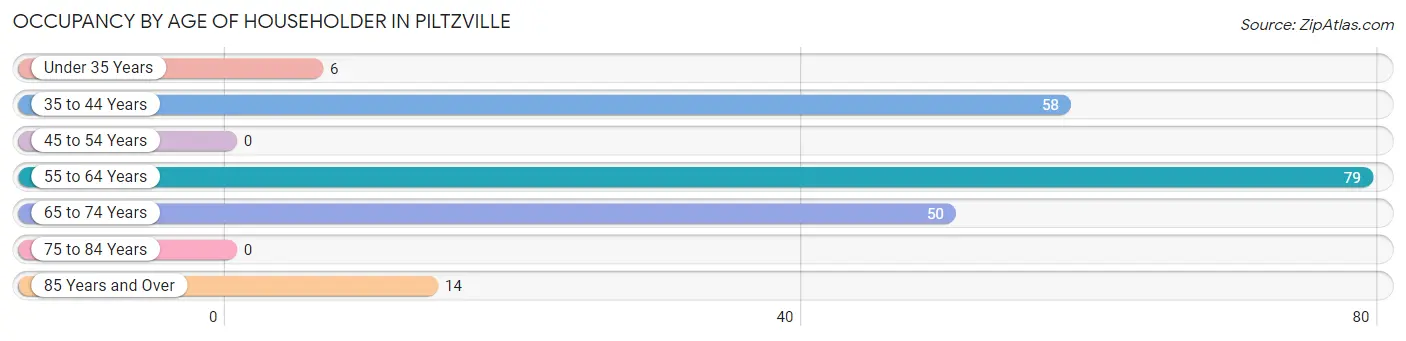
| Age Bracket | # Households | % Households |
| Under 35 Years | 6 | 2.9% |
| 35 to 44 Years | 58 | 28.0% |
| 45 to 54 Years | 0 | 0.0% |
| 55 to 64 Years | 79 | 38.2% |
| 65 to 74 Years | 50 | 24.1% |
| 75 to 84 Years | 0 | 0.0% |
| 85 Years and Over | 14 | 6.8% |
| Total | 207 | 100.0% |
Housing Finances in Piltzville
Median Income by Occupancy in Piltzville
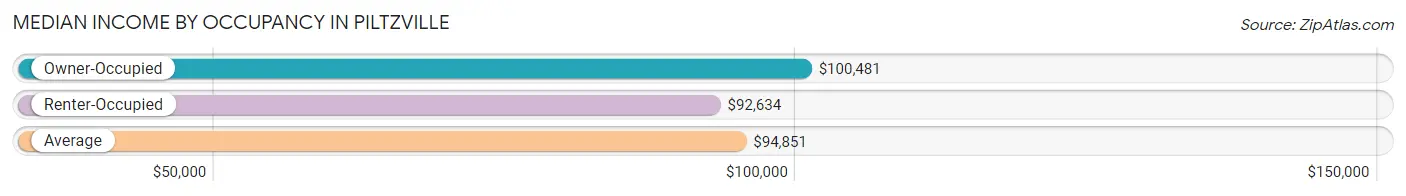
| Occupancy Type | # Households | Median Income |
| Owner-Occupied | 112 (54.1%) | $100,481 |
| Renter-Occupied | 95 (45.9%) | $92,634 |
| Average | 207 (100.0%) | $94,851 |
Occupancy by Householder Income Bracket in Piltzville
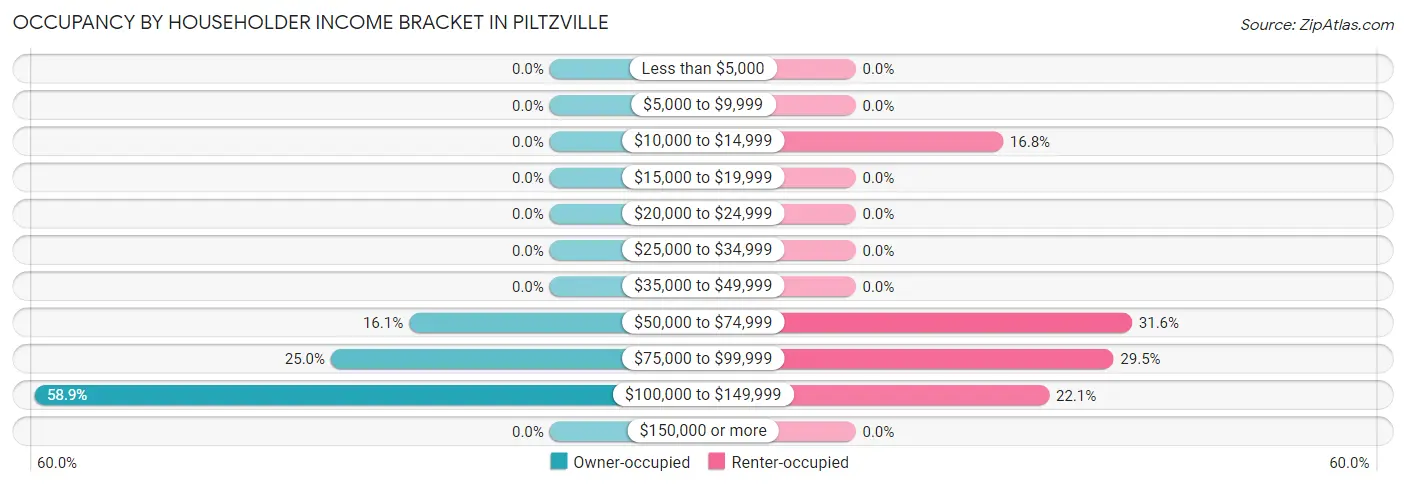
| Income Bracket | Owner-occupied | Renter-occupied |
| Less than $5,000 | 0 (0.0%) | 0 (0.0%) |
| $5,000 to $9,999 | 0 (0.0%) | 0 (0.0%) |
| $10,000 to $14,999 | 0 (0.0%) | 16 (16.8%) |
| $15,000 to $19,999 | 0 (0.0%) | 0 (0.0%) |
| $20,000 to $24,999 | 0 (0.0%) | 0 (0.0%) |
| $25,000 to $34,999 | 0 (0.0%) | 0 (0.0%) |
| $35,000 to $49,999 | 0 (0.0%) | 0 (0.0%) |
| $50,000 to $74,999 | 18 (16.1%) | 30 (31.6%) |
| $75,000 to $99,999 | 28 (25.0%) | 28 (29.5%) |
| $100,000 to $149,999 | 66 (58.9%) | 21 (22.1%) |
| $150,000 or more | 0 (0.0%) | 0 (0.0%) |
| Total | 112 (100.0%) | 95 (100.0%) |
Monthly Housing Cost Tiers in Piltzville
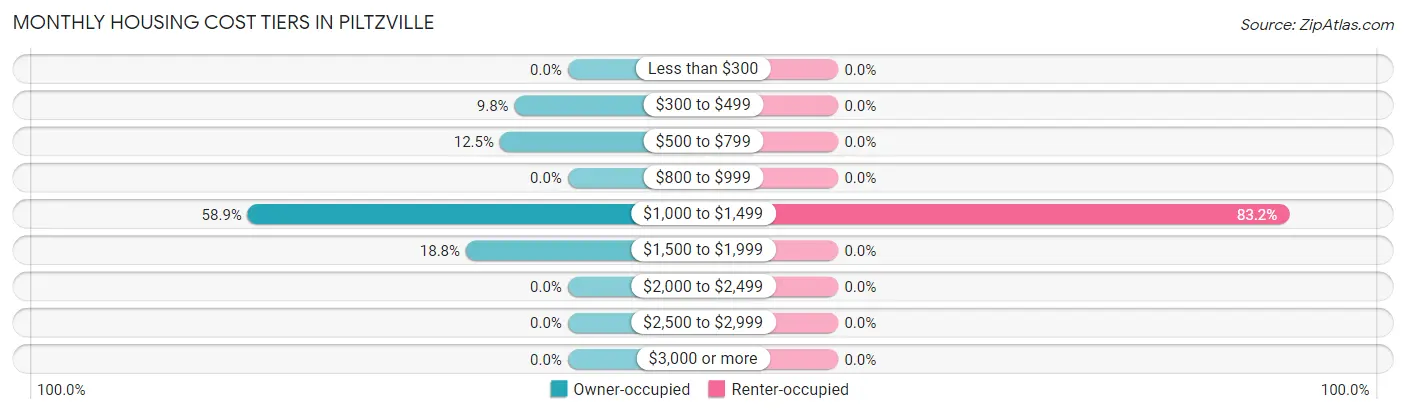
| Monthly Cost | Owner-occupied | Renter-occupied |
| Less than $300 | 0 (0.0%) | 0 (0.0%) |
| $300 to $499 | 11 (9.8%) | 0 (0.0%) |
| $500 to $799 | 14 (12.5%) | 0 (0.0%) |
| $800 to $999 | 0 (0.0%) | 0 (0.0%) |
| $1,000 to $1,499 | 66 (58.9%) | 79 (83.2%) |
| $1,500 to $1,999 | 21 (18.8%) | 0 (0.0%) |
| $2,000 to $2,499 | 0 (0.0%) | 0 (0.0%) |
| $2,500 to $2,999 | 0 (0.0%) | 0 (0.0%) |
| $3,000 or more | 0 (0.0%) | 0 (0.0%) |
| Total | 112 (100.0%) | 95 (100.0%) |
Physical Housing Characteristics in Piltzville
Housing Structures in Piltzville
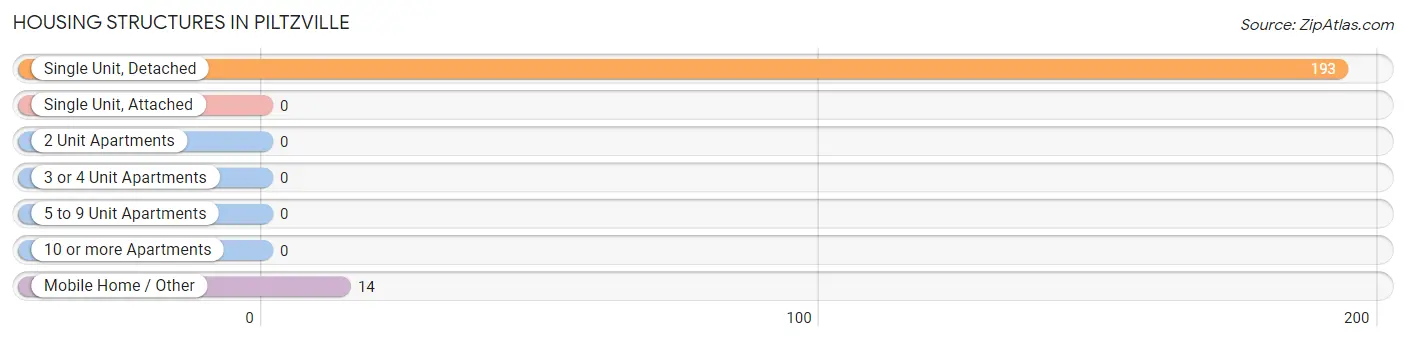
| Structure Type | # Housing Units | % Housing Units |
| Single Unit, Detached | 193 | 93.2% |
| Single Unit, Attached | 0 | 0.0% |
| 2 Unit Apartments | 0 | 0.0% |
| 3 or 4 Unit Apartments | 0 | 0.0% |
| 5 to 9 Unit Apartments | 0 | 0.0% |
| 10 or more Apartments | 0 | 0.0% |
| Mobile Home / Other | 14 | 6.8% |
| Total | 207 | 100.0% |
Housing Structures by Occupancy in Piltzville
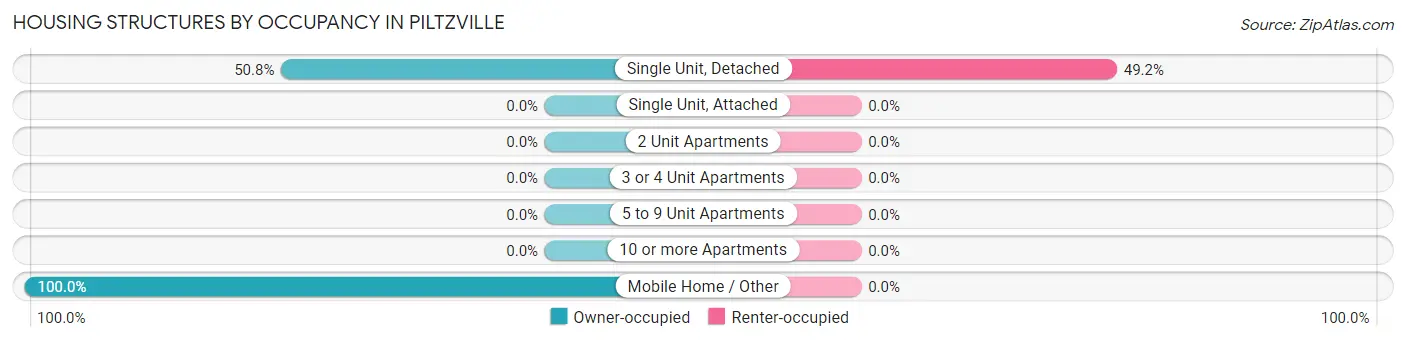
| Structure Type | Owner-occupied | Renter-occupied |
| Single Unit, Detached | 98 (50.8%) | 95 (49.2%) |
| Single Unit, Attached | 0 (0.0%) | 0 (0.0%) |
| 2 Unit Apartments | 0 (0.0%) | 0 (0.0%) |
| 3 or 4 Unit Apartments | 0 (0.0%) | 0 (0.0%) |
| 5 to 9 Unit Apartments | 0 (0.0%) | 0 (0.0%) |
| 10 or more Apartments | 0 (0.0%) | 0 (0.0%) |
| Mobile Home / Other | 14 (100.0%) | 0 (0.0%) |
| Total | 112 (54.1%) | 95 (45.9%) |
Housing Structures by Number of Rooms in Piltzville
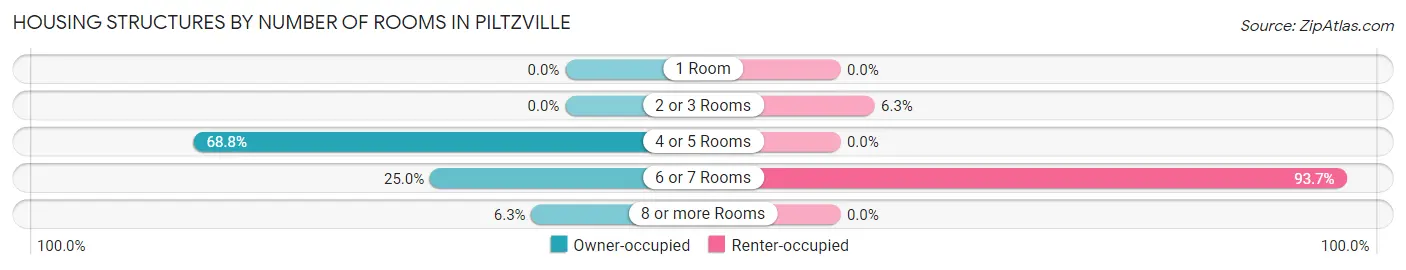
| Number of Rooms | Owner-occupied | Renter-occupied |
| 1 Room | 0 (0.0%) | 0 (0.0%) |
| 2 or 3 Rooms | 0 (0.0%) | 6 (6.3%) |
| 4 or 5 Rooms | 77 (68.8%) | 0 (0.0%) |
| 6 or 7 Rooms | 28 (25.0%) | 89 (93.7%) |
| 8 or more Rooms | 7 (6.2%) | 0 (0.0%) |
| Total | 112 (100.0%) | 95 (100.0%) |
Housing Structure by Heating Type in Piltzville
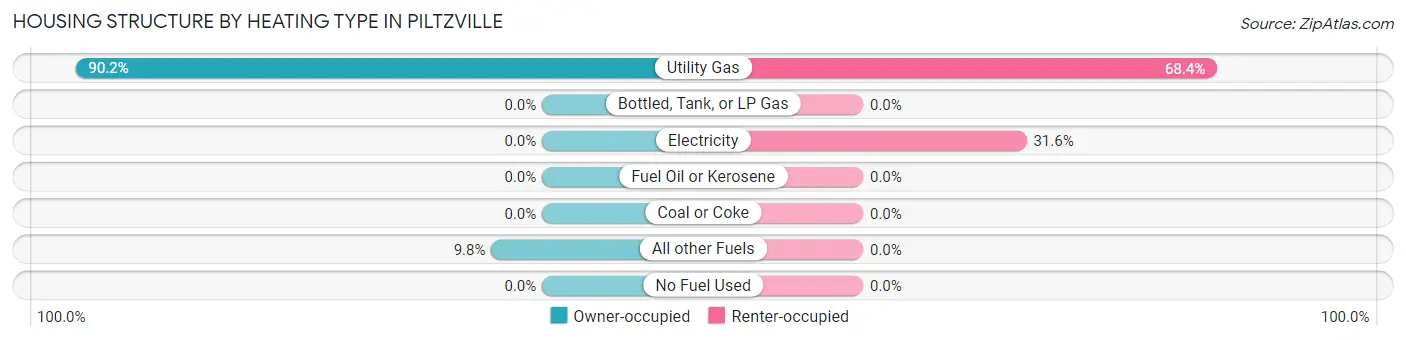
| Heating Type | Owner-occupied | Renter-occupied |
| Utility Gas | 101 (90.2%) | 65 (68.4%) |
| Bottled, Tank, or LP Gas | 0 (0.0%) | 0 (0.0%) |
| Electricity | 0 (0.0%) | 30 (31.6%) |
| Fuel Oil or Kerosene | 0 (0.0%) | 0 (0.0%) |
| Coal or Coke | 0 (0.0%) | 0 (0.0%) |
| All other Fuels | 11 (9.8%) | 0 (0.0%) |
| No Fuel Used | 0 (0.0%) | 0 (0.0%) |
| Total | 112 (100.0%) | 95 (100.0%) |
Household Vehicle Usage in Piltzville
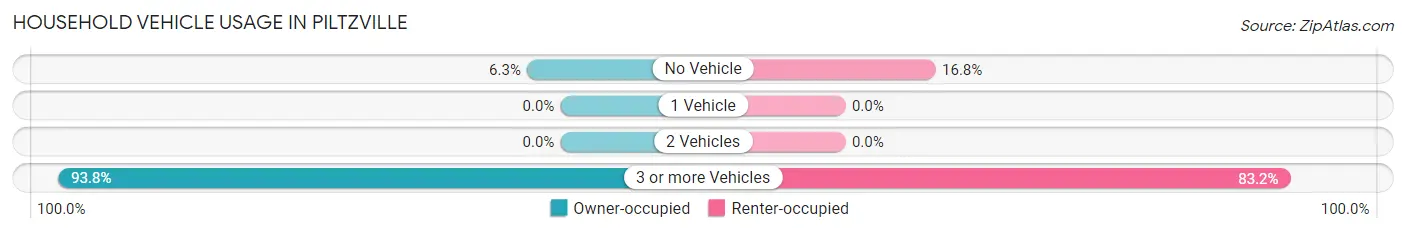
| Vehicles per Household | Owner-occupied | Renter-occupied |
| No Vehicle | 7 (6.2%) | 16 (16.8%) |
| 1 Vehicle | 0 (0.0%) | 0 (0.0%) |
| 2 Vehicles | 0 (0.0%) | 0 (0.0%) |
| 3 or more Vehicles | 105 (93.8%) | 79 (83.2%) |
| Total | 112 (100.0%) | 95 (100.0%) |
Real Estate & Mortgages in Piltzville
Real Estate and Mortgage Overview in Piltzville
| Characteristic | Without Mortgage | With Mortgage |
| Housing Units | 25 | 87 |
| Median Property Value | - | - |
| Median Household Income | - | - |
| Monthly Housing Costs | - | - |
| Real Estate Taxes | - | - |
Property Value by Mortgage Status in Piltzville
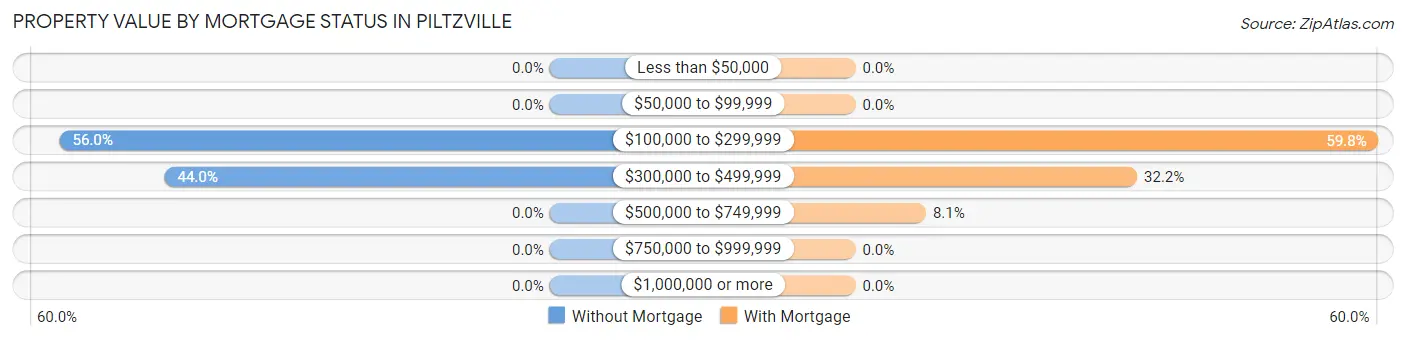
| Property Value | Without Mortgage | With Mortgage |
| Less than $50,000 | 0 (0.0%) | 0 (0.0%) |
| $50,000 to $99,999 | 0 (0.0%) | 0 (0.0%) |
| $100,000 to $299,999 | 14 (56.0%) | 52 (59.8%) |
| $300,000 to $499,999 | 11 (44.0%) | 28 (32.2%) |
| $500,000 to $749,999 | 0 (0.0%) | 7 (8.1%) |
| $750,000 to $999,999 | 0 (0.0%) | 0 (0.0%) |
| $1,000,000 or more | 0 (0.0%) | 0 (0.0%) |
| Total | 25 (100.0%) | 87 (100.0%) |
Household Income by Mortgage Status in Piltzville
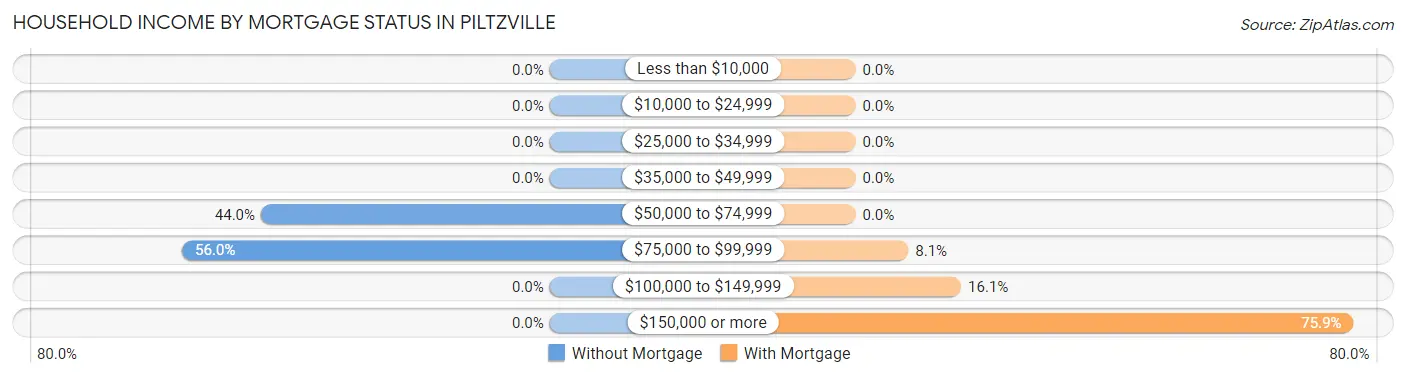
| Household Income | Without Mortgage | With Mortgage |
| Less than $10,000 | 0 (0.0%) | 0 (0.0%) |
| $10,000 to $24,999 | 0 (0.0%) | 0 (0.0%) |
| $25,000 to $34,999 | 0 (0.0%) | 0 (0.0%) |
| $35,000 to $49,999 | 0 (0.0%) | 0 (0.0%) |
| $50,000 to $74,999 | 11 (44.0%) | 0 (0.0%) |
| $75,000 to $99,999 | 14 (56.0%) | 7 (8.1%) |
| $100,000 to $149,999 | 0 (0.0%) | 14 (16.1%) |
| $150,000 or more | 0 (0.0%) | 66 (75.9%) |
| Total | 25 (100.0%) | 87 (100.0%) |
Property Value to Household Income Ratio in Piltzville
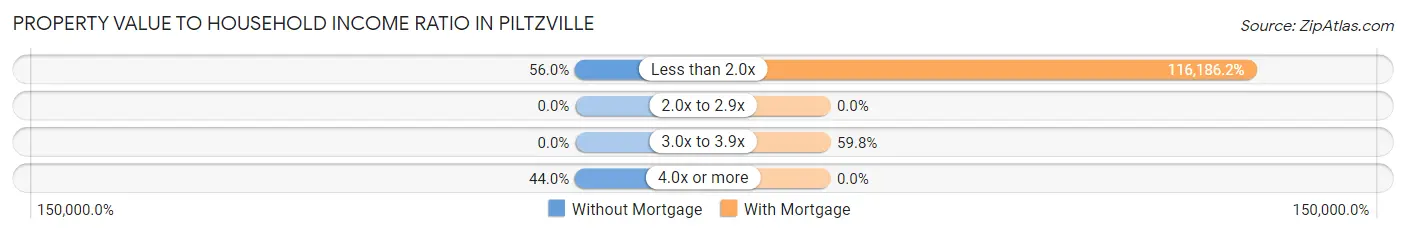
| Value-to-Income Ratio | Without Mortgage | With Mortgage |
| Less than 2.0x | 14 (56.0%) | 101,082 (116,186.2%) |
| 2.0x to 2.9x | 0 (0.0%) | 0 (0.0%) |
| 3.0x to 3.9x | 0 (0.0%) | 52 (59.8%) |
| 4.0x or more | 11 (44.0%) | 0 (0.0%) |
| Total | 25 (100.0%) | 87 (100.0%) |
Real Estate Taxes by Mortgage Status in Piltzville
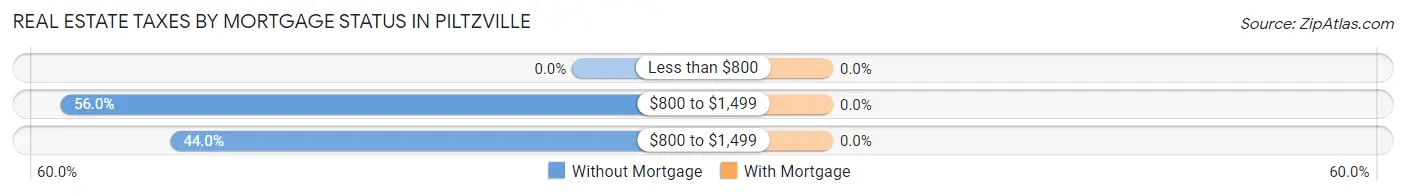
| Property Taxes | Without Mortgage | With Mortgage |
| Less than $800 | 0 (0.0%) | 0 (0.0%) |
| $800 to $1,499 | 14 (56.0%) | 0 (0.0%) |
| $800 to $1,499 | 11 (44.0%) | 0 (0.0%) |
| Total | 25 (100.0%) | 87 (100.0%) |
Health & Disability in Piltzville
Health Insurance Coverage by Age in Piltzville
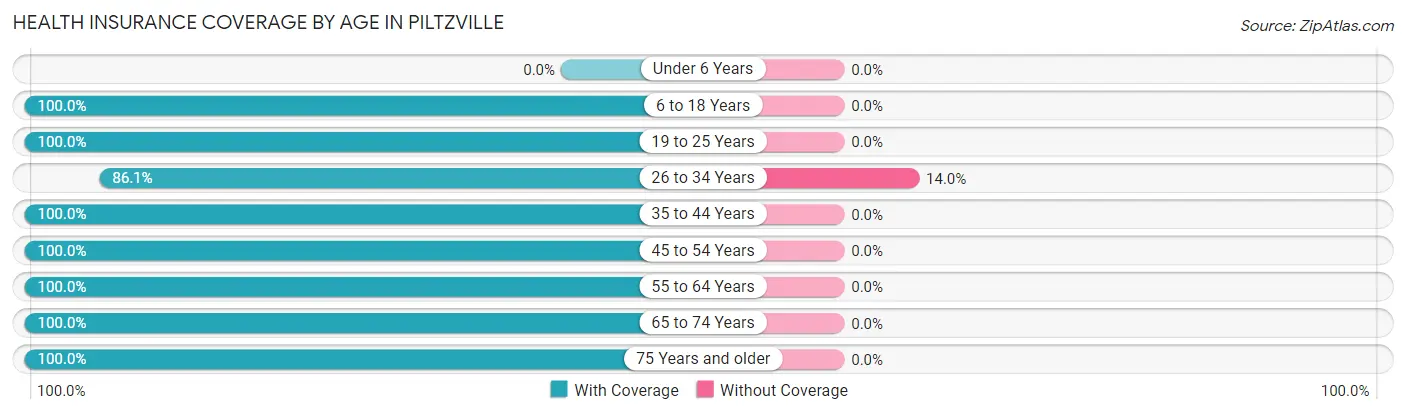
| Age Bracket | With Coverage | Without Coverage |
| Under 6 Years | 0 (0.0%) | 0 (0.0%) |
| 6 to 18 Years | 117 (100.0%) | 0 (0.0%) |
| 19 to 25 Years | 60 (100.0%) | 0 (0.0%) |
| 26 to 34 Years | 111 (86.1%) | 18 (14.0%) |
| 35 to 44 Years | 95 (100.0%) | 0 (0.0%) |
| 45 to 54 Years | 54 (100.0%) | 0 (0.0%) |
| 55 to 64 Years | 79 (100.0%) | 0 (0.0%) |
| 65 to 74 Years | 87 (100.0%) | 0 (0.0%) |
| 75 Years and older | 29 (100.0%) | 0 (0.0%) |
| Total | 632 (97.2%) | 18 (2.8%) |
Health Insurance Coverage by Citizenship Status in Piltzville
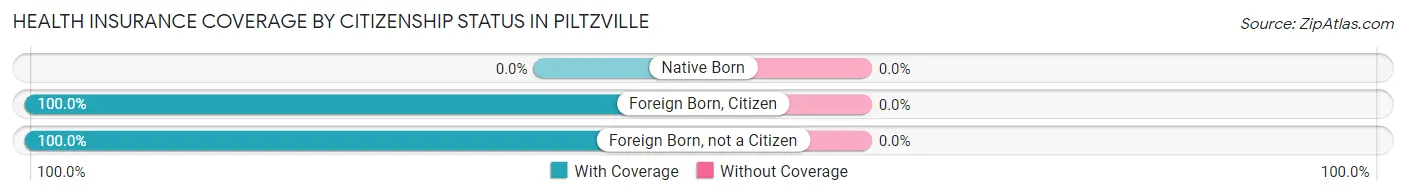
| Citizenship Status | With Coverage | Without Coverage |
| Native Born | 0 (0.0%) | 0 (0.0%) |
| Foreign Born, Citizen | 117 (100.0%) | 0 (0.0%) |
| Foreign Born, not a Citizen | 60 (100.0%) | 0 (0.0%) |
Health Insurance Coverage by Household Income in Piltzville
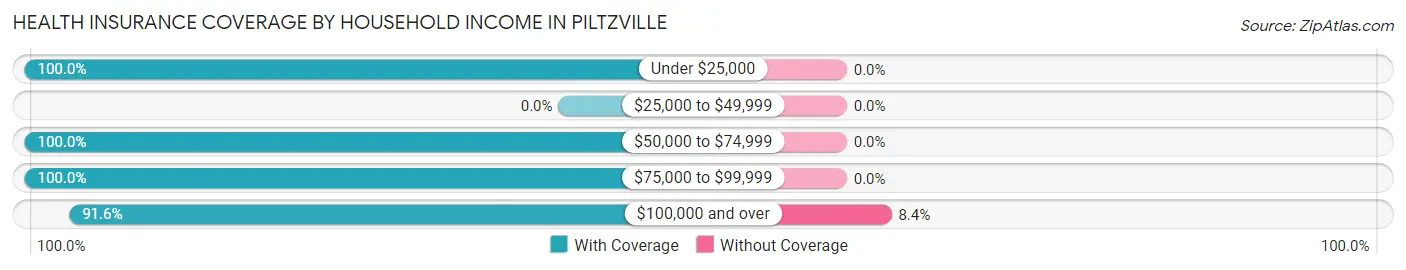
| Household Income | With Coverage | Without Coverage |
| Under $25,000 | 16 (100.0%) | 0 (0.0%) |
| $25,000 to $49,999 | 0 (0.0%) | 0 (0.0%) |
| $50,000 to $74,999 | 230 (100.0%) | 0 (0.0%) |
| $75,000 to $99,999 | 189 (100.0%) | 0 (0.0%) |
| $100,000 and over | 197 (91.6%) | 18 (8.4%) |
Public vs Private Health Insurance Coverage by Age in Piltzville
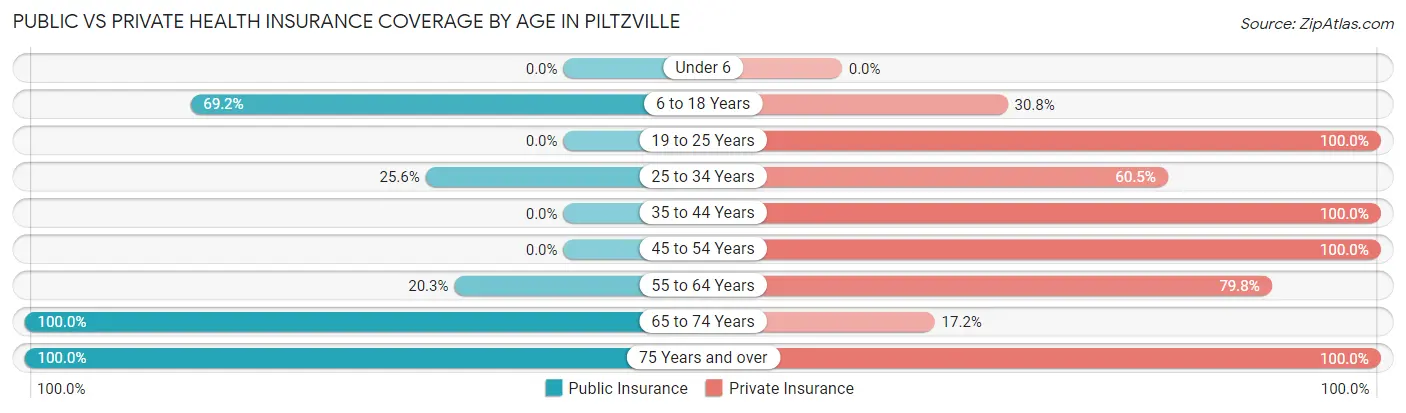
| Age Bracket | Public Insurance | Private Insurance |
| Under 6 | 0 (0.0%) | 0 (0.0%) |
| 6 to 18 Years | 81 (69.2%) | 36 (30.8%) |
| 19 to 25 Years | 0 (0.0%) | 60 (100.0%) |
| 25 to 34 Years | 33 (25.6%) | 78 (60.5%) |
| 35 to 44 Years | 0 (0.0%) | 95 (100.0%) |
| 45 to 54 Years | 0 (0.0%) | 54 (100.0%) |
| 55 to 64 Years | 16 (20.3%) | 63 (79.7%) |
| 65 to 74 Years | 87 (100.0%) | 15 (17.2%) |
| 75 Years and over | 29 (100.0%) | 29 (100.0%) |
| Total | 246 (37.9%) | 430 (66.1%) |
Disability Status by Sex by Age in Piltzville
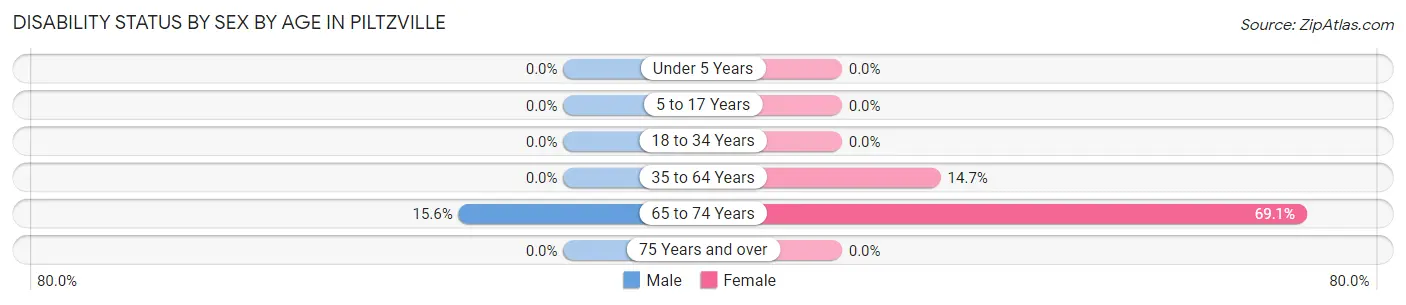
| Age Bracket | Male | Female |
| Under 5 Years | 0 (0.0%) | 0 (0.0%) |
| 5 to 17 Years | 0 (0.0%) | 0 (0.0%) |
| 18 to 34 Years | 0 (0.0%) | 0 (0.0%) |
| 35 to 64 Years | 0 (0.0%) | 16 (14.7%) |
| 65 to 74 Years | 7 (15.6%) | 29 (69.1%) |
| 75 Years and over | 0 (0.0%) | 0 (0.0%) |
Disability Class by Sex by Age in Piltzville
Disability Class: Hearing Difficulty
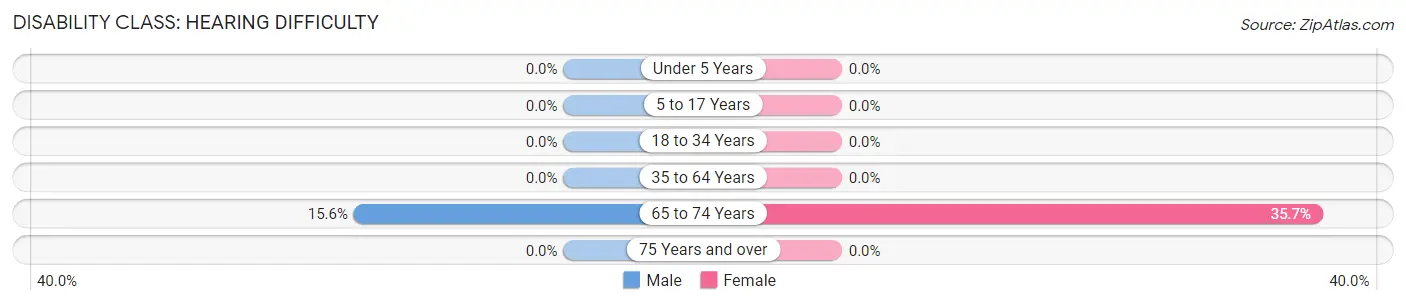
| Age Bracket | Male | Female |
| Under 5 Years | 0 (0.0%) | 0 (0.0%) |
| 5 to 17 Years | 0 (0.0%) | 0 (0.0%) |
| 18 to 34 Years | 0 (0.0%) | 0 (0.0%) |
| 35 to 64 Years | 0 (0.0%) | 0 (0.0%) |
| 65 to 74 Years | 7 (15.6%) | 15 (35.7%) |
| 75 Years and over | 0 (0.0%) | 0 (0.0%) |
Disability Class: Vision Difficulty
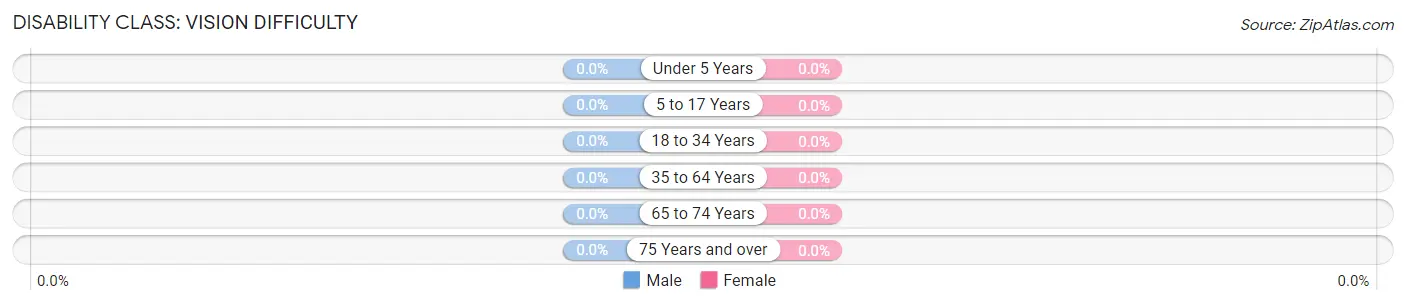
| Age Bracket | Male | Female |
| Under 5 Years | 0 (0.0%) | 0 (0.0%) |
| 5 to 17 Years | 0 (0.0%) | 0 (0.0%) |
| 18 to 34 Years | 0 (0.0%) | 0 (0.0%) |
| 35 to 64 Years | 0 (0.0%) | 0 (0.0%) |
| 65 to 74 Years | 0 (0.0%) | 0 (0.0%) |
| 75 Years and over | 0 (0.0%) | 0 (0.0%) |
Disability Class: Cognitive Difficulty
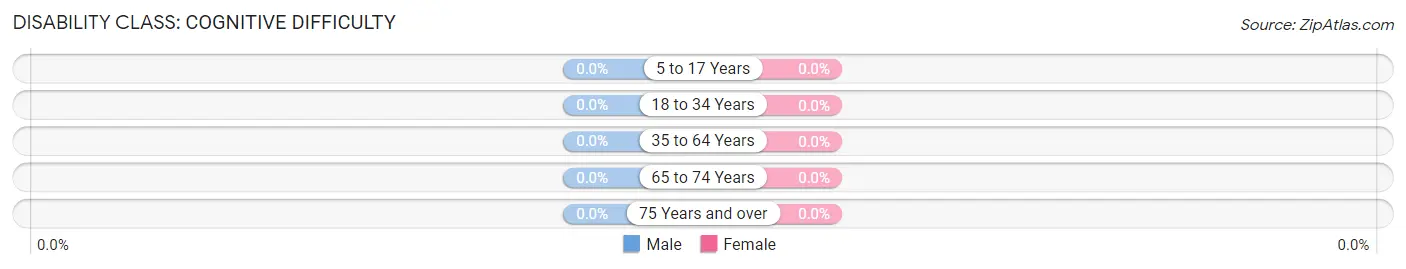
| Age Bracket | Male | Female |
| 5 to 17 Years | 0 (0.0%) | 0 (0.0%) |
| 18 to 34 Years | 0 (0.0%) | 0 (0.0%) |
| 35 to 64 Years | 0 (0.0%) | 0 (0.0%) |
| 65 to 74 Years | 0 (0.0%) | 0 (0.0%) |
| 75 Years and over | 0 (0.0%) | 0 (0.0%) |
Disability Class: Ambulatory Difficulty
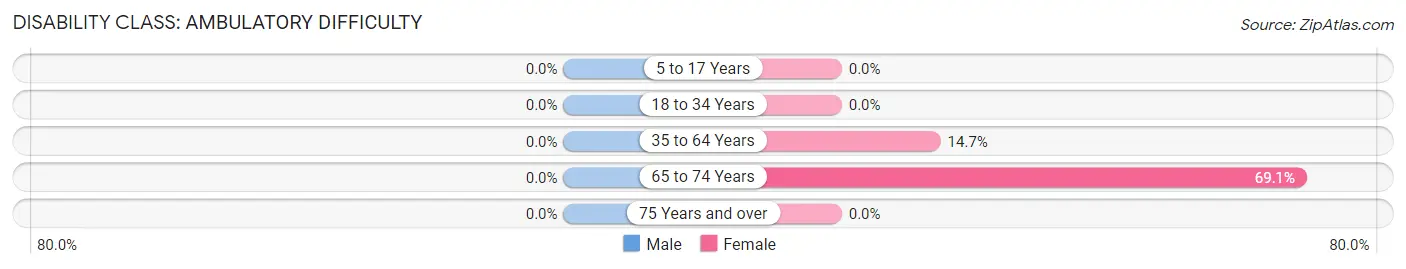
| Age Bracket | Male | Female |
| 5 to 17 Years | 0 (0.0%) | 0 (0.0%) |
| 18 to 34 Years | 0 (0.0%) | 0 (0.0%) |
| 35 to 64 Years | 0 (0.0%) | 16 (14.7%) |
| 65 to 74 Years | 0 (0.0%) | 29 (69.1%) |
| 75 Years and over | 0 (0.0%) | 0 (0.0%) |
Disability Class: Self-Care Difficulty
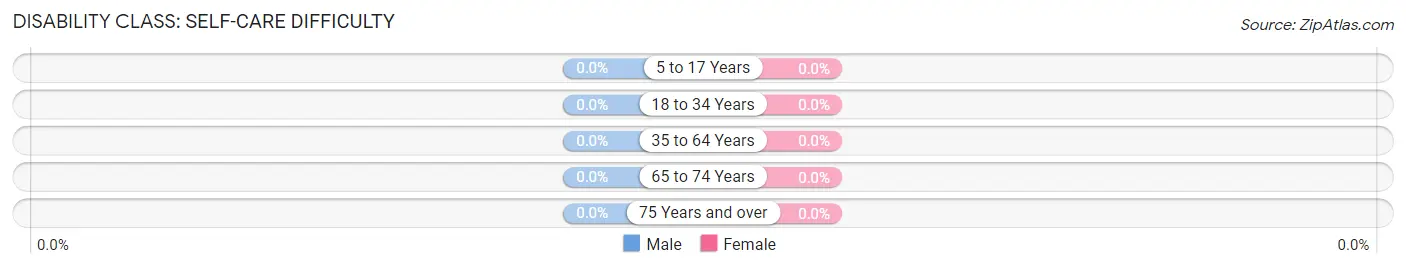
| Age Bracket | Male | Female |
| 5 to 17 Years | 0 (0.0%) | 0 (0.0%) |
| 18 to 34 Years | 0 (0.0%) | 0 (0.0%) |
| 35 to 64 Years | 0 (0.0%) | 0 (0.0%) |
| 65 to 74 Years | 0 (0.0%) | 0 (0.0%) |
| 75 Years and over | 0 (0.0%) | 0 (0.0%) |
Technology Access in Piltzville
Computing Device Access in Piltzville
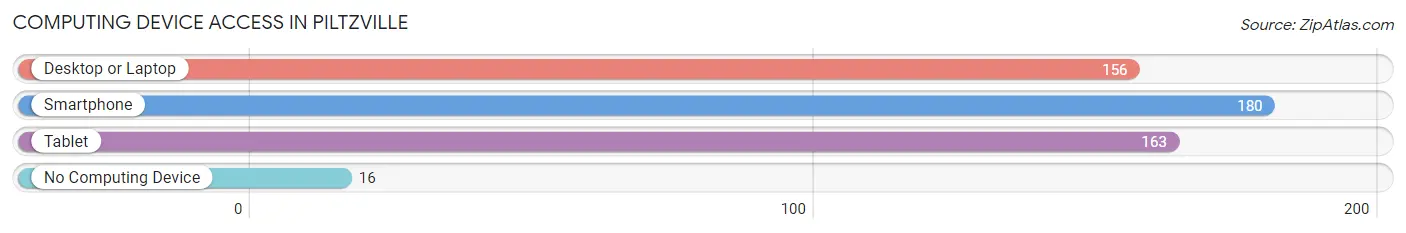
| Device Type | # Households | % Households |
| Desktop or Laptop | 156 | 75.4% |
| Smartphone | 180 | 87.0% |
| Tablet | 163 | 78.7% |
| No Computing Device | 16 | 7.7% |
| Total | 207 | 100.0% |
Internet Access in Piltzville
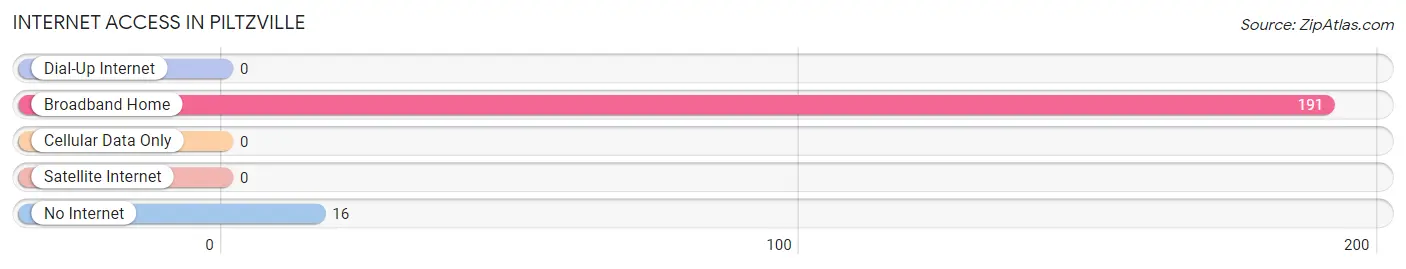
| Internet Type | # Households | % Households |
| Dial-Up Internet | 0 | 0.0% |
| Broadband Home | 191 | 92.3% |
| Cellular Data Only | 0 | 0.0% |
| Satellite Internet | 0 | 0.0% |
| No Internet | 16 | 7.7% |
| Total | 207 | 100.0% |
Piltzville Summary
Piltzville, Montana is a small town located in the western part of the state, near the Idaho border. It is situated in the Bitterroot Valley, a region of the Rocky Mountains known for its scenic beauty and outdoor recreation opportunities. The town has a population of just over 1,000 people and is the county seat of Ravalli County.
History
Piltzville was founded in 1883 by German immigrant, John Piltz. He had come to the area in search of gold, but instead found a small settlement of homesteaders. He purchased the land and began to develop the town, naming it after himself. The town grew slowly, but steadily, and by the early 1900s had become a thriving community.
In the early 1900s, Piltzville was a hub for the timber industry, with several sawmills in the area. The town also had a thriving agricultural sector, with many farmers growing wheat, barley, and other crops. The town was also home to a number of small businesses, including a general store, a blacksmith, and a hotel.
Geography
Piltzville is located in the western part of Montana, near the Idaho border. It is situated in the Bitterroot Valley, a region of the Rocky Mountains known for its scenic beauty and outdoor recreation opportunities. The town is located at an elevation of 4,000 feet, and is surrounded by mountains and forests. The nearby Bitterroot River provides a source of recreation for the town, with fishing, boating, and swimming being popular activities.
Economy
The economy of Piltzville is largely based on agriculture and tourism. The town is home to several farms, which produce wheat, barley, and other crops. The nearby Bitterroot River provides a source of recreation for the town, with fishing, boating, and swimming being popular activities. The town also has a number of small businesses, including a general store, a blacksmith, and a hotel.
Demographics
As of the 2010 census, the population of Piltzville was 1,072. The racial makeup of the town was 95.3% White, 0.7% Native American, 0.2% Asian, 0.1% Pacific Islander, 0.2% from other races, and 3.5% from two or more races. The median household income was $37,500, and the median family income was $41,250. The per capita income was $17,845. The town had a poverty rate of 16.2%.
Conclusion
Piltzville, Montana is a small town located in the western part of the state, near the Idaho border. It is situated in the Bitterroot Valley, a region of the Rocky Mountains known for its scenic beauty and outdoor recreation opportunities. The town has a population of just over 1,000 people and is the county seat of Ravalli County. The economy of Piltzville is largely based on agriculture and tourism, with the nearby Bitterroot River providing a source of recreation for the town. The town has a diverse population, with a median household income of $37,500 and a poverty rate of 16.2%. Piltzville is a small town with a rich history and a bright future.
Common Questions
What is the Total Population of Piltzville?
Total Population of Piltzville is 650.
What is the Total Male Population of Piltzville?
Total Male Population of Piltzville is 377.
What is the Total Female Population of Piltzville?
Total Female Population of Piltzville is 273.
What is the Ratio of Males per 100 Females in Piltzville?
There are 138.10 Males per 100 Females in Piltzville.
What is the Ratio of Females per 100 Males in Piltzville?
There are 72.41 Females per 100 Males in Piltzville.
What is the Median Population Age in Piltzville?
Median Population Age in Piltzville is 35.6 Years.
What is the Average Family Size in Piltzville
Average Family Size in Piltzville is 2.7 People.
What is the Average Household Size in Piltzville
Average Household Size in Piltzville is 3.1 People.
What is Per Capita Income in Piltzville?
Per Capita income in Piltzville is $29,329.
What is the Median Family Income in Piltzville?
Median Family Income in Piltzville is $94,256.
What is the Median Household income in Piltzville?
Median Household Income in Piltzville is $94,851.
What is Income or Wage Gap in Piltzville?
Income or Wage Gap in Piltzville is 37.3%.
Women in Piltzville earn 62.7 cents for every dollar earned by a man.
What is Inequality or Gini Index in Piltzville?
Inequality or Gini Index in Piltzville is 0.16.
How Large is the Labor Force in Piltzville?
There are 436 People in the Labor Forcein in Piltzville.
What is the Percentage of People in the Labor Force in Piltzville?
76.6% of People are in the Labor Force in Piltzville.