Troy, MT
Troy Map
Troy Overview
884
TOTAL POPULATION
450
MALE POPULATION
434
FEMALE POPULATION
103.69
MALES / 100 FEMALES
96.44
FEMALES / 100 MALES
34.7
MEDIAN AGE
3.2
AVG FAMILY SIZE
2.5
AVG HOUSEHOLD SIZE
$20,956
PER CAPITA INCOME
$43,068
AVG FAMILY INCOME
$32,784
AVG HOUSEHOLD INCOME
0.45
INEQUALITY / GINI INDEX
304
LABOR FORCE [ PEOPLE ]
50.1%
PERCENT IN LABOR FORCE
1.3%
UNEMPLOYMENT RATE
Troy Zip Codes
Troy Area Codes
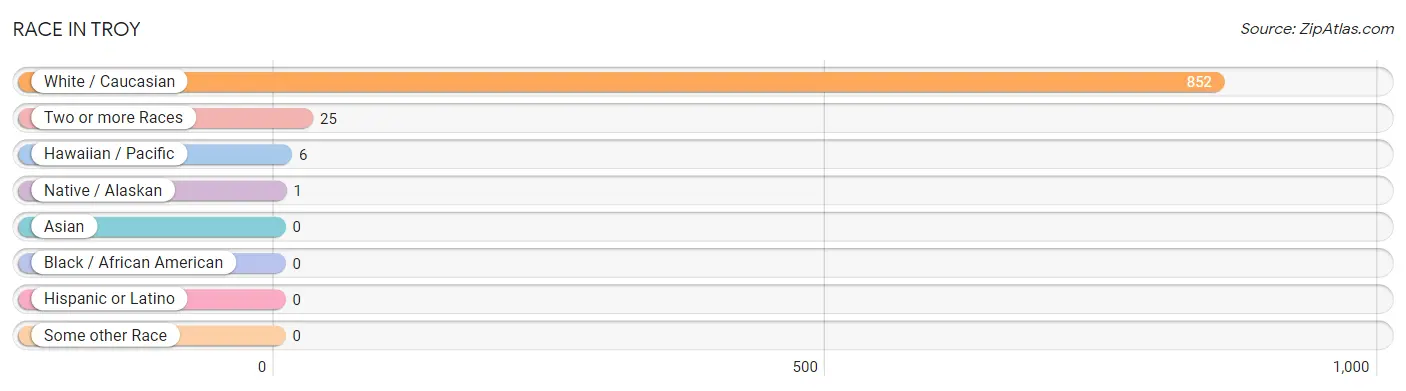
Race in Troy
The most populous races in Troy are White / Caucasian (852 | 96.4%), Two or more Races (25 | 2.8%), and Hawaiian / Pacific (6 | 0.7%).
| Race | # Population | % Population |
| Asian | 0 | 0.0% |
| Black / African American | 0 | 0.0% |
| Hawaiian / Pacific | 6 | 0.7% |
| Hispanic or Latino | 0 | 0.0% |
| Native / Alaskan | 1 | 0.1% |
| White / Caucasian | 852 | 96.4% |
| Two or more Races | 25 | 2.8% |
| Some other Race | 0 | 0.0% |
| Total | 884 | 100.0% |
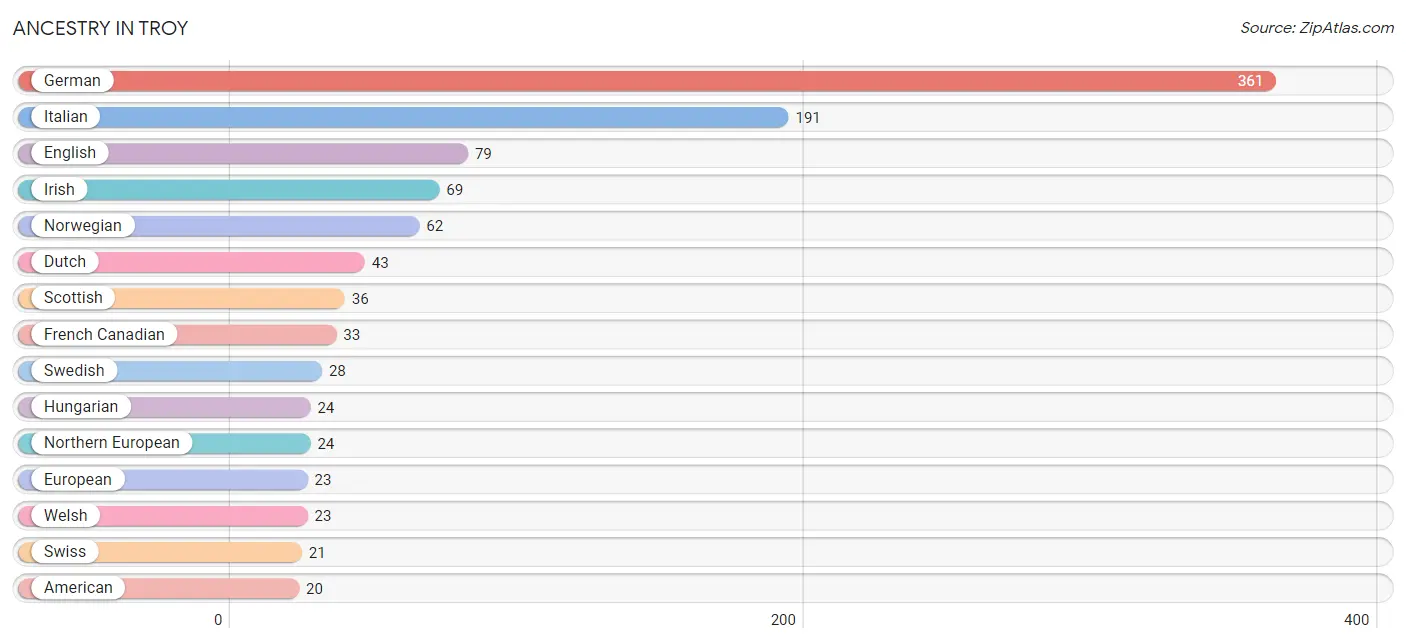
Ancestry in Troy
The most populous ancestries reported in Troy are German (361 | 40.8%), Italian (191 | 21.6%), English (79 | 8.9%), Irish (69 | 7.8%), and Norwegian (62 | 7.0%), together accounting for 86.2% of all Troy residents.
| Ancestry | # Population | % Population |
| American | 20 | 2.3% |
| Austrian | 13 | 1.5% |
| British | 11 | 1.2% |
| Comanche | 4 | 0.4% |
| Crow | 1 | 0.1% |
| Czechoslovakian | 4 | 0.4% |
| Danish | 11 | 1.2% |
| Dutch | 43 | 4.9% |
| English | 79 | 8.9% |
| European | 23 | 2.6% |
| Finnish | 11 | 1.2% |
| French | 11 | 1.2% |
| French Canadian | 33 | 3.7% |
| German | 361 | 40.8% |
| Hungarian | 24 | 2.7% |
| Irish | 69 | 7.8% |
| Italian | 191 | 21.6% |
| Native Hawaiian | 6 | 0.7% |
| Northern European | 24 | 2.7% |
| Norwegian | 62 | 7.0% |
| Russian | 11 | 1.2% |
| Scandinavian | 7 | 0.8% |
| Scotch-Irish | 4 | 0.4% |
| Scottish | 36 | 4.1% |
| Swedish | 28 | 3.2% |
| Swiss | 21 | 2.4% |
| Welsh | 23 | 2.6% | View All 27 Rows |
Immigrants in Troy

| Immigration Origin | # Population | % Population | View All 0 Rows |
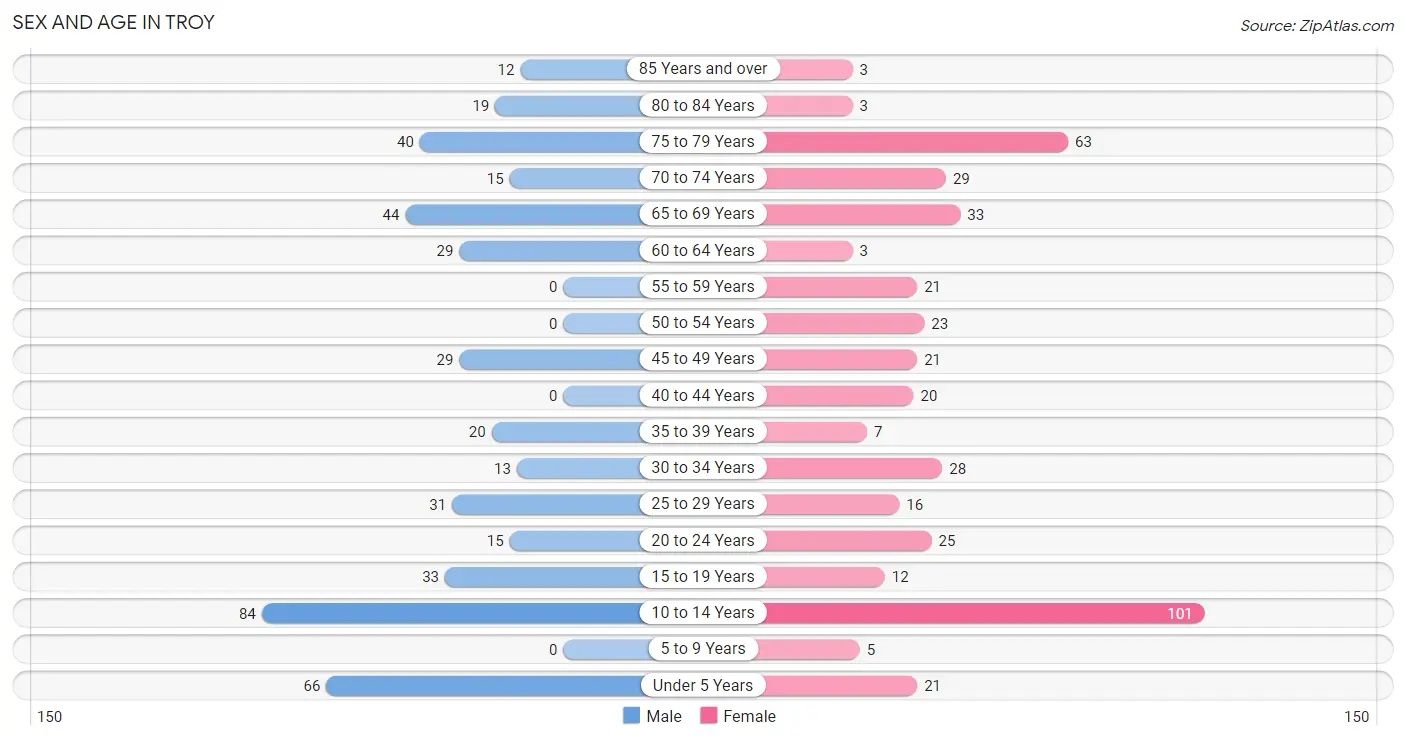
Sex and Age in Troy
Sex and Age in Troy
The most populous age groups in Troy are 10 to 14 Years (84 | 18.7%) for men and 10 to 14 Years (101 | 23.3%) for women.
| Age Bracket | Male | Female |
| Under 5 Years | 66 (14.7%) | 21 (4.8%) |
| 5 to 9 Years | 0 (0.0%) | 5 (1.1%) |
| 10 to 14 Years | 84 (18.7%) | 101 (23.3%) |
| 15 to 19 Years | 33 (7.3%) | 12 (2.8%) |
| 20 to 24 Years | 15 (3.3%) | 25 (5.8%) |
| 25 to 29 Years | 31 (6.9%) | 16 (3.7%) |
| 30 to 34 Years | 13 (2.9%) | 28 (6.5%) |
| 35 to 39 Years | 20 (4.4%) | 7 (1.6%) |
| 40 to 44 Years | 0 (0.0%) | 20 (4.6%) |
| 45 to 49 Years | 29 (6.4%) | 21 (4.8%) |
| 50 to 54 Years | 0 (0.0%) | 23 (5.3%) |
| 55 to 59 Years | 0 (0.0%) | 21 (4.8%) |
| 60 to 64 Years | 29 (6.4%) | 3 (0.7%) |
| 65 to 69 Years | 44 (9.8%) | 33 (7.6%) |
| 70 to 74 Years | 15 (3.3%) | 29 (6.7%) |
| 75 to 79 Years | 40 (8.9%) | 63 (14.5%) |
| 80 to 84 Years | 19 (4.2%) | 3 (0.7%) |
| 85 Years and over | 12 (2.7%) | 3 (0.7%) |
| Total | 450 (100.0%) | 434 (100.0%) |
Families and Households in Troy
Median Family Size in Troy
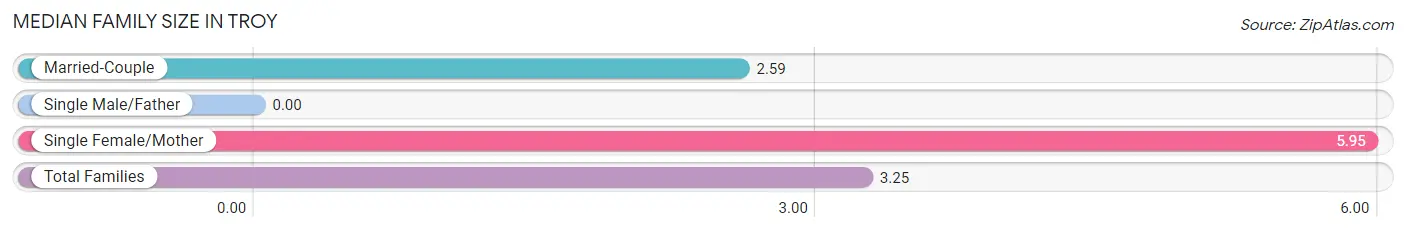
| Family Type | # Families | Family Size |
| Married-Couple | 179 (80.3%) | 2.59 |
| Single Male/Father | 0 (0.0%) | - |
| Single Female/Mother | 44 (19.7%) | 5.95 |
| Total Families | 223 (100.0%) | 3.25 |
Median Household Size in Troy
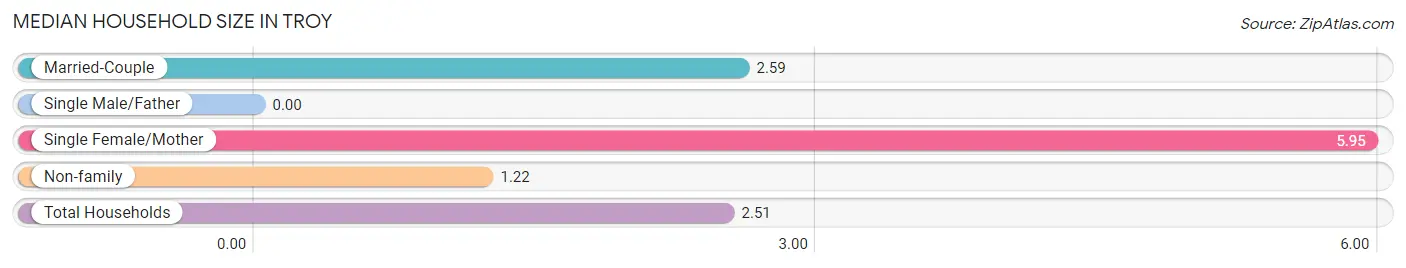
| Household Type | # Households | Household Size |
| Married-Couple | 179 (51.0%) | 2.59 |
| Single Male/Father | 0 (0.0%) | - |
| Single Female/Mother | 44 (12.5%) | 5.95 |
| Non-family | 128 (36.5%) | 1.22 |
| Total Households | 351 (100.0%) | 2.51 |
Household Size by Marriage Status in Troy
Out of a total of 351 households in Troy, 223 (63.5%) are family households, while 128 (36.5%) are nonfamily households. The most numerous type of family households are 2-person households, comprising 143, and the most common type of nonfamily households are 1-person households, comprising 96.
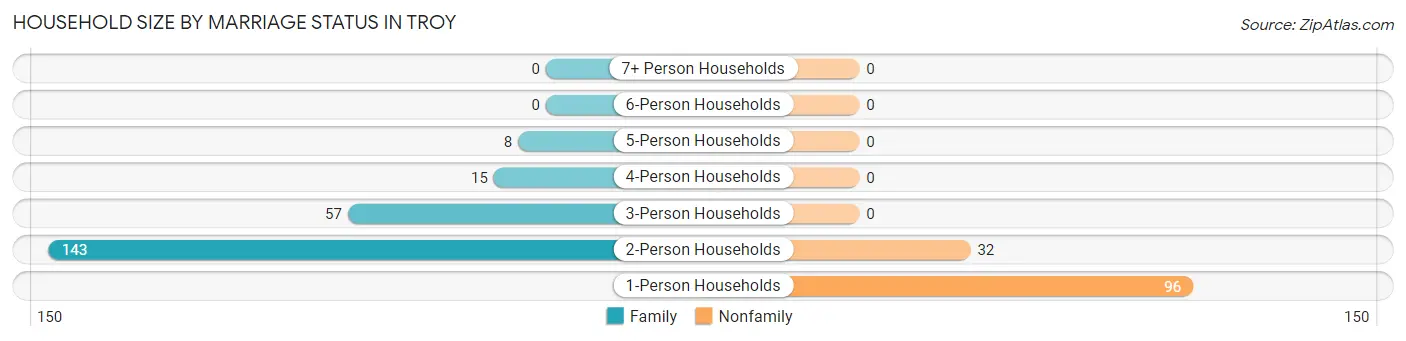
| Household Size | Family Households | Nonfamily Households |
| 1-Person Households | - | 96 (27.4%) |
| 2-Person Households | 143 (40.7%) | 32 (9.1%) |
| 3-Person Households | 57 (16.2%) | 0 (0.0%) |
| 4-Person Households | 15 (4.3%) | 0 (0.0%) |
| 5-Person Households | 8 (2.3%) | 0 (0.0%) |
| 6-Person Households | 0 (0.0%) | 0 (0.0%) |
| 7+ Person Households | 0 (0.0%) | 0 (0.0%) |
| Total | 223 (63.5%) | 128 (36.5%) |
Female Fertility in Troy
Fertility by Age in Troy
Average fertility rate in Troy is 48.0 births per 1,000 women. Women in the age bracket of 35 to 50 years have the highest fertility rate with 108.0 births per 1,000 women. Women in the age bracket of 35 to 50 years acount for 100.0% of all women with births.
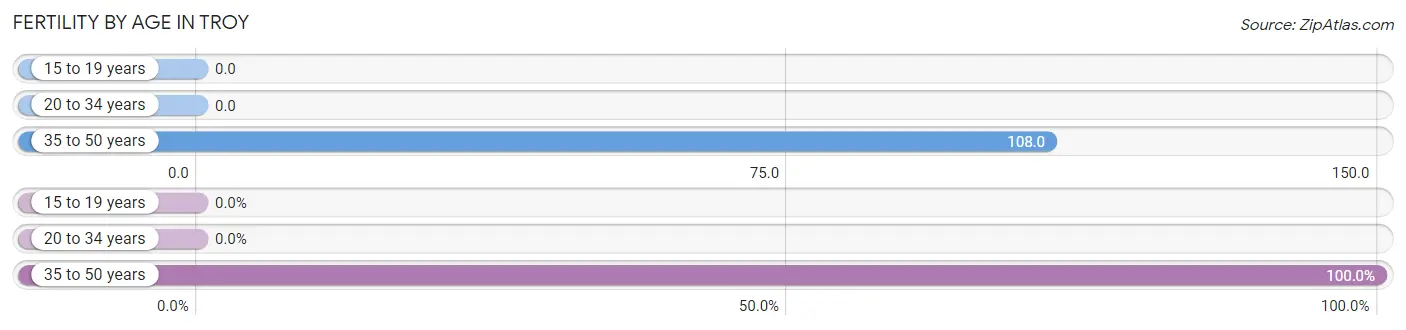
| Age Bracket | Women with Births | Births / 1,000 Women |
| 15 to 19 years | 0 (0.0%) | 0.0 |
| 20 to 34 years | 0 (0.0%) | 0.0 |
| 35 to 50 years | 7 (100.0%) | 108.0 |
| Total | 7 (100.0%) | 48.0 |
Fertility by Age by Marriage Status in Troy
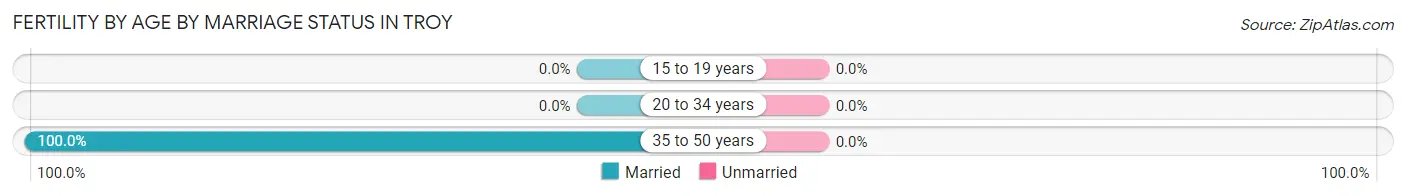
| Age Bracket | Married | Unmarried |
| 15 to 19 years | 0 (0.0%) | 0 (0.0%) |
| 20 to 34 years | 0 (0.0%) | 0 (0.0%) |
| 35 to 50 years | 7 (100.0%) | 0 (0.0%) |
| Total | 7 (100.0%) | 0 (0.0%) |
Fertility by Education in Troy
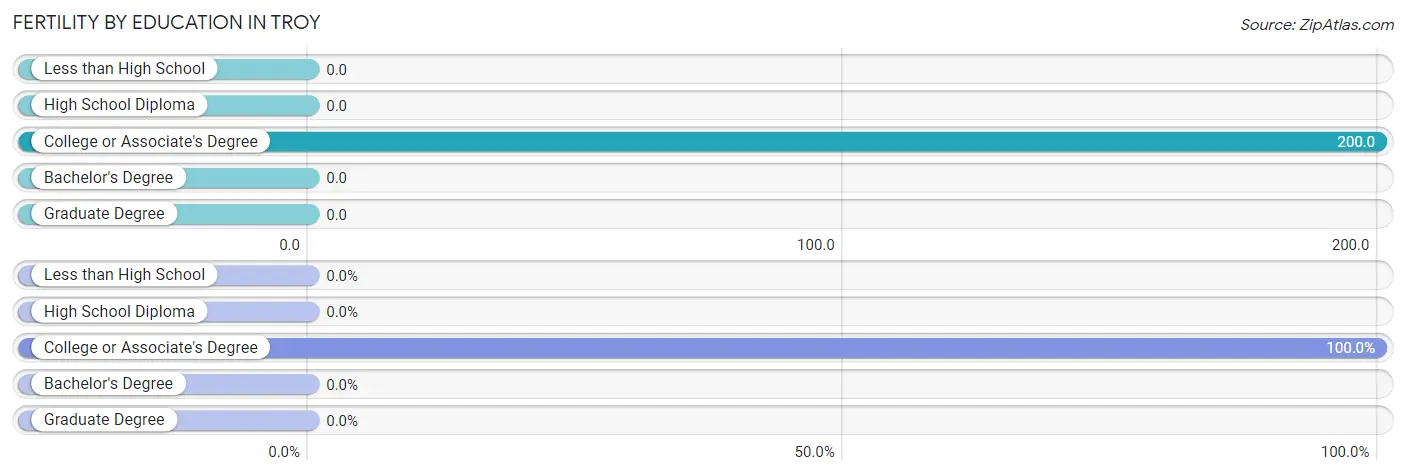
| Educational Attainment | Women with Births | Births / 1,000 Women |
| Less than High School | 0 (0.0%) | 0.0 |
| High School Diploma | 0 (0.0%) | 0.0 |
| College or Associate's Degree | 7 (100.0%) | 200.0 |
| Bachelor's Degree | 0 (0.0%) | 0.0 |
| Graduate Degree | 0 (0.0%) | 0.0 |
| Total | 7 (100.0%) | 48.0 |
Fertility by Education by Marriage Status in Troy
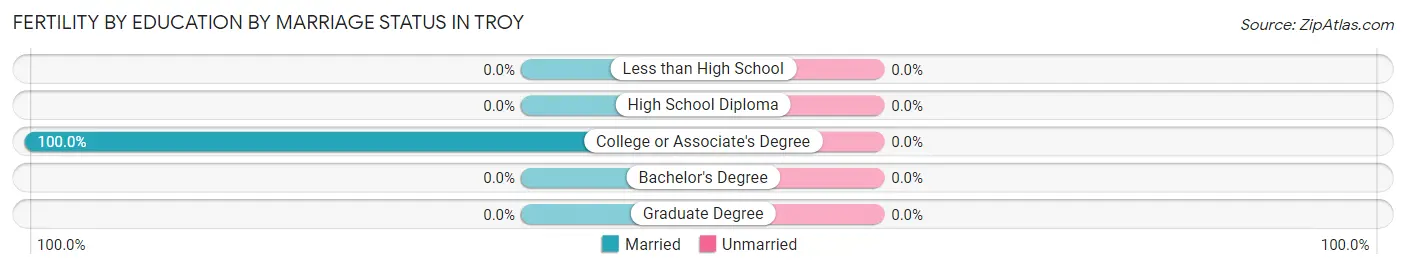
| Educational Attainment | Married | Unmarried |
| Less than High School | 0 (0.0%) | 0 (0.0%) |
| High School Diploma | 0 (0.0%) | 0 (0.0%) |
| College or Associate's Degree | 7 (100.0%) | 0 (0.0%) |
| Bachelor's Degree | 0 (0.0%) | 0 (0.0%) |
| Graduate Degree | 0 (0.0%) | 0 (0.0%) |
| Total | 7 (100.0%) | 0 (0.0%) |
Income in Troy
Income Overview in Troy
Per Capita Income in Troy is $20,956, while median incomes of families and households are $43,068 and $32,784 respectively.
| Characteristic | Number | Measure |
| Per Capita Income | 884 | $20,956 |
| Median Family Income | 223 | $43,068 |
| Mean Family Income | 223 | $61,095 |
| Median Household Income | 351 | $32,784 |
| Mean Household Income | 351 | $52,213 |
| Income Deficit | 223 | $0 |
| Wage / Income Gap (%) | 884 | 0.00% |
| Wage / Income Gap ($) | 884 | 100.00¢ per $1 |
| Gini / Inequality Index | 884 | 0.45 |
Earnings by Sex in Troy
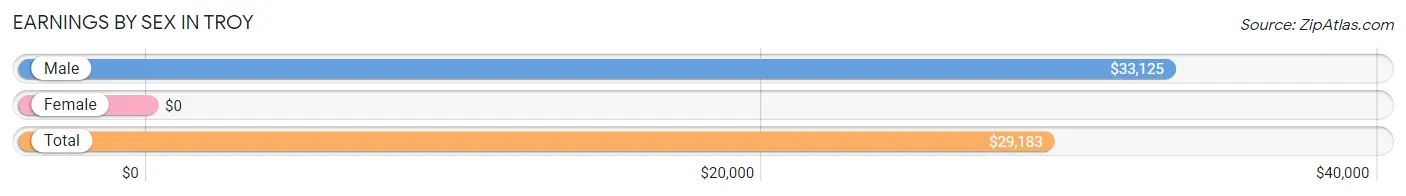
| Sex | Number | Average Earnings |
| Male | 188 (49.9%) | $33,125 |
| Female | 189 (50.1%) | $0 |
| Total | 377 (100.0%) | $29,183 |
Earnings by Sex by Income Bracket in Troy
The most common earnings brackets in Troy are $25,000 to $29,999 for men (33 | 17.5%) and $2,499 or less for women (36 | 19.1%).
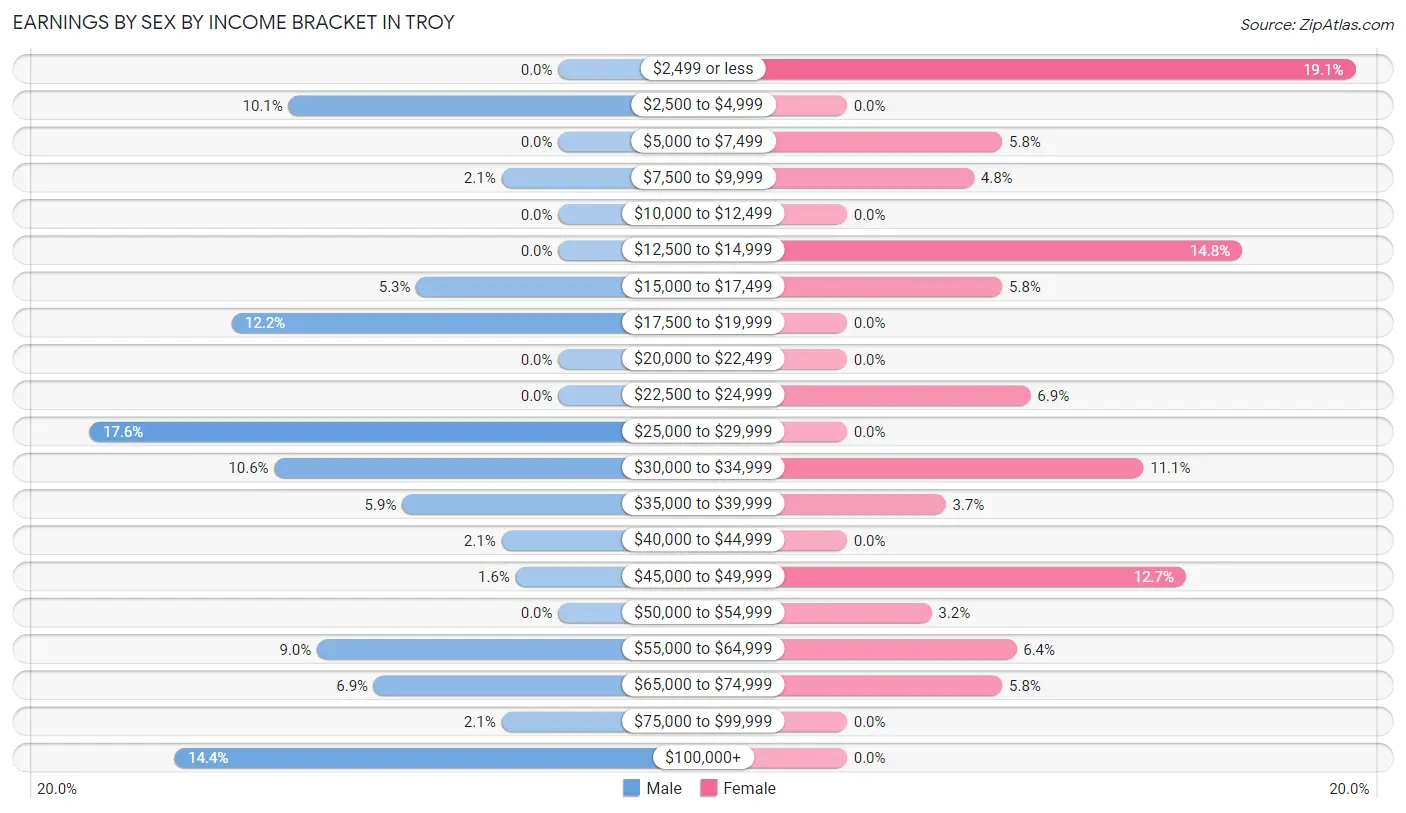
| Income | Male | Female |
| $2,499 or less | 0 (0.0%) | 36 (19.1%) |
| $2,500 to $4,999 | 19 (10.1%) | 0 (0.0%) |
| $5,000 to $7,499 | 0 (0.0%) | 11 (5.8%) |
| $7,500 to $9,999 | 4 (2.1%) | 9 (4.8%) |
| $10,000 to $12,499 | 0 (0.0%) | 0 (0.0%) |
| $12,500 to $14,999 | 0 (0.0%) | 28 (14.8%) |
| $15,000 to $17,499 | 10 (5.3%) | 11 (5.8%) |
| $17,500 to $19,999 | 23 (12.2%) | 0 (0.0%) |
| $20,000 to $22,499 | 0 (0.0%) | 0 (0.0%) |
| $22,500 to $24,999 | 0 (0.0%) | 13 (6.9%) |
| $25,000 to $29,999 | 33 (17.5%) | 0 (0.0%) |
| $30,000 to $34,999 | 20 (10.6%) | 21 (11.1%) |
| $35,000 to $39,999 | 11 (5.9%) | 7 (3.7%) |
| $40,000 to $44,999 | 4 (2.1%) | 0 (0.0%) |
| $45,000 to $49,999 | 3 (1.6%) | 24 (12.7%) |
| $50,000 to $54,999 | 0 (0.0%) | 6 (3.2%) |
| $55,000 to $64,999 | 17 (9.0%) | 12 (6.4%) |
| $65,000 to $74,999 | 13 (6.9%) | 11 (5.8%) |
| $75,000 to $99,999 | 4 (2.1%) | 0 (0.0%) |
| $100,000+ | 27 (14.4%) | 0 (0.0%) |
| Total | 188 (100.0%) | 189 (100.0%) |
Earnings by Sex by Educational Attainment in Troy
Average earnings in Troy are $29,423 for men and $22,981 for women, a difference of 21.9%. Men with an educational attainment of high school diploma enjoy the highest average annual earnings of $28,413, while those with high school diploma education earn the least with $28,413. Women with an educational attainment of high school diploma earn the most with the average annual earnings of $14,152, while those with high school diploma education have the smallest earnings of $14,152.
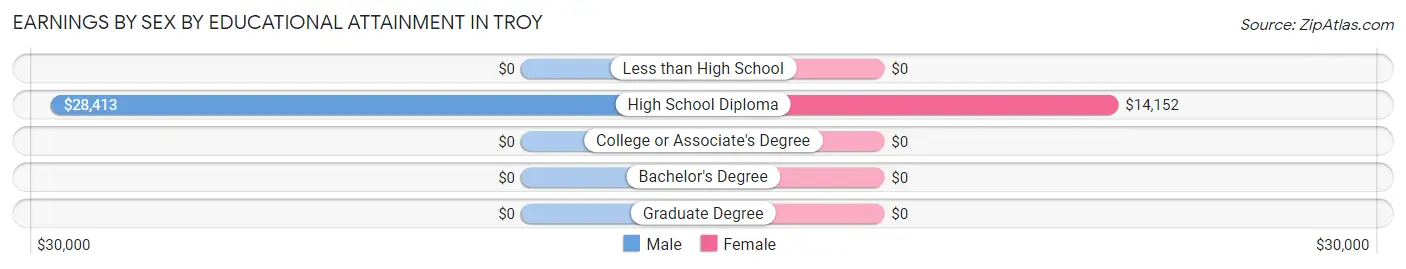
| Educational Attainment | Male Income | Female Income |
| Less than High School | - | - |
| High School Diploma | $28,413 | $14,152 |
| College or Associate's Degree | - | - |
| Bachelor's Degree | - | - |
| Graduate Degree | - | - |
| Total | $29,423 | $22,981 |
Family Income in Troy
Family Income Brackets in Troy
According to the Troy family income data, there are 59 families falling into the $15,000 to $24,999 income range, which is the most common income bracket and makes up 26.5% of all families.
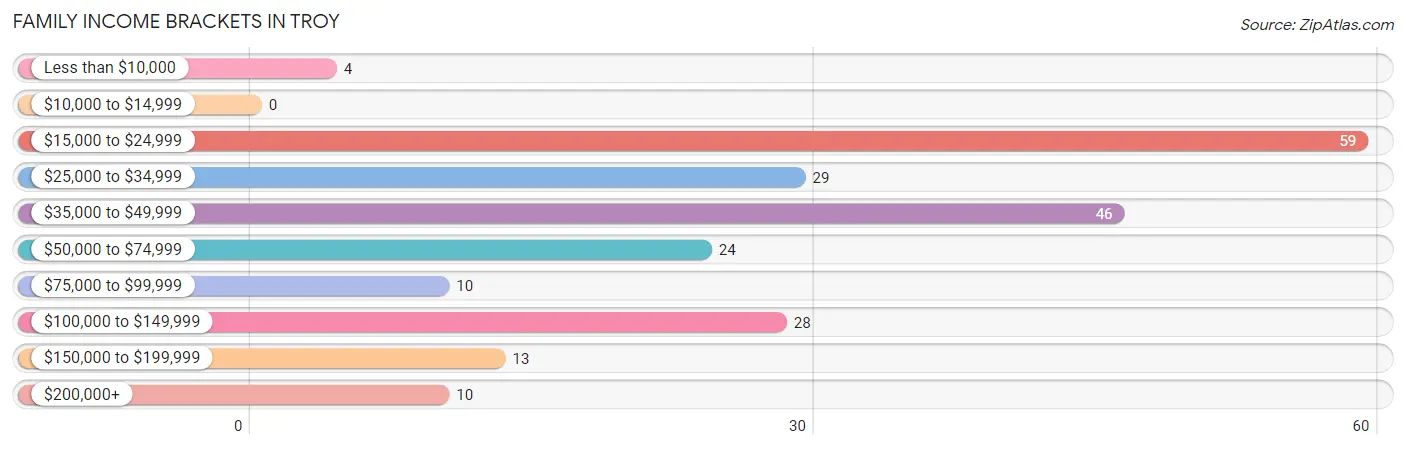
| Income Bracket | # Families | % Families |
| Less than $10,000 | 4 | 1.8% |
| $10,000 to $14,999 | 0 | 0.0% |
| $15,000 to $24,999 | 59 | 26.5% |
| $25,000 to $34,999 | 29 | 13.0% |
| $35,000 to $49,999 | 46 | 20.6% |
| $50,000 to $74,999 | 24 | 10.8% |
| $75,000 to $99,999 | 10 | 4.5% |
| $100,000 to $149,999 | 28 | 12.6% |
| $150,000 to $199,999 | 13 | 5.8% |
| $200,000+ | 10 | 4.5% |
Family Income by Famaliy Size in Troy
2-person families (143 | 64.1%) account for the highest median family income in Troy with $43,750 per family, while 2-person families (143 | 64.1%) have the highest median income of $21,875 per family member.
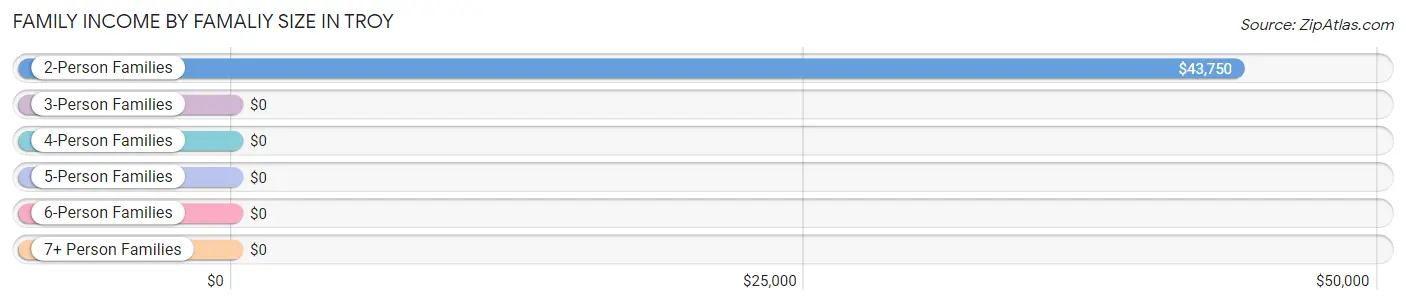
| Income Bracket | # Families | Median Income |
| 2-Person Families | 143 (64.1%) | $43,750 |
| 3-Person Families | 57 (25.6%) | $0 |
| 4-Person Families | 15 (6.7%) | $0 |
| 5-Person Families | 8 (3.6%) | $0 |
| 6-Person Families | 0 (0.0%) | $0 |
| 7+ Person Families | 0 (0.0%) | $0 |
| Total | 223 (100.0%) | $43,068 |
Family Income by Number of Earners in Troy
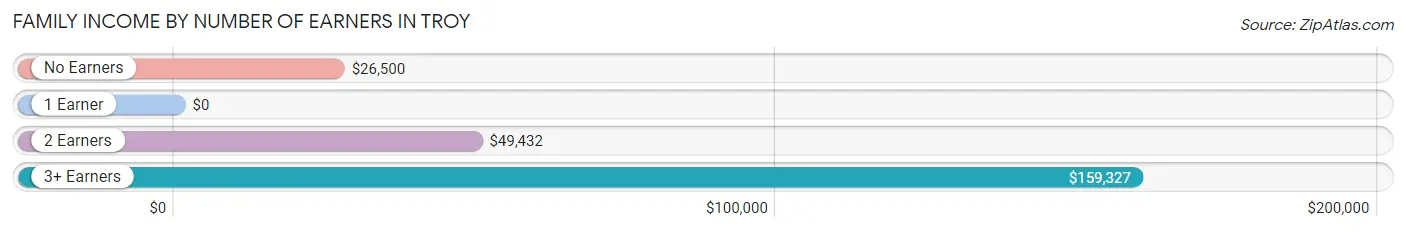
| Number of Earners | # Families | Median Income |
| No Earners | 46 (20.6%) | $26,500 |
| 1 Earner | 91 (40.8%) | $0 |
| 2 Earners | 59 (26.5%) | $49,432 |
| 3+ Earners | 27 (12.1%) | $159,327 |
| Total | 223 (100.0%) | $43,068 |
Household Income in Troy
Household Income Brackets in Troy
With 97 households falling in the category, the $15,000 to $24,999 income range is the most frequent in Troy, accounting for 27.6% of all households. In contrast, only 6 households (1.7%) fall into the less than $10,000 income bracket, making it the least populous group.
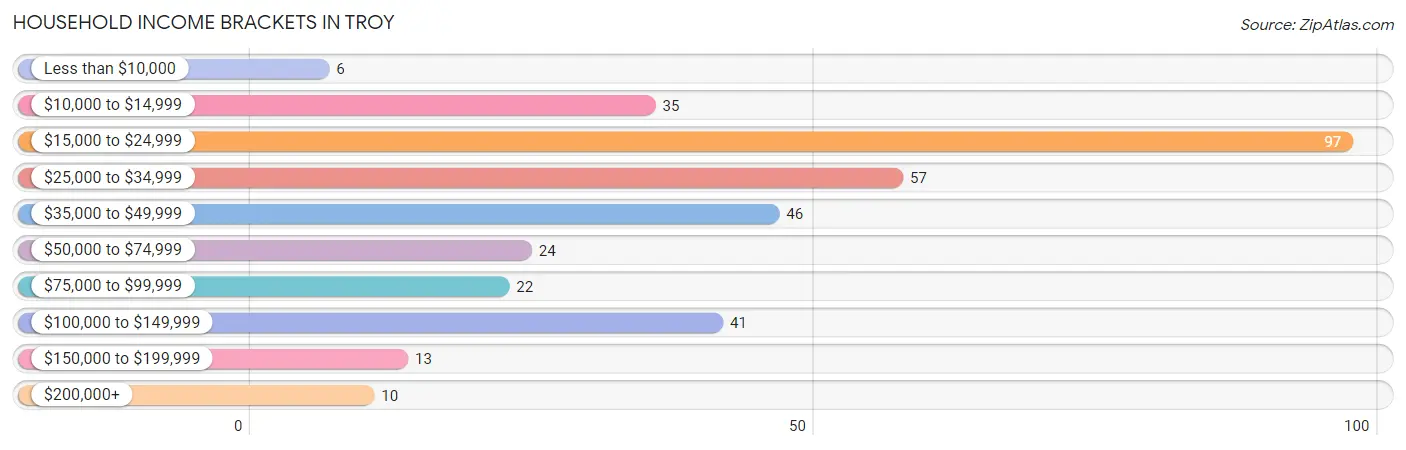
| Income Bracket | # Households | % Households |
| Less than $10,000 | 6 | 1.7% |
| $10,000 to $14,999 | 35 | 10.0% |
| $15,000 to $24,999 | 97 | 27.6% |
| $25,000 to $34,999 | 57 | 16.2% |
| $35,000 to $49,999 | 46 | 13.1% |
| $50,000 to $74,999 | 24 | 6.8% |
| $75,000 to $99,999 | 22 | 6.3% |
| $100,000 to $149,999 | 41 | 11.7% |
| $150,000 to $199,999 | 13 | 3.7% |
| $200,000+ | 10 | 2.8% |
Household Income by Householder Age in Troy
The median household income in Troy is $32,784, with the highest median household income of $26,131 found in the 65+ years age bracket for the primary householder. A total of 191 households (54.4%) fall into this category. Meanwhile, the 15 to 24 years age bracket for the primary householder has the lowest median household income of $0, with 18 households (5.1%) in this group.
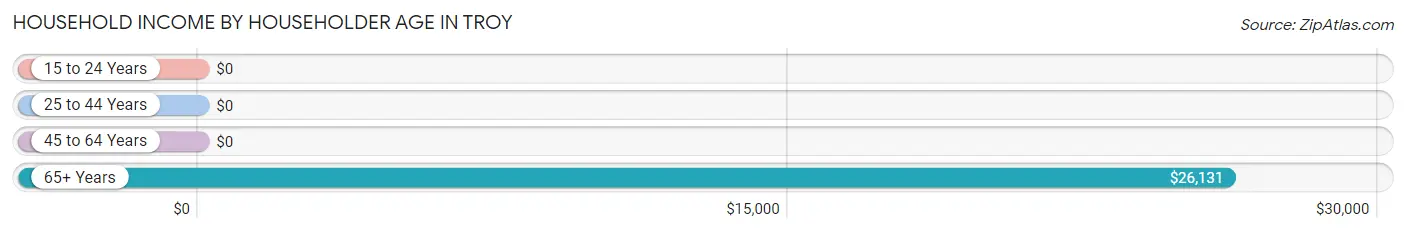
| Income Bracket | # Households | Median Income |
| 15 to 24 Years | 18 (5.1%) | $0 |
| 25 to 44 Years | 86 (24.5%) | $0 |
| 45 to 64 Years | 56 (16.0%) | $0 |
| 65+ Years | 191 (54.4%) | $26,131 |
| Total | 351 (100.0%) | $32,784 |
Poverty in Troy
Income Below Poverty by Sex and Age in Troy
With 23.8% poverty level for males and 35.9% for females among the residents of Troy, 12 to 14 year old males and 6 to 11 year old females are the most vulnerable to poverty, with 80 males (100.0%) and 5 females (100.0%) in their respective age groups living below the poverty level.
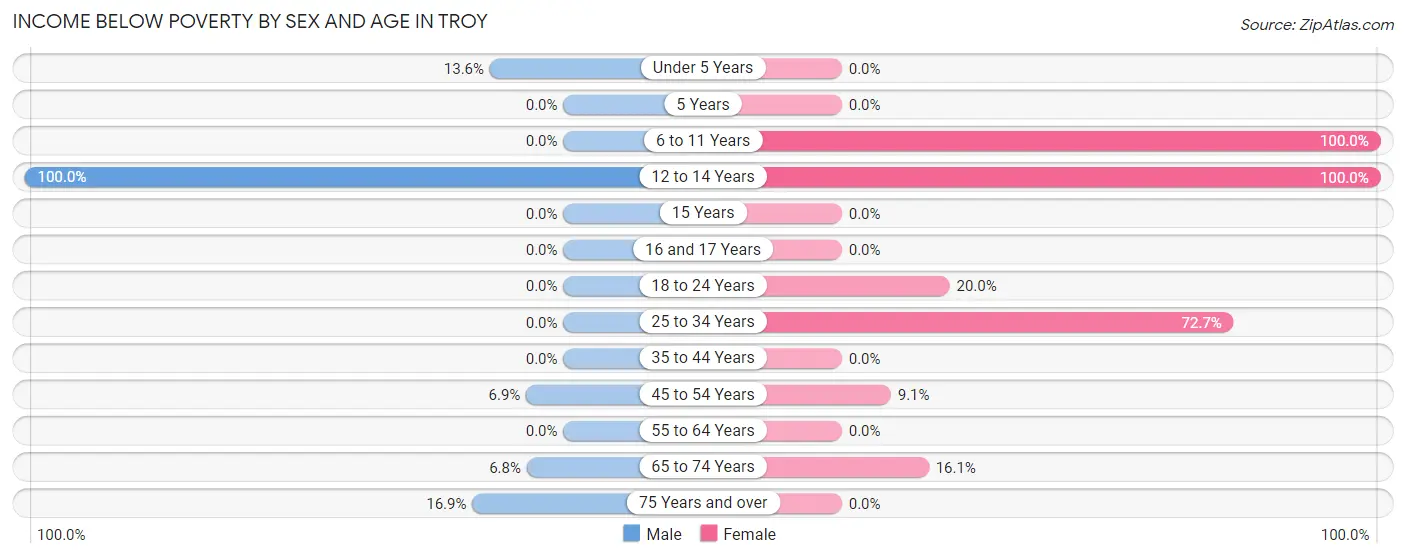
| Age Bracket | Male | Female |
| Under 5 Years | 9 (13.6%) | 0 (0.0%) |
| 5 Years | 0 (0.0%) | 0 (0.0%) |
| 6 to 11 Years | 0 (0.0%) | 5 (100.0%) |
| 12 to 14 Years | 80 (100.0%) | 99 (100.0%) |
| 15 Years | 0 (0.0%) | 0 (0.0%) |
| 16 and 17 Years | 0 (0.0%) | 0 (0.0%) |
| 18 to 24 Years | 0 (0.0%) | 5 (20.0%) |
| 25 to 34 Years | 0 (0.0%) | 32 (72.7%) |
| 35 to 44 Years | 0 (0.0%) | 0 (0.0%) |
| 45 to 54 Years | 2 (6.9%) | 4 (9.1%) |
| 55 to 64 Years | 0 (0.0%) | 0 (0.0%) |
| 65 to 74 Years | 4 (6.8%) | 10 (16.1%) |
| 75 Years and over | 12 (16.9%) | 0 (0.0%) |
| Total | 107 (23.8%) | 155 (35.9%) |
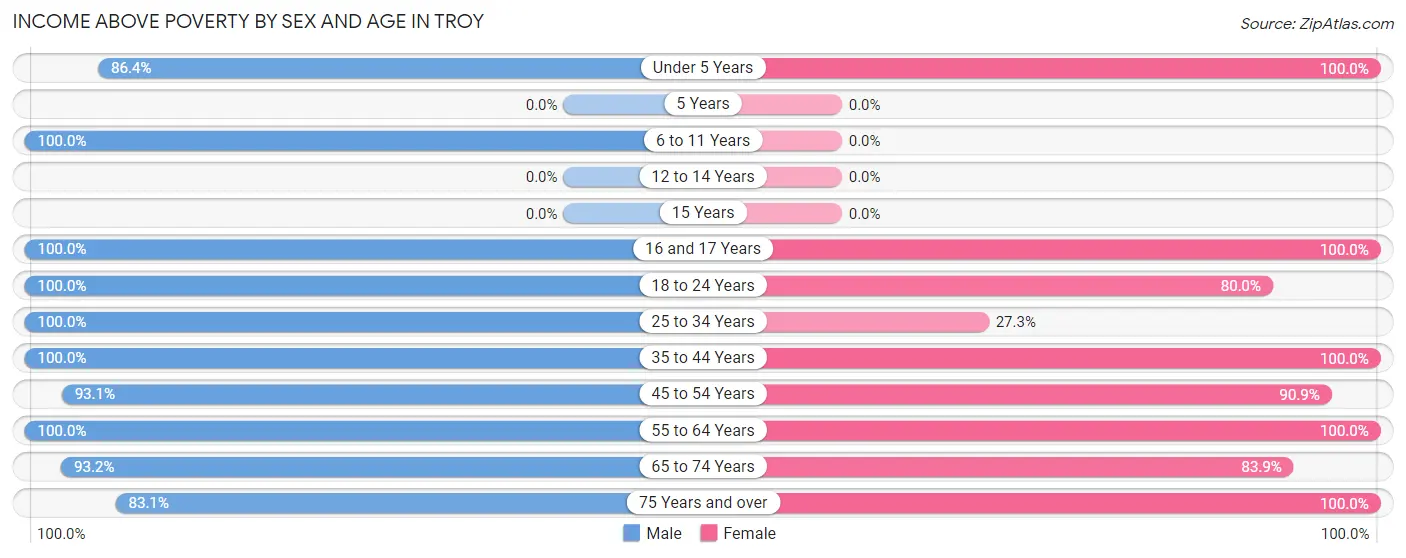
Income Above Poverty by Sex and Age in Troy
According to the poverty statistics in Troy, males aged 6 to 11 years and females aged under 5 years are the age groups that are most secure financially, with 100.0% of males and 100.0% of females in these age groups living above the poverty line.
| Age Bracket | Male | Female |
| Under 5 Years | 57 (86.4%) | 21 (100.0%) |
| 5 Years | 0 (0.0%) | 0 (0.0%) |
| 6 to 11 Years | 3 (100.0%) | 0 (0.0%) |
| 12 to 14 Years | 0 (0.0%) | 0 (0.0%) |
| 15 Years | 0 (0.0%) | 0 (0.0%) |
| 16 and 17 Years | 9 (100.0%) | 12 (100.0%) |
| 18 to 24 Years | 39 (100.0%) | 20 (80.0%) |
| 25 to 34 Years | 44 (100.0%) | 12 (27.3%) |
| 35 to 44 Years | 20 (100.0%) | 27 (100.0%) |
| 45 to 54 Years | 27 (93.1%) | 40 (90.9%) |
| 55 to 64 Years | 29 (100.0%) | 24 (100.0%) |
| 65 to 74 Years | 55 (93.2%) | 52 (83.9%) |
| 75 Years and over | 59 (83.1%) | 69 (100.0%) |
| Total | 342 (76.2%) | 277 (64.1%) |
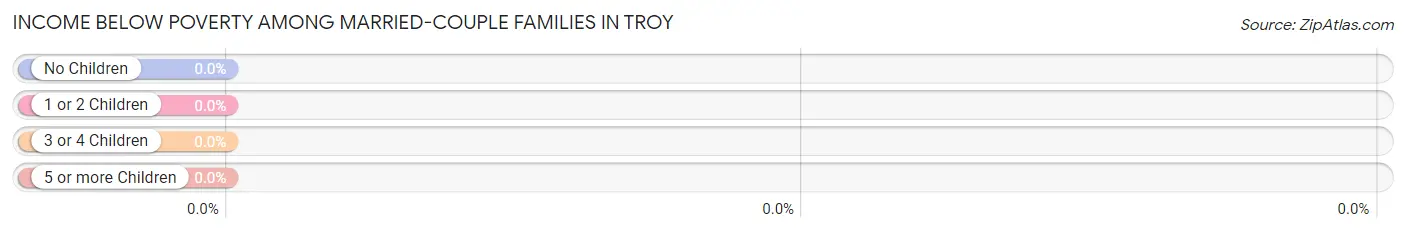
Income Below Poverty Among Married-Couple Families in Troy
| Children | Above Poverty | Below Poverty |
| No Children | 143 (100.0%) | 0 (0.0%) |
| 1 or 2 Children | 28 (100.0%) | 0 (0.0%) |
| 3 or 4 Children | 8 (100.0%) | 0 (0.0%) |
| 5 or more Children | 0 (0.0%) | 0 (0.0%) |
| Total | 179 (100.0%) | 0 (0.0%) |
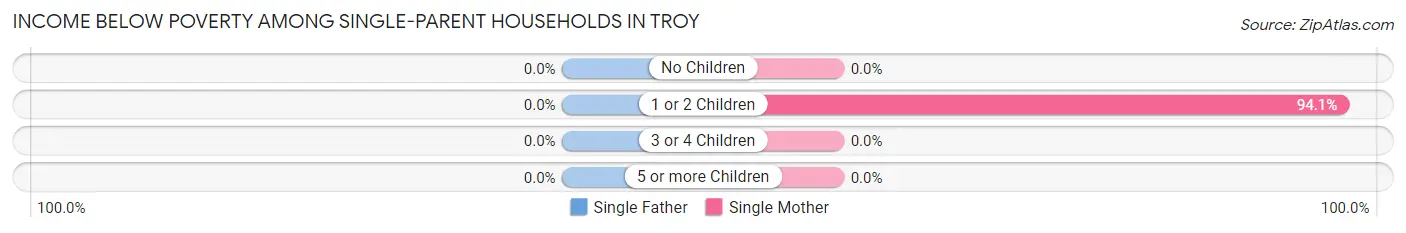
Income Below Poverty Among Single-Parent Households in Troy
| Children | Single Father | Single Mother |
| No Children | 0 (0.0%) | 0 (0.0%) |
| 1 or 2 Children | 0 (0.0%) | 32 (94.1%) |
| 3 or 4 Children | 0 (0.0%) | 0 (0.0%) |
| 5 or more Children | 0 (0.0%) | 0 (0.0%) |
| Total | 0 (0.0%) | 32 (72.7%) |
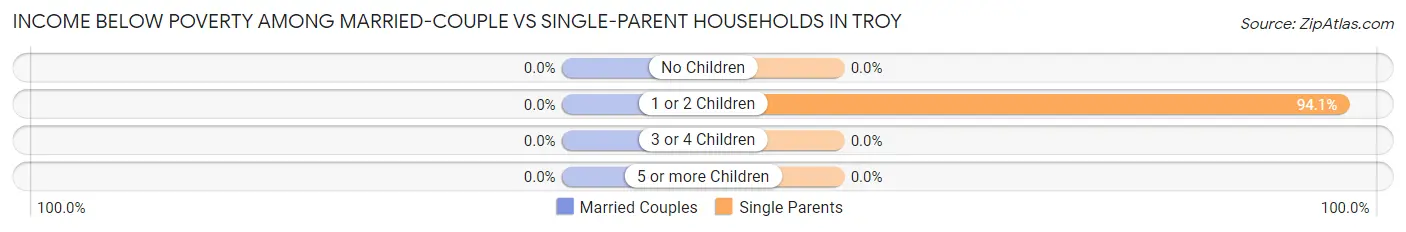
Income Below Poverty Among Married-Couple vs Single-Parent Households in Troy
| Children | Married-Couple Families | Single-Parent Households |
| No Children | 0 (0.0%) | 0 (0.0%) |
| 1 or 2 Children | 0 (0.0%) | 32 (94.1%) |
| 3 or 4 Children | 0 (0.0%) | 0 (0.0%) |
| 5 or more Children | 0 (0.0%) | 0 (0.0%) |
| Total | 0 (0.0%) | 32 (72.7%) |
Employment Characteristics in Troy
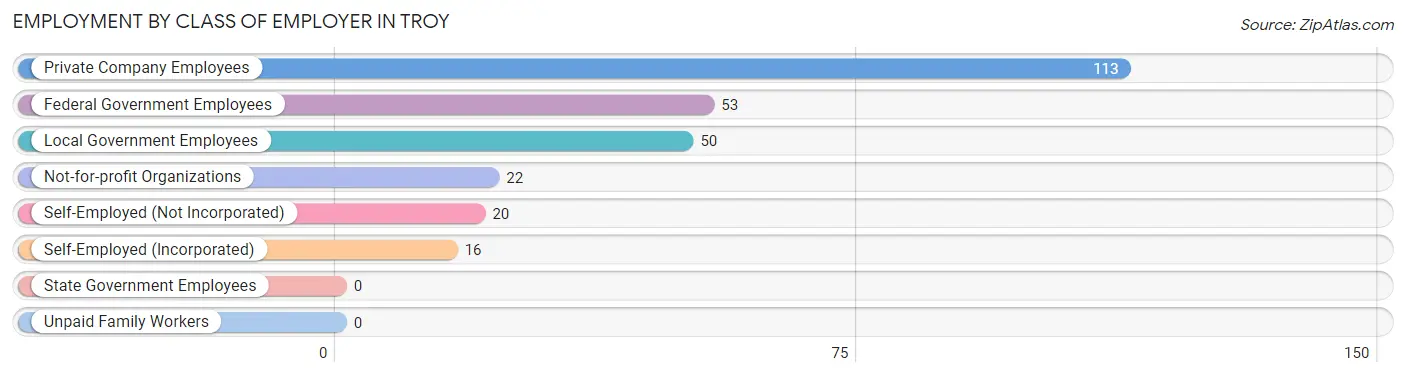
Employment by Class of Employer in Troy
Among the 274 employed individuals in Troy, private company employees (113 | 41.2%), federal government employees (53 | 19.3%), and local government employees (50 | 18.2%) make up the most common classes of employment.
| Employer Class | # Employees | % Employees |
| Private Company Employees | 113 | 41.2% |
| Self-Employed (Incorporated) | 16 | 5.8% |
| Self-Employed (Not Incorporated) | 20 | 7.3% |
| Not-for-profit Organizations | 22 | 8.0% |
| Local Government Employees | 50 | 18.2% |
| State Government Employees | 0 | 0.0% |
| Federal Government Employees | 53 | 19.3% |
| Unpaid Family Workers | 0 | 0.0% |
| Total | 274 | 100.0% |
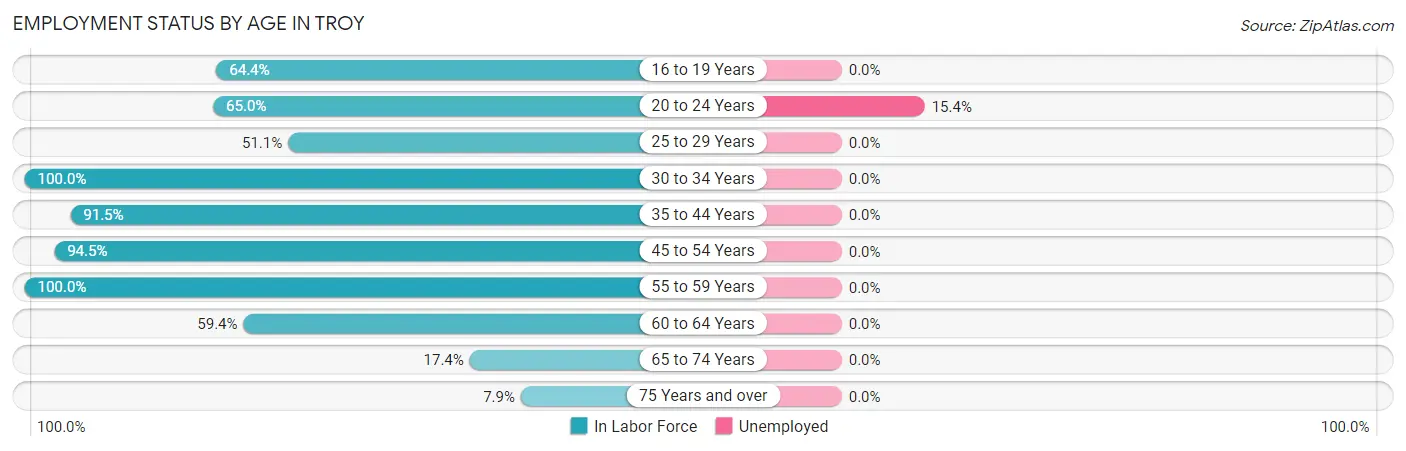
Employment Status by Age in Troy
According to the labor force statistics for Troy, out of the total population over 16 years of age (607), 50.1% or 304 individuals are in the labor force, with 1.3% or 4 of them unemployed. The age group with the highest labor force participation rate is 30 to 34 years, with 100.0% or 41 individuals in the labor force. Within the labor force, the 20 to 24 years age range has the highest percentage of unemployed individuals, with 15.4% or 4 of them being unemployed.
| Age Bracket | In Labor Force | Unemployed |
| 16 to 19 Years | 29 (64.4%) | 0 (0.0%) |
| 20 to 24 Years | 26 (65.0%) | 4 (15.4%) |
| 25 to 29 Years | 24 (51.1%) | 0 (0.0%) |
| 30 to 34 Years | 41 (100.0%) | 0 (0.0%) |
| 35 to 44 Years | 43 (91.5%) | 0 (0.0%) |
| 45 to 54 Years | 69 (94.5%) | 0 (0.0%) |
| 55 to 59 Years | 21 (100.0%) | 0 (0.0%) |
| 60 to 64 Years | 19 (59.4%) | 0 (0.0%) |
| 65 to 74 Years | 21 (17.4%) | 0 (0.0%) |
| 75 Years and over | 11 (7.9%) | 0 (0.0%) |
| Total | 304 (50.1%) | 4 (1.3%) |
Employment Status by Educational Attainment in Troy
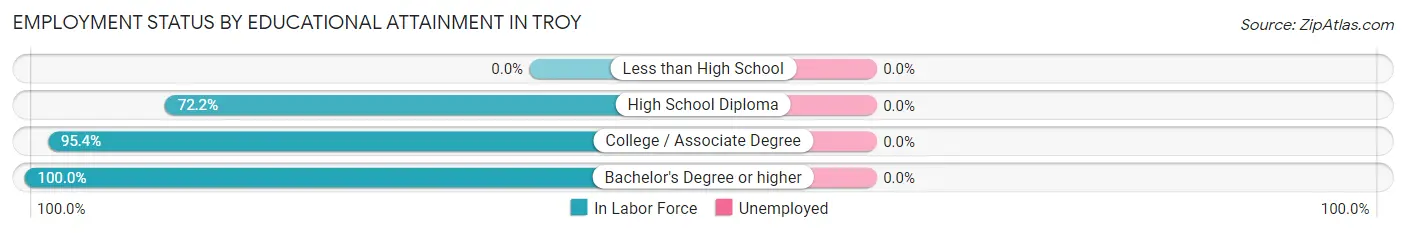
| Educational Attainment | In Labor Force | Unemployed |
| Less than High School | 0 (0.0%) | 0 (0.0%) |
| High School Diploma | 96 (72.2%) | 0 (0.0%) |
| College / Associate Degree | 83 (95.4%) | 0 (0.0%) |
| Bachelor's Degree or higher | 38 (100.0%) | 0 (0.0%) |
| Total | 217 (83.1%) | 0 (0.0%) |
Employment Occupations by Sex in Troy
Management, Business, Science and Arts Occupations
The most common Management, Business, Science and Arts occupations in Troy are Community & Social Service (53 | 17.7%), Education Instruction & Library (42 | 14.0%), Management (16 | 5.3%), Computers, Engineering & Science (12 | 4.0%), and Computers & Mathematics (12 | 4.0%).
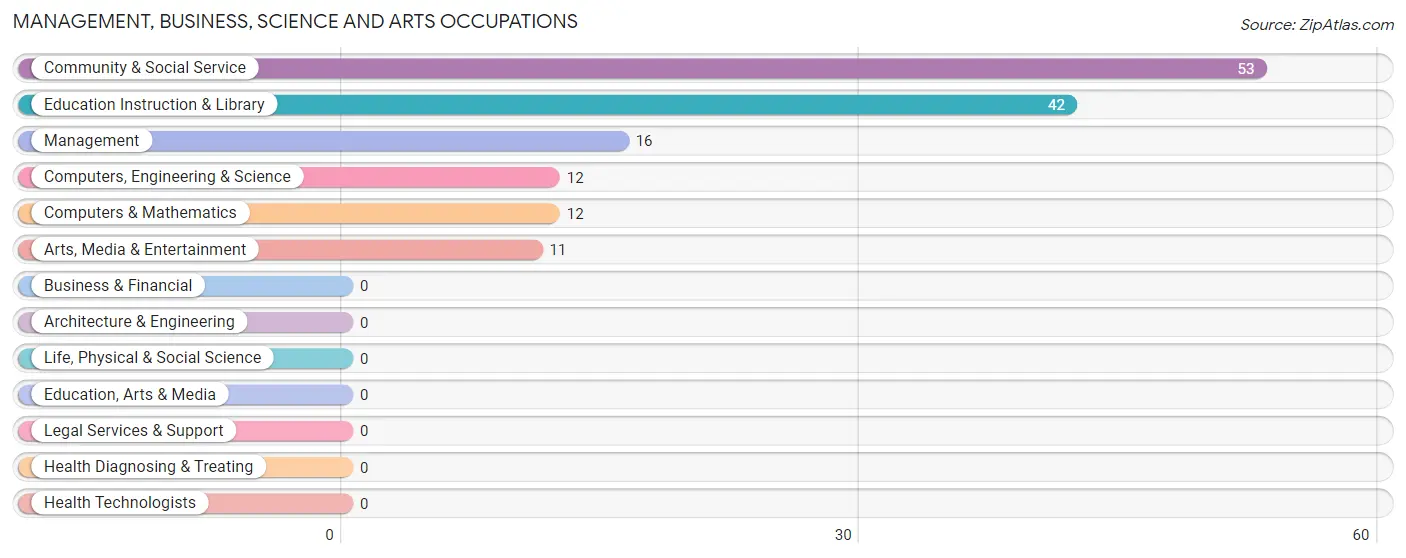
Management, Business, Science and Arts Occupations by Sex
Within the Management, Business, Science and Arts occupations in Troy, the most male-oriented occupations are Arts, Media & Entertainment (100.0%), Management (25.0%), and Community & Social Service (20.7%), while the most female-oriented occupations are Education Instruction & Library (100.0%), Computers, Engineering & Science (83.3%), and Computers & Mathematics (83.3%).
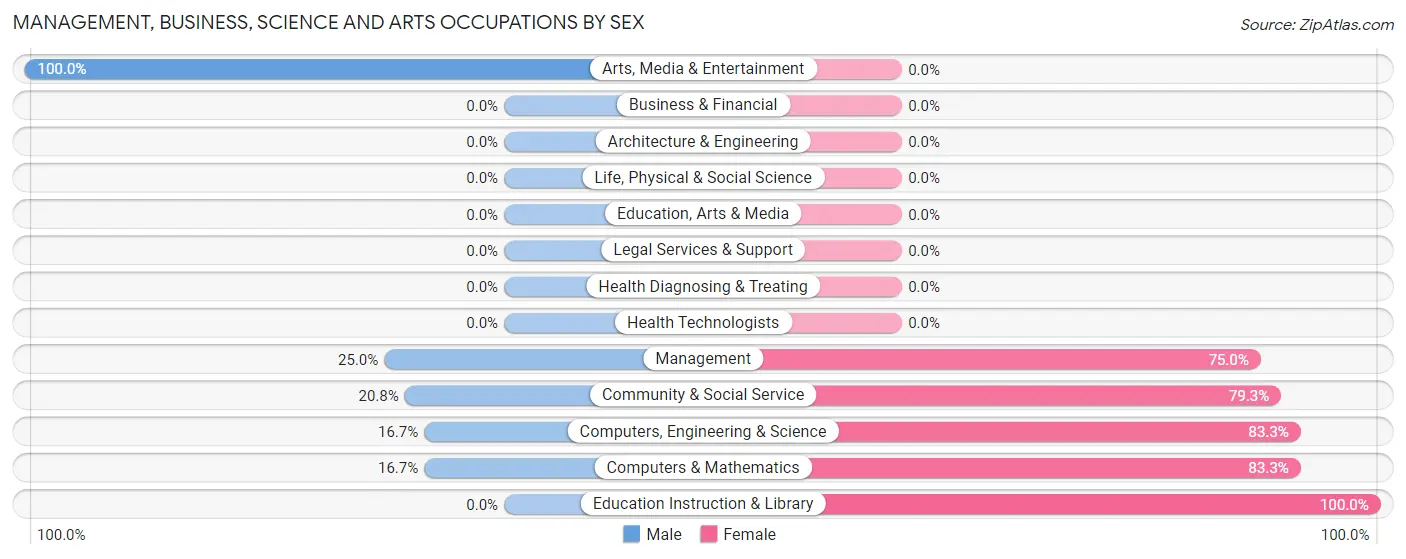
| Occupation | Male | Female |
| Management | 4 (25.0%) | 12 (75.0%) |
| Business & Financial | 0 (0.0%) | 0 (0.0%) |
| Computers, Engineering & Science | 2 (16.7%) | 10 (83.3%) |
| Computers & Mathematics | 2 (16.7%) | 10 (83.3%) |
| Architecture & Engineering | 0 (0.0%) | 0 (0.0%) |
| Life, Physical & Social Science | 0 (0.0%) | 0 (0.0%) |
| Community & Social Service | 11 (20.7%) | 42 (79.2%) |
| Education, Arts & Media | 0 (0.0%) | 0 (0.0%) |
| Legal Services & Support | 0 (0.0%) | 0 (0.0%) |
| Education Instruction & Library | 0 (0.0%) | 42 (100.0%) |
| Arts, Media & Entertainment | 11 (100.0%) | 0 (0.0%) |
| Health Diagnosing & Treating | 0 (0.0%) | 0 (0.0%) |
| Health Technologists | 0 (0.0%) | 0 (0.0%) |
| Total (Category) | 17 (21.0%) | 64 (79.0%) |
| Total (Overall) | 137 (45.7%) | 163 (54.3%) |
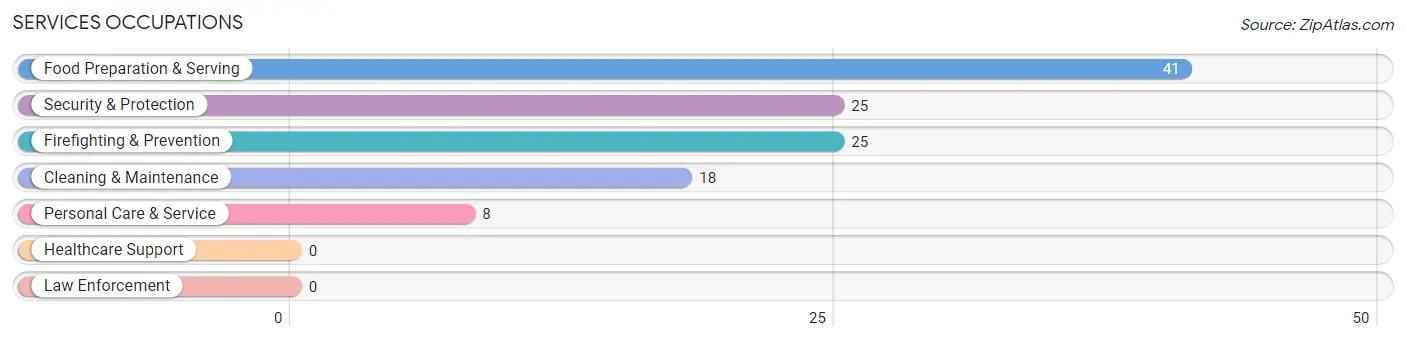
Services Occupations
The most common Services occupations in Troy are Food Preparation & Serving (41 | 13.7%), Security & Protection (25 | 8.3%), Firefighting & Prevention (25 | 8.3%), Cleaning & Maintenance (18 | 6.0%), and Personal Care & Service (8 | 2.7%).
Services Occupations by Sex
Within the Services occupations in Troy, the most male-oriented occupations are Security & Protection (100.0%), Firefighting & Prevention (100.0%), and Personal Care & Service (100.0%), while the most female-oriented occupations are Food Preparation & Serving (100.0%), and Cleaning & Maintenance (55.6%).
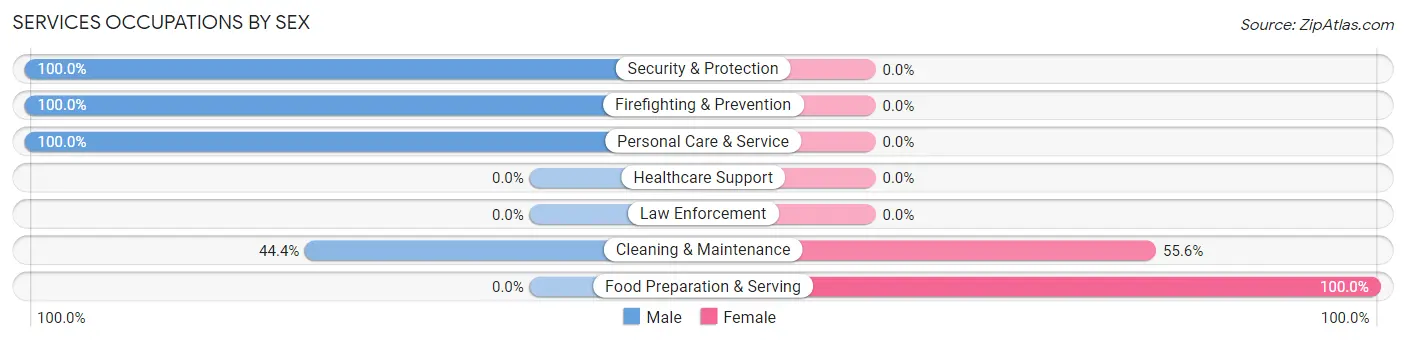
| Occupation | Male | Female |
| Healthcare Support | 0 (0.0%) | 0 (0.0%) |
| Security & Protection | 25 (100.0%) | 0 (0.0%) |
| Firefighting & Prevention | 25 (100.0%) | 0 (0.0%) |
| Law Enforcement | 0 (0.0%) | 0 (0.0%) |
| Food Preparation & Serving | 0 (0.0%) | 41 (100.0%) |
| Cleaning & Maintenance | 8 (44.4%) | 10 (55.6%) |
| Personal Care & Service | 8 (100.0%) | 0 (0.0%) |
| Total (Category) | 41 (44.6%) | 51 (55.4%) |
| Total (Overall) | 137 (45.7%) | 163 (54.3%) |
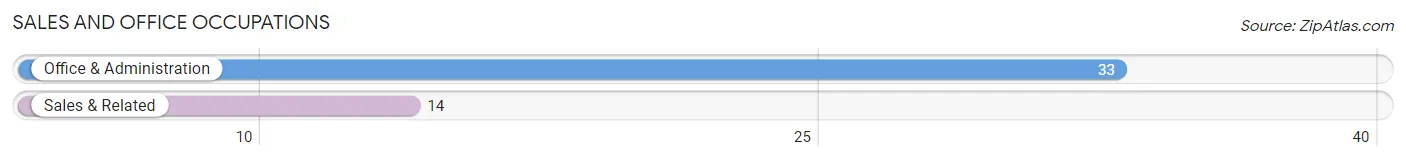
Sales and Office Occupations
The most common Sales and Office occupations in Troy are Office & Administration (33 | 11.0%), and Sales & Related (14 | 4.7%).
Sales and Office Occupations by Sex

| Occupation | Male | Female |
| Sales & Related | 14 (100.0%) | 0 (0.0%) |
| Office & Administration | 0 (0.0%) | 33 (100.0%) |
| Total (Category) | 14 (29.8%) | 33 (70.2%) |
| Total (Overall) | 137 (45.7%) | 163 (54.3%) |
Natural Resources, Construction and Maintenance Occupations
The most common Natural Resources, Construction and Maintenance occupations in Troy are Construction & Extraction (50 | 16.7%), Installation, Maintenance & Repair (14 | 4.7%), and Farming, Fishing & Forestry (9 | 3.0%).
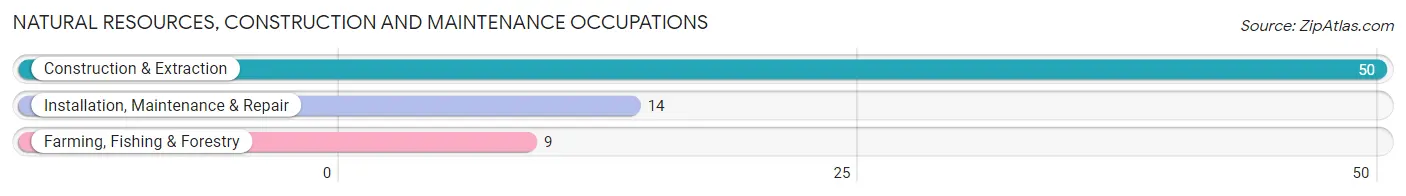
Natural Resources, Construction and Maintenance Occupations by Sex

| Occupation | Male | Female |
| Farming, Fishing & Forestry | 9 (100.0%) | 0 (0.0%) |
| Construction & Extraction | 50 (100.0%) | 0 (0.0%) |
| Installation, Maintenance & Repair | 3 (21.4%) | 11 (78.6%) |
| Total (Category) | 62 (84.9%) | 11 (15.1%) |
| Total (Overall) | 137 (45.7%) | 163 (54.3%) |
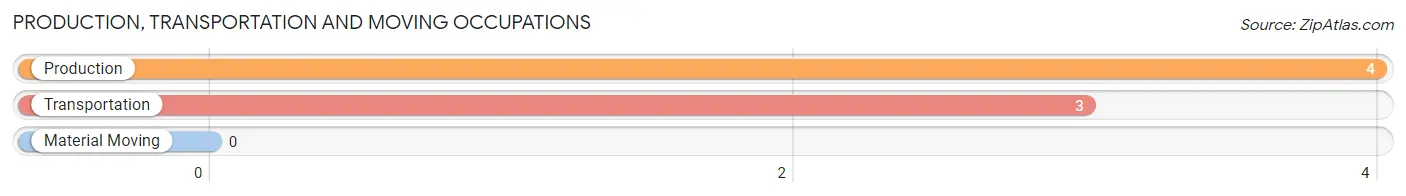
Production, Transportation and Moving Occupations
The most common Production, Transportation and Moving occupations in Troy are Production (4 | 1.3%), and Transportation (3 | 1.0%).
Production, Transportation and Moving Occupations by Sex
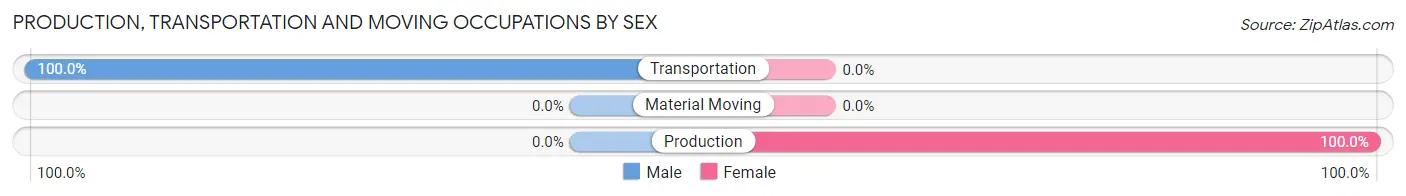
| Occupation | Male | Female |
| Production | 0 (0.0%) | 4 (100.0%) |
| Transportation | 3 (100.0%) | 0 (0.0%) |
| Material Moving | 0 (0.0%) | 0 (0.0%) |
| Total (Category) | 3 (42.9%) | 4 (57.1%) |
| Total (Overall) | 137 (45.7%) | 163 (54.3%) |
Employment Industries by Sex in Troy
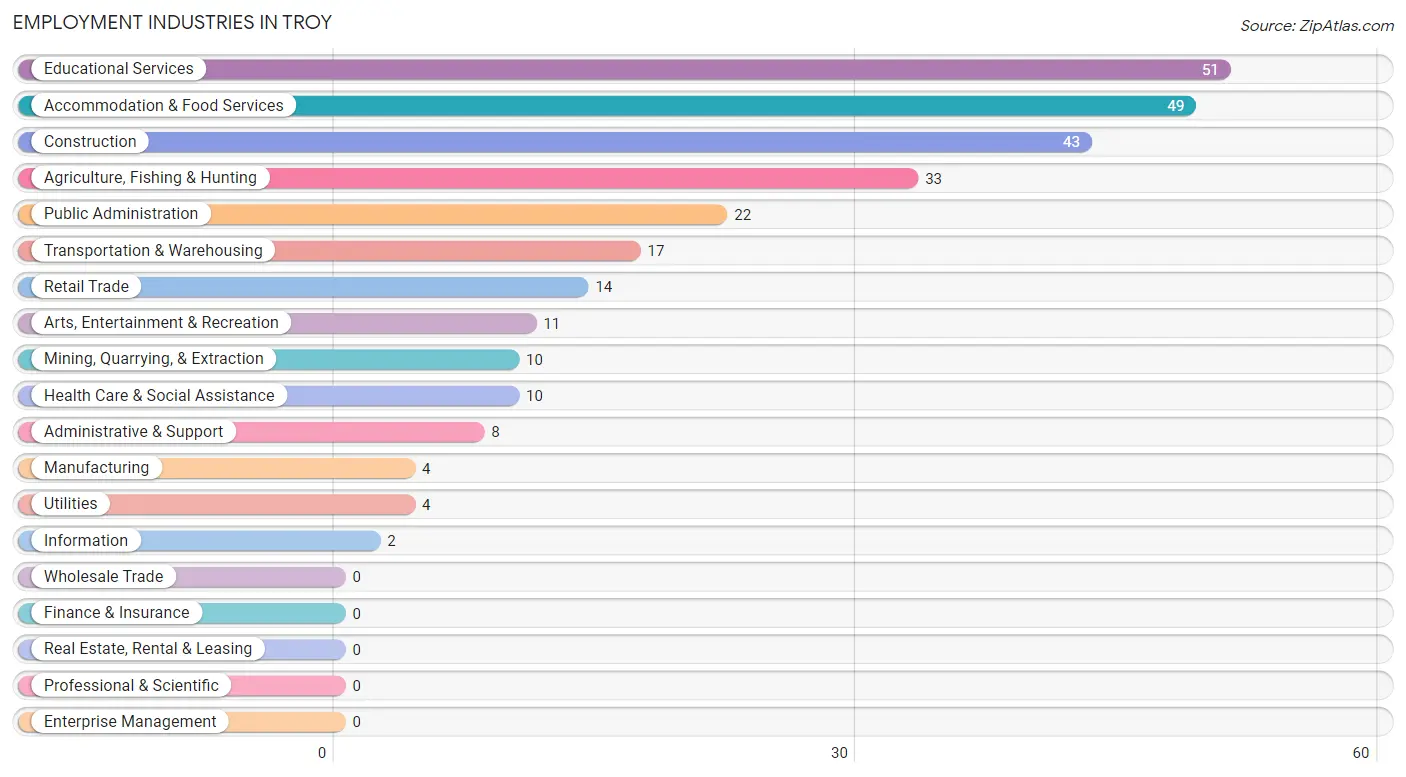
Employment Industries in Troy
The major employment industries in Troy include Educational Services (51 | 17.0%), Accommodation & Food Services (49 | 16.3%), Construction (43 | 14.3%), Agriculture, Fishing & Hunting (33 | 11.0%), and Public Administration (22 | 7.3%).
Employment Industries by Sex in Troy
The Troy industries that see more men than women are Mining, Quarrying, & Extraction (100.0%), Construction (100.0%), and Retail Trade (100.0%), whereas the industries that tend to have a higher number of women are Manufacturing (100.0%), Transportation & Warehousing (100.0%), and Health Care & Social Assistance (100.0%).
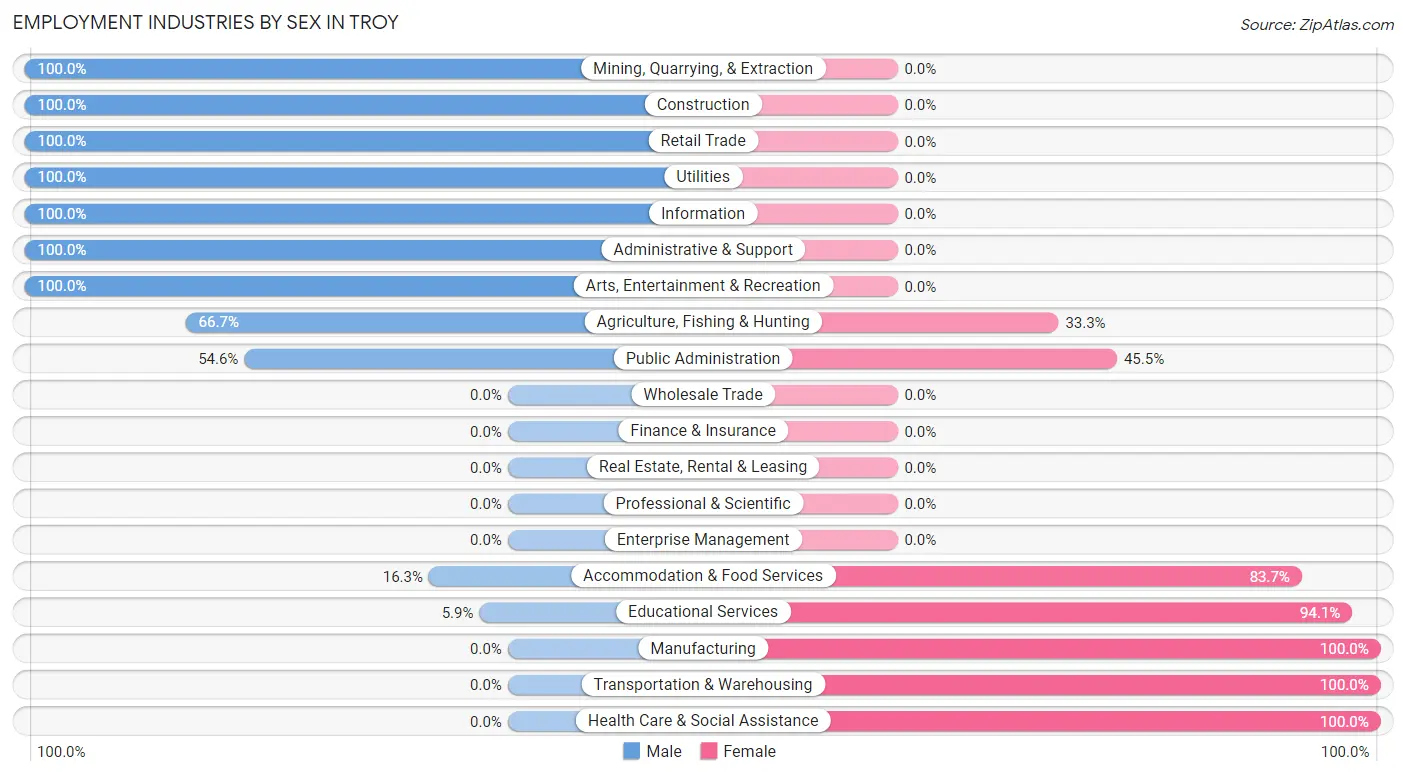
| Industry | Male | Female |
| Agriculture, Fishing & Hunting | 22 (66.7%) | 11 (33.3%) |
| Mining, Quarrying, & Extraction | 10 (100.0%) | 0 (0.0%) |
| Construction | 43 (100.0%) | 0 (0.0%) |
| Manufacturing | 0 (0.0%) | 4 (100.0%) |
| Wholesale Trade | 0 (0.0%) | 0 (0.0%) |
| Retail Trade | 14 (100.0%) | 0 (0.0%) |
| Transportation & Warehousing | 0 (0.0%) | 17 (100.0%) |
| Utilities | 4 (100.0%) | 0 (0.0%) |
| Information | 2 (100.0%) | 0 (0.0%) |
| Finance & Insurance | 0 (0.0%) | 0 (0.0%) |
| Real Estate, Rental & Leasing | 0 (0.0%) | 0 (0.0%) |
| Professional & Scientific | 0 (0.0%) | 0 (0.0%) |
| Enterprise Management | 0 (0.0%) | 0 (0.0%) |
| Administrative & Support | 8 (100.0%) | 0 (0.0%) |
| Educational Services | 3 (5.9%) | 48 (94.1%) |
| Health Care & Social Assistance | 0 (0.0%) | 10 (100.0%) |
| Arts, Entertainment & Recreation | 11 (100.0%) | 0 (0.0%) |
| Accommodation & Food Services | 8 (16.3%) | 41 (83.7%) |
| Public Administration | 12 (54.5%) | 10 (45.5%) |
| Total | 137 (45.7%) | 163 (54.3%) |
Education in Troy
School Enrollment in Troy
The most common levels of schooling among the 93 students in Troy are nursery / preschool (51 | 54.8%), high school (21 | 22.6%), and graduate / professional (13 | 14.0%).
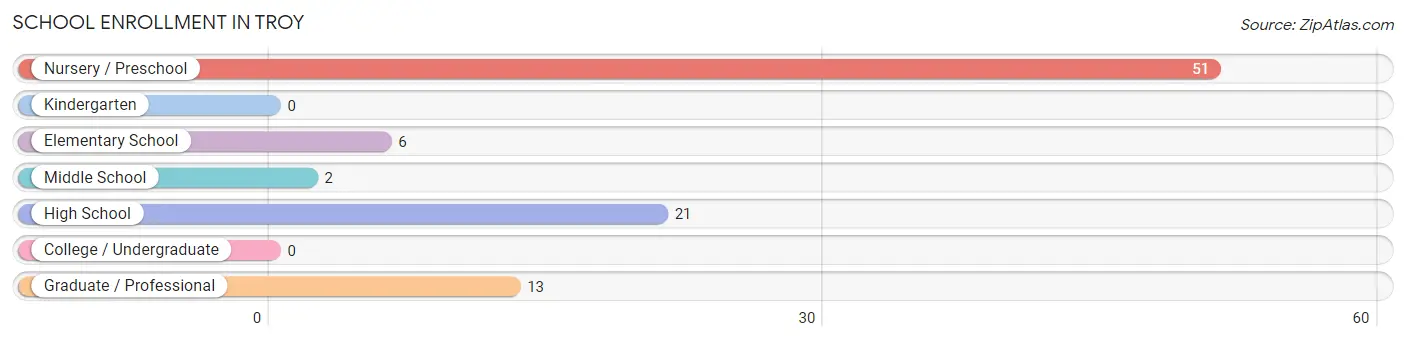
| School Level | # Students | % Students |
| Nursery / Preschool | 51 | 54.8% |
| Kindergarten | 0 | 0.0% |
| Elementary School | 6 | 6.5% |
| Middle School | 2 | 2.1% |
| High School | 21 | 22.6% |
| College / Undergraduate | 0 | 0.0% |
| Graduate / Professional | 13 | 14.0% |
| Total | 93 | 100.0% |
School Enrollment by Age by Funding Source in Troy
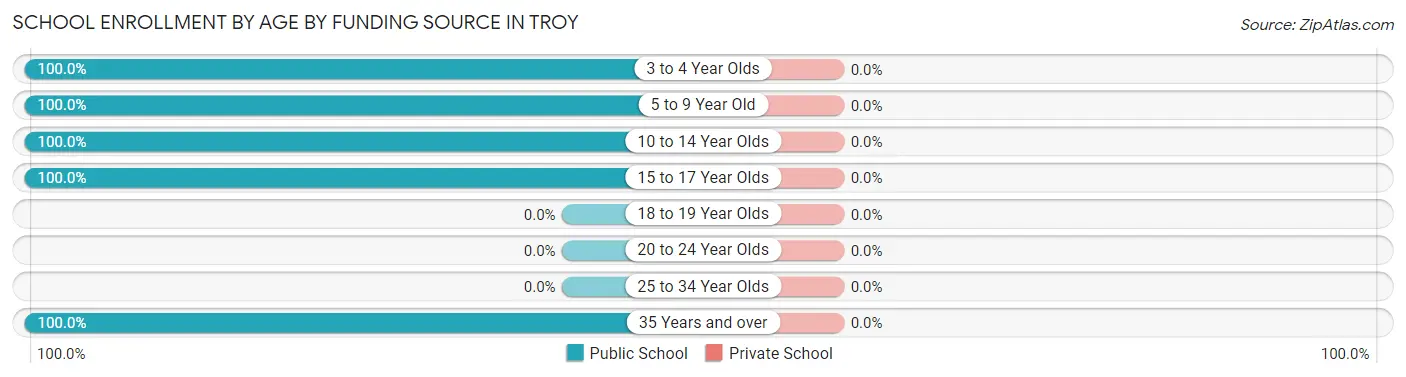
| Age Bracket | Public School | Private School |
| 3 to 4 Year Olds | 51 (100.0%) | 0 (0.0%) |
| 5 to 9 Year Old | 5 (100.0%) | 0 (0.0%) |
| 10 to 14 Year Olds | 3 (100.0%) | 0 (0.0%) |
| 15 to 17 Year Olds | 21 (100.0%) | 0 (0.0%) |
| 18 to 19 Year Olds | 0 (0.0%) | 0 (0.0%) |
| 20 to 24 Year Olds | 0 (0.0%) | 0 (0.0%) |
| 25 to 34 Year Olds | 0 (0.0%) | 0 (0.0%) |
| 35 Years and over | 13 (100.0%) | 0 (0.0%) |
| Total | 93 (100.0%) | 0 (0.0%) |
Educational Attainment by Field of Study in Troy
Bio, nature & agricultural (22 | 41.5%), education (18 | 34.0%), and literature & languages (13 | 24.5%) are the most common fields of study among 53 individuals in Troy who have obtained a bachelor's degree or higher.
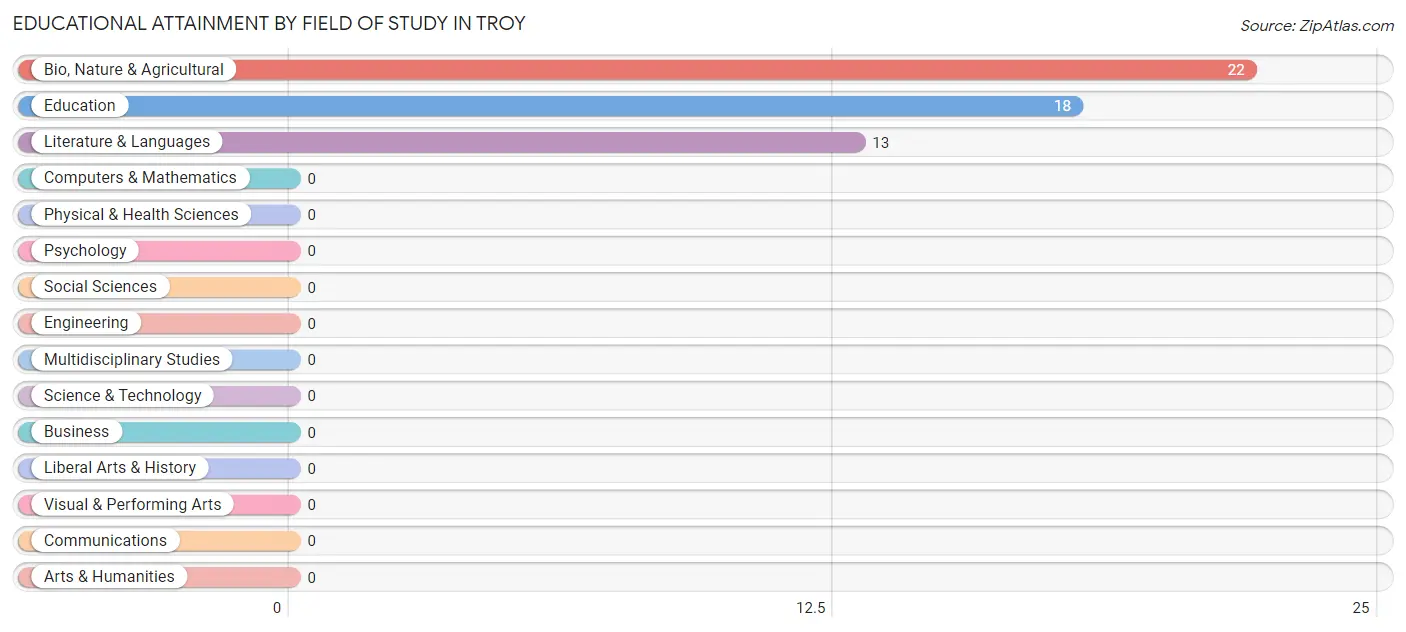
| Field of Study | # Graduates | % Graduates |
| Computers & Mathematics | 0 | 0.0% |
| Bio, Nature & Agricultural | 22 | 41.5% |
| Physical & Health Sciences | 0 | 0.0% |
| Psychology | 0 | 0.0% |
| Social Sciences | 0 | 0.0% |
| Engineering | 0 | 0.0% |
| Multidisciplinary Studies | 0 | 0.0% |
| Science & Technology | 0 | 0.0% |
| Business | 0 | 0.0% |
| Education | 18 | 34.0% |
| Literature & Languages | 13 | 24.5% |
| Liberal Arts & History | 0 | 0.0% |
| Visual & Performing Arts | 0 | 0.0% |
| Communications | 0 | 0.0% |
| Arts & Humanities | 0 | 0.0% |
| Total | 53 | 100.0% |
Transportation & Commute in Troy
Vehicle Availability by Sex in Troy
The most prevalent vehicle ownership categories in Troy are males with 2 vehicles (45, accounting for 34.9%) and females with 2 vehicles (70, making up 31.0%).
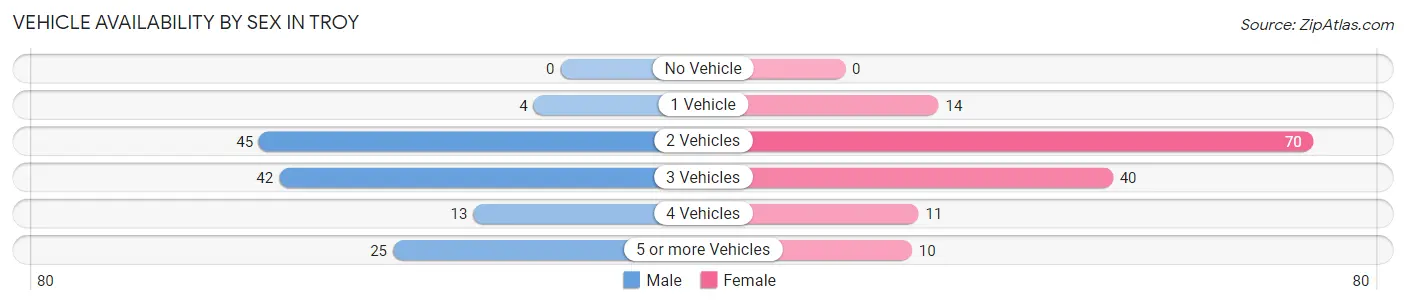
| Vehicles Available | Male | Female |
| No Vehicle | 0 (0.0%) | 0 (0.0%) |
| 1 Vehicle | 4 (3.1%) | 14 (9.7%) |
| 2 Vehicles | 45 (34.9%) | 70 (48.3%) |
| 3 Vehicles | 42 (32.6%) | 40 (27.6%) |
| 4 Vehicles | 13 (10.1%) | 11 (7.6%) |
| 5 or more Vehicles | 25 (19.4%) | 10 (6.9%) |
| Total | 129 (100.0%) | 145 (100.0%) |
Commute Time in Troy
The most frequently occuring commute durations in Troy are 30 to 34 minutes (65 commuters, 27.0%), 5 to 9 minutes (43 commuters, 17.8%), and 10 to 14 minutes (38 commuters, 15.8%).
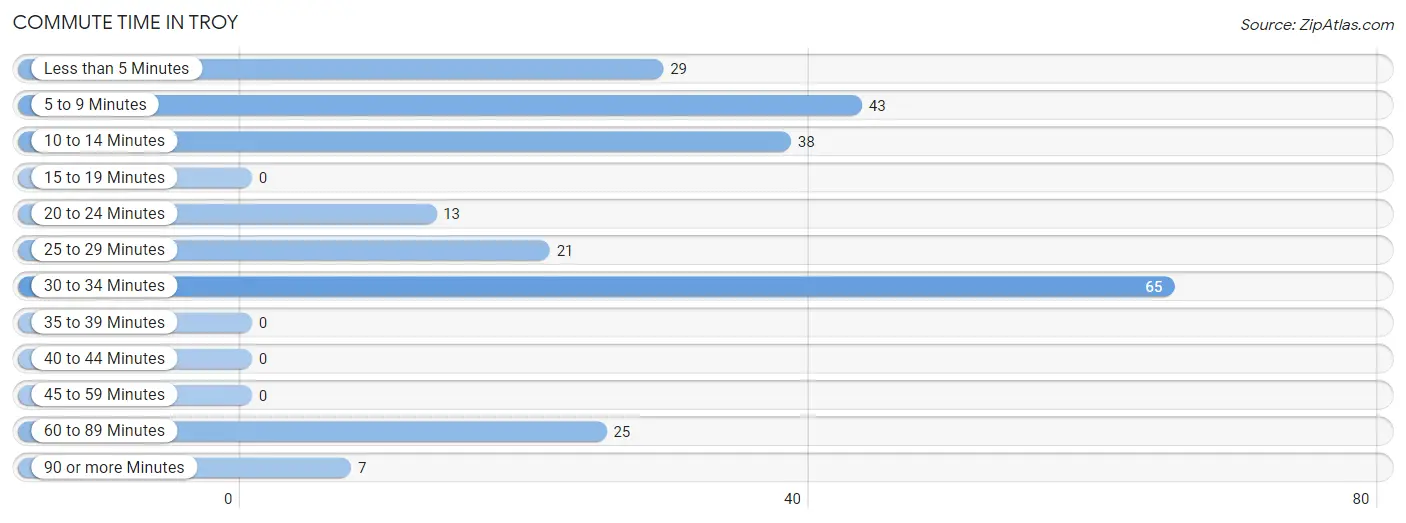
| Commute Time | # Commuters | % Commuters |
| Less than 5 Minutes | 29 | 12.0% |
| 5 to 9 Minutes | 43 | 17.8% |
| 10 to 14 Minutes | 38 | 15.8% |
| 15 to 19 Minutes | 0 | 0.0% |
| 20 to 24 Minutes | 13 | 5.4% |
| 25 to 29 Minutes | 21 | 8.7% |
| 30 to 34 Minutes | 65 | 27.0% |
| 35 to 39 Minutes | 0 | 0.0% |
| 40 to 44 Minutes | 0 | 0.0% |
| 45 to 59 Minutes | 0 | 0.0% |
| 60 to 89 Minutes | 25 | 10.4% |
| 90 or more Minutes | 7 | 2.9% |
Commute Time by Sex in Troy
The most common commute times in Troy are 30 to 34 minutes (52 commuters, 48.1%) for males and 5 to 9 minutes (36 commuters, 27.1%) for females.
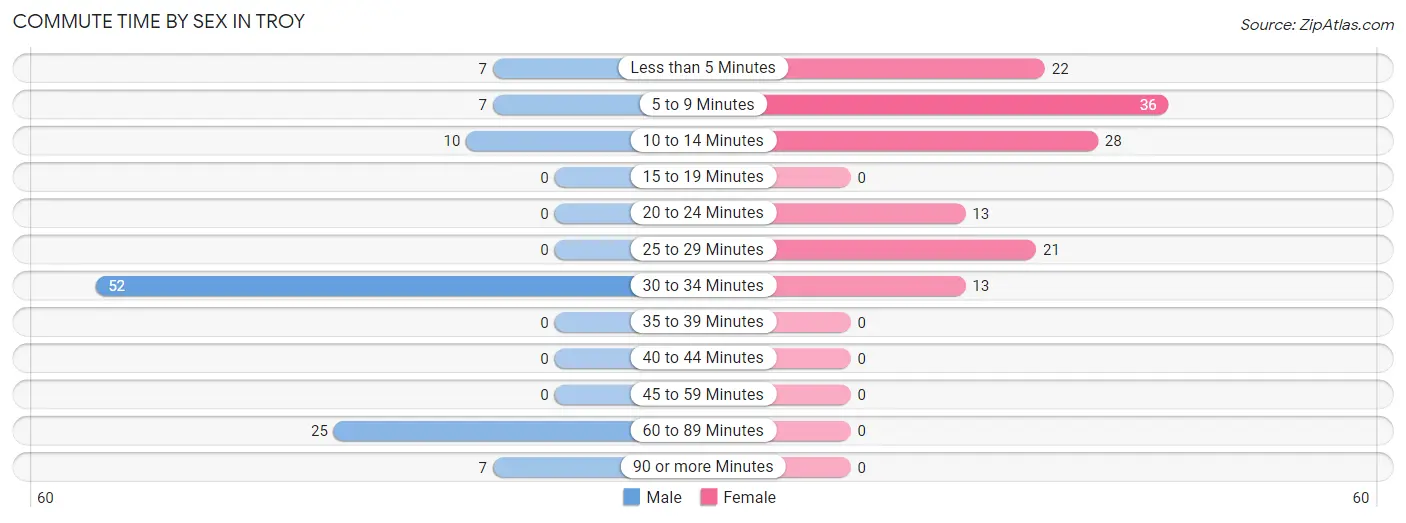
| Commute Time | Male | Female |
| Less than 5 Minutes | 7 (6.5%) | 22 (16.5%) |
| 5 to 9 Minutes | 7 (6.5%) | 36 (27.1%) |
| 10 to 14 Minutes | 10 (9.3%) | 28 (21.0%) |
| 15 to 19 Minutes | 0 (0.0%) | 0 (0.0%) |
| 20 to 24 Minutes | 0 (0.0%) | 13 (9.8%) |
| 25 to 29 Minutes | 0 (0.0%) | 21 (15.8%) |
| 30 to 34 Minutes | 52 (48.1%) | 13 (9.8%) |
| 35 to 39 Minutes | 0 (0.0%) | 0 (0.0%) |
| 40 to 44 Minutes | 0 (0.0%) | 0 (0.0%) |
| 45 to 59 Minutes | 0 (0.0%) | 0 (0.0%) |
| 60 to 89 Minutes | 25 (23.2%) | 0 (0.0%) |
| 90 or more Minutes | 7 (6.5%) | 0 (0.0%) |
Time of Departure to Work by Sex in Troy
The most frequent times of departure to work in Troy are 7:00 AM to 7:29 AM (27, 25.0%) for males and 9:00 AM to 9:59 AM (41, 30.8%) for females.
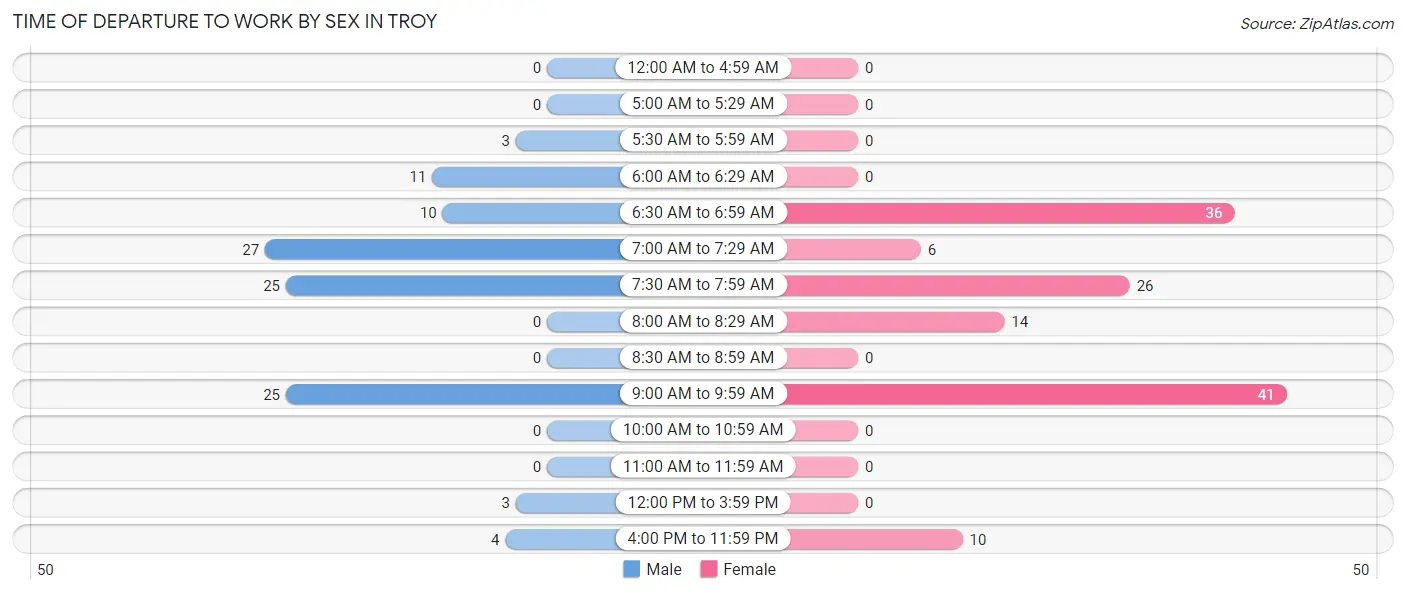
| Time of Departure | Male | Female |
| 12:00 AM to 4:59 AM | 0 (0.0%) | 0 (0.0%) |
| 5:00 AM to 5:29 AM | 0 (0.0%) | 0 (0.0%) |
| 5:30 AM to 5:59 AM | 3 (2.8%) | 0 (0.0%) |
| 6:00 AM to 6:29 AM | 11 (10.2%) | 0 (0.0%) |
| 6:30 AM to 6:59 AM | 10 (9.3%) | 36 (27.1%) |
| 7:00 AM to 7:29 AM | 27 (25.0%) | 6 (4.5%) |
| 7:30 AM to 7:59 AM | 25 (23.2%) | 26 (19.6%) |
| 8:00 AM to 8:29 AM | 0 (0.0%) | 14 (10.5%) |
| 8:30 AM to 8:59 AM | 0 (0.0%) | 0 (0.0%) |
| 9:00 AM to 9:59 AM | 25 (23.2%) | 41 (30.8%) |
| 10:00 AM to 10:59 AM | 0 (0.0%) | 0 (0.0%) |
| 11:00 AM to 11:59 AM | 0 (0.0%) | 0 (0.0%) |
| 12:00 PM to 3:59 PM | 3 (2.8%) | 0 (0.0%) |
| 4:00 PM to 11:59 PM | 4 (3.7%) | 10 (7.5%) |
| Total | 108 (100.0%) | 133 (100.0%) |
Housing Occupancy in Troy
Occupancy by Ownership in Troy
Of the total 351 dwellings in Troy, owner-occupied units account for 288 (82.1%), while renter-occupied units make up 63 (17.9%).
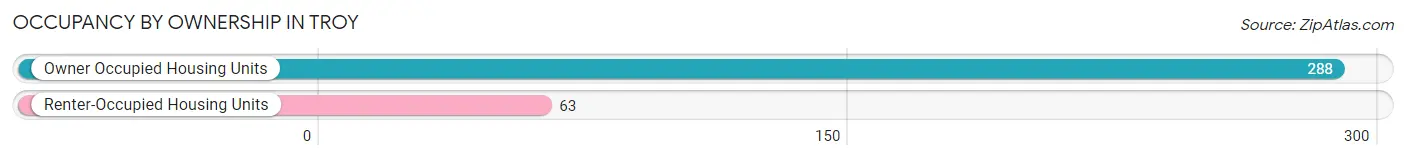
| Occupancy | # Housing Units | % Housing Units |
| Owner Occupied Housing Units | 288 | 82.1% |
| Renter-Occupied Housing Units | 63 | 17.9% |
| Total Occupied Housing Units | 351 | 100.0% |
Occupancy by Household Size in Troy
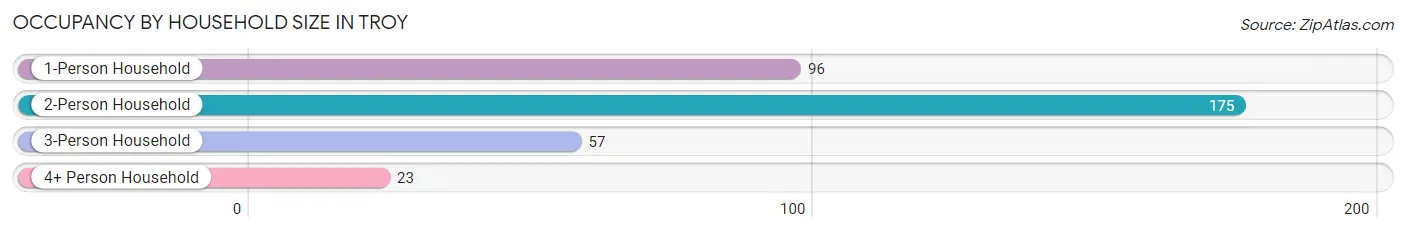
| Household Size | # Housing Units | % Housing Units |
| 1-Person Household | 96 | 27.4% |
| 2-Person Household | 175 | 49.9% |
| 3-Person Household | 57 | 16.2% |
| 4+ Person Household | 23 | 6.6% |
| Total Housing Units | 351 | 100.0% |
Occupancy by Ownership by Household Size in Troy
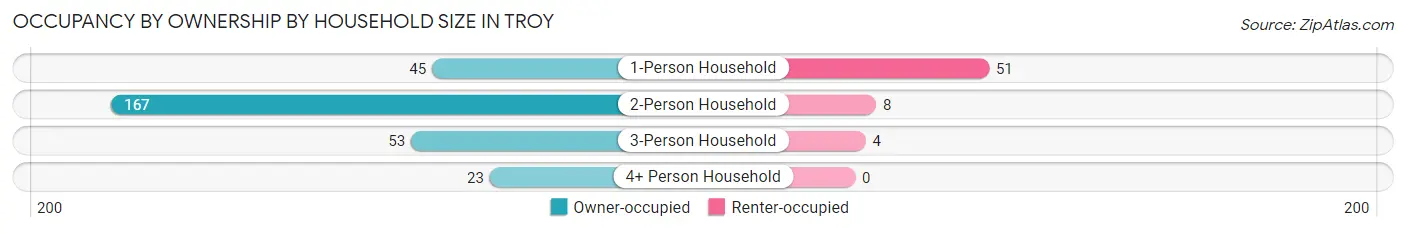
| Household Size | Owner-occupied | Renter-occupied |
| 1-Person Household | 45 (46.9%) | 51 (53.1%) |
| 2-Person Household | 167 (95.4%) | 8 (4.6%) |
| 3-Person Household | 53 (93.0%) | 4 (7.0%) |
| 4+ Person Household | 23 (100.0%) | 0 (0.0%) |
| Total Housing Units | 288 (82.1%) | 63 (17.9%) |
Occupancy by Educational Attainment in Troy
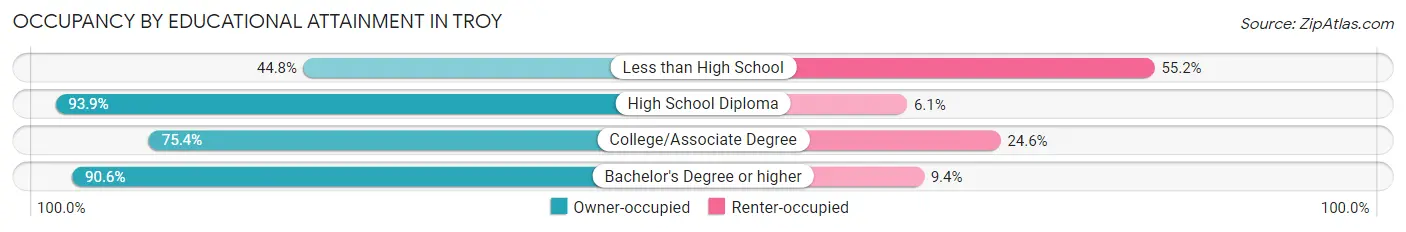
| Household Size | Owner-occupied | Renter-occupied |
| Less than High School | 13 (44.8%) | 16 (55.2%) |
| High School Diploma | 123 (93.9%) | 8 (6.1%) |
| College/Associate Degree | 104 (75.4%) | 34 (24.6%) |
| Bachelor's Degree or higher | 48 (90.6%) | 5 (9.4%) |
Occupancy by Age of Householder in Troy
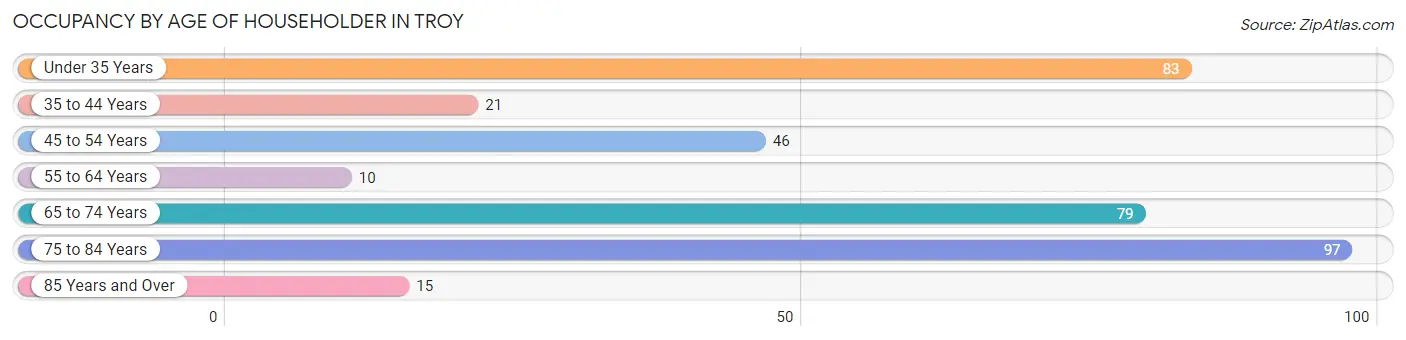
| Age Bracket | # Households | % Households |
| Under 35 Years | 83 | 23.6% |
| 35 to 44 Years | 21 | 6.0% |
| 45 to 54 Years | 46 | 13.1% |
| 55 to 64 Years | 10 | 2.9% |
| 65 to 74 Years | 79 | 22.5% |
| 75 to 84 Years | 97 | 27.6% |
| 85 Years and Over | 15 | 4.3% |
| Total | 351 | 100.0% |
Housing Finances in Troy
Median Income by Occupancy in Troy
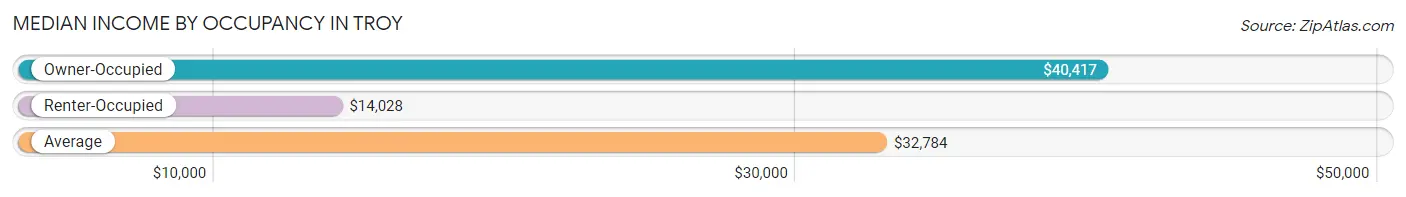
| Occupancy Type | # Households | Median Income |
| Owner-Occupied | 288 (82.1%) | $40,417 |
| Renter-Occupied | 63 (17.9%) | $14,028 |
| Average | 351 (100.0%) | $32,784 |
Occupancy by Householder Income Bracket in Troy
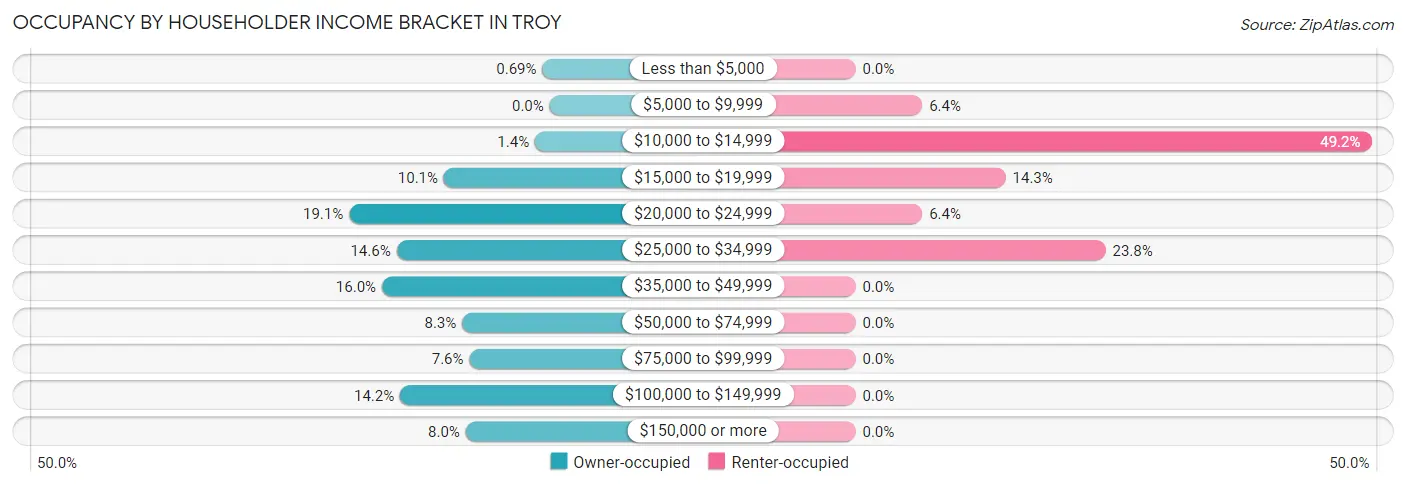
| Income Bracket | Owner-occupied | Renter-occupied |
| Less than $5,000 | 2 (0.7%) | 0 (0.0%) |
| $5,000 to $9,999 | 0 (0.0%) | 4 (6.4%) |
| $10,000 to $14,999 | 4 (1.4%) | 31 (49.2%) |
| $15,000 to $19,999 | 29 (10.1%) | 9 (14.3%) |
| $20,000 to $24,999 | 55 (19.1%) | 4 (6.4%) |
| $25,000 to $34,999 | 42 (14.6%) | 15 (23.8%) |
| $35,000 to $49,999 | 46 (16.0%) | 0 (0.0%) |
| $50,000 to $74,999 | 24 (8.3%) | 0 (0.0%) |
| $75,000 to $99,999 | 22 (7.6%) | 0 (0.0%) |
| $100,000 to $149,999 | 41 (14.2%) | 0 (0.0%) |
| $150,000 or more | 23 (8.0%) | 0 (0.0%) |
| Total | 288 (100.0%) | 63 (100.0%) |
Monthly Housing Cost Tiers in Troy
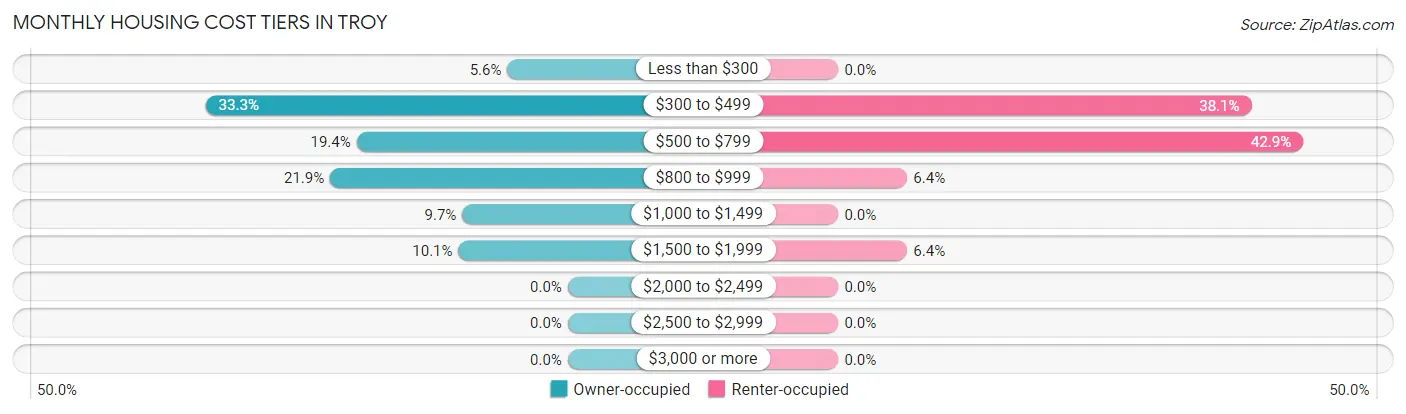
| Monthly Cost | Owner-occupied | Renter-occupied |
| Less than $300 | 16 (5.6%) | 0 (0.0%) |
| $300 to $499 | 96 (33.3%) | 24 (38.1%) |
| $500 to $799 | 56 (19.4%) | 27 (42.9%) |
| $800 to $999 | 63 (21.9%) | 4 (6.4%) |
| $1,000 to $1,499 | 28 (9.7%) | 0 (0.0%) |
| $1,500 to $1,999 | 29 (10.1%) | 4 (6.4%) |
| $2,000 to $2,499 | 0 (0.0%) | 0 (0.0%) |
| $2,500 to $2,999 | 0 (0.0%) | 0 (0.0%) |
| $3,000 or more | 0 (0.0%) | 0 (0.0%) |
| Total | 288 (100.0%) | 63 (100.0%) |
Physical Housing Characteristics in Troy
Housing Structures in Troy
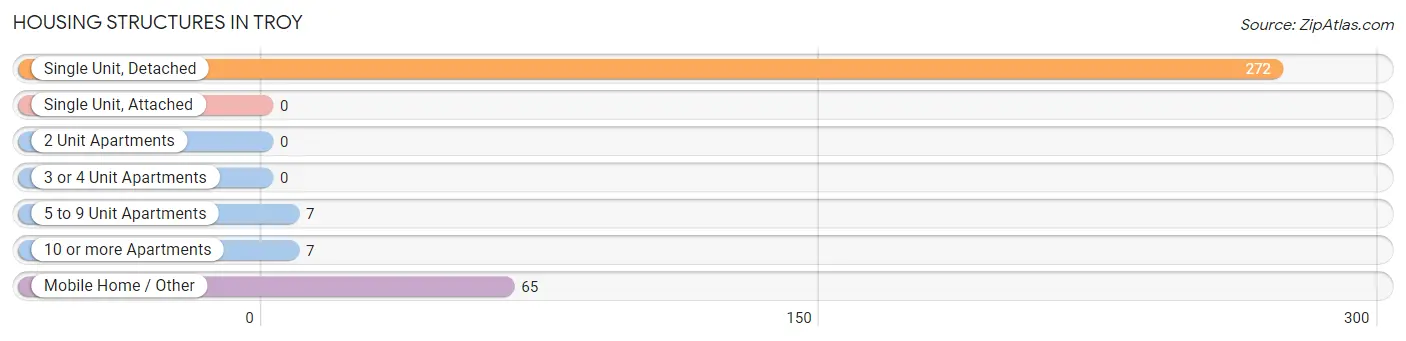
| Structure Type | # Housing Units | % Housing Units |
| Single Unit, Detached | 272 | 77.5% |
| Single Unit, Attached | 0 | 0.0% |
| 2 Unit Apartments | 0 | 0.0% |
| 3 or 4 Unit Apartments | 0 | 0.0% |
| 5 to 9 Unit Apartments | 7 | 2.0% |
| 10 or more Apartments | 7 | 2.0% |
| Mobile Home / Other | 65 | 18.5% |
| Total | 351 | 100.0% |
Housing Structures by Occupancy in Troy
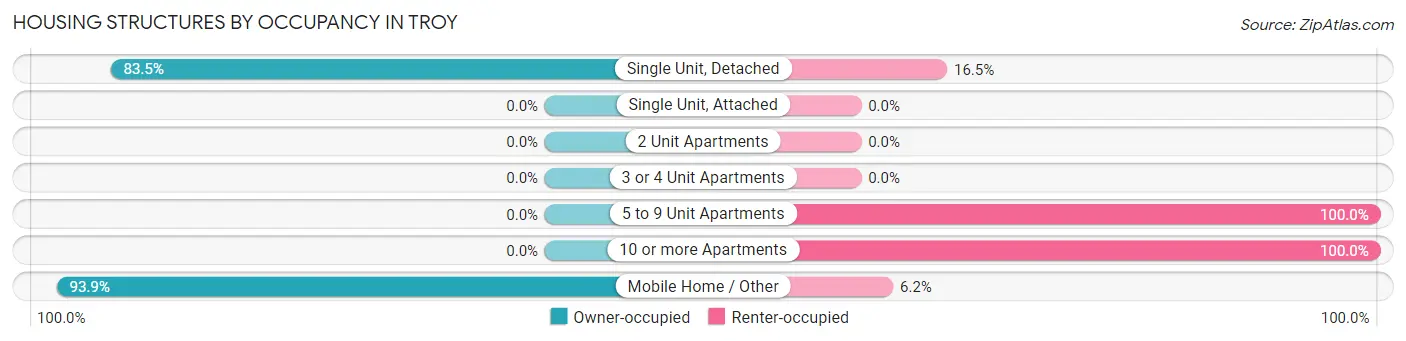
| Structure Type | Owner-occupied | Renter-occupied |
| Single Unit, Detached | 227 (83.5%) | 45 (16.5%) |
| Single Unit, Attached | 0 (0.0%) | 0 (0.0%) |
| 2 Unit Apartments | 0 (0.0%) | 0 (0.0%) |
| 3 or 4 Unit Apartments | 0 (0.0%) | 0 (0.0%) |
| 5 to 9 Unit Apartments | 0 (0.0%) | 7 (100.0%) |
| 10 or more Apartments | 0 (0.0%) | 7 (100.0%) |
| Mobile Home / Other | 61 (93.9%) | 4 (6.1%) |
| Total | 288 (82.1%) | 63 (17.9%) |
Housing Structures by Number of Rooms in Troy
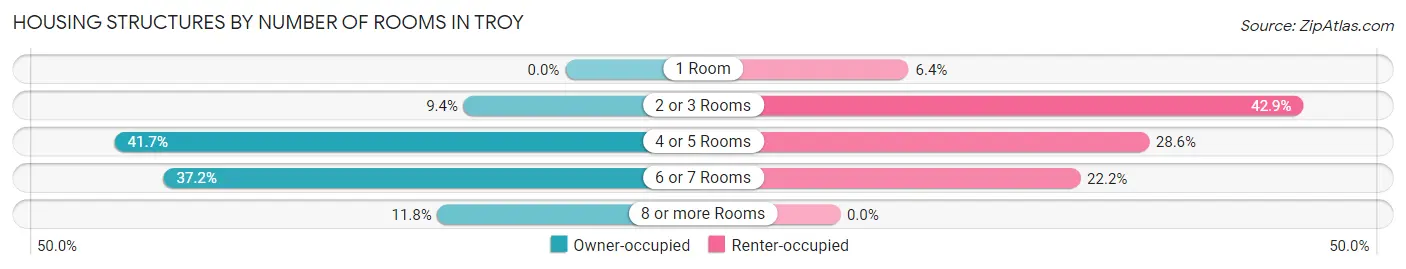
| Number of Rooms | Owner-occupied | Renter-occupied |
| 1 Room | 0 (0.0%) | 4 (6.4%) |
| 2 or 3 Rooms | 27 (9.4%) | 27 (42.9%) |
| 4 or 5 Rooms | 120 (41.7%) | 18 (28.6%) |
| 6 or 7 Rooms | 107 (37.1%) | 14 (22.2%) |
| 8 or more Rooms | 34 (11.8%) | 0 (0.0%) |
| Total | 288 (100.0%) | 63 (100.0%) |
Housing Structure by Heating Type in Troy
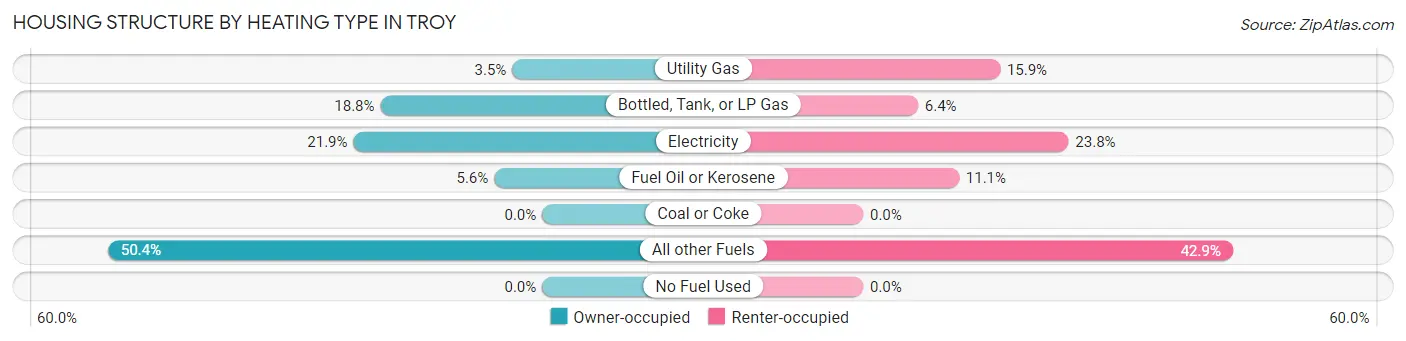
| Heating Type | Owner-occupied | Renter-occupied |
| Utility Gas | 10 (3.5%) | 10 (15.9%) |
| Bottled, Tank, or LP Gas | 54 (18.8%) | 4 (6.4%) |
| Electricity | 63 (21.9%) | 15 (23.8%) |
| Fuel Oil or Kerosene | 16 (5.6%) | 7 (11.1%) |
| Coal or Coke | 0 (0.0%) | 0 (0.0%) |
| All other Fuels | 145 (50.3%) | 27 (42.9%) |
| No Fuel Used | 0 (0.0%) | 0 (0.0%) |
| Total | 288 (100.0%) | 63 (100.0%) |
Household Vehicle Usage in Troy
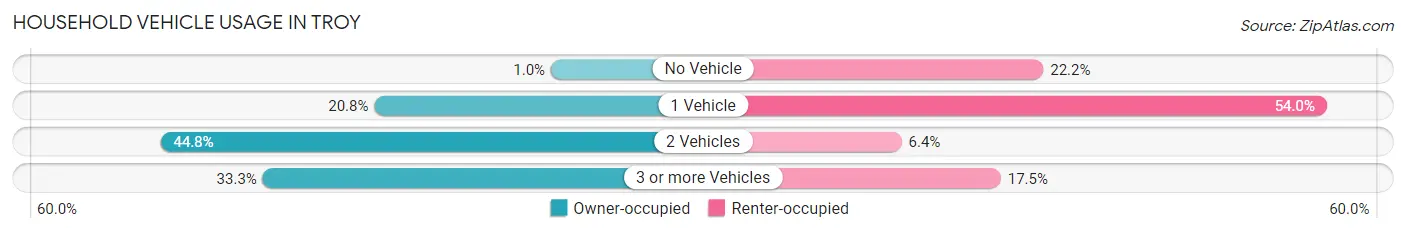
| Vehicles per Household | Owner-occupied | Renter-occupied |
| No Vehicle | 3 (1.0%) | 14 (22.2%) |
| 1 Vehicle | 60 (20.8%) | 34 (54.0%) |
| 2 Vehicles | 129 (44.8%) | 4 (6.4%) |
| 3 or more Vehicles | 96 (33.3%) | 11 (17.5%) |
| Total | 288 (100.0%) | 63 (100.0%) |
Real Estate & Mortgages in Troy
Real Estate and Mortgage Overview in Troy
| Characteristic | Without Mortgage | With Mortgage |
| Housing Units | 145 | 143 |
| Median Property Value | $116,800 | $178,800 |
| Median Household Income | $22,287 | $10 |
| Monthly Housing Costs | $392 | $0 |
| Real Estate Taxes | $1,422 | $18 |
Property Value by Mortgage Status in Troy
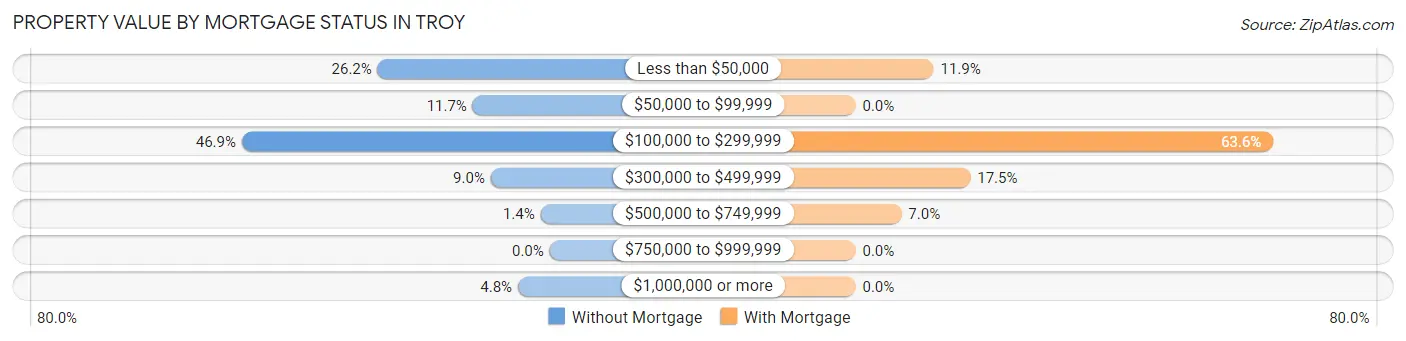
| Property Value | Without Mortgage | With Mortgage |
| Less than $50,000 | 38 (26.2%) | 17 (11.9%) |
| $50,000 to $99,999 | 17 (11.7%) | 0 (0.0%) |
| $100,000 to $299,999 | 68 (46.9%) | 91 (63.6%) |
| $300,000 to $499,999 | 13 (9.0%) | 25 (17.5%) |
| $500,000 to $749,999 | 2 (1.4%) | 10 (7.0%) |
| $750,000 to $999,999 | 0 (0.0%) | 0 (0.0%) |
| $1,000,000 or more | 7 (4.8%) | 0 (0.0%) |
| Total | 145 (100.0%) | 143 (100.0%) |
Household Income by Mortgage Status in Troy
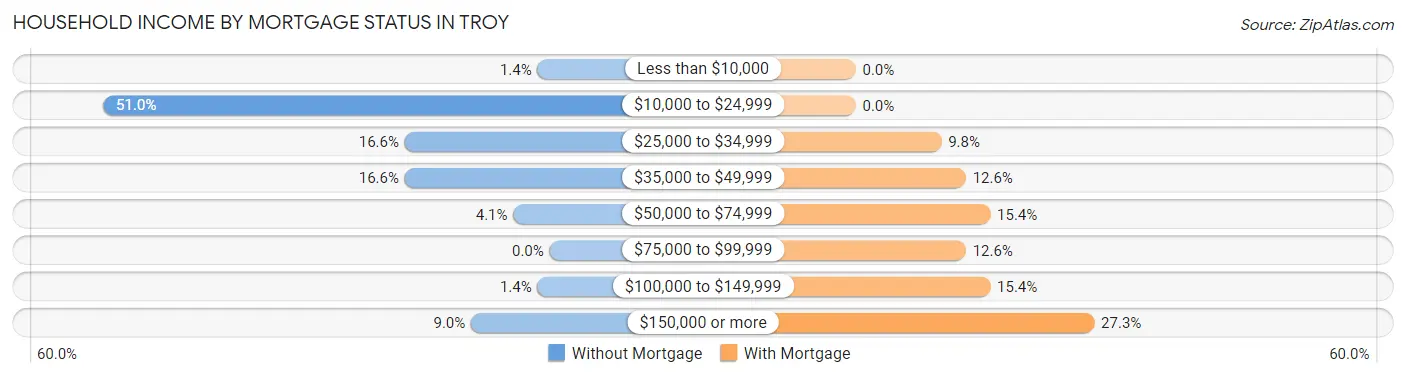
| Household Income | Without Mortgage | With Mortgage |
| Less than $10,000 | 2 (1.4%) | 0 (0.0%) |
| $10,000 to $24,999 | 74 (51.0%) | 0 (0.0%) |
| $25,000 to $34,999 | 24 (16.6%) | 14 (9.8%) |
| $35,000 to $49,999 | 24 (16.6%) | 18 (12.6%) |
| $50,000 to $74,999 | 6 (4.1%) | 22 (15.4%) |
| $75,000 to $99,999 | 0 (0.0%) | 18 (12.6%) |
| $100,000 to $149,999 | 2 (1.4%) | 22 (15.4%) |
| $150,000 or more | 13 (9.0%) | 39 (27.3%) |
| Total | 145 (100.0%) | 143 (100.0%) |
Property Value to Household Income Ratio in Troy
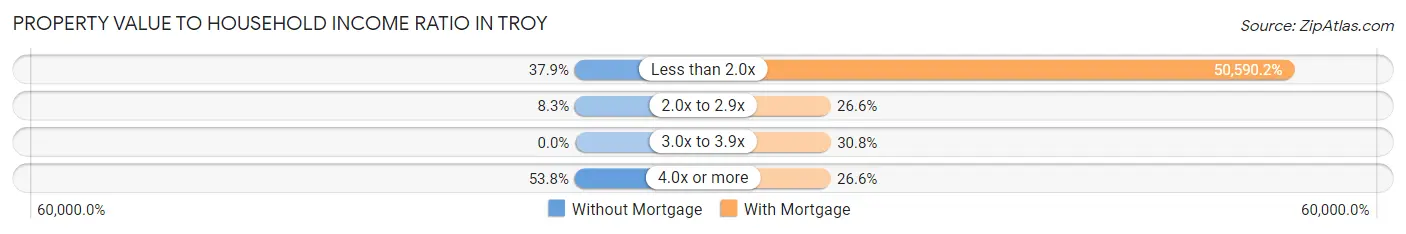
| Value-to-Income Ratio | Without Mortgage | With Mortgage |
| Less than 2.0x | 55 (37.9%) | 72,344 (50,590.2%) |
| 2.0x to 2.9x | 12 (8.3%) | 38 (26.6%) |
| 3.0x to 3.9x | 0 (0.0%) | 44 (30.8%) |
| 4.0x or more | 78 (53.8%) | 38 (26.6%) |
| Total | 145 (100.0%) | 143 (100.0%) |
Real Estate Taxes by Mortgage Status in Troy
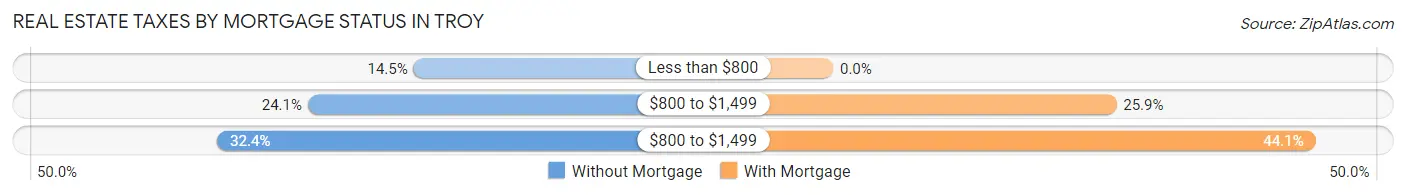
| Property Taxes | Without Mortgage | With Mortgage |
| Less than $800 | 21 (14.5%) | 0 (0.0%) |
| $800 to $1,499 | 35 (24.1%) | 37 (25.9%) |
| $800 to $1,499 | 47 (32.4%) | 63 (44.1%) |
| Total | 145 (100.0%) | 143 (100.0%) |
Health & Disability in Troy
Health Insurance Coverage by Age in Troy
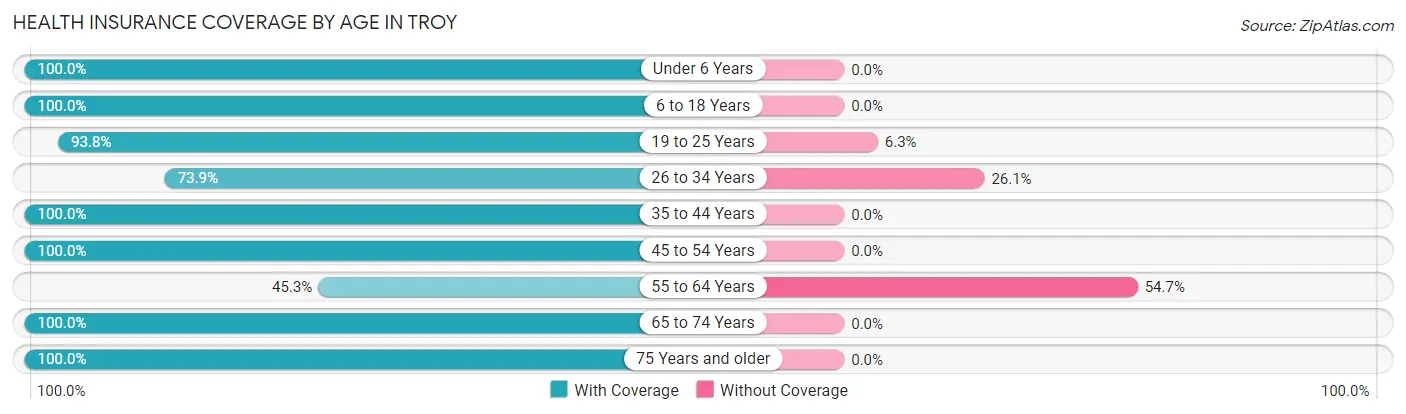
| Age Bracket | With Coverage | Without Coverage |
| Under 6 Years | 87 (100.0%) | 0 (0.0%) |
| 6 to 18 Years | 208 (100.0%) | 0 (0.0%) |
| 19 to 25 Years | 60 (93.8%) | 4 (6.2%) |
| 26 to 34 Years | 65 (73.9%) | 23 (26.1%) |
| 35 to 44 Years | 47 (100.0%) | 0 (0.0%) |
| 45 to 54 Years | 73 (100.0%) | 0 (0.0%) |
| 55 to 64 Years | 24 (45.3%) | 29 (54.7%) |
| 65 to 74 Years | 121 (100.0%) | 0 (0.0%) |
| 75 Years and older | 140 (100.0%) | 0 (0.0%) |
| Total | 825 (93.6%) | 56 (6.4%) |
Health Insurance Coverage by Citizenship Status in Troy
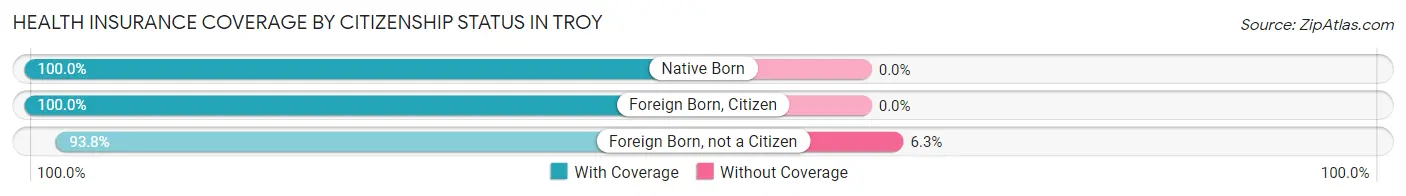
| Citizenship Status | With Coverage | Without Coverage |
| Native Born | 87 (100.0%) | 0 (0.0%) |
| Foreign Born, Citizen | 208 (100.0%) | 0 (0.0%) |
| Foreign Born, not a Citizen | 60 (93.8%) | 4 (6.2%) |
Health Insurance Coverage by Household Income in Troy
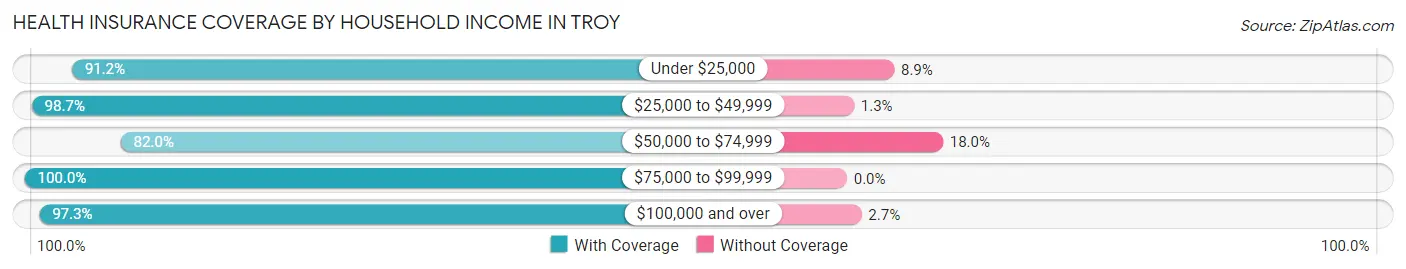
| Household Income | With Coverage | Without Coverage |
| Under $25,000 | 340 (91.1%) | 33 (8.8%) |
| $25,000 to $49,999 | 224 (98.7%) | 3 (1.3%) |
| $50,000 to $74,999 | 73 (82.0%) | 16 (18.0%) |
| $75,000 to $99,999 | 46 (100.0%) | 0 (0.0%) |
| $100,000 and over | 142 (97.3%) | 4 (2.7%) |
Public vs Private Health Insurance Coverage by Age in Troy
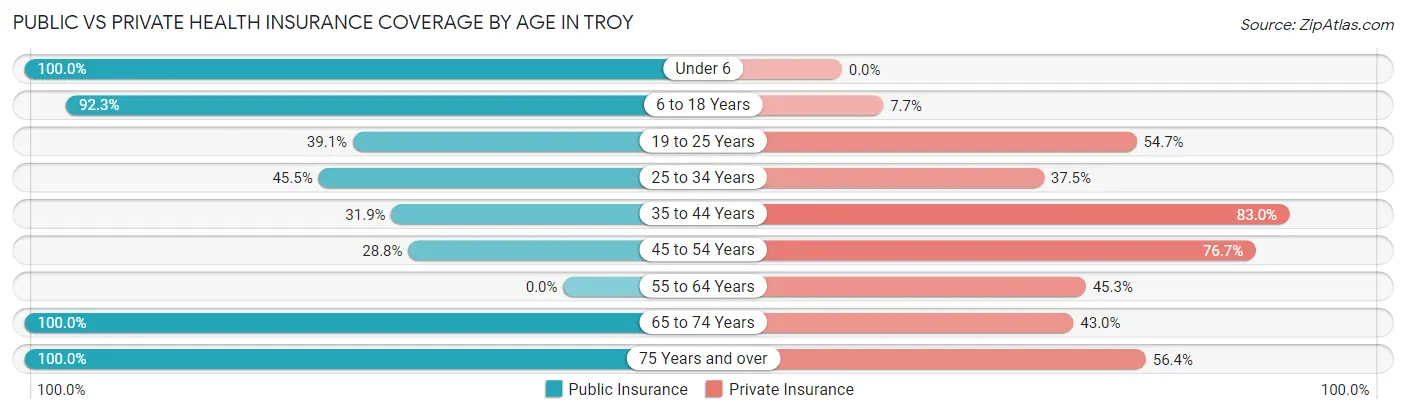
| Age Bracket | Public Insurance | Private Insurance |
| Under 6 | 87 (100.0%) | 0 (0.0%) |
| 6 to 18 Years | 192 (92.3%) | 16 (7.7%) |
| 19 to 25 Years | 25 (39.1%) | 35 (54.7%) |
| 25 to 34 Years | 40 (45.5%) | 33 (37.5%) |
| 35 to 44 Years | 15 (31.9%) | 39 (83.0%) |
| 45 to 54 Years | 21 (28.8%) | 56 (76.7%) |
| 55 to 64 Years | 0 (0.0%) | 24 (45.3%) |
| 65 to 74 Years | 121 (100.0%) | 52 (43.0%) |
| 75 Years and over | 140 (100.0%) | 79 (56.4%) |
| Total | 641 (72.8%) | 334 (37.9%) |
Disability Status by Sex by Age in Troy
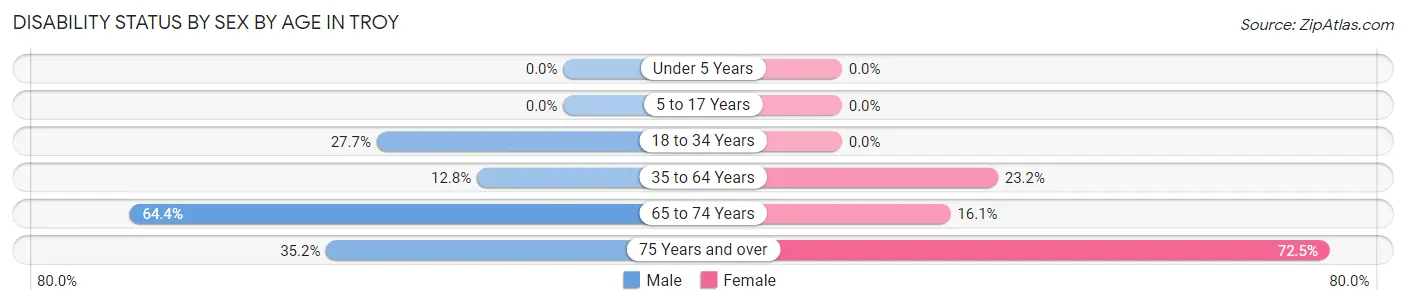
| Age Bracket | Male | Female |
| Under 5 Years | 0 (0.0%) | 0 (0.0%) |
| 5 to 17 Years | 0 (0.0%) | 0 (0.0%) |
| 18 to 34 Years | 23 (27.7%) | 0 (0.0%) |
| 35 to 64 Years | 10 (12.8%) | 22 (23.2%) |
| 65 to 74 Years | 38 (64.4%) | 10 (16.1%) |
| 75 Years and over | 25 (35.2%) | 50 (72.5%) |
Disability Class by Sex by Age in Troy
Disability Class: Hearing Difficulty
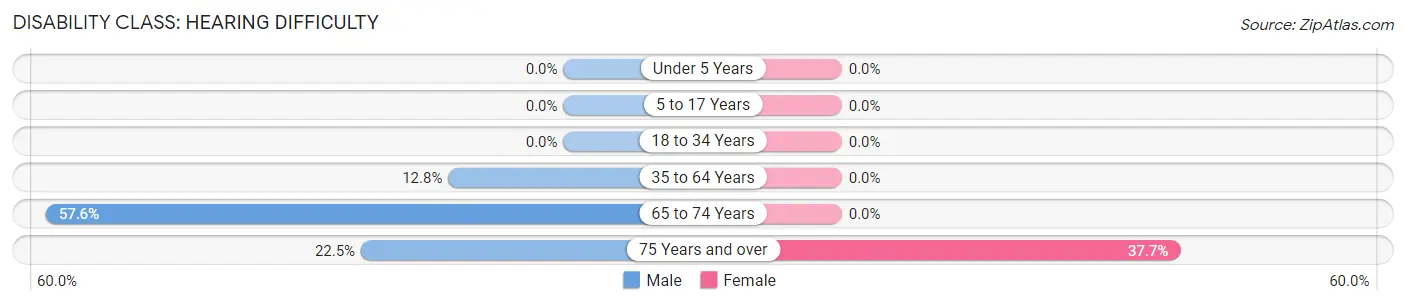
| Age Bracket | Male | Female |
| Under 5 Years | 0 (0.0%) | 0 (0.0%) |
| 5 to 17 Years | 0 (0.0%) | 0 (0.0%) |
| 18 to 34 Years | 0 (0.0%) | 0 (0.0%) |
| 35 to 64 Years | 10 (12.8%) | 0 (0.0%) |
| 65 to 74 Years | 34 (57.6%) | 0 (0.0%) |
| 75 Years and over | 16 (22.5%) | 26 (37.7%) |
Disability Class: Vision Difficulty
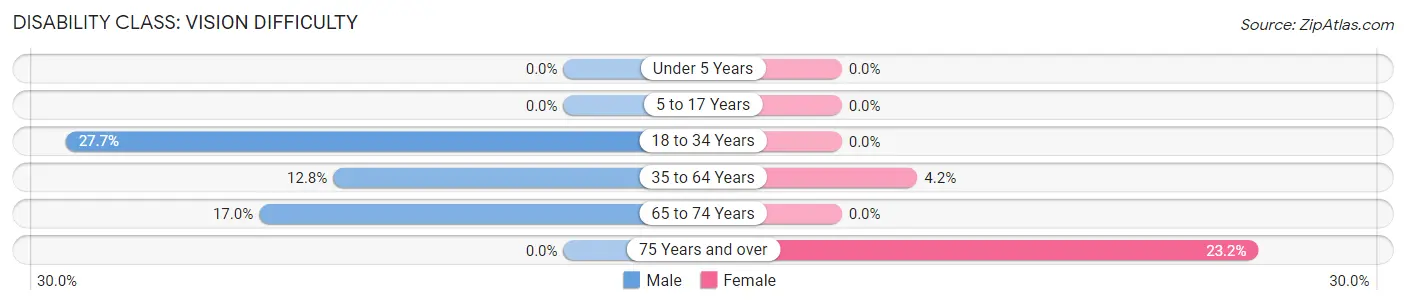
| Age Bracket | Male | Female |
| Under 5 Years | 0 (0.0%) | 0 (0.0%) |
| 5 to 17 Years | 0 (0.0%) | 0 (0.0%) |
| 18 to 34 Years | 23 (27.7%) | 0 (0.0%) |
| 35 to 64 Years | 10 (12.8%) | 4 (4.2%) |
| 65 to 74 Years | 10 (17.0%) | 0 (0.0%) |
| 75 Years and over | 0 (0.0%) | 16 (23.2%) |
Disability Class: Cognitive Difficulty
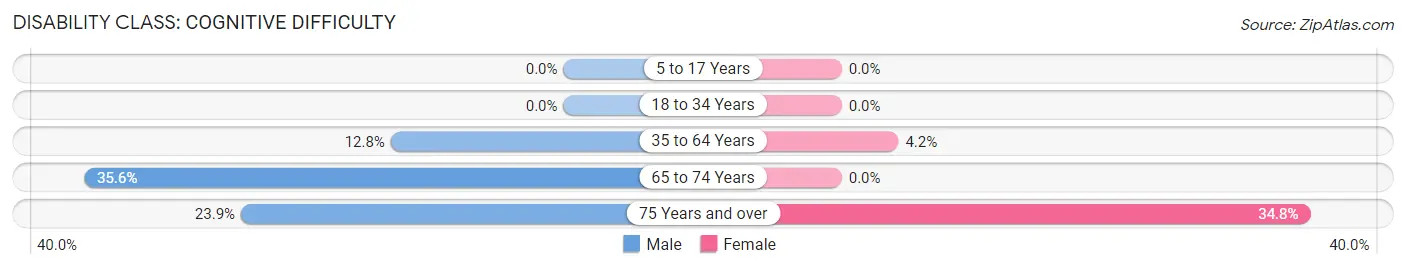
| Age Bracket | Male | Female |
| 5 to 17 Years | 0 (0.0%) | 0 (0.0%) |
| 18 to 34 Years | 0 (0.0%) | 0 (0.0%) |
| 35 to 64 Years | 10 (12.8%) | 4 (4.2%) |
| 65 to 74 Years | 21 (35.6%) | 0 (0.0%) |
| 75 Years and over | 17 (23.9%) | 24 (34.8%) |
Disability Class: Ambulatory Difficulty
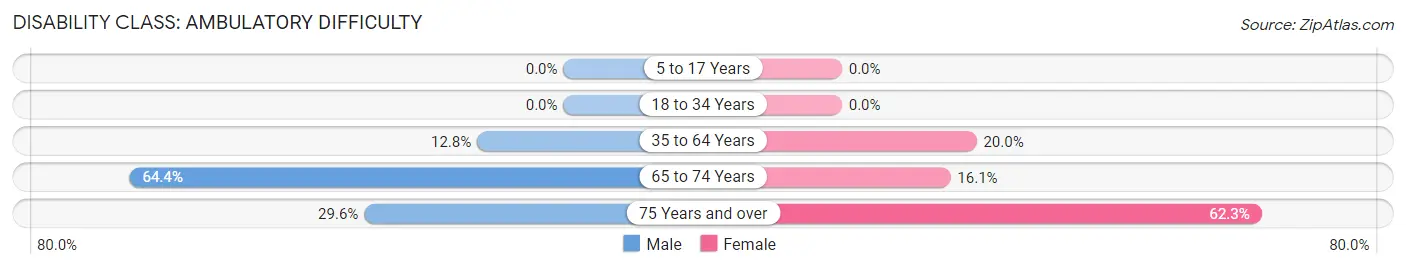
| Age Bracket | Male | Female |
| 5 to 17 Years | 0 (0.0%) | 0 (0.0%) |
| 18 to 34 Years | 0 (0.0%) | 0 (0.0%) |
| 35 to 64 Years | 10 (12.8%) | 19 (20.0%) |
| 65 to 74 Years | 38 (64.4%) | 10 (16.1%) |
| 75 Years and over | 21 (29.6%) | 43 (62.3%) |
Disability Class: Self-Care Difficulty
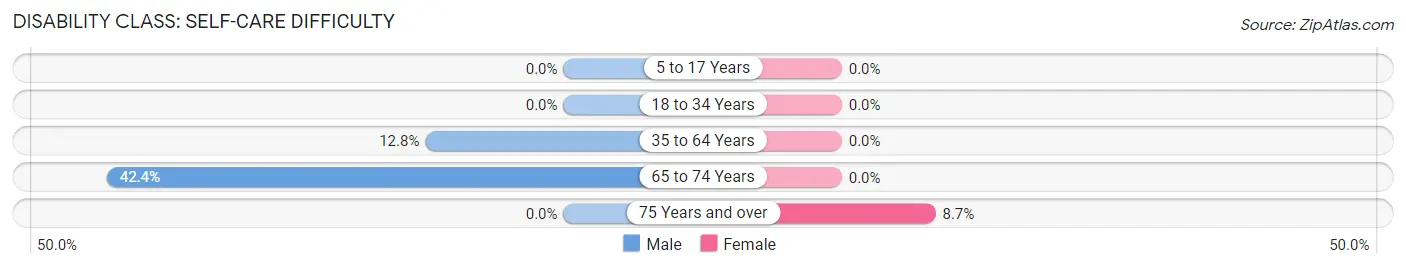
| Age Bracket | Male | Female |
| 5 to 17 Years | 0 (0.0%) | 0 (0.0%) |
| 18 to 34 Years | 0 (0.0%) | 0 (0.0%) |
| 35 to 64 Years | 10 (12.8%) | 0 (0.0%) |
| 65 to 74 Years | 25 (42.4%) | 0 (0.0%) |
| 75 Years and over | 0 (0.0%) | 6 (8.7%) |
Technology Access in Troy
Computing Device Access in Troy
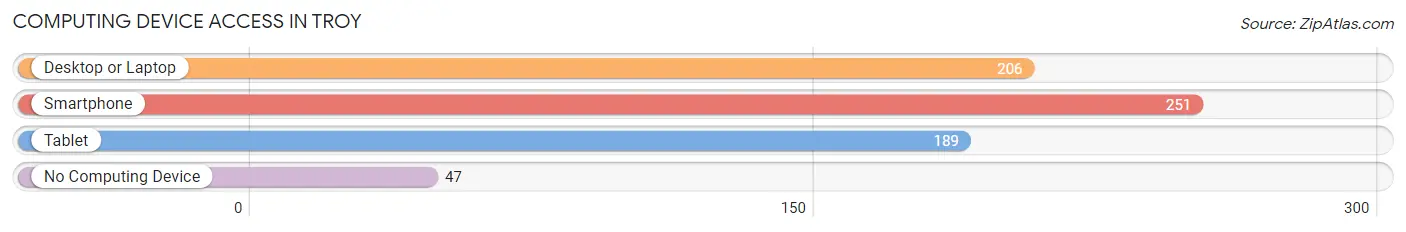
| Device Type | # Households | % Households |
| Desktop or Laptop | 206 | 58.7% |
| Smartphone | 251 | 71.5% |
| Tablet | 189 | 53.8% |
| No Computing Device | 47 | 13.4% |
| Total | 351 | 100.0% |
Internet Access in Troy
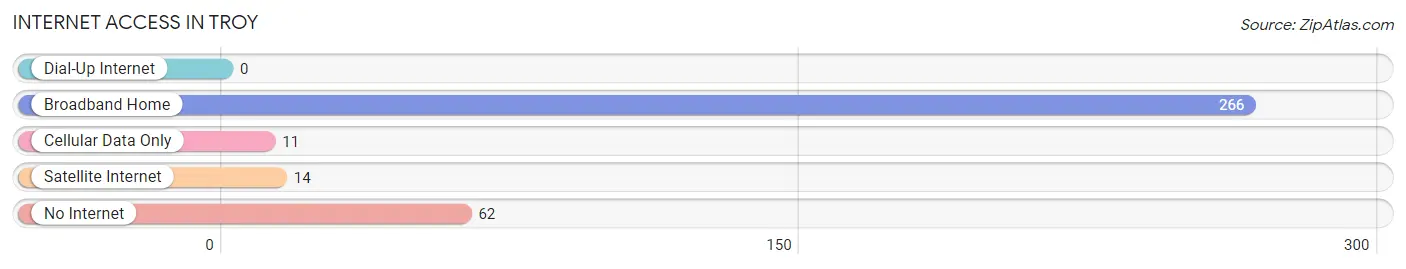
| Internet Type | # Households | % Households |
| Dial-Up Internet | 0 | 0.0% |
| Broadband Home | 266 | 75.8% |
| Cellular Data Only | 11 | 3.1% |
| Satellite Internet | 14 | 4.0% |
| No Internet | 62 | 17.7% |
| Total | 351 | 100.0% |
Troy Summary
Troy is a small town located in Lincoln County, Montana, United States. It is situated in the Kootenai River Valley, at the base of the Cabinet Mountains. The town has a population of 1,093 as of the 2010 census.
History
Troy was founded in 1892 by a group of miners who were searching for gold in the area. The town was named after Troy, New York, the hometown of one of the miners. The town quickly grew and by the early 1900s, it had become a bustling mining town. The town was home to several saloons, hotels, and stores.
In the early 1900s, the town was also home to a large Chinese population. The Chinese immigrants had come to the area to work in the mines and on the railroads. The Chinese population eventually dwindled, however, and by the 1950s, there were no longer any Chinese living in Troy.
Geography
Troy is located in the Kootenai River Valley, at the base of the Cabinet Mountains. The town is situated at an elevation of 2,845 feet (867 m). The town is surrounded by mountains and forests, and is located near the Kootenai National Forest.
The climate in Troy is semi-arid, with cold winters and hot summers. The average annual temperature is 44.3°F (6.8°C). The average annual precipitation is 16.3 inches (414 mm).
Economy
Troy's economy is largely based on tourism and agriculture. The town is home to several tourist attractions, including the Cabinet Mountains Wilderness Area, the Kootenai National Forest, and the Kootenai River.
Agriculture is also an important part of the local economy. The town is home to several farms, which produce hay, wheat, barley, and other crops.
Demographics
As of the 2010 census, Troy had a population of 1,093. The racial makeup of the town was 95.3% White, 0.7% Native American, 0.3% Asian, 0.2% African American, 0.1% Pacific Islander, and 3.4% from other races.
The median household income in Troy was $35,938, and the median family income was $41,250. The per capita income was $17,945. About 11.2% of the population was below the poverty line.
Troy is served by the Troy School District, which includes an elementary school, a middle school, and a high school. The town is also home to the Troy Public Library.
Common Questions
What is the Total Population of Troy?
Total Population of Troy is 884.
What is the Total Male Population of Troy?
Total Male Population of Troy is 450.
What is the Total Female Population of Troy?
Total Female Population of Troy is 434.
What is the Ratio of Males per 100 Females in Troy?
There are 103.69 Males per 100 Females in Troy.
What is the Ratio of Females per 100 Males in Troy?
There are 96.44 Females per 100 Males in Troy.
What is the Median Population Age in Troy?
Median Population Age in Troy is 34.7 Years.
What is the Average Family Size in Troy
Average Family Size in Troy is 3.2 People.
What is the Average Household Size in Troy
Average Household Size in Troy is 2.5 People.
What is Per Capita Income in Troy?
Per Capita income in Troy is $20,956.
What is the Median Family Income in Troy?
Median Family Income in Troy is $43,068.
What is the Median Household income in Troy?
Median Household Income in Troy is $32,784.
What is Inequality or Gini Index in Troy?
Inequality or Gini Index in Troy is 0.45.
How Large is the Labor Force in Troy?
There are 304 People in the Labor Forcein in Troy.
What is the Percentage of People in the Labor Force in Troy?
50.1% of People are in the Labor Force in Troy.
What is the Unemployment Rate in Troy?
Unemployment Rate in Troy is 1.3%.