Bolton, MS
Bolton Map
Bolton Overview
936
TOTAL POPULATION
508
MALE POPULATION
428
FEMALE POPULATION
118.69
MALES / 100 FEMALES
84.25
FEMALES / 100 MALES
44.4
MEDIAN AGE
3.2
AVG FAMILY SIZE
2.7
AVG HOUSEHOLD SIZE
$26,535
PER CAPITA INCOME
$68,148
AVG FAMILY INCOME
$53,523
AVG HOUSEHOLD INCOME
0.43
INEQUALITY / GINI INDEX
557
LABOR FORCE [ PEOPLE ]
70.9%
PERCENT IN LABOR FORCE
2.2%
UNEMPLOYMENT RATE
Bolton Zip Codes
Bolton Area Codes
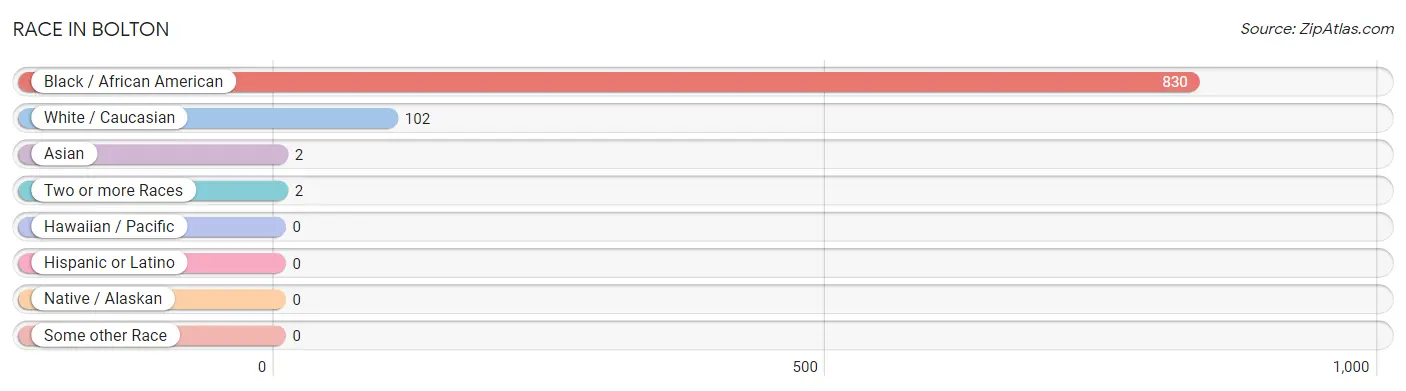
Race in Bolton
The most populous races in Bolton are Black / African American (830 | 88.7%), White / Caucasian (102 | 10.9%), and Asian (2 | 0.2%).
| Race | # Population | % Population |
| Asian | 2 | 0.2% |
| Black / African American | 830 | 88.7% |
| Hawaiian / Pacific | 0 | 0.0% |
| Hispanic or Latino | 0 | 0.0% |
| Native / Alaskan | 0 | 0.0% |
| White / Caucasian | 102 | 10.9% |
| Two or more Races | 2 | 0.2% |
| Some other Race | 0 | 0.0% |
| Total | 936 | 100.0% |
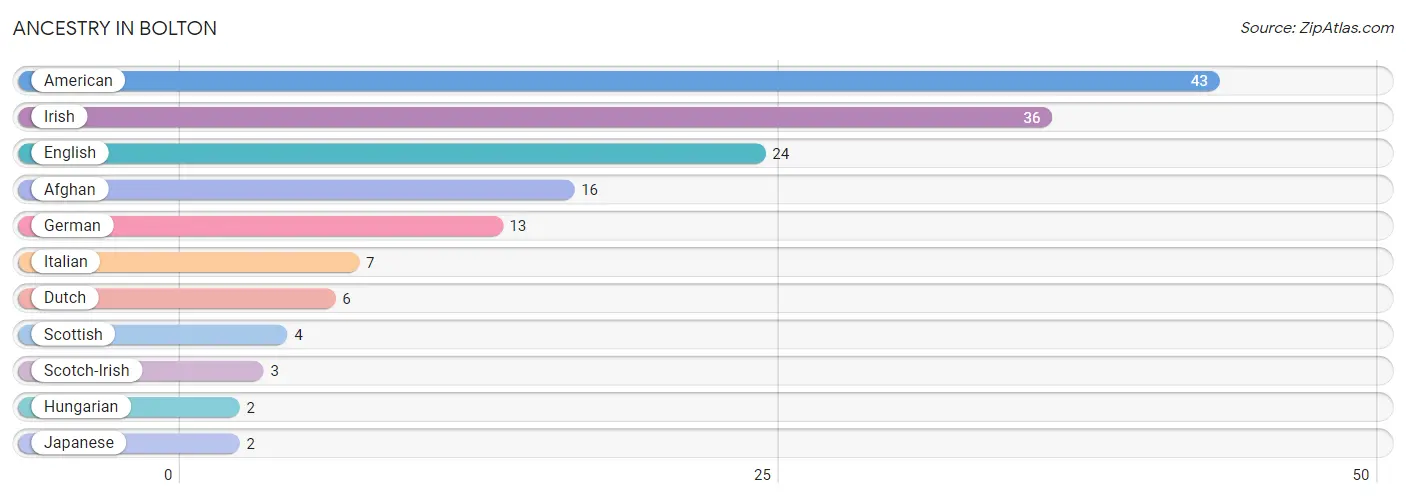
Ancestry in Bolton
The most populous ancestries reported in Bolton are American (43 | 4.6%), Irish (36 | 3.8%), English (24 | 2.6%), Afghan (16 | 1.7%), and German (13 | 1.4%), together accounting for 14.1% of all Bolton residents.
| Ancestry | # Population | % Population |
| Afghan | 16 | 1.7% |
| American | 43 | 4.6% |
| Dutch | 6 | 0.6% |
| English | 24 | 2.6% |
| German | 13 | 1.4% |
| Hungarian | 2 | 0.2% |
| Irish | 36 | 3.8% |
| Italian | 7 | 0.7% |
| Japanese | 2 | 0.2% |
| Scotch-Irish | 3 | 0.3% |
| Scottish | 4 | 0.4% | View All 11 Rows |
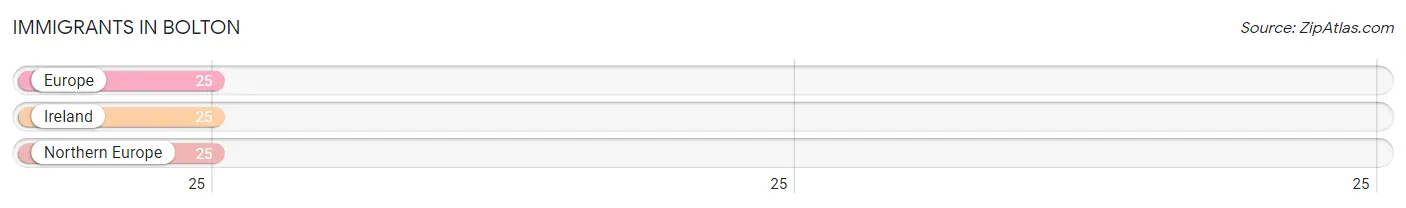
Immigrants in Bolton
The most numerous immigrant groups reported in Bolton came from Europe (25 | 2.7%), Ireland (25 | 2.7%), and Northern Europe (25 | 2.7%), together accounting for 8.0% of all Bolton residents.
| Immigration Origin | # Population | % Population |
| Europe | 25 | 2.7% |
| Ireland | 25 | 2.7% |
| Northern Europe | 25 | 2.7% | View All 3 Rows |
Sex and Age in Bolton
Sex and Age in Bolton
The most populous age groups in Bolton are 35 to 39 Years (86 | 16.9%) for men and 55 to 59 Years (73 | 17.1%) for women.
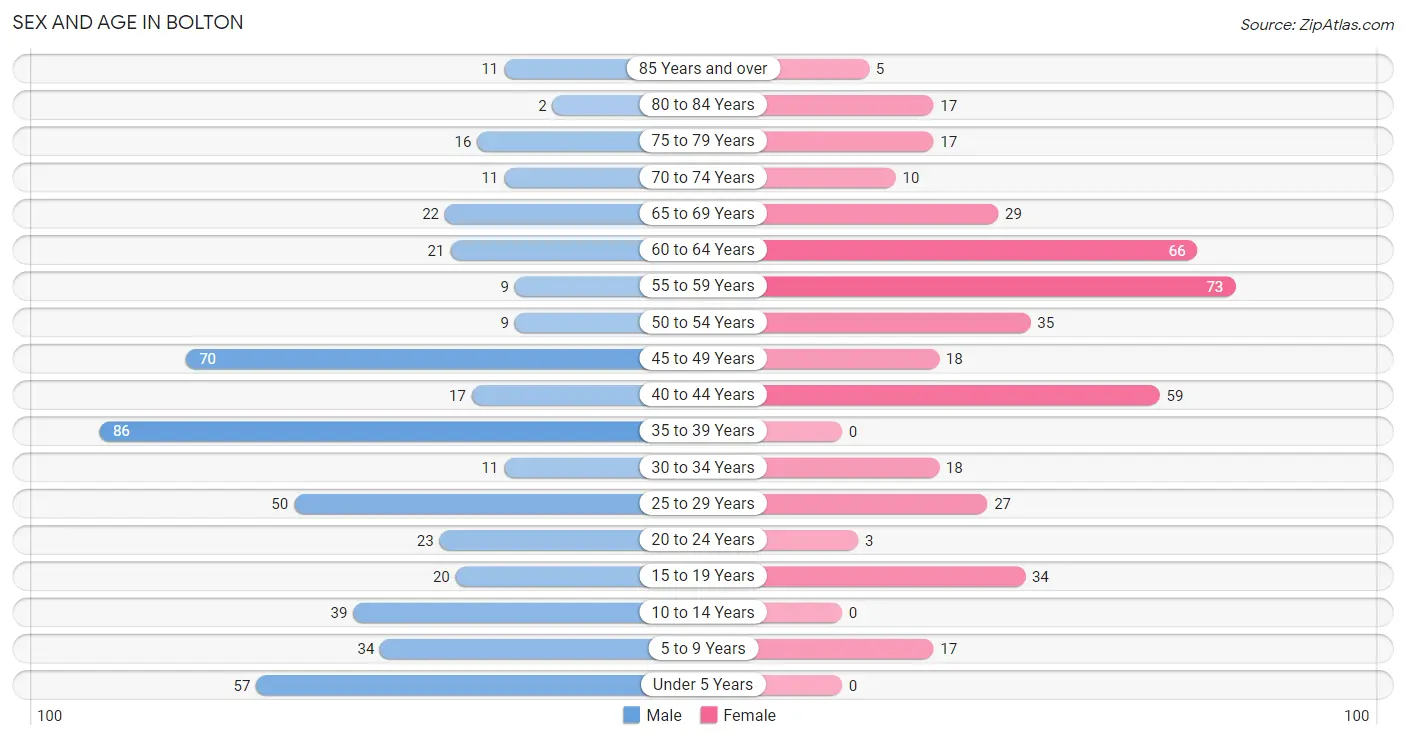
| Age Bracket | Male | Female |
| Under 5 Years | 57 (11.2%) | 0 (0.0%) |
| 5 to 9 Years | 34 (6.7%) | 17 (4.0%) |
| 10 to 14 Years | 39 (7.7%) | 0 (0.0%) |
| 15 to 19 Years | 20 (3.9%) | 34 (7.9%) |
| 20 to 24 Years | 23 (4.5%) | 3 (0.7%) |
| 25 to 29 Years | 50 (9.8%) | 27 (6.3%) |
| 30 to 34 Years | 11 (2.2%) | 18 (4.2%) |
| 35 to 39 Years | 86 (16.9%) | 0 (0.0%) |
| 40 to 44 Years | 17 (3.4%) | 59 (13.8%) |
| 45 to 49 Years | 70 (13.8%) | 18 (4.2%) |
| 50 to 54 Years | 9 (1.8%) | 35 (8.2%) |
| 55 to 59 Years | 9 (1.8%) | 73 (17.1%) |
| 60 to 64 Years | 21 (4.1%) | 66 (15.4%) |
| 65 to 69 Years | 22 (4.3%) | 29 (6.8%) |
| 70 to 74 Years | 11 (2.2%) | 10 (2.3%) |
| 75 to 79 Years | 16 (3.2%) | 17 (4.0%) |
| 80 to 84 Years | 2 (0.4%) | 17 (4.0%) |
| 85 Years and over | 11 (2.2%) | 5 (1.2%) |
| Total | 508 (100.0%) | 428 (100.0%) |
Families and Households in Bolton
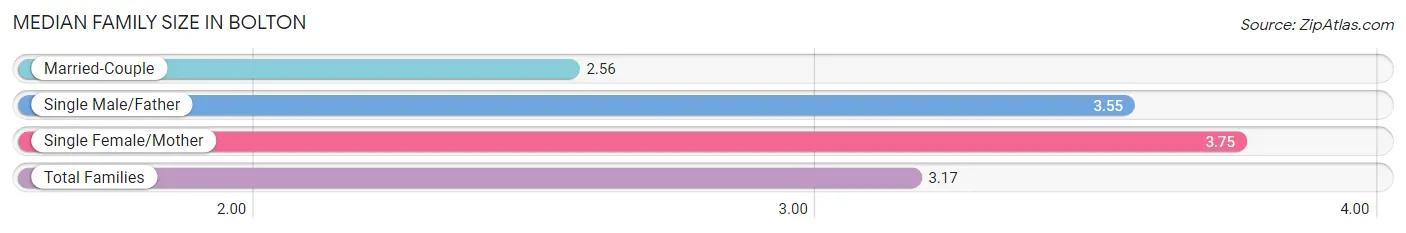
Median Family Size in Bolton
The median family size in Bolton is 3.17 persons per family, with single female/mother families (123 | 47.7%) accounting for the largest median family size of 3.75 persons per family. On the other hand, married-couple families (124 | 48.1%) represent the smallest median family size with 2.56 persons per family.
| Family Type | # Families | Family Size |
| Married-Couple | 124 (48.1%) | 2.56 |
| Single Male/Father | 11 (4.3%) | 3.55 |
| Single Female/Mother | 123 (47.7%) | 3.75 |
| Total Families | 258 (100.0%) | 3.17 |
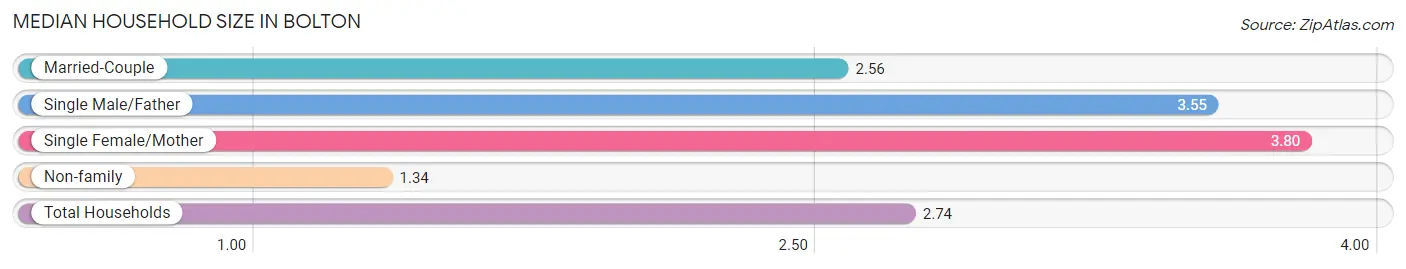
Median Household Size in Bolton
The median household size in Bolton is 2.74 persons per household, with single female/mother households (123 | 36.1%) accounting for the largest median household size of 3.8 persons per household. non-family households (83 | 24.3%) represent the smallest median household size with 1.34 persons per household.
| Household Type | # Households | Household Size |
| Married-Couple | 124 (36.4%) | 2.56 |
| Single Male/Father | 11 (3.2%) | 3.55 |
| Single Female/Mother | 123 (36.1%) | 3.80 |
| Non-family | 83 (24.3%) | 1.34 |
| Total Households | 341 (100.0%) | 2.74 |
Household Size by Marriage Status in Bolton
Out of a total of 341 households in Bolton, 258 (75.7%) are family households, while 83 (24.3%) are nonfamily households. The most numerous type of family households are 2-person households, comprising 157, and the most common type of nonfamily households are 1-person households, comprising 76.
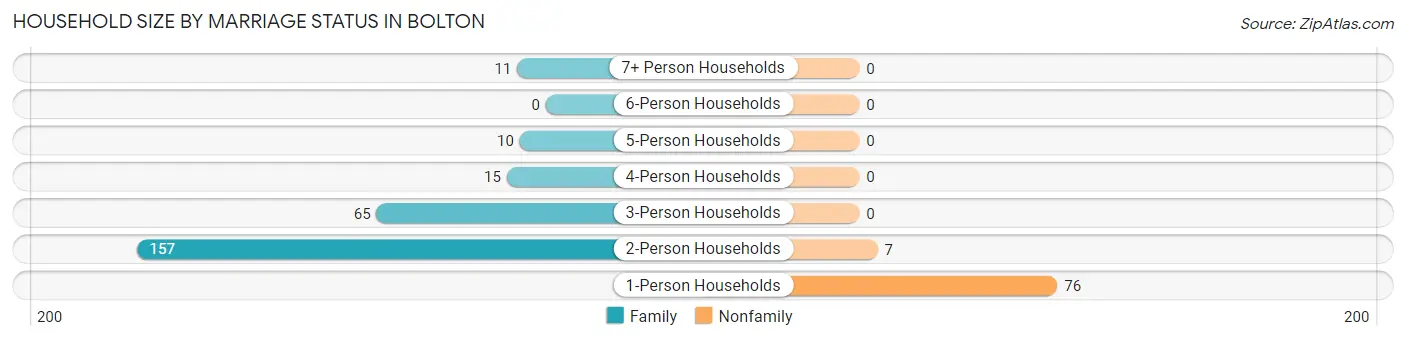
| Household Size | Family Households | Nonfamily Households |
| 1-Person Households | - | 76 (22.3%) |
| 2-Person Households | 157 (46.0%) | 7 (2.1%) |
| 3-Person Households | 65 (19.1%) | 0 (0.0%) |
| 4-Person Households | 15 (4.4%) | 0 (0.0%) |
| 5-Person Households | 10 (2.9%) | 0 (0.0%) |
| 6-Person Households | 0 (0.0%) | 0 (0.0%) |
| 7+ Person Households | 11 (3.2%) | 0 (0.0%) |
| Total | 258 (75.7%) | 83 (24.3%) |
Female Fertility in Bolton
Fertility by Age in Bolton
| Age Bracket | Women with Births | Births / 1,000 Women |
| 15 to 19 years | 0 (0.0%) | 0.0 |
| 20 to 34 years | 0 (0.0%) | 0.0 |
| 35 to 50 years | 0 (0.0%) | 0.0 |
| Total | 0 (0.0%) | 0.0 |
Fertility by Age by Marriage Status in Bolton
| Age Bracket | Married | Unmarried |
| 15 to 19 years | 0 (0.0%) | 0 (0.0%) |
| 20 to 34 years | 0 (0.0%) | 0 (0.0%) |
| 35 to 50 years | 0 (0.0%) | 0 (0.0%) |
| Total | 0 (0.0%) | 0 (0.0%) |
Fertility by Education in Bolton
| Educational Attainment | Women with Births | Births / 1,000 Women |
| Less than High School | 0 (0.0%) | 0.0 |
| High School Diploma | 0 (0.0%) | 0.0 |
| College or Associate's Degree | 0 (0.0%) | 0.0 |
| Bachelor's Degree | 0 (0.0%) | 0.0 |
| Graduate Degree | 0 (0.0%) | 0.0 |
| Total | 0 (0.0%) | 0.0 |
Fertility by Education by Marriage Status in Bolton
| Educational Attainment | Married | Unmarried |
| Less than High School | 0 (0.0%) | 0 (0.0%) |
| High School Diploma | 0 (0.0%) | 0 (0.0%) |
| College or Associate's Degree | 0 (0.0%) | 0 (0.0%) |
| Bachelor's Degree | 0 (0.0%) | 0 (0.0%) |
| Graduate Degree | 0 (0.0%) | 0 (0.0%) |
| Total | 0 (0.0%) | 0 (0.0%) |
Income in Bolton
Income Overview in Bolton
Per Capita Income in Bolton is $26,535, while median incomes of families and households are $68,148 and $53,523 respectively.
| Characteristic | Number | Measure |
| Per Capita Income | 936 | $26,535 |
| Median Family Income | 258 | $68,148 |
| Mean Family Income | 258 | $78,294 |
| Median Household Income | 341 | $53,523 |
| Mean Household Income | 341 | $68,967 |
| Income Deficit | 258 | $0 |
| Wage / Income Gap (%) | 936 | 0.00% |
| Wage / Income Gap ($) | 936 | 100.00¢ per $1 |
| Gini / Inequality Index | 936 | 0.43 |
Earnings by Sex in Bolton
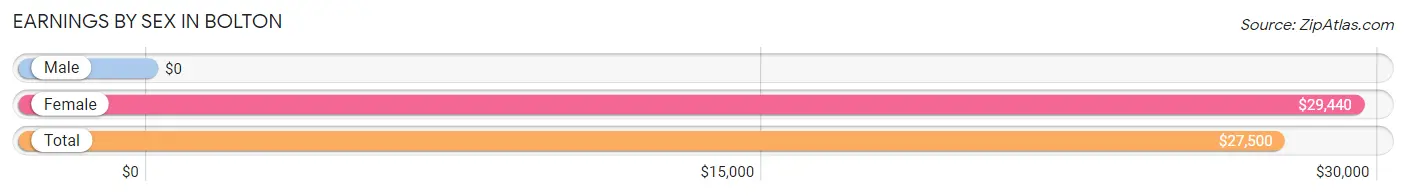
| Sex | Number | Average Earnings |
| Male | 301 (54.3%) | $0 |
| Female | 253 (45.7%) | $29,440 |
| Total | 554 (100.0%) | $27,500 |
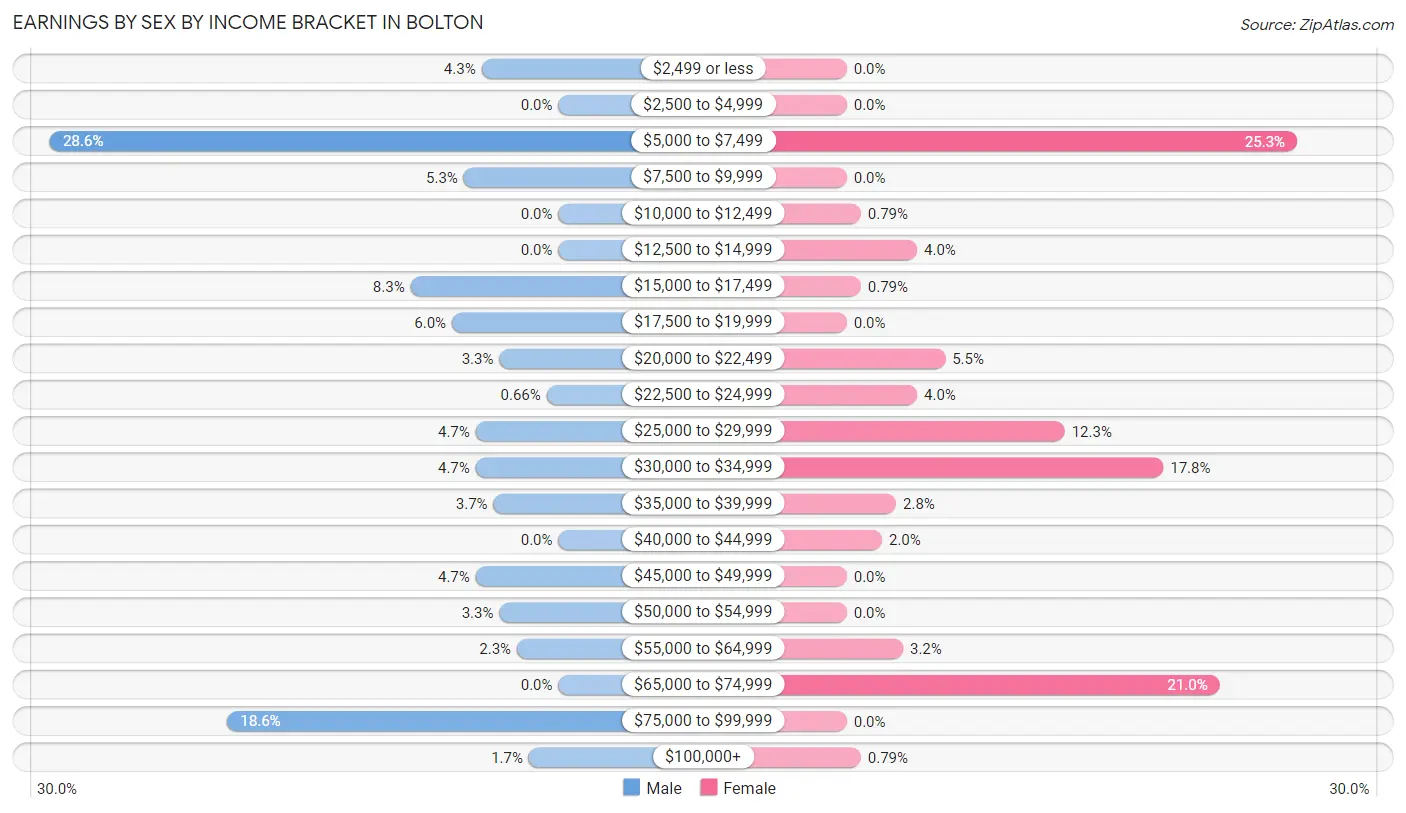
Earnings by Sex by Income Bracket in Bolton
The most common earnings brackets in Bolton are $5,000 to $7,499 for men (86 | 28.6%) and $5,000 to $7,499 for women (64 | 25.3%).
| Income | Male | Female |
| $2,499 or less | 13 (4.3%) | 0 (0.0%) |
| $2,500 to $4,999 | 0 (0.0%) | 0 (0.0%) |
| $5,000 to $7,499 | 86 (28.6%) | 64 (25.3%) |
| $7,500 to $9,999 | 16 (5.3%) | 0 (0.0%) |
| $10,000 to $12,499 | 0 (0.0%) | 2 (0.8%) |
| $12,500 to $14,999 | 0 (0.0%) | 10 (4.0%) |
| $15,000 to $17,499 | 25 (8.3%) | 2 (0.8%) |
| $17,500 to $19,999 | 18 (6.0%) | 0 (0.0%) |
| $20,000 to $22,499 | 10 (3.3%) | 14 (5.5%) |
| $22,500 to $24,999 | 2 (0.7%) | 10 (4.0%) |
| $25,000 to $29,999 | 14 (4.6%) | 31 (12.2%) |
| $30,000 to $34,999 | 14 (4.6%) | 45 (17.8%) |
| $35,000 to $39,999 | 11 (3.6%) | 7 (2.8%) |
| $40,000 to $44,999 | 0 (0.0%) | 5 (2.0%) |
| $45,000 to $49,999 | 14 (4.6%) | 0 (0.0%) |
| $50,000 to $54,999 | 10 (3.3%) | 0 (0.0%) |
| $55,000 to $64,999 | 7 (2.3%) | 8 (3.2%) |
| $65,000 to $74,999 | 0 (0.0%) | 53 (20.9%) |
| $75,000 to $99,999 | 56 (18.6%) | 0 (0.0%) |
| $100,000+ | 5 (1.7%) | 2 (0.8%) |
| Total | 301 (100.0%) | 253 (100.0%) |
Earnings by Sex by Educational Attainment in Bolton
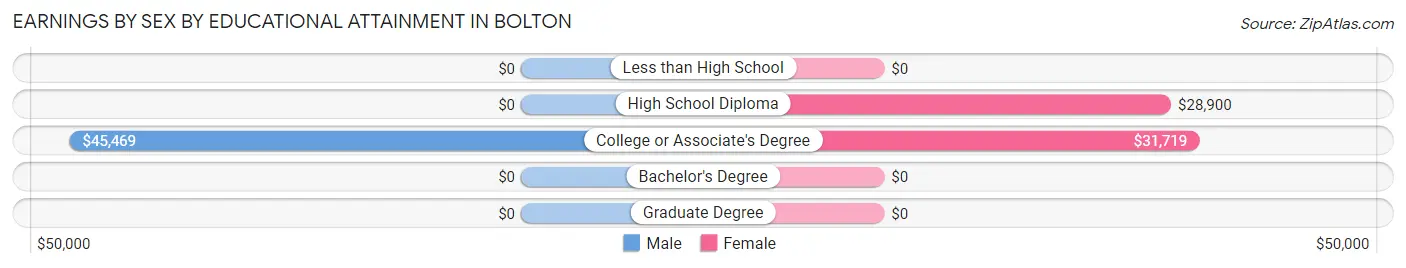
| Educational Attainment | Male Income | Female Income |
| Less than High School | - | - |
| High School Diploma | - | - |
| College or Associate's Degree | $45,469 | $31,719 |
| Bachelor's Degree | - | - |
| Graduate Degree | - | - |
| Total | - | - |
Family Income in Bolton
Family Income Brackets in Bolton
According to the Bolton family income data, there are 53 families falling into the $100,000 to $149,999 income range, which is the most common income bracket and makes up 20.5% of all families.
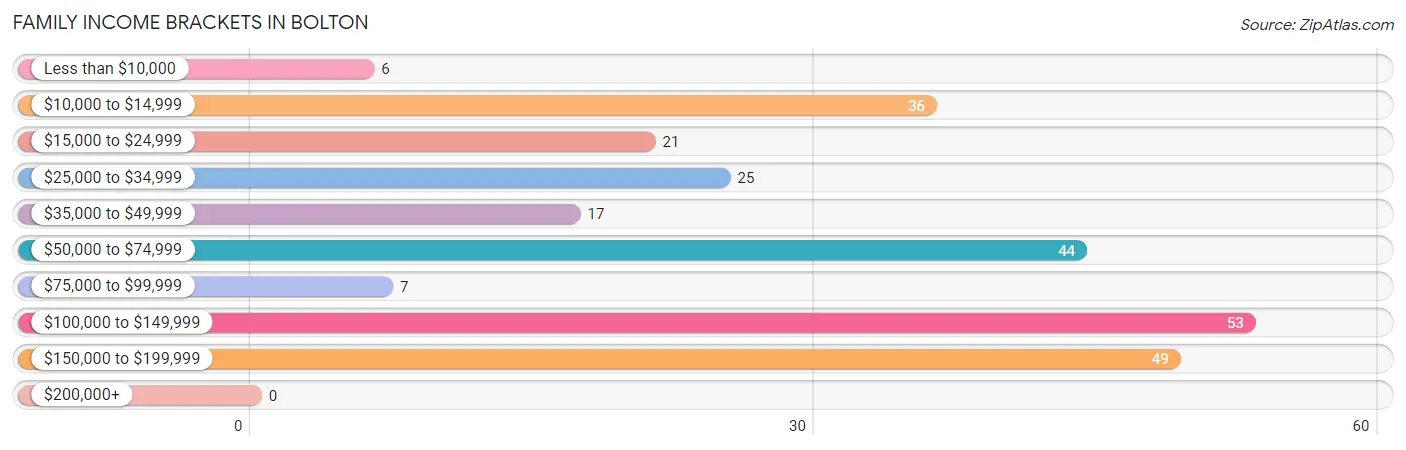
| Income Bracket | # Families | % Families |
| Less than $10,000 | 6 | 2.3% |
| $10,000 to $14,999 | 36 | 14.0% |
| $15,000 to $24,999 | 21 | 8.1% |
| $25,000 to $34,999 | 25 | 9.7% |
| $35,000 to $49,999 | 17 | 6.6% |
| $50,000 to $74,999 | 44 | 17.1% |
| $75,000 to $99,999 | 7 | 2.7% |
| $100,000 to $149,999 | 53 | 20.5% |
| $150,000 to $199,999 | 49 | 19.0% |
| $200,000+ | 0 | 0.0% |
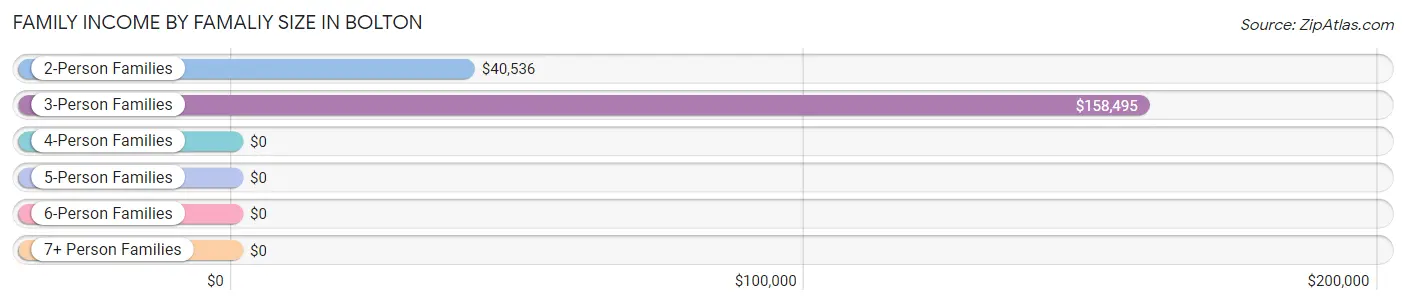
Family Income by Famaliy Size in Bolton
3-person families (59 | 22.9%) account for the highest median family income in Bolton with $158,495 per family, while 3-person families (59 | 22.9%) have the highest median income of $52,832 per family member.
| Income Bracket | # Families | Median Income |
| 2-Person Families | 163 (63.2%) | $40,536 |
| 3-Person Families | 59 (22.9%) | $158,495 |
| 4-Person Families | 15 (5.8%) | $0 |
| 5-Person Families | 10 (3.9%) | $0 |
| 6-Person Families | 0 (0.0%) | $0 |
| 7+ Person Families | 11 (4.3%) | $0 |
| Total | 258 (100.0%) | $68,148 |
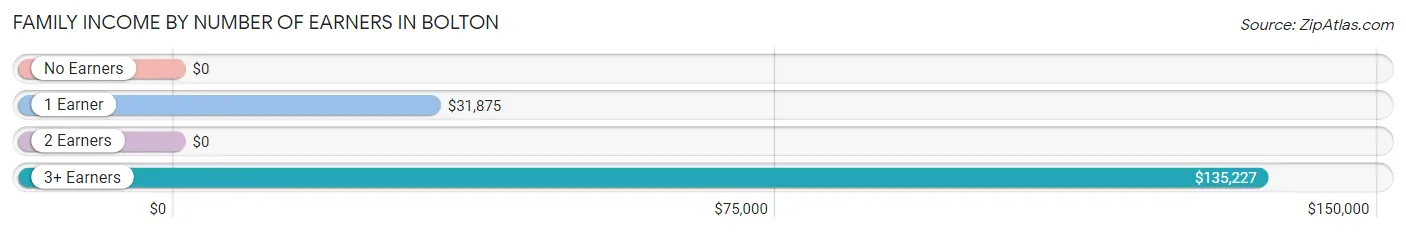
Family Income by Number of Earners in Bolton
| Number of Earners | # Families | Median Income |
| No Earners | 40 (15.5%) | $0 |
| 1 Earner | 60 (23.3%) | $31,875 |
| 2 Earners | 138 (53.5%) | $0 |
| 3+ Earners | 20 (7.7%) | $135,227 |
| Total | 258 (100.0%) | $68,148 |
Household Income in Bolton
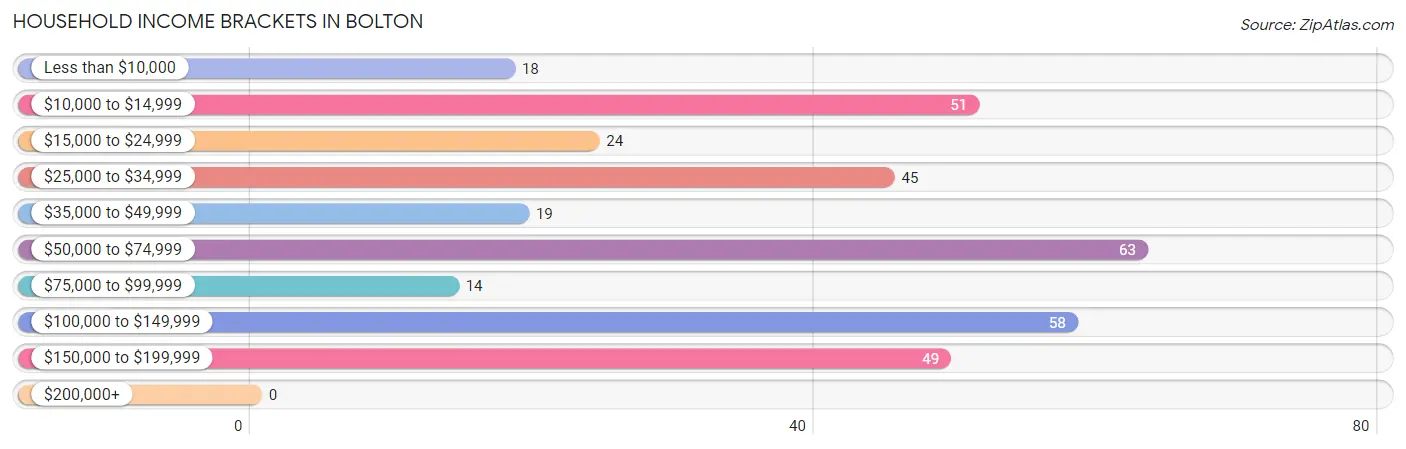
Household Income Brackets in Bolton
With 63 households falling in the category, the $50,000 to $74,999 income range is the most frequent in Bolton, accounting for 18.5% of all households.
| Income Bracket | # Households | % Households |
| Less than $10,000 | 18 | 5.3% |
| $10,000 to $14,999 | 51 | 15.0% |
| $15,000 to $24,999 | 24 | 7.0% |
| $25,000 to $34,999 | 45 | 13.2% |
| $35,000 to $49,999 | 19 | 5.6% |
| $50,000 to $74,999 | 63 | 18.5% |
| $75,000 to $99,999 | 14 | 4.1% |
| $100,000 to $149,999 | 58 | 17.0% |
| $150,000 to $199,999 | 49 | 14.4% |
| $200,000+ | 0 | 0.0% |
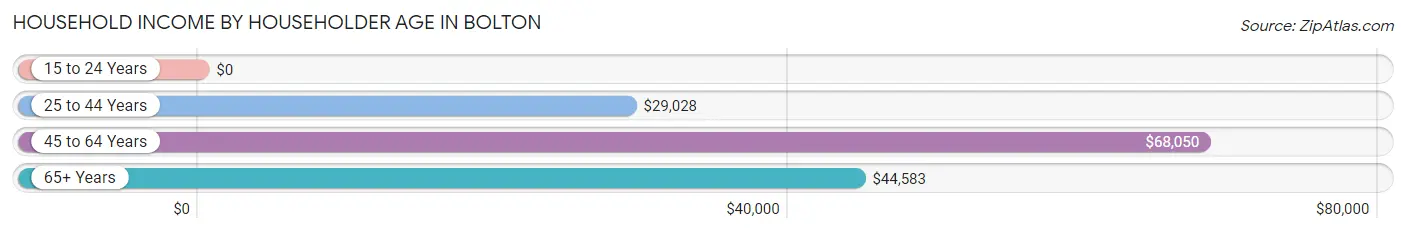
Household Income by Householder Age in Bolton
The median household income in Bolton is $53,523, with the highest median household income of $68,050 found in the 45 to 64 years age bracket for the primary householder. A total of 225 households (66.0%) fall into this category. Meanwhile, the 15 to 24 years age bracket for the primary householder has the lowest median household income of $0, with 2 households (0.6%) in this group.
| Income Bracket | # Households | Median Income |
| 15 to 24 Years | 2 (0.6%) | $0 |
| 25 to 44 Years | 25 (7.3%) | $29,028 |
| 45 to 64 Years | 225 (66.0%) | $68,050 |
| 65+ Years | 89 (26.1%) | $44,583 |
| Total | 341 (100.0%) | $53,523 |
Poverty in Bolton
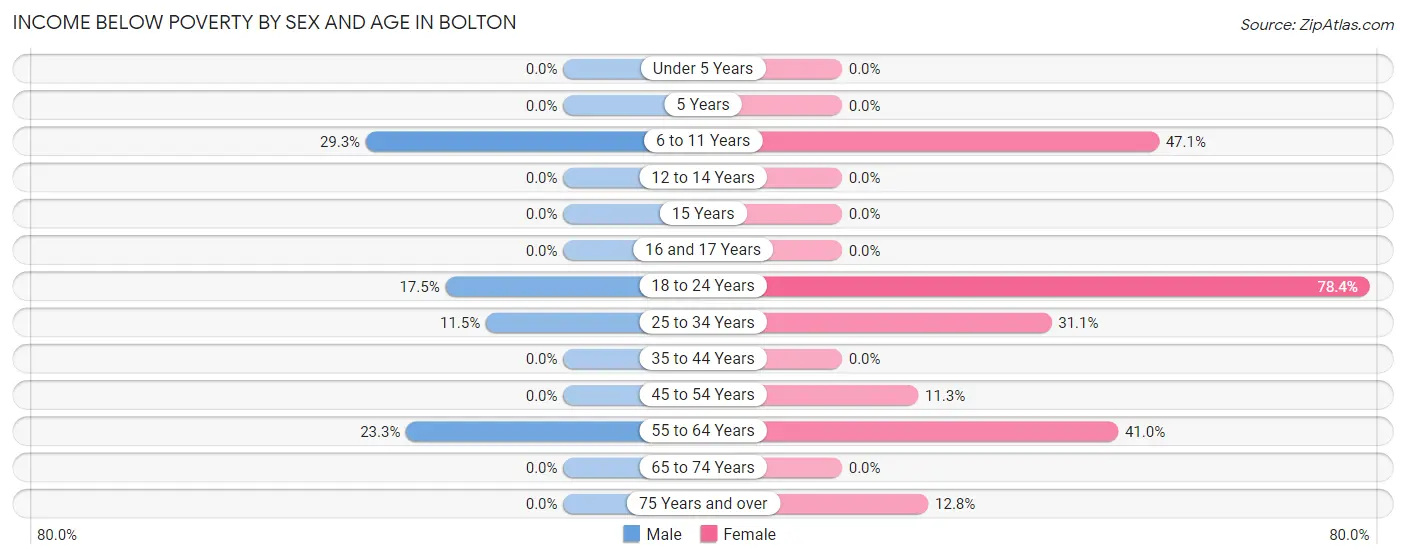
Income Below Poverty by Sex and Age in Bolton
With 7.5% poverty level for males and 27.8% for females among the residents of Bolton, 6 to 11 year old males and 18 to 24 year old females are the most vulnerable to poverty, with 17 males (29.3%) and 29 females (78.4%) in their respective age groups living below the poverty level.
| Age Bracket | Male | Female |
| Under 5 Years | 0 (0.0%) | 0 (0.0%) |
| 5 Years | 0 (0.0%) | 0 (0.0%) |
| 6 to 11 Years | 17 (29.3%) | 8 (47.1%) |
| 12 to 14 Years | 0 (0.0%) | 0 (0.0%) |
| 15 Years | 0 (0.0%) | 0 (0.0%) |
| 16 and 17 Years | 0 (0.0%) | 0 (0.0%) |
| 18 to 24 Years | 7 (17.5%) | 29 (78.4%) |
| 25 to 34 Years | 7 (11.5%) | 14 (31.1%) |
| 35 to 44 Years | 0 (0.0%) | 0 (0.0%) |
| 45 to 54 Years | 0 (0.0%) | 6 (11.3%) |
| 55 to 64 Years | 7 (23.3%) | 57 (41.0%) |
| 65 to 74 Years | 0 (0.0%) | 0 (0.0%) |
| 75 Years and over | 0 (0.0%) | 5 (12.8%) |
| Total | 38 (7.5%) | 119 (27.8%) |
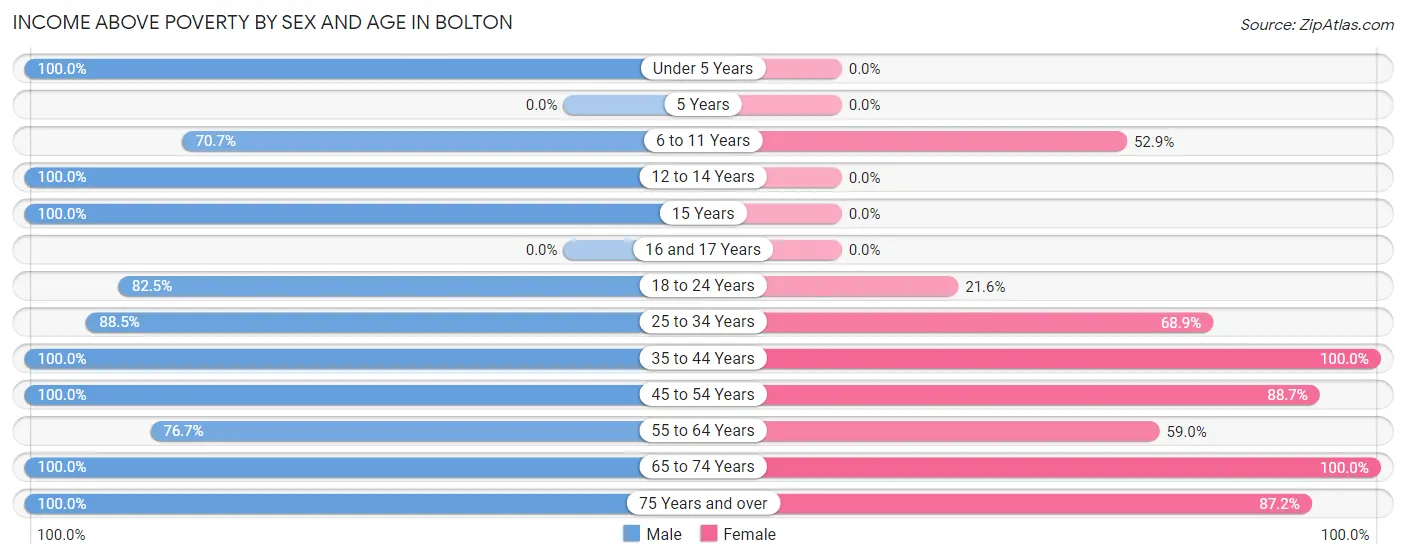
Income Above Poverty by Sex and Age in Bolton
According to the poverty statistics in Bolton, males aged under 5 years and females aged 35 to 44 years are the age groups that are most secure financially, with 100.0% of males and 100.0% of females in these age groups living above the poverty line.
| Age Bracket | Male | Female |
| Under 5 Years | 57 (100.0%) | 0 (0.0%) |
| 5 Years | 0 (0.0%) | 0 (0.0%) |
| 6 to 11 Years | 41 (70.7%) | 9 (52.9%) |
| 12 to 14 Years | 15 (100.0%) | 0 (0.0%) |
| 15 Years | 3 (100.0%) | 0 (0.0%) |
| 16 and 17 Years | 0 (0.0%) | 0 (0.0%) |
| 18 to 24 Years | 33 (82.5%) | 8 (21.6%) |
| 25 to 34 Years | 54 (88.5%) | 31 (68.9%) |
| 35 to 44 Years | 103 (100.0%) | 59 (100.0%) |
| 45 to 54 Years | 79 (100.0%) | 47 (88.7%) |
| 55 to 64 Years | 23 (76.7%) | 82 (59.0%) |
| 65 to 74 Years | 33 (100.0%) | 39 (100.0%) |
| 75 Years and over | 29 (100.0%) | 34 (87.2%) |
| Total | 470 (92.5%) | 309 (72.2%) |
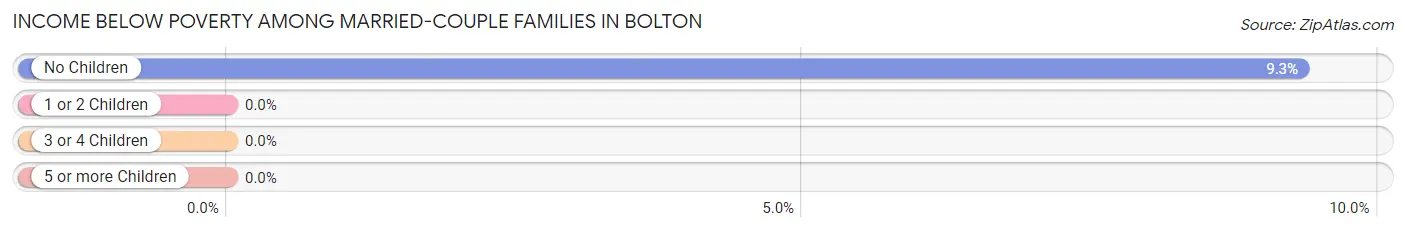
Income Below Poverty Among Married-Couple Families in Bolton
The poverty statistics for married-couple families in Bolton show that 5.7% or 7 of the total 124 families live below the poverty line. Families with no children have the highest poverty rate of 9.3%, comprising of 7 families. On the other hand, families with 1 or 2 children have the lowest poverty rate of 0.0%, which includes 0 families.
| Children | Above Poverty | Below Poverty |
| No Children | 68 (90.7%) | 7 (9.3%) |
| 1 or 2 Children | 49 (100.0%) | 0 (0.0%) |
| 3 or 4 Children | 0 (0.0%) | 0 (0.0%) |
| 5 or more Children | 0 (0.0%) | 0 (0.0%) |
| Total | 117 (94.4%) | 7 (5.7%) |
Income Below Poverty Among Single-Parent Households in Bolton
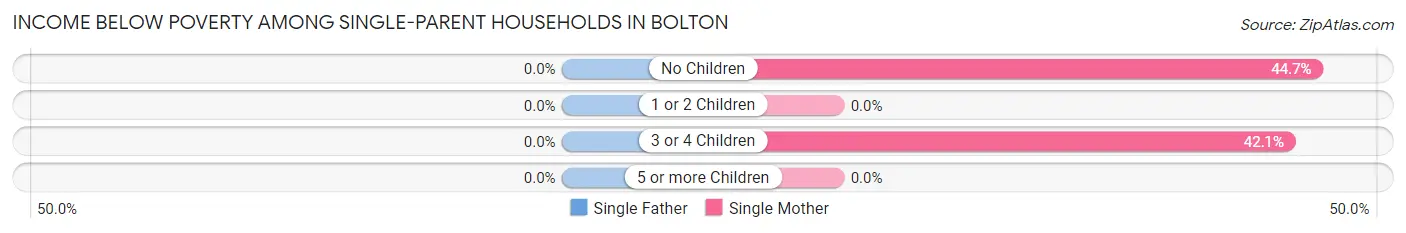
| Children | Single Father | Single Mother |
| No Children | 0 (0.0%) | 42 (44.7%) |
| 1 or 2 Children | 0 (0.0%) | 0 (0.0%) |
| 3 or 4 Children | 0 (0.0%) | 8 (42.1%) |
| 5 or more Children | 0 (0.0%) | 0 (0.0%) |
| Total | 0 (0.0%) | 50 (40.6%) |
Income Below Poverty Among Married-Couple vs Single-Parent Households in Bolton
The poverty data for Bolton shows that 7 of the married-couple family households (5.7%) and 50 of the single-parent households (37.3%) are living below the poverty level. Within the married-couple family households, those with no children have the highest poverty rate, with 7 households (9.3%) falling below the poverty line. Among the single-parent households, those with 3 or 4 children have the highest poverty rate, with 8 household (42.1%) living below poverty.
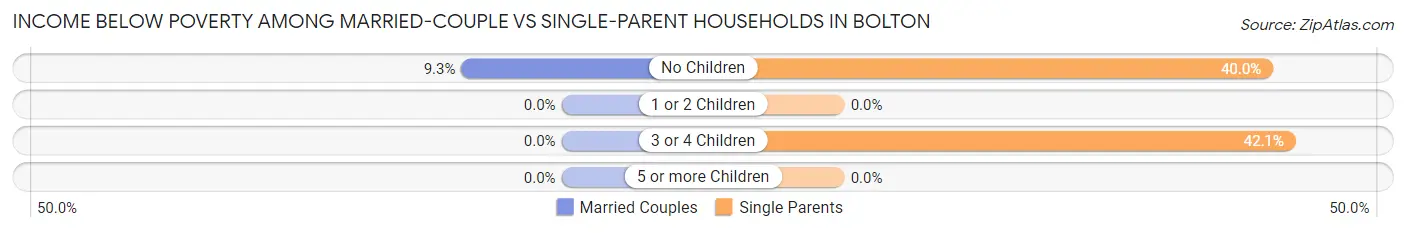
| Children | Married-Couple Families | Single-Parent Households |
| No Children | 7 (9.3%) | 42 (40.0%) |
| 1 or 2 Children | 0 (0.0%) | 0 (0.0%) |
| 3 or 4 Children | 0 (0.0%) | 8 (42.1%) |
| 5 or more Children | 0 (0.0%) | 0 (0.0%) |
| Total | 7 (5.7%) | 50 (37.3%) |
Employment Characteristics in Bolton
Employment by Class of Employer in Bolton
Among the 451 employed individuals in Bolton, private company employees (222 | 49.2%), state government employees (104 | 23.1%), and federal government employees (55 | 12.2%) make up the most common classes of employment.
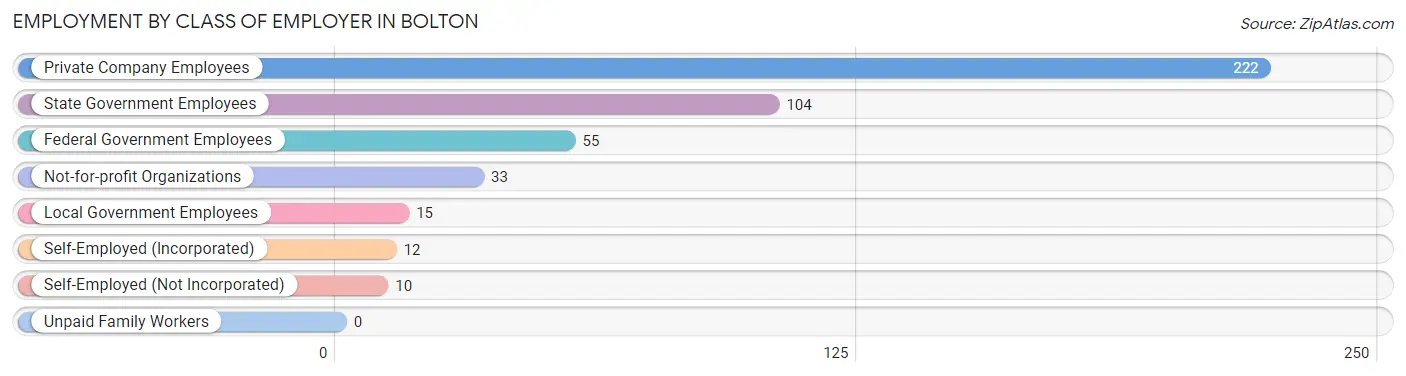
| Employer Class | # Employees | % Employees |
| Private Company Employees | 222 | 49.2% |
| Self-Employed (Incorporated) | 12 | 2.7% |
| Self-Employed (Not Incorporated) | 10 | 2.2% |
| Not-for-profit Organizations | 33 | 7.3% |
| Local Government Employees | 15 | 3.3% |
| State Government Employees | 104 | 23.1% |
| Federal Government Employees | 55 | 12.2% |
| Unpaid Family Workers | 0 | 0.0% |
| Total | 451 | 100.0% |
Employment Status by Age in Bolton
According to the labor force statistics for Bolton, out of the total population over 16 years of age (786), 70.9% or 557 individuals are in the labor force, with 2.2% or 12 of them unemployed. The age group with the highest labor force participation rate is 20 to 24 years, with 100.0% or 26 individuals in the labor force. Within the labor force, the 20 to 24 years age range has the highest percentage of unemployed individuals, with 26.9% or 7 of them being unemployed.
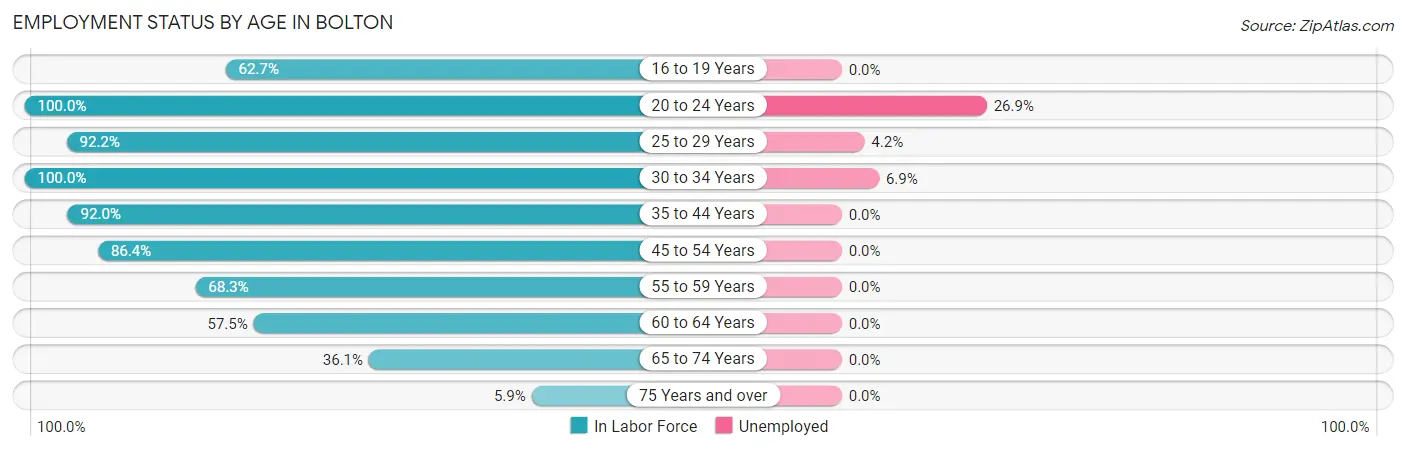
| Age Bracket | In Labor Force | Unemployed |
| 16 to 19 Years | 32 (62.7%) | 0 (0.0%) |
| 20 to 24 Years | 26 (100.0%) | 7 (26.9%) |
| 25 to 29 Years | 71 (92.2%) | 3 (4.2%) |
| 30 to 34 Years | 29 (100.0%) | 2 (6.9%) |
| 35 to 44 Years | 149 (92.0%) | 0 (0.0%) |
| 45 to 54 Years | 114 (86.4%) | 0 (0.0%) |
| 55 to 59 Years | 56 (68.3%) | 0 (0.0%) |
| 60 to 64 Years | 50 (57.5%) | 0 (0.0%) |
| 65 to 74 Years | 26 (36.1%) | 0 (0.0%) |
| 75 Years and over | 4 (5.9%) | 0 (0.0%) |
| Total | 557 (70.9%) | 12 (2.2%) |
Employment Status by Educational Attainment in Bolton
According to labor force statistics for Bolton, 82.4% of individuals (469) out of the total population between 25 and 64 years of age (569) are in the labor force, with 1.1% or 5 of them being unemployed. The group with the highest labor force participation rate are those with the educational attainment of bachelor's degree or higher, with 96.2% or 127 individuals in the labor force. Within the labor force, individuals with college / associate degree education have the highest percentage of unemployment, with 3.0% or 2 of them being unemployed.
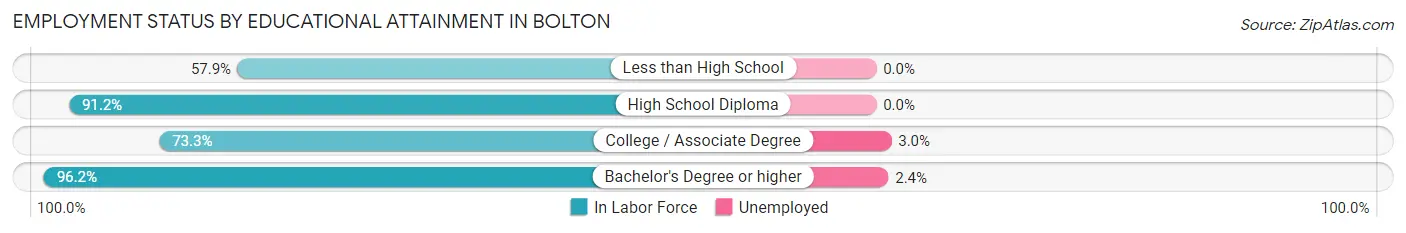
| Educational Attainment | In Labor Force | Unemployed |
| Less than High School | 70 (57.9%) | 0 (0.0%) |
| High School Diploma | 206 (91.2%) | 0 (0.0%) |
| College / Associate Degree | 66 (73.3%) | 3 (3.0%) |
| Bachelor's Degree or higher | 127 (96.2%) | 3 (2.4%) |
| Total | 469 (82.4%) | 6 (1.1%) |
Employment Occupations by Sex in Bolton
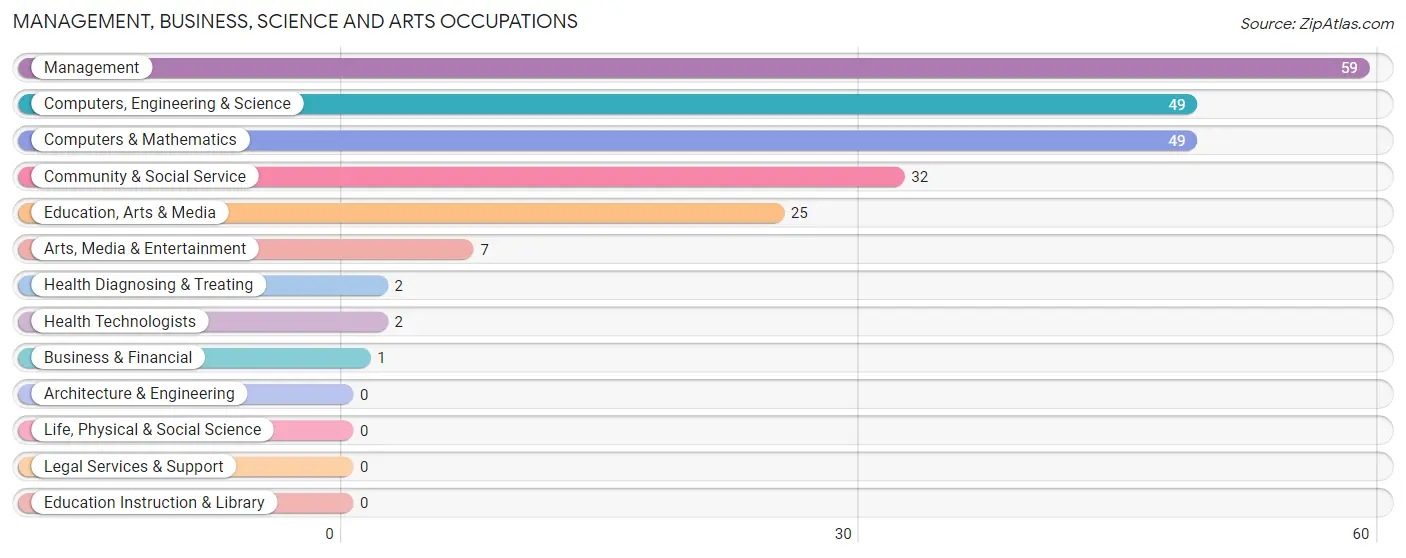
Management, Business, Science and Arts Occupations
The most common Management, Business, Science and Arts occupations in Bolton are Management (59 | 10.8%), Computers, Engineering & Science (49 | 9.0%), Computers & Mathematics (49 | 9.0%), Community & Social Service (32 | 5.9%), and Education, Arts & Media (25 | 4.6%).
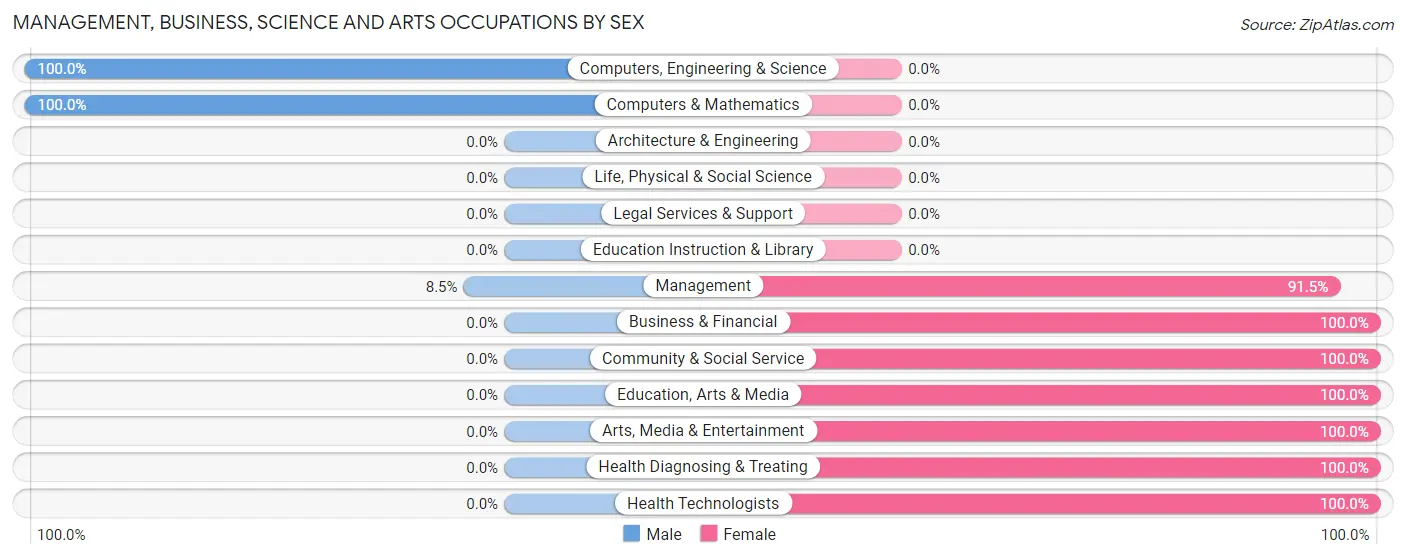
Management, Business, Science and Arts Occupations by Sex
Within the Management, Business, Science and Arts occupations in Bolton, the most male-oriented occupations are Computers, Engineering & Science (100.0%), Computers & Mathematics (100.0%), and Management (8.5%), while the most female-oriented occupations are Business & Financial (100.0%), Community & Social Service (100.0%), and Education, Arts & Media (100.0%).
| Occupation | Male | Female |
| Management | 5 (8.5%) | 54 (91.5%) |
| Business & Financial | 0 (0.0%) | 1 (100.0%) |
| Computers, Engineering & Science | 49 (100.0%) | 0 (0.0%) |
| Computers & Mathematics | 49 (100.0%) | 0 (0.0%) |
| Architecture & Engineering | 0 (0.0%) | 0 (0.0%) |
| Life, Physical & Social Science | 0 (0.0%) | 0 (0.0%) |
| Community & Social Service | 0 (0.0%) | 32 (100.0%) |
| Education, Arts & Media | 0 (0.0%) | 25 (100.0%) |
| Legal Services & Support | 0 (0.0%) | 0 (0.0%) |
| Education Instruction & Library | 0 (0.0%) | 0 (0.0%) |
| Arts, Media & Entertainment | 0 (0.0%) | 7 (100.0%) |
| Health Diagnosing & Treating | 0 (0.0%) | 2 (100.0%) |
| Health Technologists | 0 (0.0%) | 2 (100.0%) |
| Total (Category) | 54 (37.8%) | 89 (62.2%) |
| Total (Overall) | 292 (53.6%) | 253 (46.4%) |
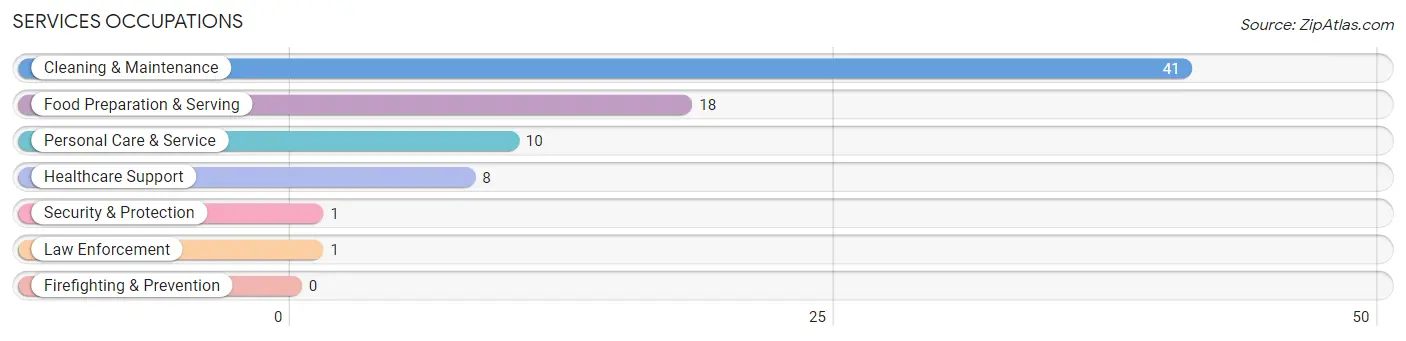
Services Occupations
The most common Services occupations in Bolton are Cleaning & Maintenance (41 | 7.5%), Food Preparation & Serving (18 | 3.3%), Personal Care & Service (10 | 1.8%), Healthcare Support (8 | 1.5%), and Security & Protection (1 | 0.2%).
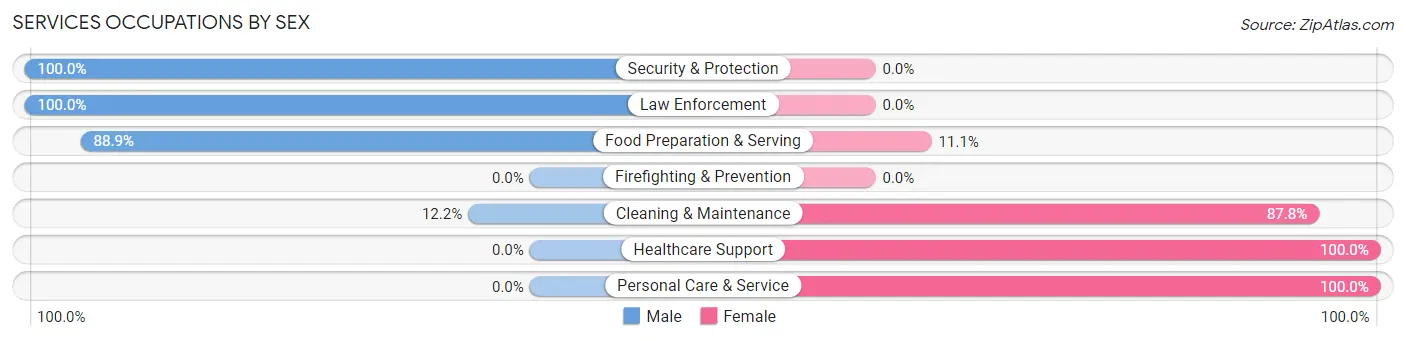
Services Occupations by Sex
Within the Services occupations in Bolton, the most male-oriented occupations are Security & Protection (100.0%), Law Enforcement (100.0%), and Food Preparation & Serving (88.9%), while the most female-oriented occupations are Healthcare Support (100.0%), Personal Care & Service (100.0%), and Cleaning & Maintenance (87.8%).
| Occupation | Male | Female |
| Healthcare Support | 0 (0.0%) | 8 (100.0%) |
| Security & Protection | 1 (100.0%) | 0 (0.0%) |
| Firefighting & Prevention | 0 (0.0%) | 0 (0.0%) |
| Law Enforcement | 1 (100.0%) | 0 (0.0%) |
| Food Preparation & Serving | 16 (88.9%) | 2 (11.1%) |
| Cleaning & Maintenance | 5 (12.2%) | 36 (87.8%) |
| Personal Care & Service | 0 (0.0%) | 10 (100.0%) |
| Total (Category) | 22 (28.2%) | 56 (71.8%) |
| Total (Overall) | 292 (53.6%) | 253 (46.4%) |
Sales and Office Occupations
The most common Sales and Office occupations in Bolton are Office & Administration (56 | 10.3%), and Sales & Related (41 | 7.5%).
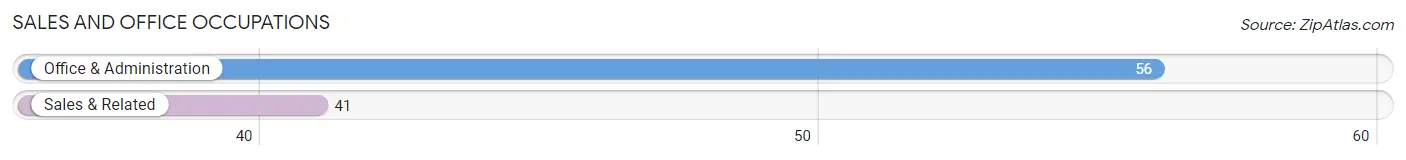
Sales and Office Occupations by Sex
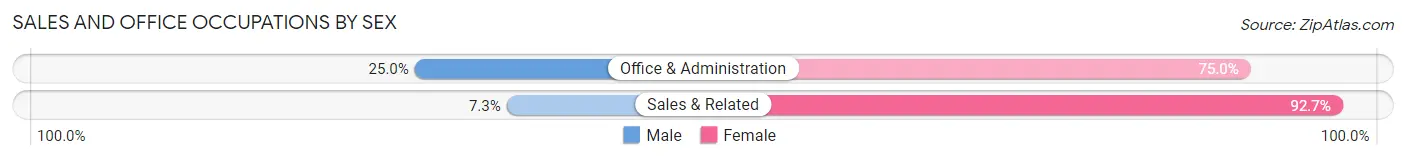
| Occupation | Male | Female |
| Sales & Related | 3 (7.3%) | 38 (92.7%) |
| Office & Administration | 14 (25.0%) | 42 (75.0%) |
| Total (Category) | 17 (17.5%) | 80 (82.5%) |
| Total (Overall) | 292 (53.6%) | 253 (46.4%) |
Natural Resources, Construction and Maintenance Occupations
The most common Natural Resources, Construction and Maintenance occupations in Bolton are Construction & Extraction (122 | 22.4%), and Installation, Maintenance & Repair (10 | 1.8%).
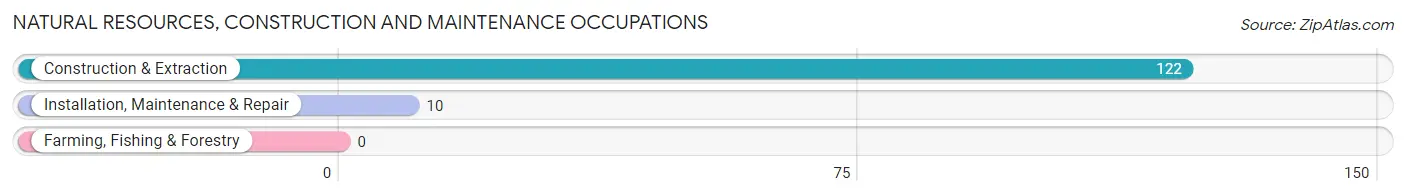
Natural Resources, Construction and Maintenance Occupations by Sex
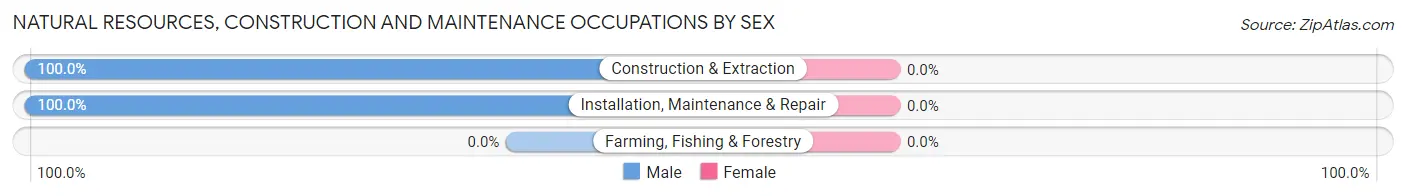
| Occupation | Male | Female |
| Farming, Fishing & Forestry | 0 (0.0%) | 0 (0.0%) |
| Construction & Extraction | 122 (100.0%) | 0 (0.0%) |
| Installation, Maintenance & Repair | 10 (100.0%) | 0 (0.0%) |
| Total (Category) | 132 (100.0%) | 0 (0.0%) |
| Total (Overall) | 292 (53.6%) | 253 (46.4%) |
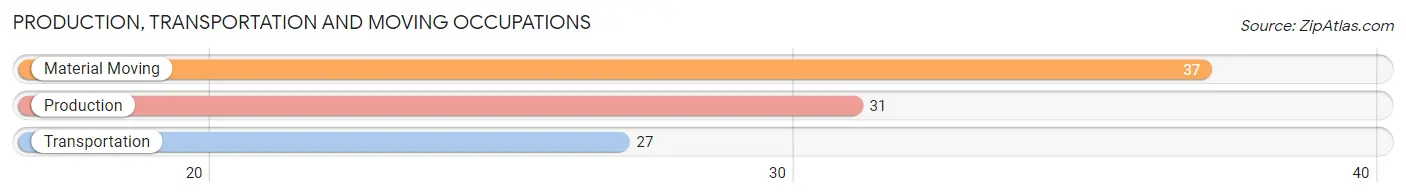
Production, Transportation and Moving Occupations
The most common Production, Transportation and Moving occupations in Bolton are Material Moving (37 | 6.8%), Production (31 | 5.7%), and Transportation (27 | 5.0%).
Production, Transportation and Moving Occupations by Sex
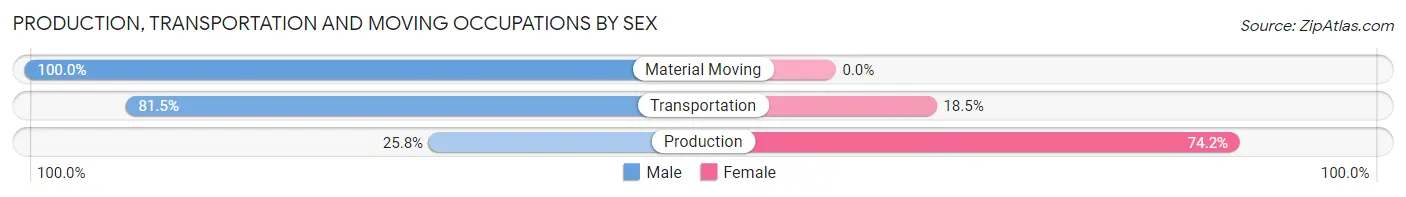
| Occupation | Male | Female |
| Production | 8 (25.8%) | 23 (74.2%) |
| Transportation | 22 (81.5%) | 5 (18.5%) |
| Material Moving | 37 (100.0%) | 0 (0.0%) |
| Total (Category) | 67 (70.5%) | 28 (29.5%) |
| Total (Overall) | 292 (53.6%) | 253 (46.4%) |
Employment Industries by Sex in Bolton
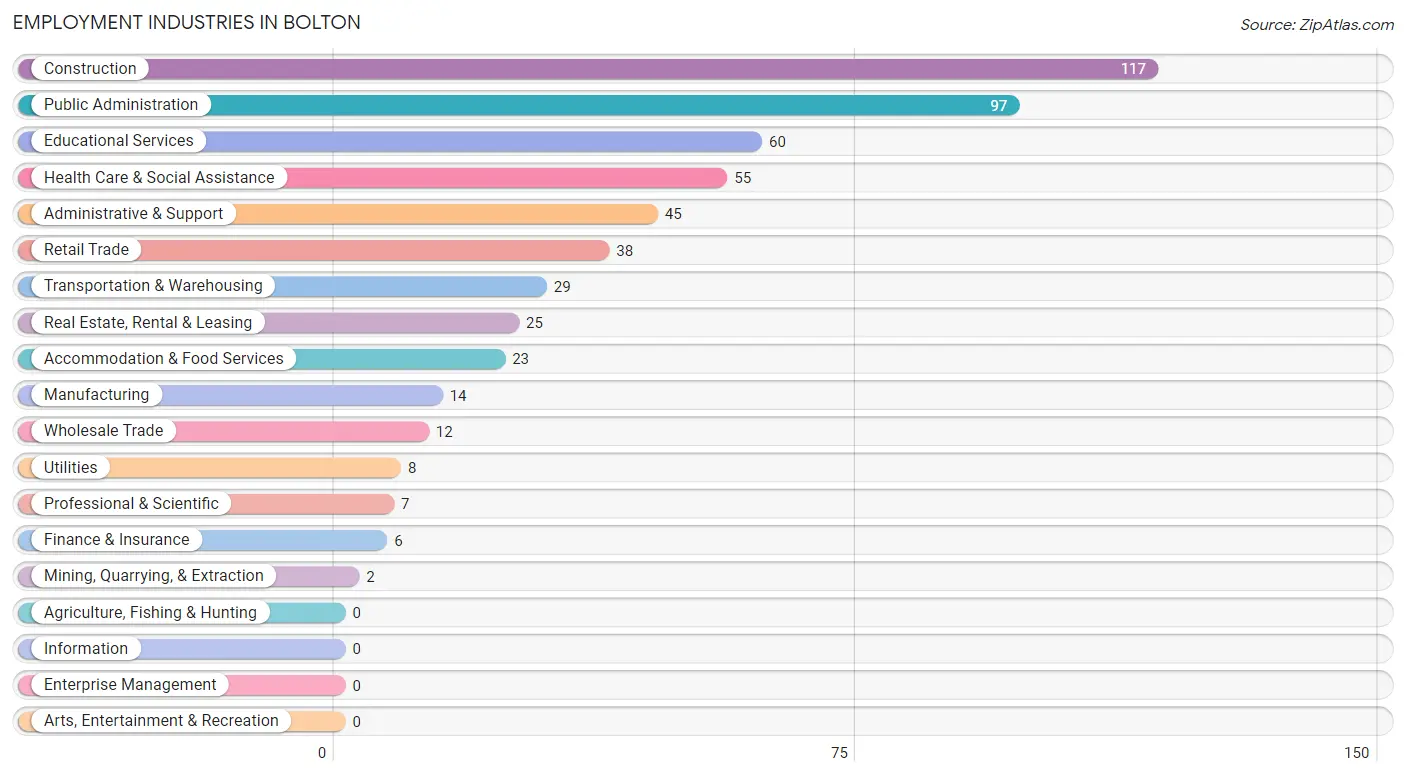
Employment Industries in Bolton
The major employment industries in Bolton include Construction (117 | 21.5%), Public Administration (97 | 17.8%), Educational Services (60 | 11.0%), Health Care & Social Assistance (55 | 10.1%), and Administrative & Support (45 | 8.3%).
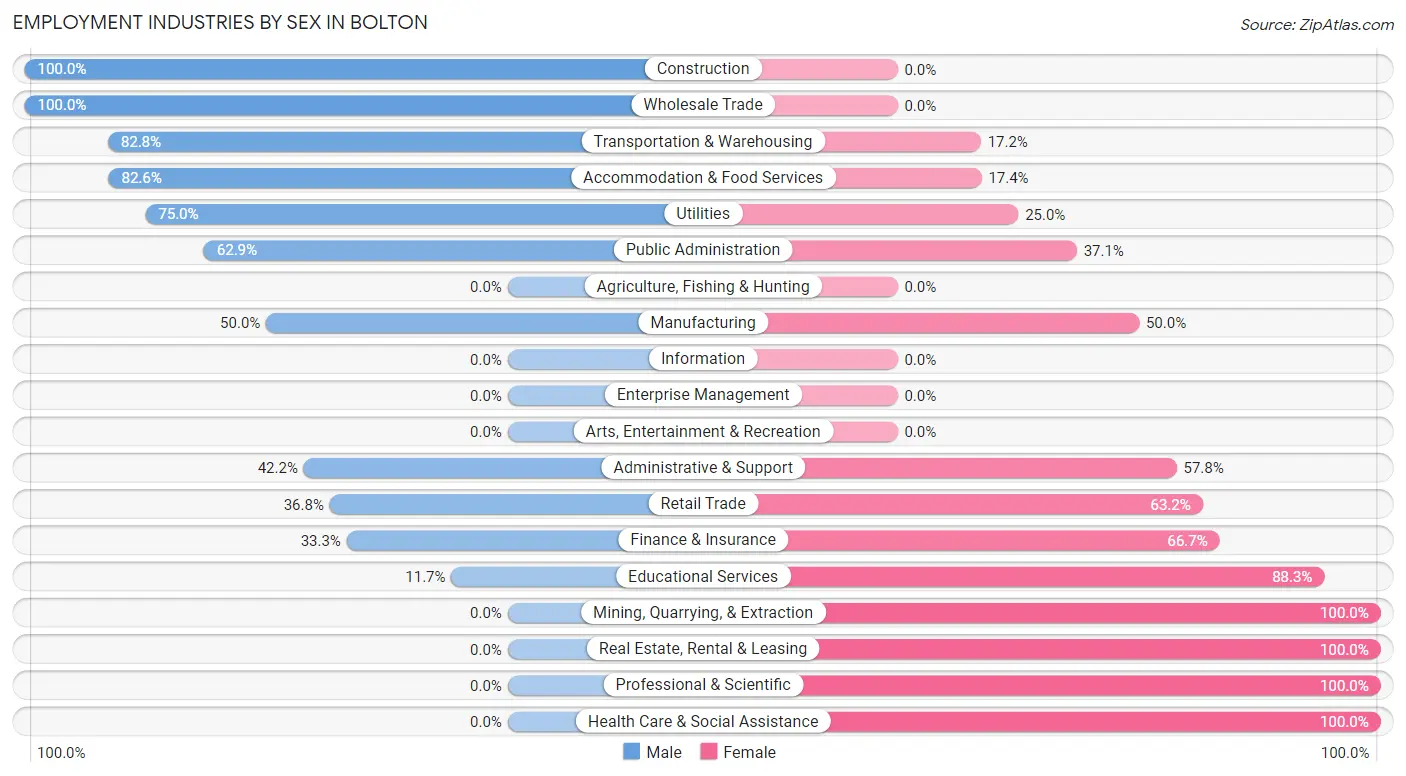
Employment Industries by Sex in Bolton
The Bolton industries that see more men than women are Construction (100.0%), Wholesale Trade (100.0%), and Transportation & Warehousing (82.8%), whereas the industries that tend to have a higher number of women are Mining, Quarrying, & Extraction (100.0%), Real Estate, Rental & Leasing (100.0%), and Professional & Scientific (100.0%).
| Industry | Male | Female |
| Agriculture, Fishing & Hunting | 0 (0.0%) | 0 (0.0%) |
| Mining, Quarrying, & Extraction | 0 (0.0%) | 2 (100.0%) |
| Construction | 117 (100.0%) | 0 (0.0%) |
| Manufacturing | 7 (50.0%) | 7 (50.0%) |
| Wholesale Trade | 12 (100.0%) | 0 (0.0%) |
| Retail Trade | 14 (36.8%) | 24 (63.2%) |
| Transportation & Warehousing | 24 (82.8%) | 5 (17.2%) |
| Utilities | 6 (75.0%) | 2 (25.0%) |
| Information | 0 (0.0%) | 0 (0.0%) |
| Finance & Insurance | 2 (33.3%) | 4 (66.7%) |
| Real Estate, Rental & Leasing | 0 (0.0%) | 25 (100.0%) |
| Professional & Scientific | 0 (0.0%) | 7 (100.0%) |
| Enterprise Management | 0 (0.0%) | 0 (0.0%) |
| Administrative & Support | 19 (42.2%) | 26 (57.8%) |
| Educational Services | 7 (11.7%) | 53 (88.3%) |
| Health Care & Social Assistance | 0 (0.0%) | 55 (100.0%) |
| Arts, Entertainment & Recreation | 0 (0.0%) | 0 (0.0%) |
| Accommodation & Food Services | 19 (82.6%) | 4 (17.4%) |
| Public Administration | 61 (62.9%) | 36 (37.1%) |
| Total | 292 (53.6%) | 253 (46.4%) |
Education in Bolton
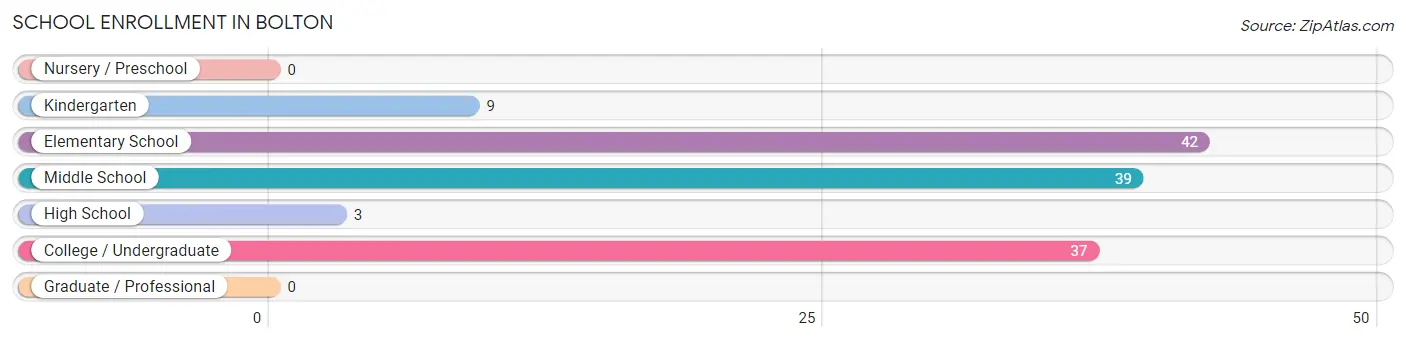
School Enrollment in Bolton
The most common levels of schooling among the 130 students in Bolton are elementary school (42 | 32.3%), middle school (39 | 30.0%), and college / undergraduate (37 | 28.5%).
| School Level | # Students | % Students |
| Nursery / Preschool | 0 | 0.0% |
| Kindergarten | 9 | 6.9% |
| Elementary School | 42 | 32.3% |
| Middle School | 39 | 30.0% |
| High School | 3 | 2.3% |
| College / Undergraduate | 37 | 28.5% |
| Graduate / Professional | 0 | 0.0% |
| Total | 130 | 100.0% |
School Enrollment by Age by Funding Source in Bolton
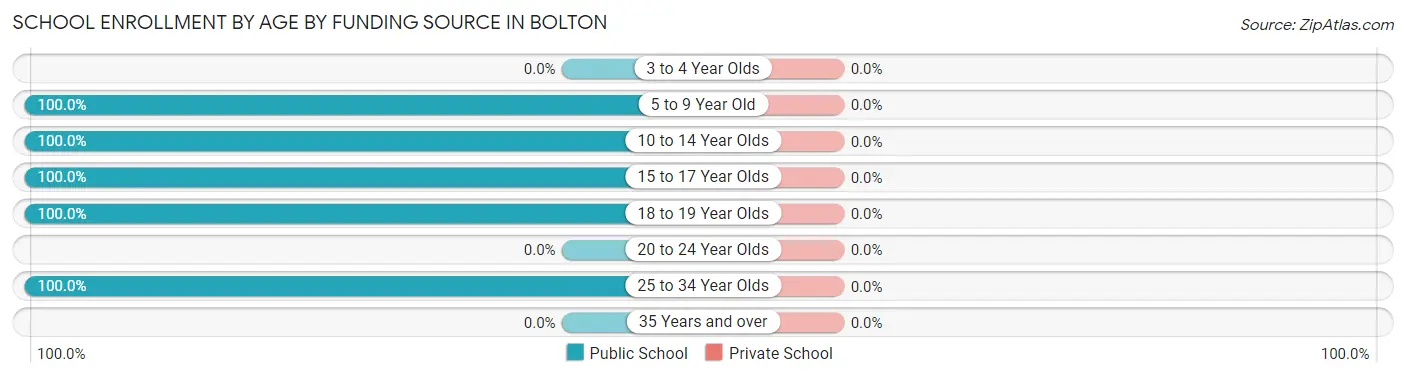
| Age Bracket | Public School | Private School |
| 3 to 4 Year Olds | 0 (0.0%) | 0 (0.0%) |
| 5 to 9 Year Old | 51 (100.0%) | 0 (0.0%) |
| 10 to 14 Year Olds | 39 (100.0%) | 0 (0.0%) |
| 15 to 17 Year Olds | 3 (100.0%) | 0 (0.0%) |
| 18 to 19 Year Olds | 34 (100.0%) | 0 (0.0%) |
| 20 to 24 Year Olds | 0 (0.0%) | 0 (0.0%) |
| 25 to 34 Year Olds | 3 (100.0%) | 0 (0.0%) |
| 35 Years and over | 0 (0.0%) | 0 (0.0%) |
| Total | 130 (100.0%) | 0 (0.0%) |
Educational Attainment by Field of Study in Bolton
Business (53 | 31.0%), bio, nature & agricultural (51 | 29.8%), education (47 | 27.5%), psychology (8 | 4.7%), and visual & performing arts (5 | 2.9%) are the most common fields of study among 171 individuals in Bolton who have obtained a bachelor's degree or higher.
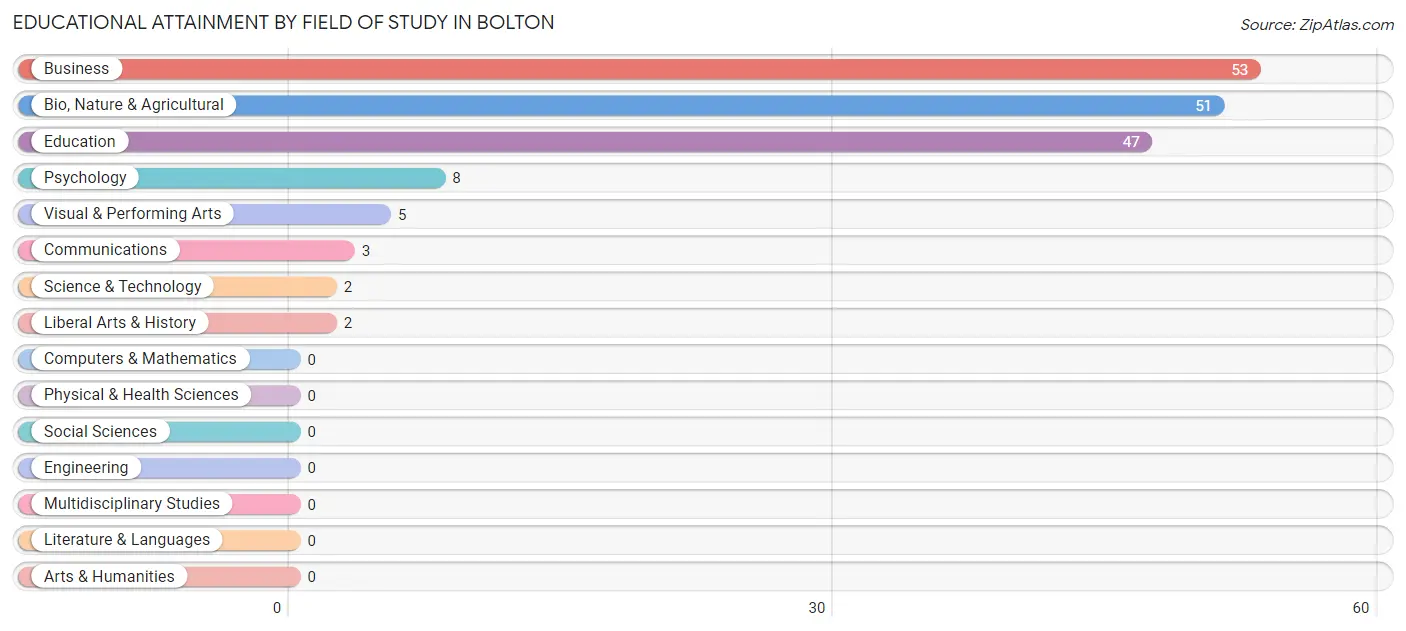
| Field of Study | # Graduates | % Graduates |
| Computers & Mathematics | 0 | 0.0% |
| Bio, Nature & Agricultural | 51 | 29.8% |
| Physical & Health Sciences | 0 | 0.0% |
| Psychology | 8 | 4.7% |
| Social Sciences | 0 | 0.0% |
| Engineering | 0 | 0.0% |
| Multidisciplinary Studies | 0 | 0.0% |
| Science & Technology | 2 | 1.2% |
| Business | 53 | 31.0% |
| Education | 47 | 27.5% |
| Literature & Languages | 0 | 0.0% |
| Liberal Arts & History | 2 | 1.2% |
| Visual & Performing Arts | 5 | 2.9% |
| Communications | 3 | 1.8% |
| Arts & Humanities | 0 | 0.0% |
| Total | 171 | 100.0% |
Transportation & Commute in Bolton
Vehicle Availability by Sex in Bolton
The most prevalent vehicle ownership categories in Bolton are males with 3 vehicles (69, accounting for 34.8%) and females with 3 vehicles (134, making up 27.3%).
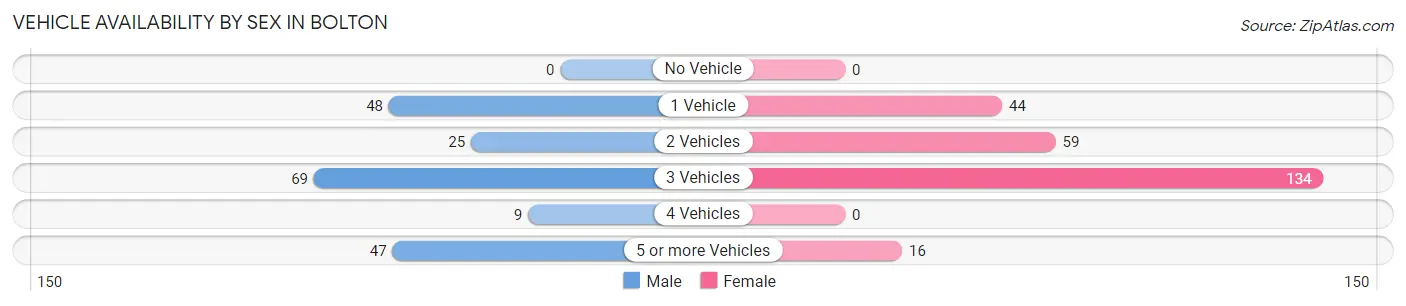
| Vehicles Available | Male | Female |
| No Vehicle | 0 (0.0%) | 0 (0.0%) |
| 1 Vehicle | 48 (24.2%) | 44 (17.4%) |
| 2 Vehicles | 25 (12.6%) | 59 (23.3%) |
| 3 Vehicles | 69 (34.8%) | 134 (53.0%) |
| 4 Vehicles | 9 (4.5%) | 0 (0.0%) |
| 5 or more Vehicles | 47 (23.7%) | 16 (6.3%) |
| Total | 198 (100.0%) | 253 (100.0%) |
Commute Time in Bolton
The most frequently occuring commute durations in Bolton are 30 to 34 minutes (122 commuters, 27.5%), 15 to 19 minutes (85 commuters, 19.2%), and 20 to 24 minutes (65 commuters, 14.7%).
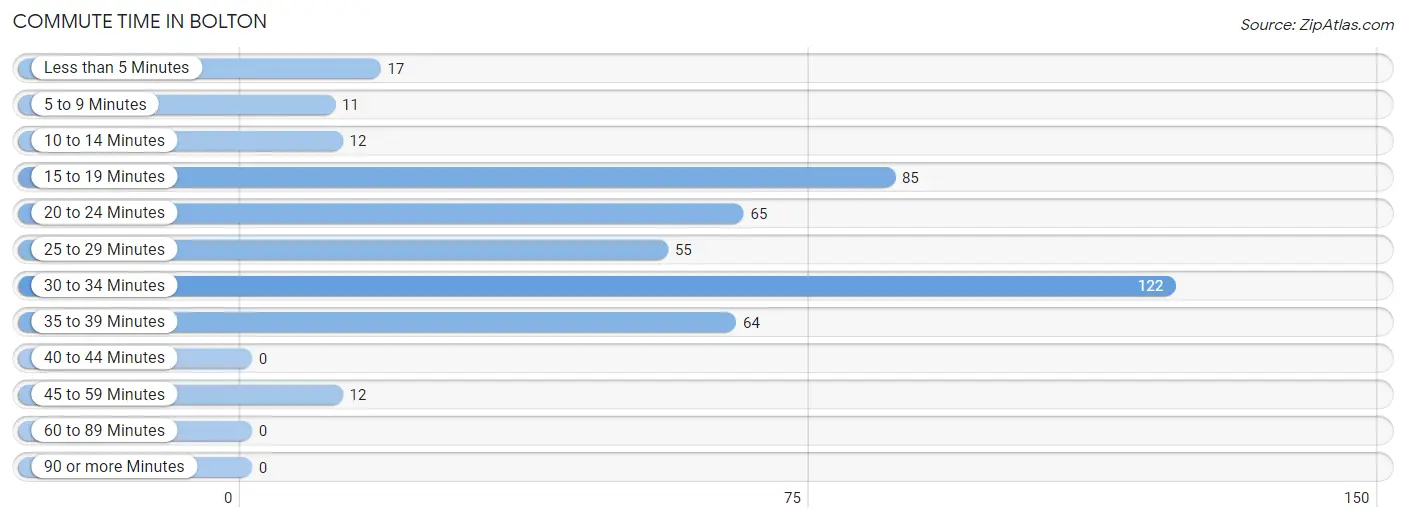
| Commute Time | # Commuters | % Commuters |
| Less than 5 Minutes | 17 | 3.8% |
| 5 to 9 Minutes | 11 | 2.5% |
| 10 to 14 Minutes | 12 | 2.7% |
| 15 to 19 Minutes | 85 | 19.2% |
| 20 to 24 Minutes | 65 | 14.7% |
| 25 to 29 Minutes | 55 | 12.4% |
| 30 to 34 Minutes | 122 | 27.5% |
| 35 to 39 Minutes | 64 | 14.4% |
| 40 to 44 Minutes | 0 | 0.0% |
| 45 to 59 Minutes | 12 | 2.7% |
| 60 to 89 Minutes | 0 | 0.0% |
| 90 or more Minutes | 0 | 0.0% |
Commute Time by Sex in Bolton
The most common commute times in Bolton are 35 to 39 minutes (64 commuters, 33.7%) for males and 30 to 34 minutes (81 commuters, 32.0%) for females.
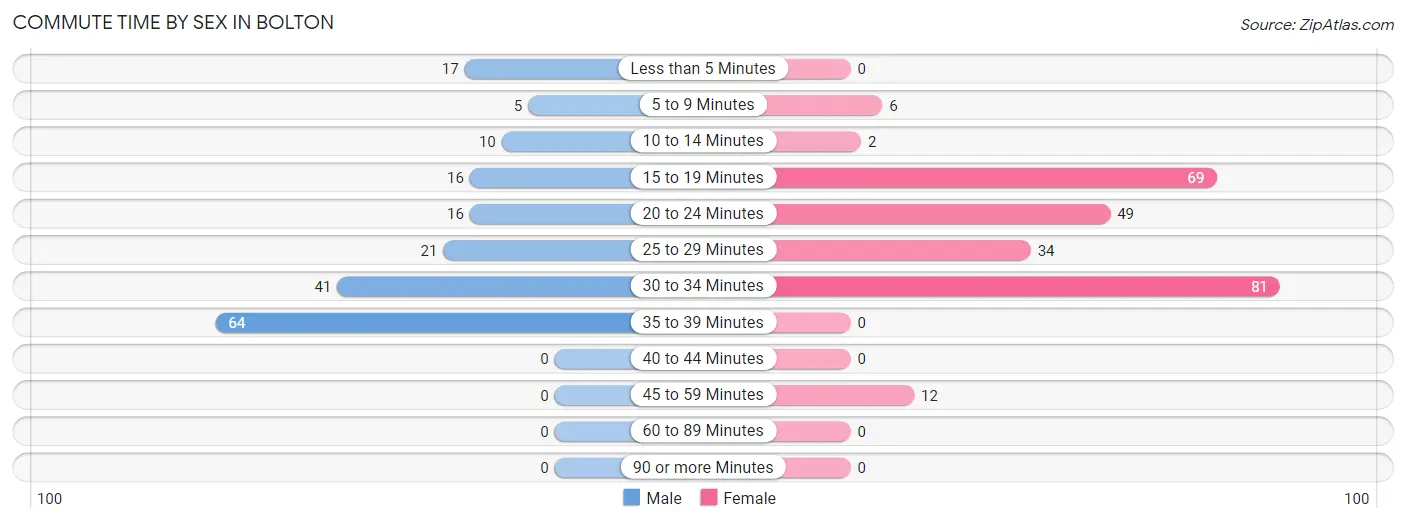
| Commute Time | Male | Female |
| Less than 5 Minutes | 17 (8.9%) | 0 (0.0%) |
| 5 to 9 Minutes | 5 (2.6%) | 6 (2.4%) |
| 10 to 14 Minutes | 10 (5.3%) | 2 (0.8%) |
| 15 to 19 Minutes | 16 (8.4%) | 69 (27.3%) |
| 20 to 24 Minutes | 16 (8.4%) | 49 (19.4%) |
| 25 to 29 Minutes | 21 (11.1%) | 34 (13.4%) |
| 30 to 34 Minutes | 41 (21.6%) | 81 (32.0%) |
| 35 to 39 Minutes | 64 (33.7%) | 0 (0.0%) |
| 40 to 44 Minutes | 0 (0.0%) | 0 (0.0%) |
| 45 to 59 Minutes | 0 (0.0%) | 12 (4.7%) |
| 60 to 89 Minutes | 0 (0.0%) | 0 (0.0%) |
| 90 or more Minutes | 0 (0.0%) | 0 (0.0%) |
Time of Departure to Work by Sex in Bolton
The most frequent times of departure to work in Bolton are 6:30 AM to 6:59 AM (60, 31.6%) for males and 7:30 AM to 7:59 AM (101, 39.9%) for females.
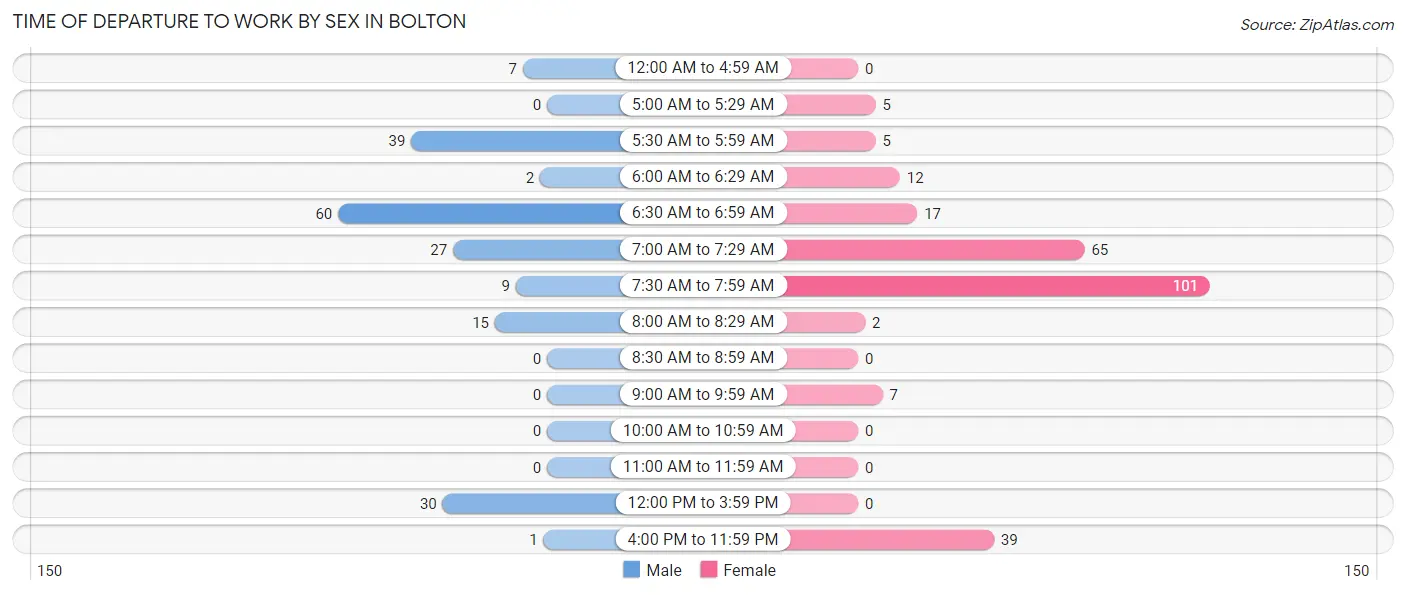
| Time of Departure | Male | Female |
| 12:00 AM to 4:59 AM | 7 (3.7%) | 0 (0.0%) |
| 5:00 AM to 5:29 AM | 0 (0.0%) | 5 (2.0%) |
| 5:30 AM to 5:59 AM | 39 (20.5%) | 5 (2.0%) |
| 6:00 AM to 6:29 AM | 2 (1.1%) | 12 (4.7%) |
| 6:30 AM to 6:59 AM | 60 (31.6%) | 17 (6.7%) |
| 7:00 AM to 7:29 AM | 27 (14.2%) | 65 (25.7%) |
| 7:30 AM to 7:59 AM | 9 (4.7%) | 101 (39.9%) |
| 8:00 AM to 8:29 AM | 15 (7.9%) | 2 (0.8%) |
| 8:30 AM to 8:59 AM | 0 (0.0%) | 0 (0.0%) |
| 9:00 AM to 9:59 AM | 0 (0.0%) | 7 (2.8%) |
| 10:00 AM to 10:59 AM | 0 (0.0%) | 0 (0.0%) |
| 11:00 AM to 11:59 AM | 0 (0.0%) | 0 (0.0%) |
| 12:00 PM to 3:59 PM | 30 (15.8%) | 0 (0.0%) |
| 4:00 PM to 11:59 PM | 1 (0.5%) | 39 (15.4%) |
| Total | 190 (100.0%) | 253 (100.0%) |
Housing Occupancy in Bolton
Occupancy by Ownership in Bolton
Of the total 341 dwellings in Bolton, owner-occupied units account for 257 (75.4%), while renter-occupied units make up 84 (24.6%).
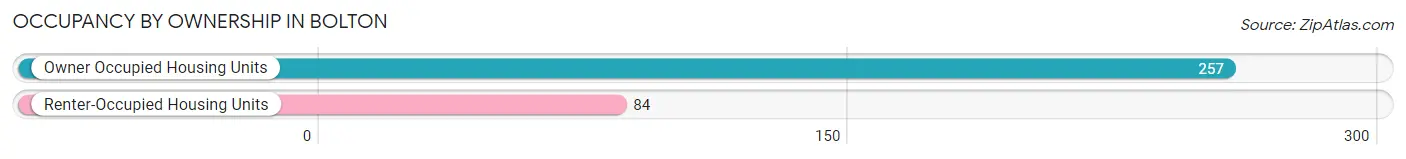
| Occupancy | # Housing Units | % Housing Units |
| Owner Occupied Housing Units | 257 | 75.4% |
| Renter-Occupied Housing Units | 84 | 24.6% |
| Total Occupied Housing Units | 341 | 100.0% |
Occupancy by Household Size in Bolton
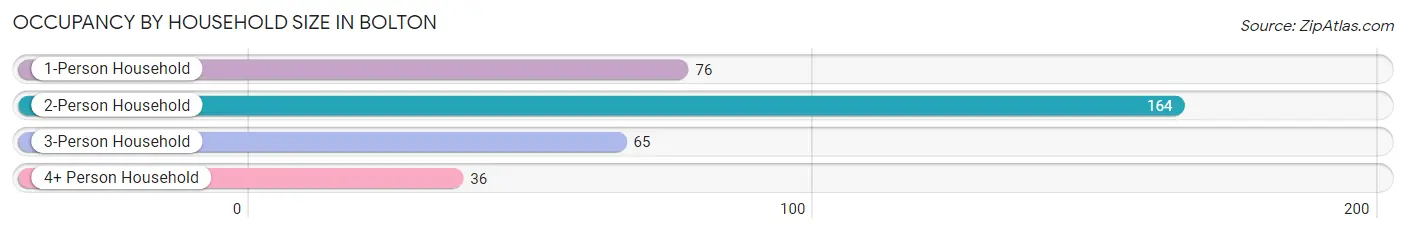
| Household Size | # Housing Units | % Housing Units |
| 1-Person Household | 76 | 22.3% |
| 2-Person Household | 164 | 48.1% |
| 3-Person Household | 65 | 19.1% |
| 4+ Person Household | 36 | 10.6% |
| Total Housing Units | 341 | 100.0% |
Occupancy by Ownership by Household Size in Bolton
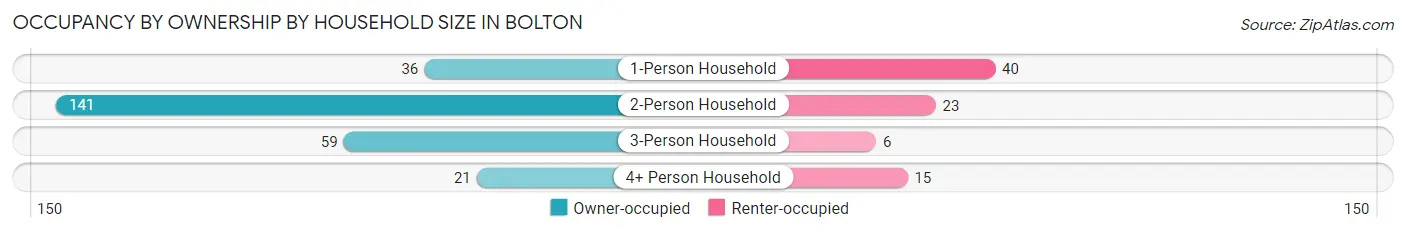
| Household Size | Owner-occupied | Renter-occupied |
| 1-Person Household | 36 (47.4%) | 40 (52.6%) |
| 2-Person Household | 141 (86.0%) | 23 (14.0%) |
| 3-Person Household | 59 (90.8%) | 6 (9.2%) |
| 4+ Person Household | 21 (58.3%) | 15 (41.7%) |
| Total Housing Units | 257 (75.4%) | 84 (24.6%) |
Occupancy by Educational Attainment in Bolton
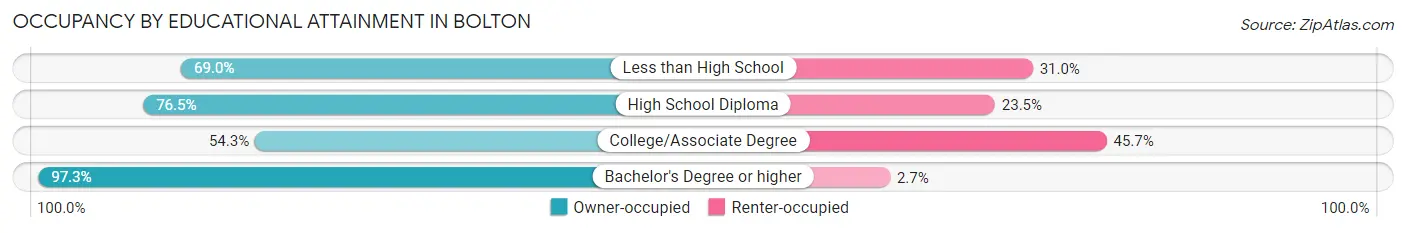
| Household Size | Owner-occupied | Renter-occupied |
| Less than High School | 80 (69.0%) | 36 (31.0%) |
| High School Diploma | 26 (76.5%) | 8 (23.5%) |
| College/Associate Degree | 44 (54.3%) | 37 (45.7%) |
| Bachelor's Degree or higher | 107 (97.3%) | 3 (2.7%) |
Occupancy by Age of Householder in Bolton
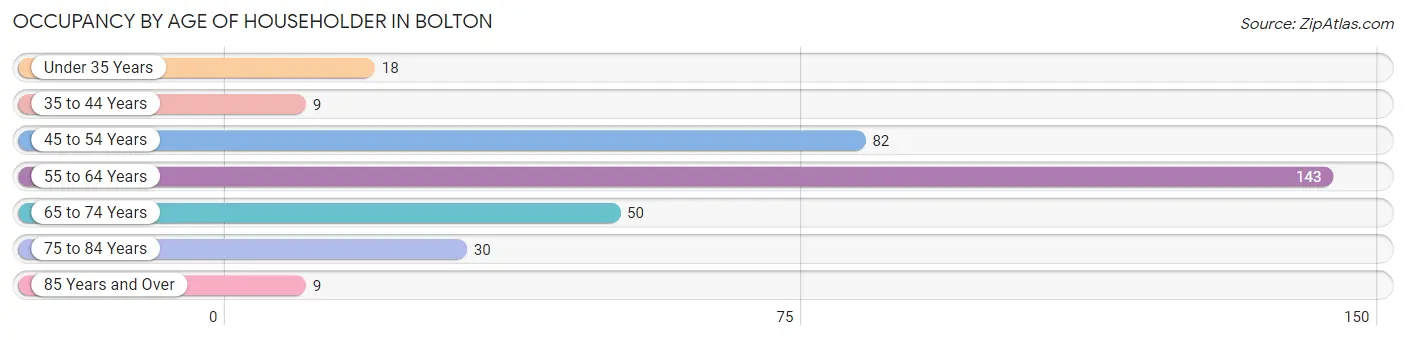
| Age Bracket | # Households | % Households |
| Under 35 Years | 18 | 5.3% |
| 35 to 44 Years | 9 | 2.6% |
| 45 to 54 Years | 82 | 24.0% |
| 55 to 64 Years | 143 | 41.9% |
| 65 to 74 Years | 50 | 14.7% |
| 75 to 84 Years | 30 | 8.8% |
| 85 Years and Over | 9 | 2.6% |
| Total | 341 | 100.0% |
Housing Finances in Bolton
Median Income by Occupancy in Bolton
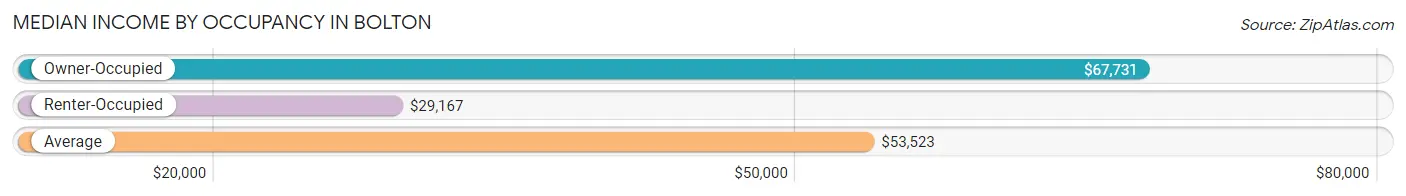
| Occupancy Type | # Households | Median Income |
| Owner-Occupied | 257 (75.4%) | $67,731 |
| Renter-Occupied | 84 (24.6%) | $29,167 |
| Average | 341 (100.0%) | $53,523 |
Occupancy by Householder Income Bracket in Bolton
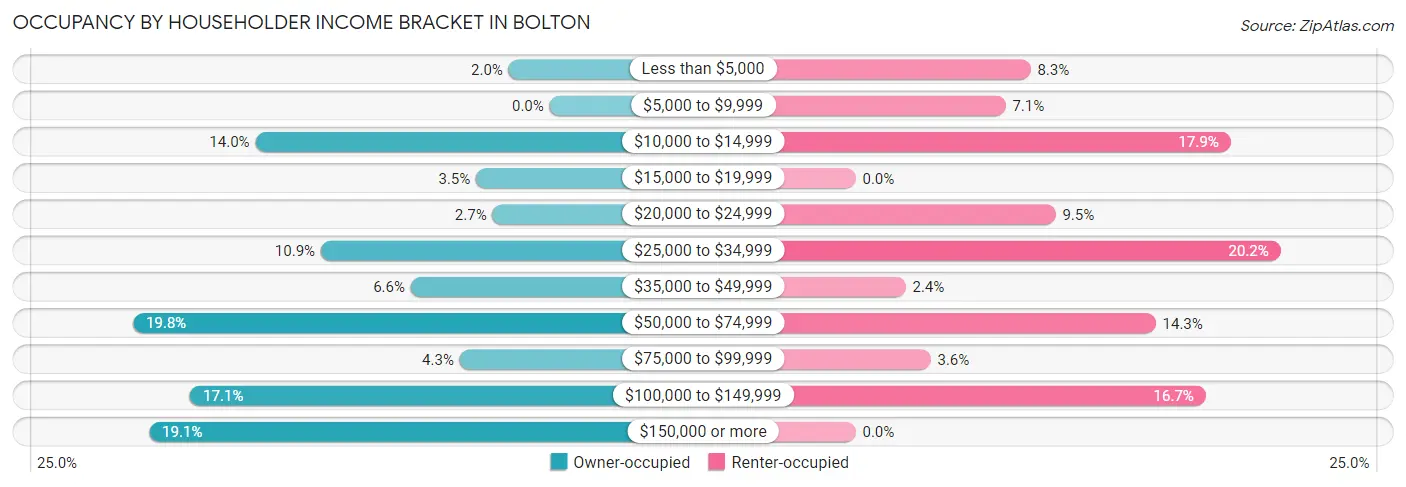
| Income Bracket | Owner-occupied | Renter-occupied |
| Less than $5,000 | 5 (1.9%) | 7 (8.3%) |
| $5,000 to $9,999 | 0 (0.0%) | 6 (7.1%) |
| $10,000 to $14,999 | 36 (14.0%) | 15 (17.9%) |
| $15,000 to $19,999 | 9 (3.5%) | 0 (0.0%) |
| $20,000 to $24,999 | 7 (2.7%) | 8 (9.5%) |
| $25,000 to $34,999 | 28 (10.9%) | 17 (20.2%) |
| $35,000 to $49,999 | 17 (6.6%) | 2 (2.4%) |
| $50,000 to $74,999 | 51 (19.8%) | 12 (14.3%) |
| $75,000 to $99,999 | 11 (4.3%) | 3 (3.6%) |
| $100,000 to $149,999 | 44 (17.1%) | 14 (16.7%) |
| $150,000 or more | 49 (19.1%) | 0 (0.0%) |
| Total | 257 (100.0%) | 84 (100.0%) |
Monthly Housing Cost Tiers in Bolton
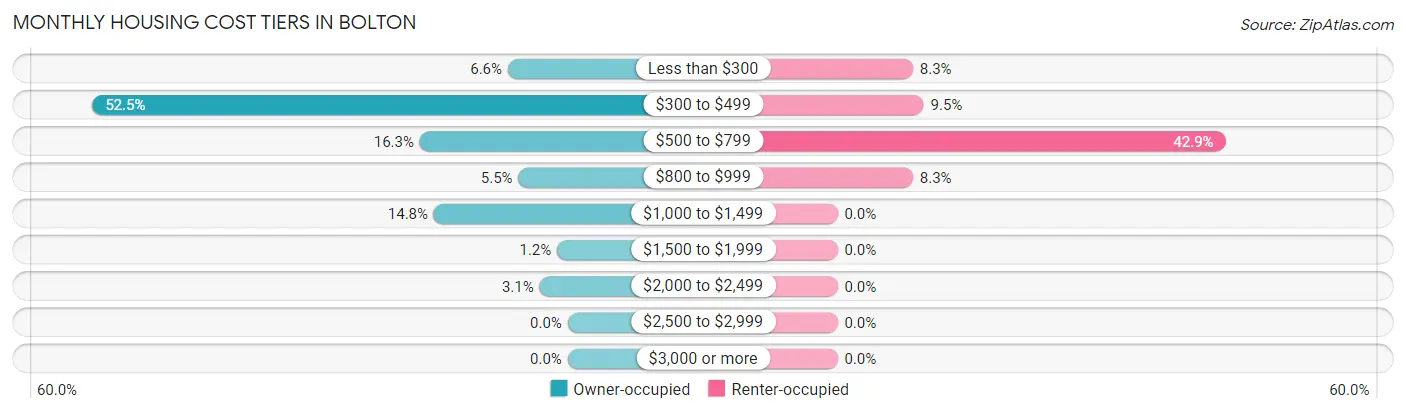
| Monthly Cost | Owner-occupied | Renter-occupied |
| Less than $300 | 17 (6.6%) | 7 (8.3%) |
| $300 to $499 | 135 (52.5%) | 8 (9.5%) |
| $500 to $799 | 42 (16.3%) | 36 (42.9%) |
| $800 to $999 | 14 (5.4%) | 7 (8.3%) |
| $1,000 to $1,499 | 38 (14.8%) | 0 (0.0%) |
| $1,500 to $1,999 | 3 (1.2%) | 0 (0.0%) |
| $2,000 to $2,499 | 8 (3.1%) | 0 (0.0%) |
| $2,500 to $2,999 | 0 (0.0%) | 0 (0.0%) |
| $3,000 or more | 0 (0.0%) | 0 (0.0%) |
| Total | 257 (100.0%) | 84 (100.0%) |
Physical Housing Characteristics in Bolton
Housing Structures in Bolton
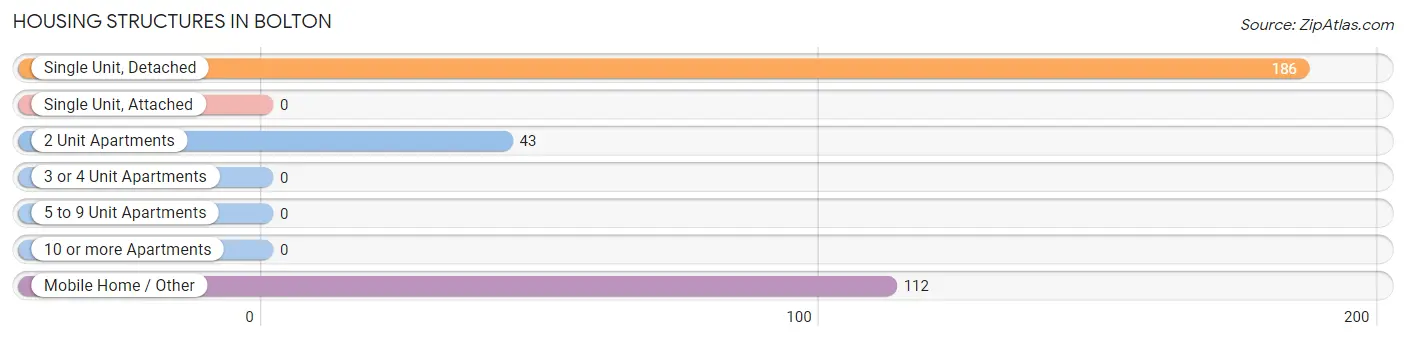
| Structure Type | # Housing Units | % Housing Units |
| Single Unit, Detached | 186 | 54.5% |
| Single Unit, Attached | 0 | 0.0% |
| 2 Unit Apartments | 43 | 12.6% |
| 3 or 4 Unit Apartments | 0 | 0.0% |
| 5 to 9 Unit Apartments | 0 | 0.0% |
| 10 or more Apartments | 0 | 0.0% |
| Mobile Home / Other | 112 | 32.8% |
| Total | 341 | 100.0% |
Housing Structures by Occupancy in Bolton
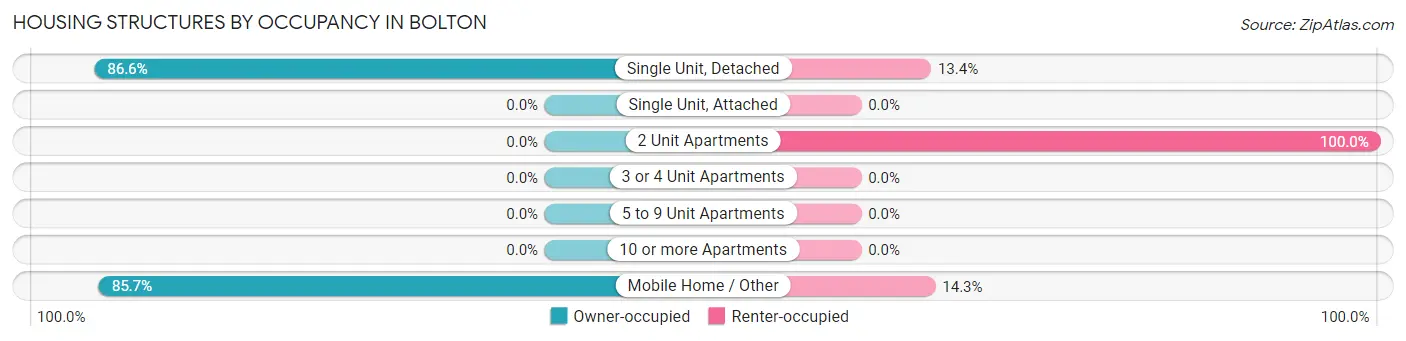
| Structure Type | Owner-occupied | Renter-occupied |
| Single Unit, Detached | 161 (86.6%) | 25 (13.4%) |
| Single Unit, Attached | 0 (0.0%) | 0 (0.0%) |
| 2 Unit Apartments | 0 (0.0%) | 43 (100.0%) |
| 3 or 4 Unit Apartments | 0 (0.0%) | 0 (0.0%) |
| 5 to 9 Unit Apartments | 0 (0.0%) | 0 (0.0%) |
| 10 or more Apartments | 0 (0.0%) | 0 (0.0%) |
| Mobile Home / Other | 96 (85.7%) | 16 (14.3%) |
| Total | 257 (75.4%) | 84 (24.6%) |
Housing Structures by Number of Rooms in Bolton
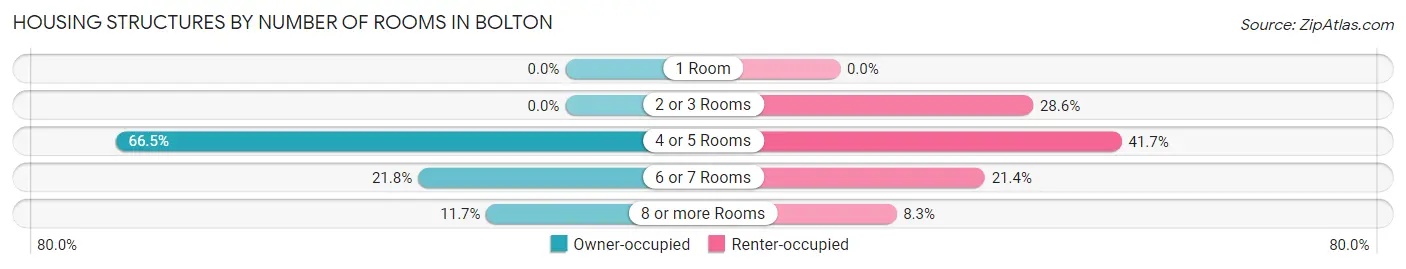
| Number of Rooms | Owner-occupied | Renter-occupied |
| 1 Room | 0 (0.0%) | 0 (0.0%) |
| 2 or 3 Rooms | 0 (0.0%) | 24 (28.6%) |
| 4 or 5 Rooms | 171 (66.5%) | 35 (41.7%) |
| 6 or 7 Rooms | 56 (21.8%) | 18 (21.4%) |
| 8 or more Rooms | 30 (11.7%) | 7 (8.3%) |
| Total | 257 (100.0%) | 84 (100.0%) |
Housing Structure by Heating Type in Bolton
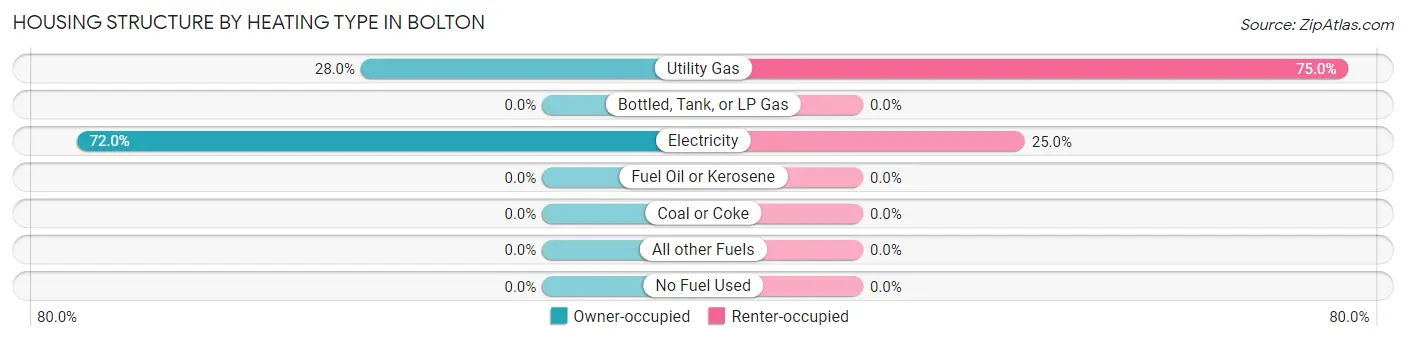
| Heating Type | Owner-occupied | Renter-occupied |
| Utility Gas | 72 (28.0%) | 63 (75.0%) |
| Bottled, Tank, or LP Gas | 0 (0.0%) | 0 (0.0%) |
| Electricity | 185 (72.0%) | 21 (25.0%) |
| Fuel Oil or Kerosene | 0 (0.0%) | 0 (0.0%) |
| Coal or Coke | 0 (0.0%) | 0 (0.0%) |
| All other Fuels | 0 (0.0%) | 0 (0.0%) |
| No Fuel Used | 0 (0.0%) | 0 (0.0%) |
| Total | 257 (100.0%) | 84 (100.0%) |
Household Vehicle Usage in Bolton
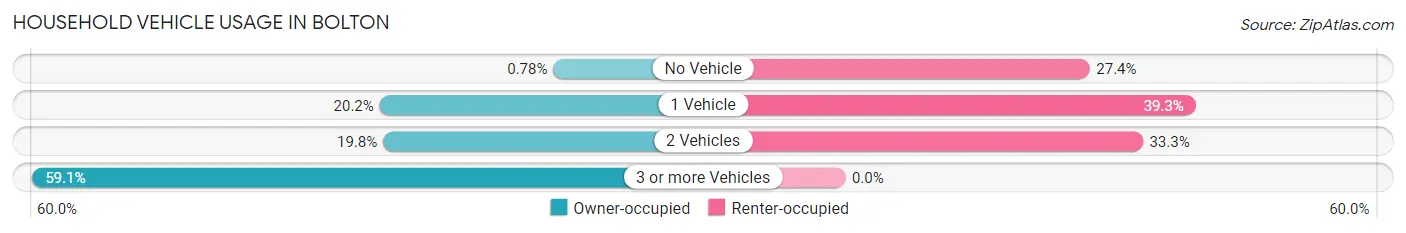
| Vehicles per Household | Owner-occupied | Renter-occupied |
| No Vehicle | 2 (0.8%) | 23 (27.4%) |
| 1 Vehicle | 52 (20.2%) | 33 (39.3%) |
| 2 Vehicles | 51 (19.8%) | 28 (33.3%) |
| 3 or more Vehicles | 152 (59.1%) | 0 (0.0%) |
| Total | 257 (100.0%) | 84 (100.0%) |
Real Estate & Mortgages in Bolton
Real Estate and Mortgage Overview in Bolton
| Characteristic | Without Mortgage | With Mortgage |
| Housing Units | 196 | 61 |
| Median Property Value | - | - |
| Median Household Income | $68,600 | $0 |
| Monthly Housing Costs | $408 | $0 |
| Real Estate Taxes | - | - |
Property Value by Mortgage Status in Bolton
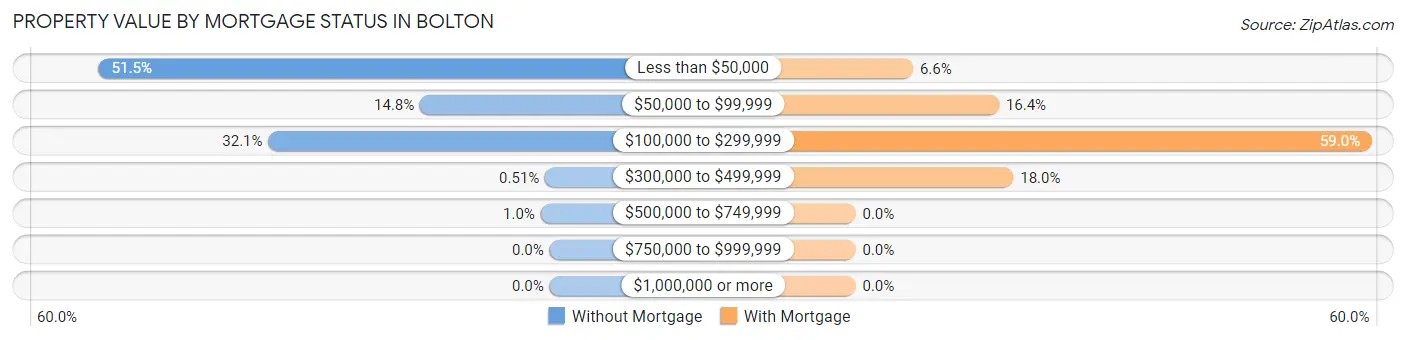
| Property Value | Without Mortgage | With Mortgage |
| Less than $50,000 | 101 (51.5%) | 4 (6.6%) |
| $50,000 to $99,999 | 29 (14.8%) | 10 (16.4%) |
| $100,000 to $299,999 | 63 (32.1%) | 36 (59.0%) |
| $300,000 to $499,999 | 1 (0.5%) | 11 (18.0%) |
| $500,000 to $749,999 | 2 (1.0%) | 0 (0.0%) |
| $750,000 to $999,999 | 0 (0.0%) | 0 (0.0%) |
| $1,000,000 or more | 0 (0.0%) | 0 (0.0%) |
| Total | 196 (100.0%) | 61 (100.0%) |
Household Income by Mortgage Status in Bolton
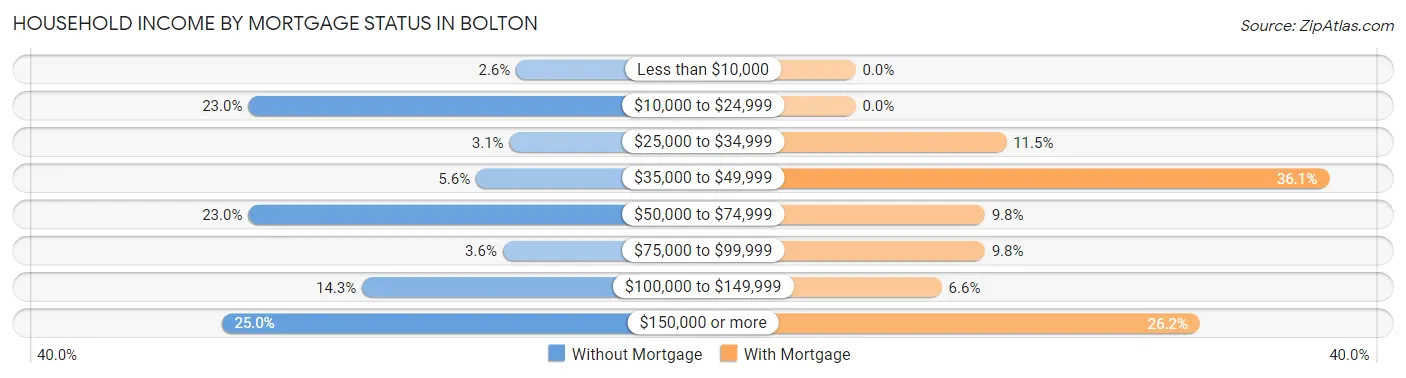
| Household Income | Without Mortgage | With Mortgage |
| Less than $10,000 | 5 (2.5%) | 0 (0.0%) |
| $10,000 to $24,999 | 45 (23.0%) | 0 (0.0%) |
| $25,000 to $34,999 | 6 (3.1%) | 7 (11.5%) |
| $35,000 to $49,999 | 11 (5.6%) | 22 (36.1%) |
| $50,000 to $74,999 | 45 (23.0%) | 6 (9.8%) |
| $75,000 to $99,999 | 7 (3.6%) | 6 (9.8%) |
| $100,000 to $149,999 | 28 (14.3%) | 4 (6.6%) |
| $150,000 or more | 49 (25.0%) | 16 (26.2%) |
| Total | 196 (100.0%) | 61 (100.0%) |
Property Value to Household Income Ratio in Bolton
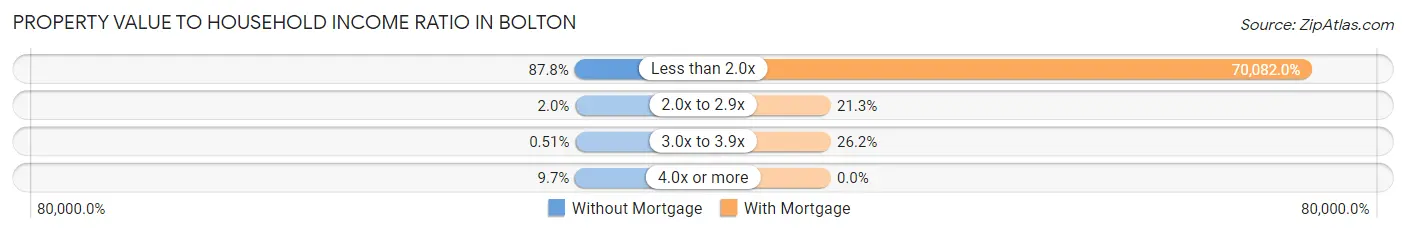
| Value-to-Income Ratio | Without Mortgage | With Mortgage |
| Less than 2.0x | 172 (87.8%) | 42,750 (70,082.0%) |
| 2.0x to 2.9x | 4 (2.0%) | 13 (21.3%) |
| 3.0x to 3.9x | 1 (0.5%) | 16 (26.2%) |
| 4.0x or more | 19 (9.7%) | 0 (0.0%) |
| Total | 196 (100.0%) | 61 (100.0%) |
Real Estate Taxes by Mortgage Status in Bolton
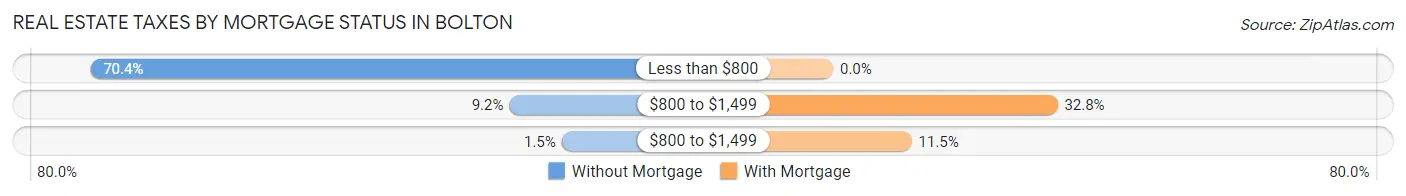
| Property Taxes | Without Mortgage | With Mortgage |
| Less than $800 | 138 (70.4%) | 0 (0.0%) |
| $800 to $1,499 | 18 (9.2%) | 20 (32.8%) |
| $800 to $1,499 | 3 (1.5%) | 7 (11.5%) |
| Total | 196 (100.0%) | 61 (100.0%) |
Health & Disability in Bolton
Health Insurance Coverage by Age in Bolton
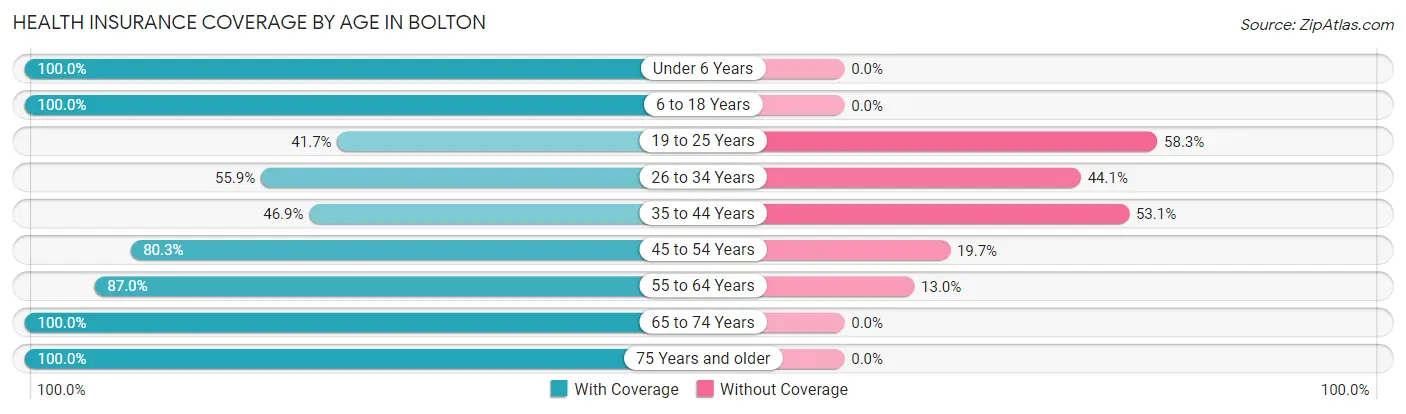
| Age Bracket | With Coverage | Without Coverage |
| Under 6 Years | 57 (100.0%) | 0 (0.0%) |
| 6 to 18 Years | 99 (100.0%) | 0 (0.0%) |
| 19 to 25 Years | 35 (41.7%) | 49 (58.3%) |
| 26 to 34 Years | 52 (55.9%) | 41 (44.1%) |
| 35 to 44 Years | 76 (46.9%) | 86 (53.1%) |
| 45 to 54 Years | 106 (80.3%) | 26 (19.7%) |
| 55 to 64 Years | 147 (87.0%) | 22 (13.0%) |
| 65 to 74 Years | 72 (100.0%) | 0 (0.0%) |
| 75 Years and older | 68 (100.0%) | 0 (0.0%) |
| Total | 712 (76.1%) | 224 (23.9%) |
Health Insurance Coverage by Citizenship Status in Bolton
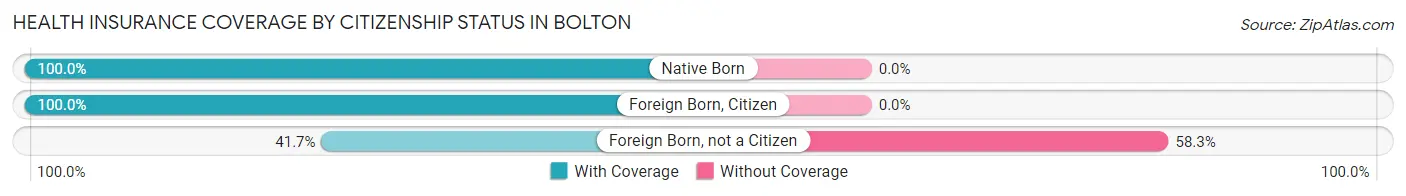
| Citizenship Status | With Coverage | Without Coverage |
| Native Born | 57 (100.0%) | 0 (0.0%) |
| Foreign Born, Citizen | 99 (100.0%) | 0 (0.0%) |
| Foreign Born, not a Citizen | 35 (41.7%) | 49 (58.3%) |
Health Insurance Coverage by Household Income in Bolton
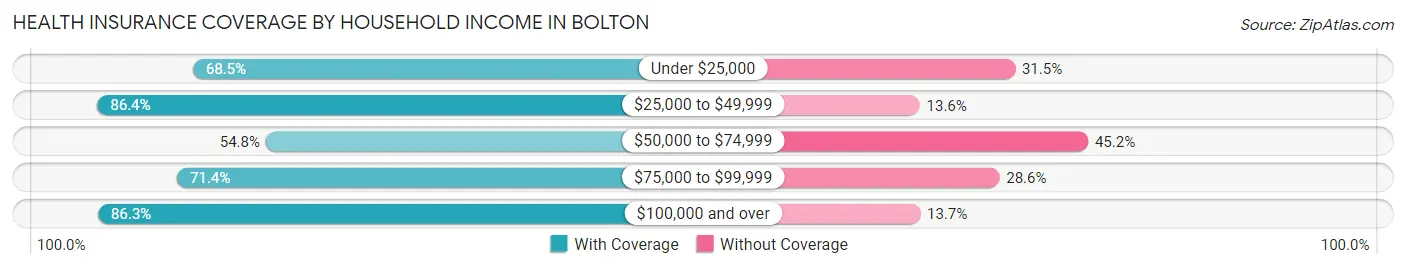
| Household Income | With Coverage | Without Coverage |
| Under $25,000 | 100 (68.5%) | 46 (31.5%) |
| $25,000 to $49,999 | 114 (86.4%) | 18 (13.6%) |
| $50,000 to $74,999 | 114 (54.8%) | 94 (45.2%) |
| $75,000 to $99,999 | 20 (71.4%) | 8 (28.6%) |
| $100,000 and over | 364 (86.3%) | 58 (13.7%) |
Public vs Private Health Insurance Coverage by Age in Bolton
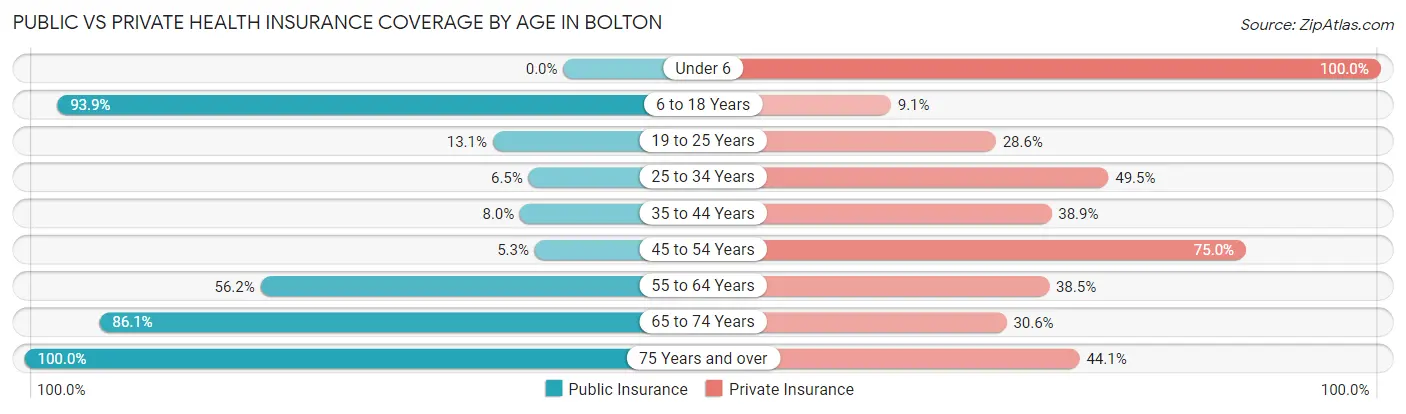
| Age Bracket | Public Insurance | Private Insurance |
| Under 6 | 0 (0.0%) | 57 (100.0%) |
| 6 to 18 Years | 93 (93.9%) | 9 (9.1%) |
| 19 to 25 Years | 11 (13.1%) | 24 (28.6%) |
| 25 to 34 Years | 6 (6.5%) | 46 (49.5%) |
| 35 to 44 Years | 13 (8.0%) | 63 (38.9%) |
| 45 to 54 Years | 7 (5.3%) | 99 (75.0%) |
| 55 to 64 Years | 95 (56.2%) | 65 (38.5%) |
| 65 to 74 Years | 62 (86.1%) | 22 (30.6%) |
| 75 Years and over | 68 (100.0%) | 30 (44.1%) |
| Total | 355 (37.9%) | 415 (44.3%) |
Disability Status by Sex by Age in Bolton
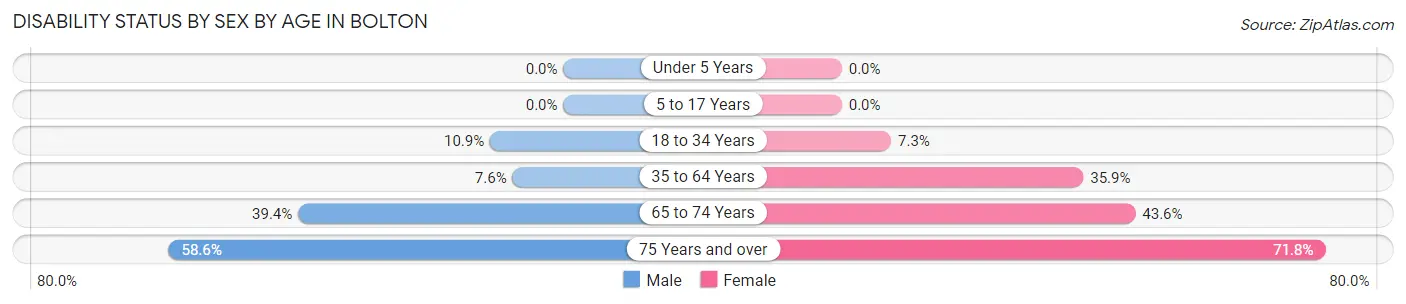
| Age Bracket | Male | Female |
| Under 5 Years | 0 (0.0%) | 0 (0.0%) |
| 5 to 17 Years | 0 (0.0%) | 0 (0.0%) |
| 18 to 34 Years | 11 (10.9%) | 6 (7.3%) |
| 35 to 64 Years | 16 (7.5%) | 90 (35.9%) |
| 65 to 74 Years | 13 (39.4%) | 17 (43.6%) |
| 75 Years and over | 17 (58.6%) | 28 (71.8%) |
Disability Class by Sex by Age in Bolton
Disability Class: Hearing Difficulty
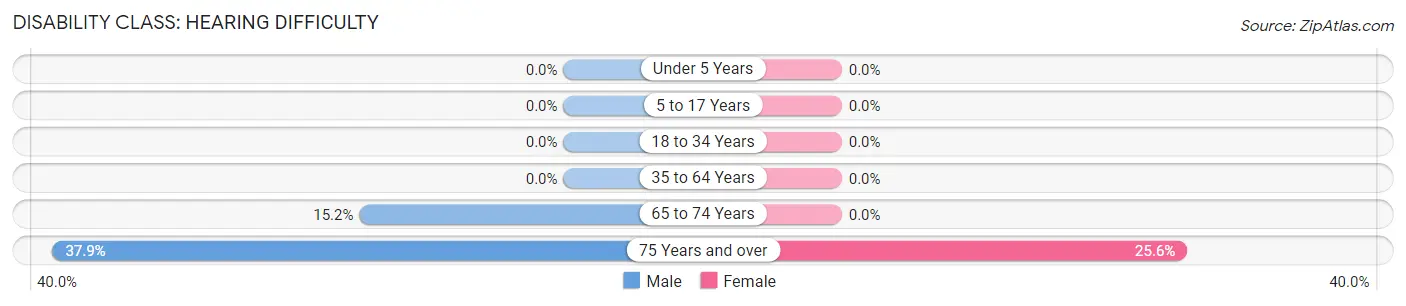
| Age Bracket | Male | Female |
| Under 5 Years | 0 (0.0%) | 0 (0.0%) |
| 5 to 17 Years | 0 (0.0%) | 0 (0.0%) |
| 18 to 34 Years | 0 (0.0%) | 0 (0.0%) |
| 35 to 64 Years | 0 (0.0%) | 0 (0.0%) |
| 65 to 74 Years | 5 (15.1%) | 0 (0.0%) |
| 75 Years and over | 11 (37.9%) | 10 (25.6%) |
Disability Class: Vision Difficulty
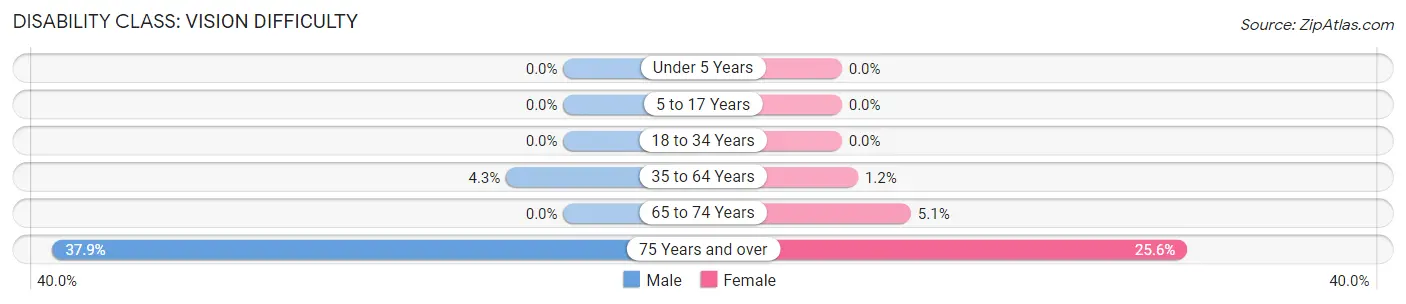
| Age Bracket | Male | Female |
| Under 5 Years | 0 (0.0%) | 0 (0.0%) |
| 5 to 17 Years | 0 (0.0%) | 0 (0.0%) |
| 18 to 34 Years | 0 (0.0%) | 0 (0.0%) |
| 35 to 64 Years | 9 (4.3%) | 3 (1.2%) |
| 65 to 74 Years | 0 (0.0%) | 2 (5.1%) |
| 75 Years and over | 11 (37.9%) | 10 (25.6%) |
Disability Class: Cognitive Difficulty
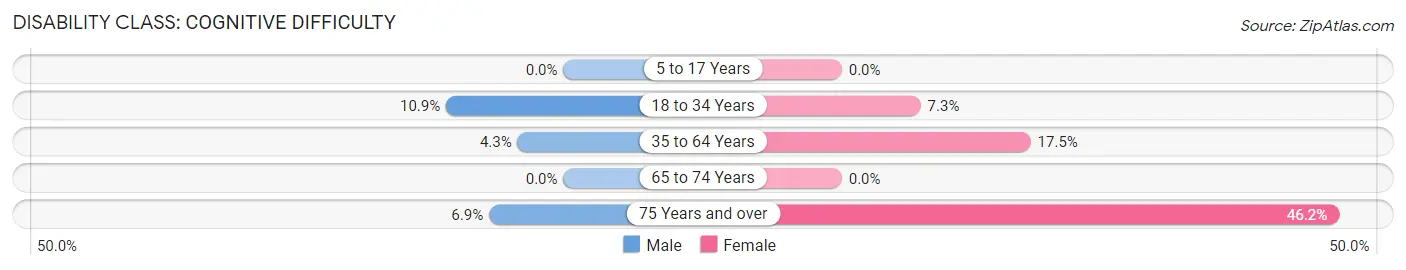
| Age Bracket | Male | Female |
| 5 to 17 Years | 0 (0.0%) | 0 (0.0%) |
| 18 to 34 Years | 11 (10.9%) | 6 (7.3%) |
| 35 to 64 Years | 9 (4.3%) | 44 (17.5%) |
| 65 to 74 Years | 0 (0.0%) | 0 (0.0%) |
| 75 Years and over | 2 (6.9%) | 18 (46.2%) |
Disability Class: Ambulatory Difficulty
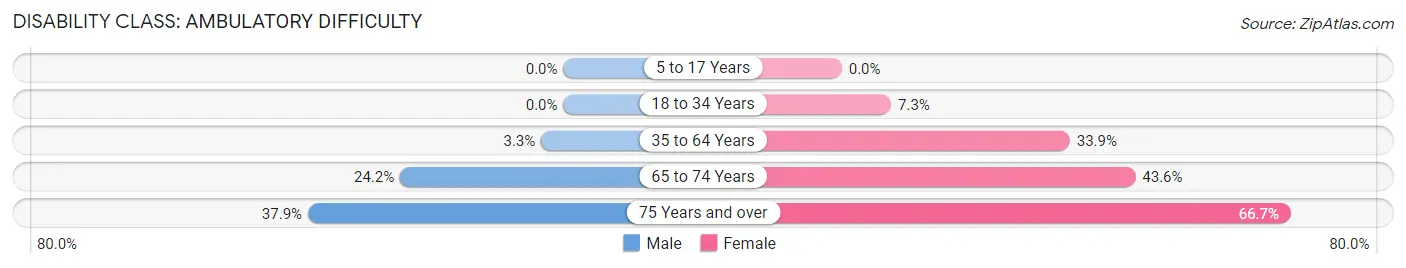
| Age Bracket | Male | Female |
| 5 to 17 Years | 0 (0.0%) | 0 (0.0%) |
| 18 to 34 Years | 0 (0.0%) | 6 (7.3%) |
| 35 to 64 Years | 7 (3.3%) | 85 (33.9%) |
| 65 to 74 Years | 8 (24.2%) | 17 (43.6%) |
| 75 Years and over | 11 (37.9%) | 26 (66.7%) |
Disability Class: Self-Care Difficulty
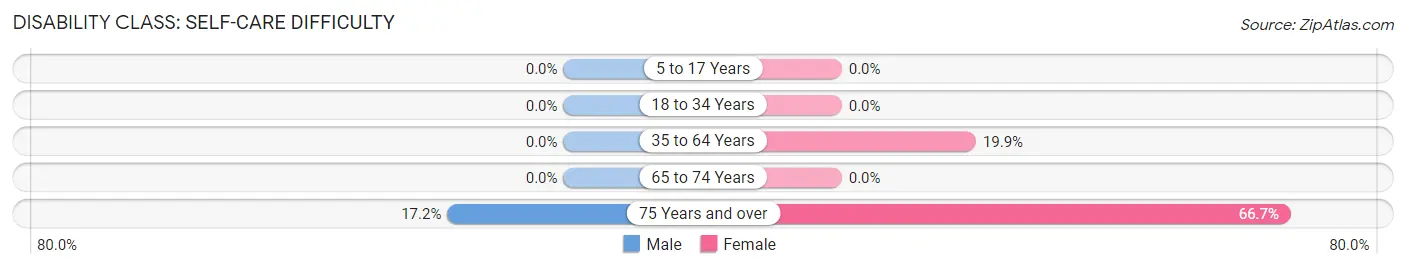
| Age Bracket | Male | Female |
| 5 to 17 Years | 0 (0.0%) | 0 (0.0%) |
| 18 to 34 Years | 0 (0.0%) | 0 (0.0%) |
| 35 to 64 Years | 0 (0.0%) | 50 (19.9%) |
| 65 to 74 Years | 0 (0.0%) | 0 (0.0%) |
| 75 Years and over | 5 (17.2%) | 26 (66.7%) |
Technology Access in Bolton
Computing Device Access in Bolton
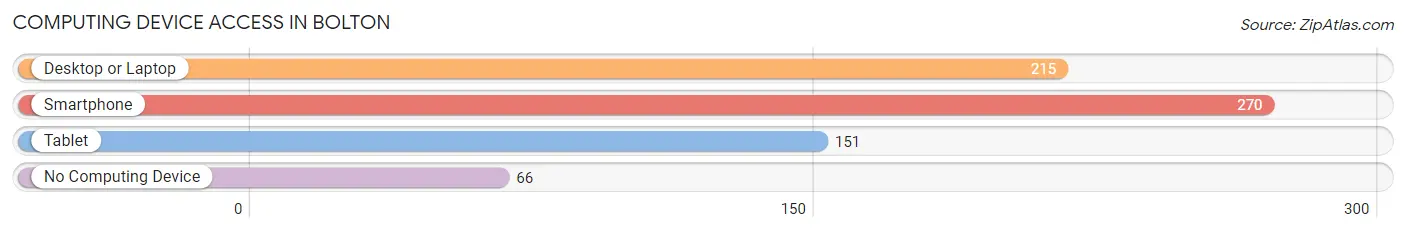
| Device Type | # Households | % Households |
| Desktop or Laptop | 215 | 63.0% |
| Smartphone | 270 | 79.2% |
| Tablet | 151 | 44.3% |
| No Computing Device | 66 | 19.4% |
| Total | 341 | 100.0% |
Internet Access in Bolton
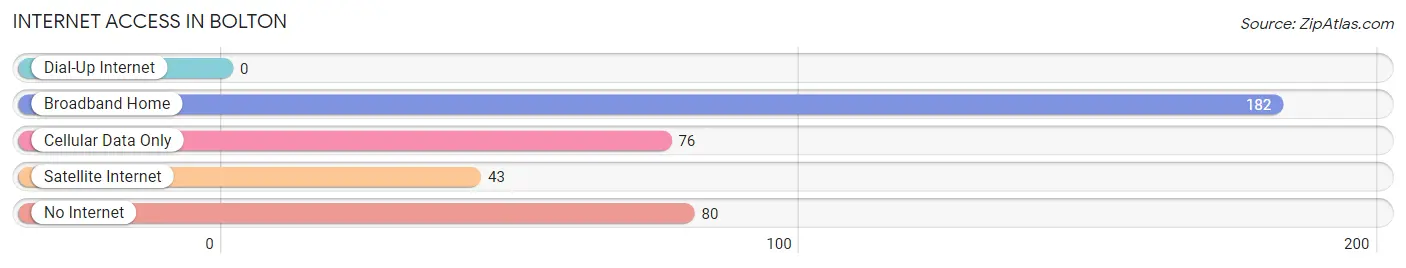
| Internet Type | # Households | % Households |
| Dial-Up Internet | 0 | 0.0% |
| Broadband Home | 182 | 53.4% |
| Cellular Data Only | 76 | 22.3% |
| Satellite Internet | 43 | 12.6% |
| No Internet | 80 | 23.5% |
| Total | 341 | 100.0% |
Bolton Summary
Bolton is a small town located in Hinds County, Mississippi, United States. It is situated approximately 20 miles north of Jackson, the state capital. The town was founded in 1837 and is named after the Bolton family, who were among the first settlers in the area. As of the 2010 census, the population of Bolton was 1,845.
History
The area that is now Bolton was first settled in the early 1800s by the Bolton family, who were among the first settlers in the area. The town was officially founded in 1837 and was named after the Bolton family. The town was originally a farming community, but it soon developed into a small trading center. In the late 1800s, the town was home to several stores, a post office, a blacksmith shop, and a cotton gin.
In the early 1900s, the town began to grow and develop. The first school was built in 1906, and the first bank opened in 1908. The town also had a newspaper, the Bolton Herald, which was published from 1909 to 1915.
In the 1920s, the town experienced a period of growth and development. The first telephone service was established in 1921, and the first electric service was established in 1923. The town also had a movie theater, a hotel, and a number of other businesses.
In the 1950s, the town experienced a period of decline. Many of the businesses closed, and the population began to decline. In the 1970s, the town began to experience a period of revitalization. The town was designated as a Main Street Community in 1979, and the downtown area was renovated.
Geography
Bolton is located in Hinds County, Mississippi, approximately 20 miles north of Jackson, the state capital. The town is situated at the intersection of U.S. Route 51 and Mississippi Highway 18. The town is located in the Yazoo-Mississippi Delta region of the state.
The town has a total area of 1.3 square miles, all of which is land. The town is located in a flat, low-lying area, and the elevation is approximately 200 feet above sea level.
Economy
The economy of Bolton is largely based on agriculture. The town is home to several farms, and the surrounding area is used for growing cotton, soybeans, corn, and other crops. The town is also home to several small businesses, including restaurants, retail stores, and service providers.
Demographics
As of the 2010 census, the population of Bolton was 1,845. The racial makeup of the town was 79.3% White, 19.2% African American, 0.2% Native American, 0.2% Asian, 0.1% Pacific Islander, 0.2% from other races, and 0.9% from two or more races. Hispanic or Latino of any race were 1.2% of the population.
The median household income in Bolton was $31,250, and the median family income was $37,500. The per capita income was $15,945. About 18.2% of the population was below the poverty line.
Common Questions
What is the Total Population of Bolton?
Total Population of Bolton is 936.
What is the Total Male Population of Bolton?
Total Male Population of Bolton is 508.
What is the Total Female Population of Bolton?
Total Female Population of Bolton is 428.
What is the Ratio of Males per 100 Females in Bolton?
There are 118.69 Males per 100 Females in Bolton.
What is the Ratio of Females per 100 Males in Bolton?
There are 84.25 Females per 100 Males in Bolton.
What is the Median Population Age in Bolton?
Median Population Age in Bolton is 44.4 Years.
What is the Average Family Size in Bolton
Average Family Size in Bolton is 3.2 People.
What is the Average Household Size in Bolton
Average Household Size in Bolton is 2.7 People.
What is Per Capita Income in Bolton?
Per Capita income in Bolton is $26,535.
What is the Median Family Income in Bolton?
Median Family Income in Bolton is $68,148.
What is the Median Household income in Bolton?
Median Household Income in Bolton is $53,523.
What is Inequality or Gini Index in Bolton?
Inequality or Gini Index in Bolton is 0.43.
How Large is the Labor Force in Bolton?
There are 557 People in the Labor Forcein in Bolton.
What is the Percentage of People in the Labor Force in Bolton?
70.9% of People are in the Labor Force in Bolton.
What is the Unemployment Rate in Bolton?
Unemployment Rate in Bolton is 2.2%.