New Hope, MS
New Hope Map
New Hope Overview
2,983
TOTAL POPULATION
1,524
MALE POPULATION
1,459
FEMALE POPULATION
104.46
MALES / 100 FEMALES
95.73
FEMALES / 100 MALES
37.6
MEDIAN AGE
3.3
AVG FAMILY SIZE
2.8
AVG HOUSEHOLD SIZE
$36,150
PER CAPITA INCOME
$88,125
AVG FAMILY INCOME
$76,149
AVG HOUSEHOLD INCOME
27.6%
WAGE / INCOME GAP [ % ]
72.4¢/ $1
WAGE / INCOME GAP [ $ ]
0.40
INEQUALITY / GINI INDEX
1,497
LABOR FORCE [ PEOPLE ]
67.5%
PERCENT IN LABOR FORCE
1.1%
UNEMPLOYMENT RATE
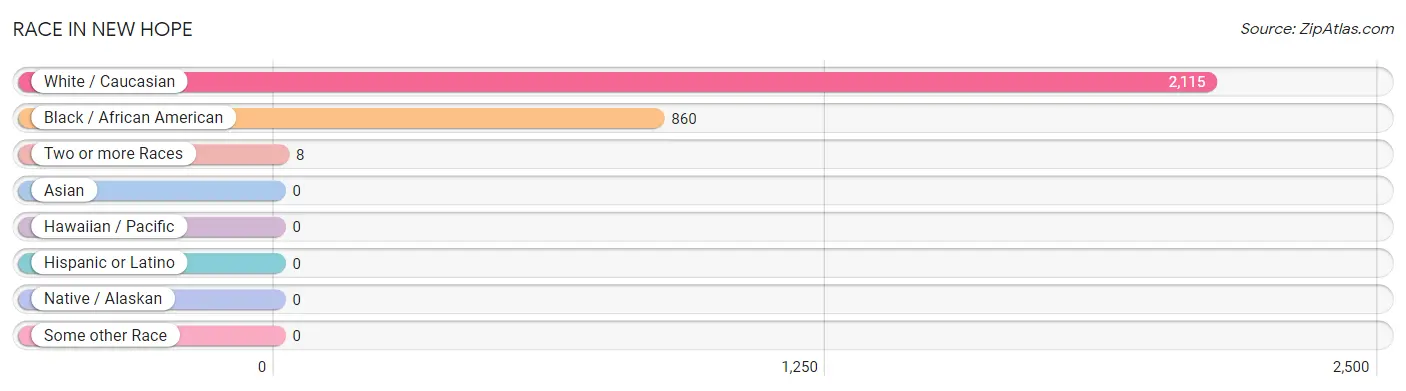
Race in New Hope
The most populous races in New Hope are White / Caucasian (2,115 | 70.9%), Black / African American (860 | 28.8%), and Two or more Races (8 | 0.3%).
| Race | # Population | % Population |
| Asian | 0 | 0.0% |
| Black / African American | 860 | 28.8% |
| Hawaiian / Pacific | 0 | 0.0% |
| Hispanic or Latino | 0 | 0.0% |
| Native / Alaskan | 0 | 0.0% |
| White / Caucasian | 2,115 | 70.9% |
| Two or more Races | 8 | 0.3% |
| Some other Race | 0 | 0.0% |
| Total | 2,983 | 100.0% |
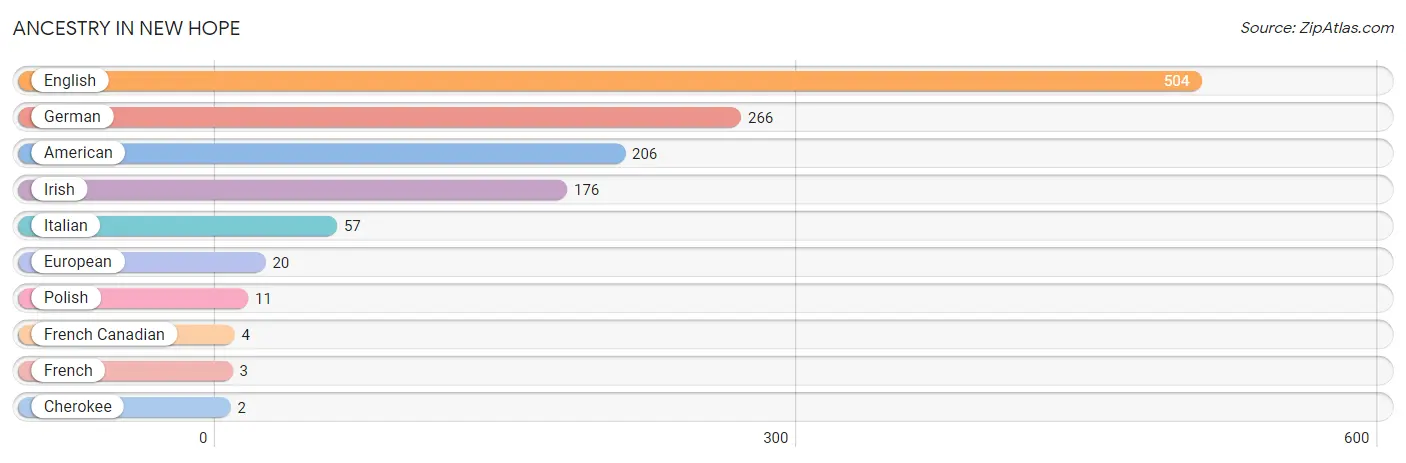
Ancestry in New Hope
The most populous ancestries reported in New Hope are English (504 | 16.9%), German (266 | 8.9%), American (206 | 6.9%), Irish (176 | 5.9%), and Italian (57 | 1.9%), together accounting for 40.5% of all New Hope residents.
| Ancestry | # Population | % Population |
| American | 206 | 6.9% |
| Cherokee | 2 | 0.1% |
| English | 504 | 16.9% |
| European | 20 | 0.7% |
| French | 3 | 0.1% |
| French Canadian | 4 | 0.1% |
| German | 266 | 8.9% |
| Irish | 176 | 5.9% |
| Italian | 57 | 1.9% |
| Polish | 11 | 0.4% | View All 10 Rows |
Immigrants in New Hope

| Immigration Origin | # Population | % Population | View All 0 Rows |
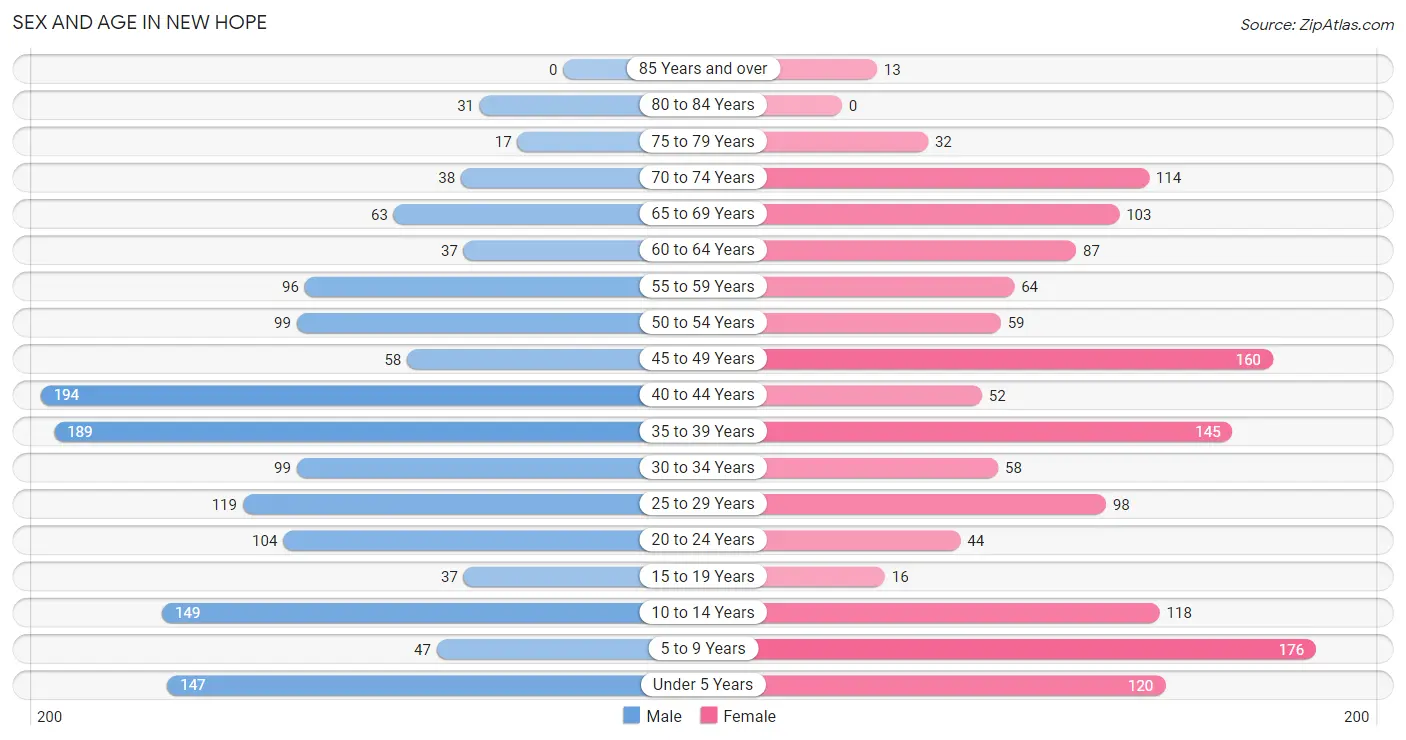
Sex and Age in New Hope
Sex and Age in New Hope
The most populous age groups in New Hope are 40 to 44 Years (194 | 12.7%) for men and 5 to 9 Years (176 | 12.1%) for women.
| Age Bracket | Male | Female |
| Under 5 Years | 147 (9.7%) | 120 (8.2%) |
| 5 to 9 Years | 47 (3.1%) | 176 (12.1%) |
| 10 to 14 Years | 149 (9.8%) | 118 (8.1%) |
| 15 to 19 Years | 37 (2.4%) | 16 (1.1%) |
| 20 to 24 Years | 104 (6.8%) | 44 (3.0%) |
| 25 to 29 Years | 119 (7.8%) | 98 (6.7%) |
| 30 to 34 Years | 99 (6.5%) | 58 (4.0%) |
| 35 to 39 Years | 189 (12.4%) | 145 (9.9%) |
| 40 to 44 Years | 194 (12.7%) | 52 (3.6%) |
| 45 to 49 Years | 58 (3.8%) | 160 (11.0%) |
| 50 to 54 Years | 99 (6.5%) | 59 (4.0%) |
| 55 to 59 Years | 96 (6.3%) | 64 (4.4%) |
| 60 to 64 Years | 37 (2.4%) | 87 (6.0%) |
| 65 to 69 Years | 63 (4.1%) | 103 (7.1%) |
| 70 to 74 Years | 38 (2.5%) | 114 (7.8%) |
| 75 to 79 Years | 17 (1.1%) | 32 (2.2%) |
| 80 to 84 Years | 31 (2.0%) | 0 (0.0%) |
| 85 Years and over | 0 (0.0%) | 13 (0.9%) |
| Total | 1,524 (100.0%) | 1,459 (100.0%) |
Families and Households in New Hope
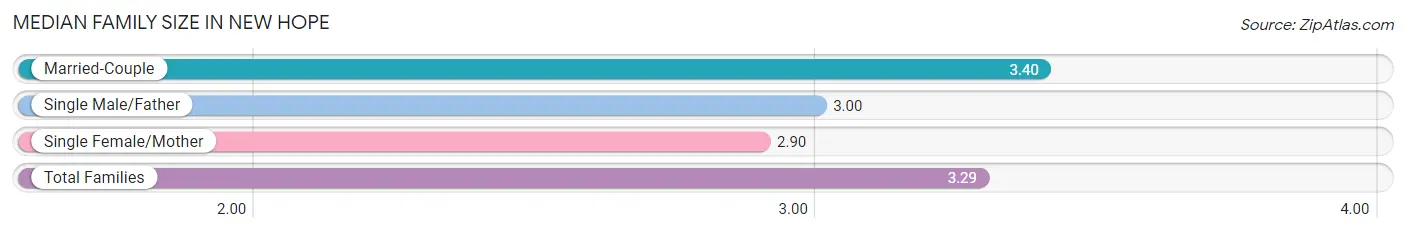
Median Family Size in New Hope
The median family size in New Hope is 3.29 persons per family, with married-couple families (628 | 76.3%) accounting for the largest median family size of 3.4 persons per family. On the other hand, single female/mother families (115 | 14.0%) represent the smallest median family size with 2.90 persons per family.
| Family Type | # Families | Family Size |
| Married-Couple | 628 (76.3%) | 3.40 |
| Single Male/Father | 80 (9.7%) | 3.00 |
| Single Female/Mother | 115 (14.0%) | 2.90 |
| Total Families | 823 (100.0%) | 3.29 |
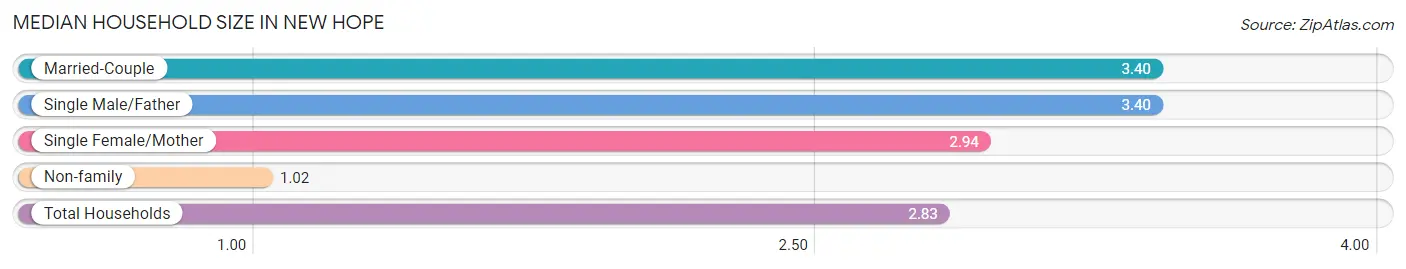
Median Household Size in New Hope
The median household size in New Hope is 2.83 persons per household, with married-couple households (628 | 59.7%) accounting for the largest median household size of 3.4 persons per household. non-family households (229 | 21.8%) represent the smallest median household size with 1.02 persons per household.
| Household Type | # Households | Household Size |
| Married-Couple | 628 (59.7%) | 3.40 |
| Single Male/Father | 80 (7.6%) | 3.40 |
| Single Female/Mother | 115 (10.9%) | 2.94 |
| Non-family | 229 (21.8%) | 1.02 |
| Total Households | 1,052 (100.0%) | 2.83 |
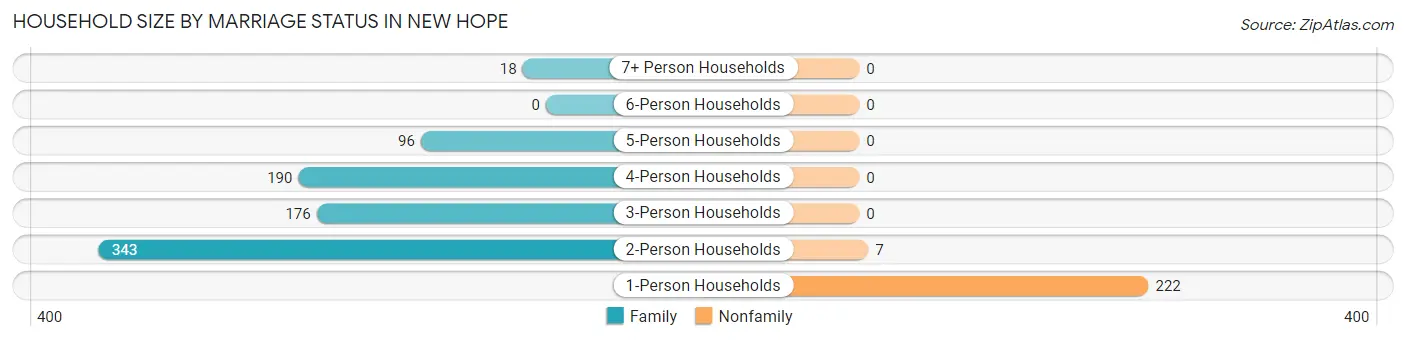
Household Size by Marriage Status in New Hope
Out of a total of 1,052 households in New Hope, 823 (78.2%) are family households, while 229 (21.8%) are nonfamily households. The most numerous type of family households are 2-person households, comprising 343, and the most common type of nonfamily households are 1-person households, comprising 222.
| Household Size | Family Households | Nonfamily Households |
| 1-Person Households | - | 222 (21.1%) |
| 2-Person Households | 343 (32.6%) | 7 (0.7%) |
| 3-Person Households | 176 (16.7%) | 0 (0.0%) |
| 4-Person Households | 190 (18.1%) | 0 (0.0%) |
| 5-Person Households | 96 (9.1%) | 0 (0.0%) |
| 6-Person Households | 0 (0.0%) | 0 (0.0%) |
| 7+ Person Households | 18 (1.7%) | 0 (0.0%) |
| Total | 823 (78.2%) | 229 (21.8%) |
Female Fertility in New Hope
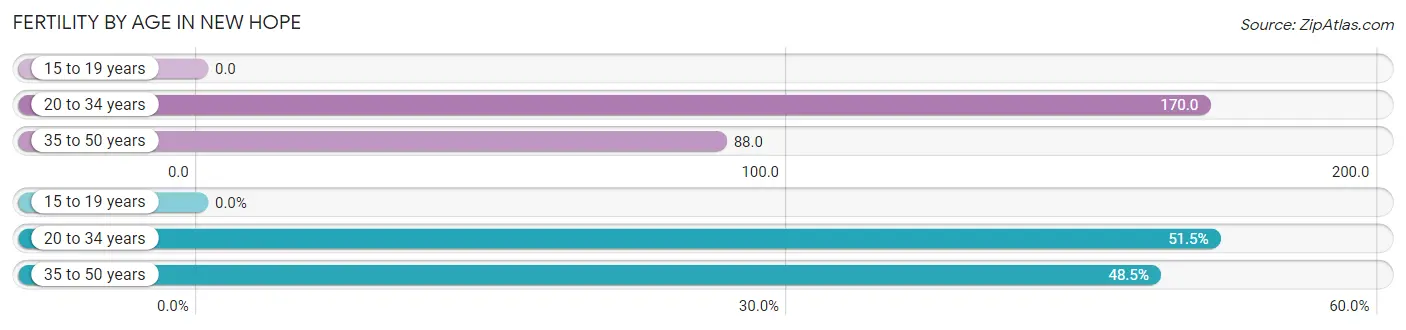
Fertility by Age in New Hope
Average fertility rate in New Hope is 114.0 births per 1,000 women. Women in the age bracket of 20 to 34 years have the highest fertility rate with 170.0 births per 1,000 women. Women in the age bracket of 20 to 34 years acount for 51.5% of all women with births.
| Age Bracket | Women with Births | Births / 1,000 Women |
| 15 to 19 years | 0 (0.0%) | 0.0 |
| 20 to 34 years | 34 (51.5%) | 170.0 |
| 35 to 50 years | 32 (48.5%) | 88.0 |
| Total | 66 (100.0%) | 114.0 |
Fertility by Age by Marriage Status in New Hope
51.5% of women with births (66) in New Hope are married. The highest percentage of unmarried women with births falls into 35 to 50 years age bracket with 100.0% of them unmarried at the time of birth, while the lowest percentage of unmarried women with births belong to 20 to 34 years age bracket with 0.0% of them unmarried.
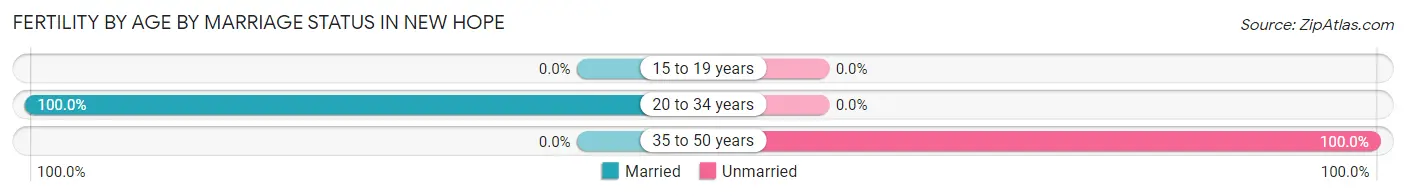
| Age Bracket | Married | Unmarried |
| 15 to 19 years | 0 (0.0%) | 0 (0.0%) |
| 20 to 34 years | 34 (100.0%) | 0 (0.0%) |
| 35 to 50 years | 0 (0.0%) | 32 (100.0%) |
| Total | 34 (51.5%) | 32 (48.5%) |
Fertility by Education in New Hope
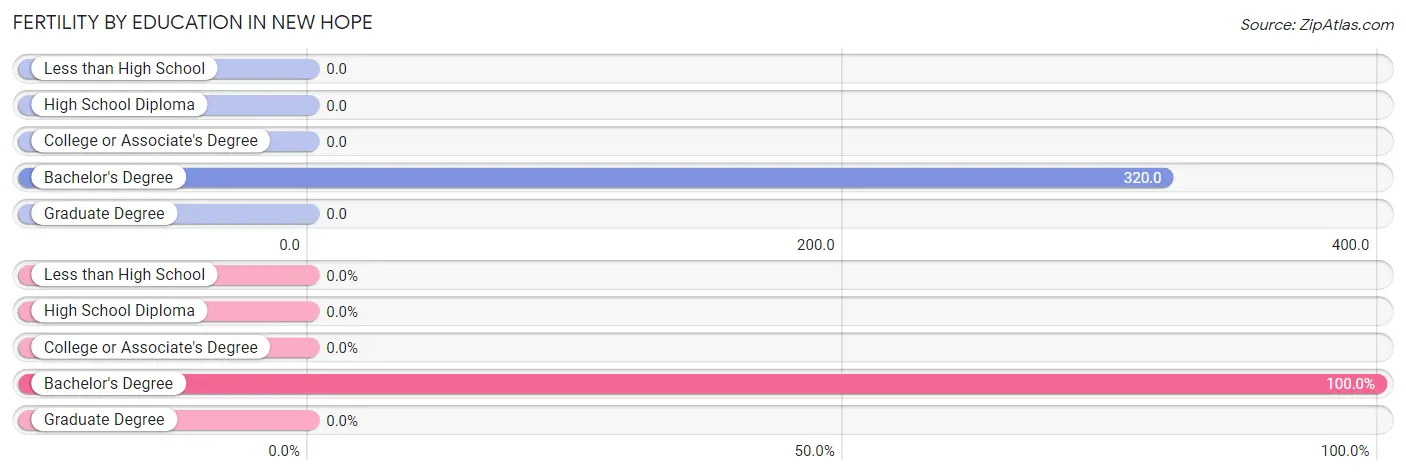
| Educational Attainment | Women with Births | Births / 1,000 Women |
| Less than High School | 0 (0.0%) | 0.0 |
| High School Diploma | 0 (0.0%) | 0.0 |
| College or Associate's Degree | 0 (0.0%) | 0.0 |
| Bachelor's Degree | 66 (100.0%) | 320.0 |
| Graduate Degree | 0 (0.0%) | 0.0 |
| Total | 66 (100.0%) | 114.0 |
Fertility by Education by Marriage Status in New Hope
48.5% of women with births in New Hope are unmarried. Women with the educational attainment of bachelor's degree are most likely to be married with 51.5% of them married at childbirth, while women with the educational attainment of bachelor's degree are least likely to be married with 48.5% of them unmarried at childbirth.
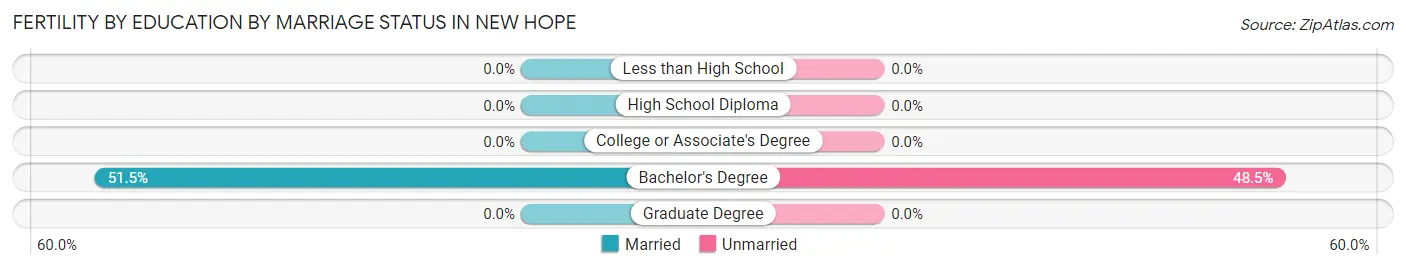
| Educational Attainment | Married | Unmarried |
| Less than High School | 0 (0.0%) | 0 (0.0%) |
| High School Diploma | 0 (0.0%) | 0 (0.0%) |
| College or Associate's Degree | 0 (0.0%) | 0 (0.0%) |
| Bachelor's Degree | 34 (51.5%) | 32 (48.5%) |
| Graduate Degree | 0 (0.0%) | 0 (0.0%) |
| Total | 34 (51.5%) | 32 (48.5%) |
Income in New Hope
Income Overview in New Hope
Per Capita Income in New Hope is $36,150, while median incomes of families and households are $88,125 and $76,149 respectively.
| Characteristic | Number | Measure |
| Per Capita Income | 2,983 | $36,150 |
| Median Family Income | 823 | $88,125 |
| Mean Family Income | 823 | $108,977 |
| Median Household Income | 1,052 | $76,149 |
| Mean Household Income | 1,052 | $94,442 |
| Income Deficit | 823 | $0 |
| Wage / Income Gap (%) | 2,983 | 27.65% |
| Wage / Income Gap ($) | 2,983 | 72.35¢ per $1 |
| Gini / Inequality Index | 2,983 | 0.40 |
Earnings by Sex in New Hope
Average Earnings in New Hope are $53,889, $58,480 for men and $42,311 for women, a difference of 27.7%.
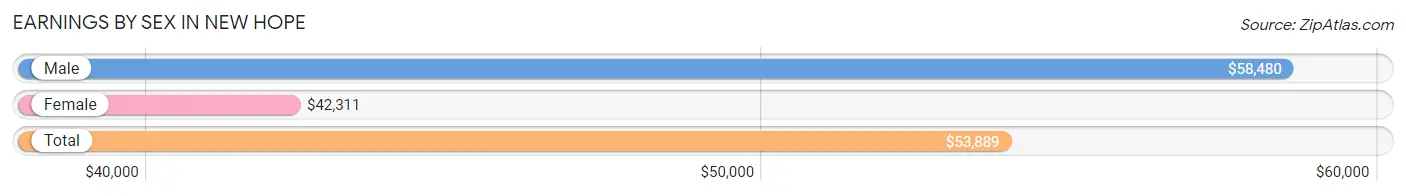
| Sex | Number | Average Earnings |
| Male | 902 (58.7%) | $58,480 |
| Female | 634 (41.3%) | $42,311 |
| Total | 1,536 (100.0%) | $53,889 |
Earnings by Sex by Income Bracket in New Hope
The most common earnings brackets in New Hope are $75,000 to $99,999 for men (171 | 19.0%) and $100,000+ for women (142 | 22.4%).
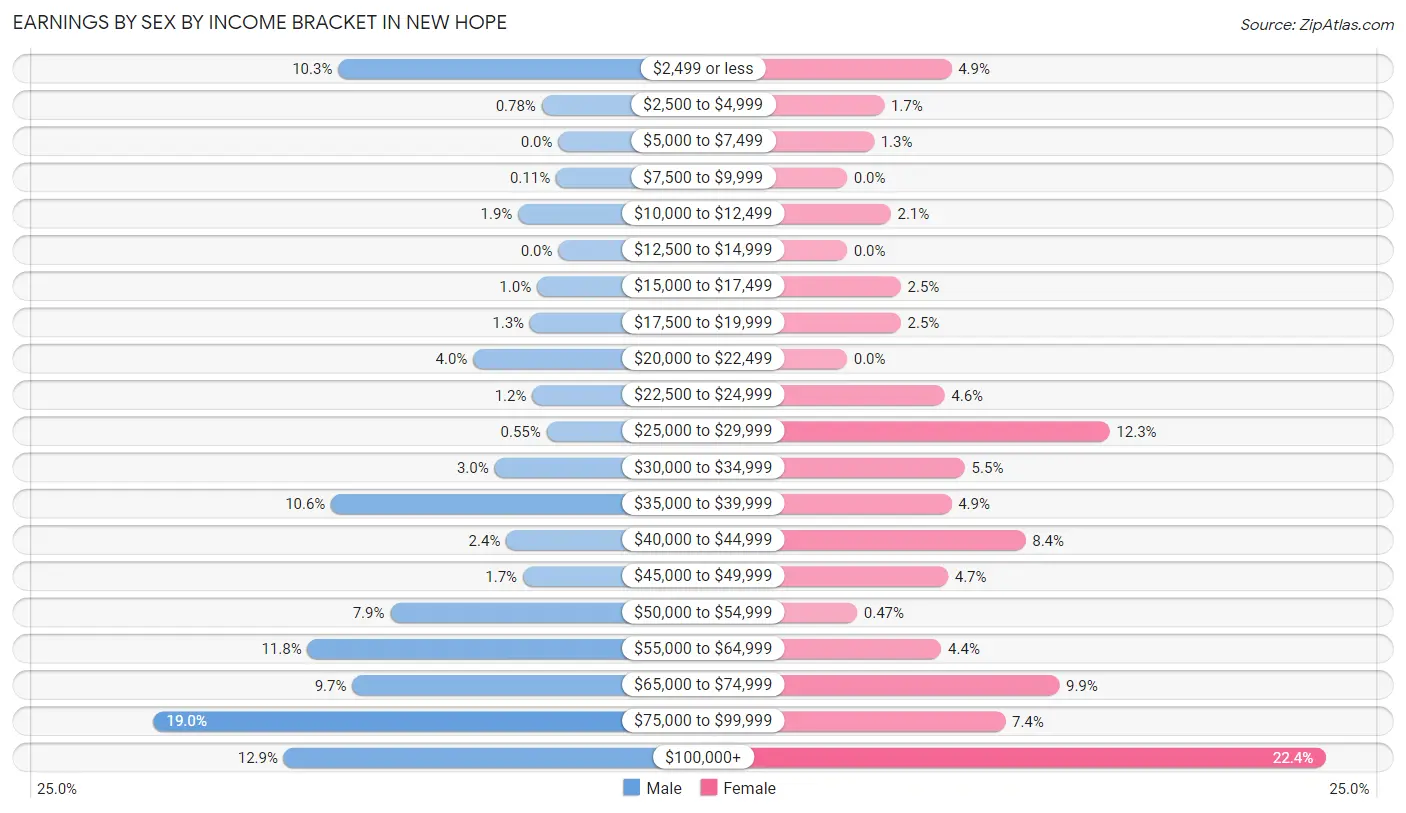
| Income | Male | Female |
| $2,499 or less | 93 (10.3%) | 31 (4.9%) |
| $2,500 to $4,999 | 7 (0.8%) | 11 (1.7%) |
| $5,000 to $7,499 | 0 (0.0%) | 8 (1.3%) |
| $7,500 to $9,999 | 1 (0.1%) | 0 (0.0%) |
| $10,000 to $12,499 | 17 (1.9%) | 13 (2.1%) |
| $12,500 to $14,999 | 0 (0.0%) | 0 (0.0%) |
| $15,000 to $17,499 | 9 (1.0%) | 16 (2.5%) |
| $17,500 to $19,999 | 12 (1.3%) | 16 (2.5%) |
| $20,000 to $22,499 | 36 (4.0%) | 0 (0.0%) |
| $22,500 to $24,999 | 11 (1.2%) | 29 (4.6%) |
| $25,000 to $29,999 | 5 (0.5%) | 78 (12.3%) |
| $30,000 to $34,999 | 27 (3.0%) | 35 (5.5%) |
| $35,000 to $39,999 | 96 (10.6%) | 31 (4.9%) |
| $40,000 to $44,999 | 22 (2.4%) | 53 (8.4%) |
| $45,000 to $49,999 | 15 (1.7%) | 30 (4.7%) |
| $50,000 to $54,999 | 71 (7.9%) | 3 (0.5%) |
| $55,000 to $64,999 | 106 (11.7%) | 28 (4.4%) |
| $65,000 to $74,999 | 87 (9.7%) | 63 (9.9%) |
| $75,000 to $99,999 | 171 (19.0%) | 47 (7.4%) |
| $100,000+ | 116 (12.9%) | 142 (22.4%) |
| Total | 902 (100.0%) | 634 (100.0%) |
Earnings by Sex by Educational Attainment in New Hope
Average earnings in New Hope are $59,899 for men and $46,875 for women, a difference of 21.7%. Men with an educational attainment of college or associate's degree enjoy the highest average annual earnings of $85,583, while those with high school diploma education earn the least with $57,720. Women with an educational attainment of graduate degree earn the most with the average annual earnings of $76,771, while those with high school diploma education have the smallest earnings of $27,917.
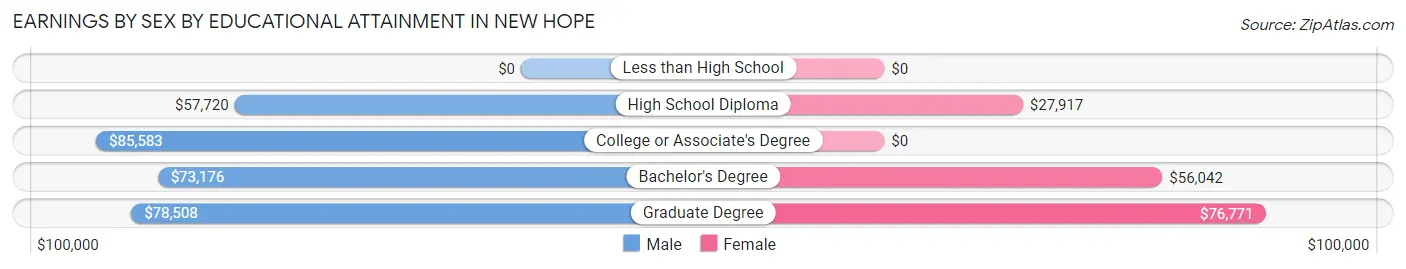
| Educational Attainment | Male Income | Female Income |
| Less than High School | - | - |
| High School Diploma | $57,720 | $27,917 |
| College or Associate's Degree | $85,583 | $0 |
| Bachelor's Degree | $73,176 | $56,042 |
| Graduate Degree | $78,508 | $76,771 |
| Total | $59,899 | $46,875 |
Family Income in New Hope
Family Income Brackets in New Hope
According to the New Hope family income data, there are 169 families falling into the $100,000 to $149,999 income range, which is the most common income bracket and makes up 20.5% of all families.
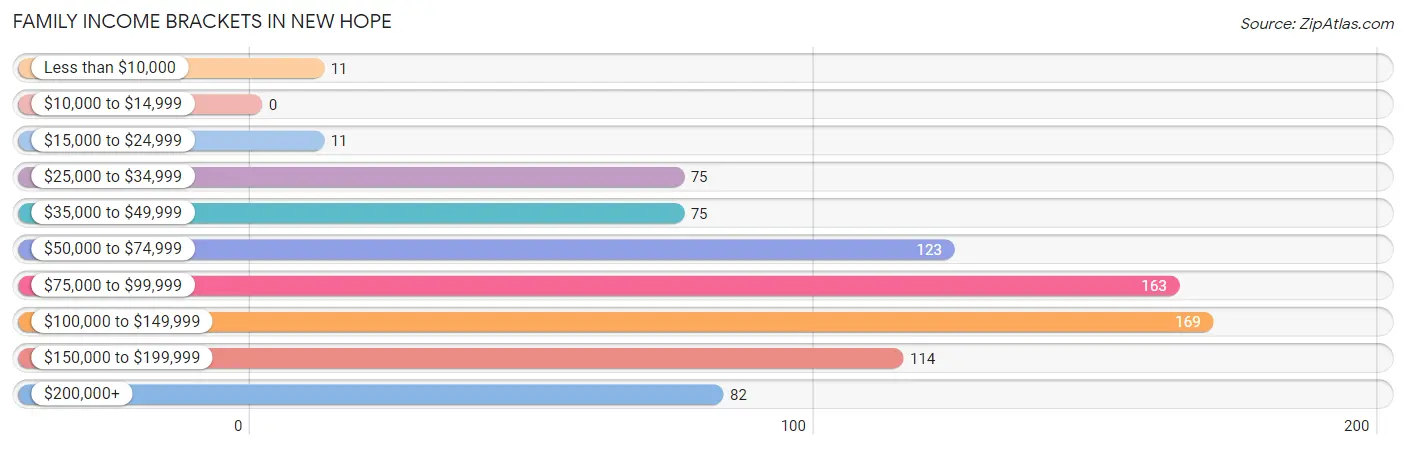
| Income Bracket | # Families | % Families |
| Less than $10,000 | 11 | 1.3% |
| $10,000 to $14,999 | 0 | 0.0% |
| $15,000 to $24,999 | 11 | 1.3% |
| $25,000 to $34,999 | 75 | 9.1% |
| $35,000 to $49,999 | 75 | 9.1% |
| $50,000 to $74,999 | 123 | 14.9% |
| $75,000 to $99,999 | 163 | 19.8% |
| $100,000 to $149,999 | 169 | 20.5% |
| $150,000 to $199,999 | 114 | 13.9% |
| $200,000+ | 82 | 10.0% |
Family Income by Famaliy Size in New Hope
3-person families (165 | 20.1%) account for the highest median family income in New Hope with $116,458 per family, while 3-person families (165 | 20.1%) have the highest median income of $38,819 per family member.
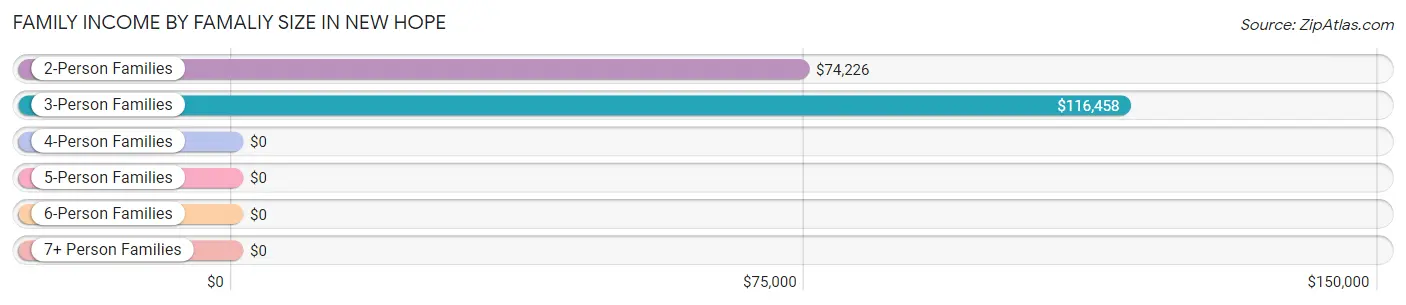
| Income Bracket | # Families | Median Income |
| 2-Person Families | 354 (43.0%) | $74,226 |
| 3-Person Families | 165 (20.1%) | $116,458 |
| 4-Person Families | 235 (28.5%) | $0 |
| 5-Person Families | 51 (6.2%) | $0 |
| 6-Person Families | 0 (0.0%) | $0 |
| 7+ Person Families | 18 (2.2%) | $0 |
| Total | 823 (100.0%) | $88,125 |
Family Income by Number of Earners in New Hope
The median family income in New Hope is $88,125, with families comprising 3+ earners (92) having the highest median family income of $193,000, while families with no earners (94) have the lowest median family income of $48,125, accounting for 11.2% and 11.4% of families, respectively.
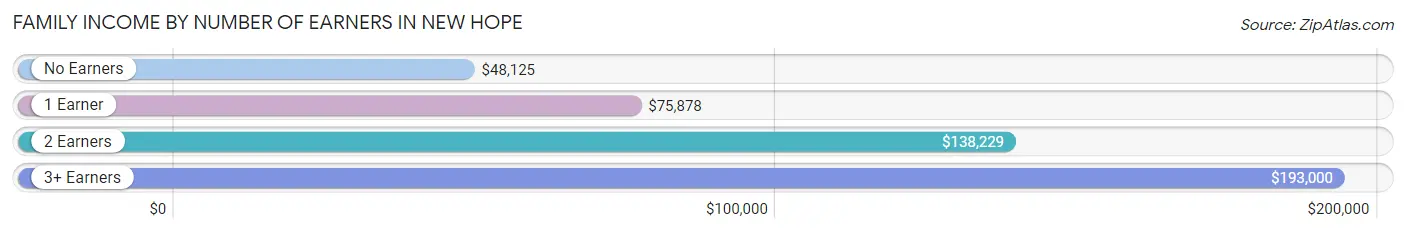
| Number of Earners | # Families | Median Income |
| No Earners | 94 (11.4%) | $48,125 |
| 1 Earner | 310 (37.7%) | $75,878 |
| 2 Earners | 327 (39.7%) | $138,229 |
| 3+ Earners | 92 (11.2%) | $193,000 |
| Total | 823 (100.0%) | $88,125 |
Household Income in New Hope
Household Income Brackets in New Hope
With 223 households falling in the category, the $100,000 to $149,999 income range is the most frequent in New Hope, accounting for 21.2% of all households.
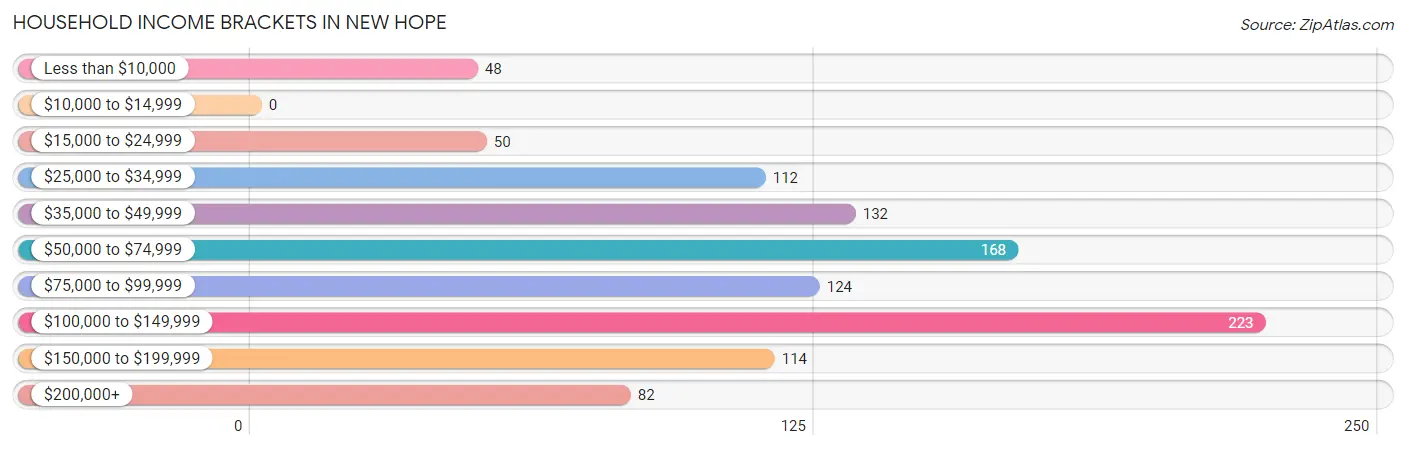
| Income Bracket | # Households | % Households |
| Less than $10,000 | 48 | 4.6% |
| $10,000 to $14,999 | 0 | 0.0% |
| $15,000 to $24,999 | 50 | 4.8% |
| $25,000 to $34,999 | 112 | 10.6% |
| $35,000 to $49,999 | 132 | 12.5% |
| $50,000 to $74,999 | 168 | 16.0% |
| $75,000 to $99,999 | 124 | 11.8% |
| $100,000 to $149,999 | 223 | 21.2% |
| $150,000 to $199,999 | 114 | 10.8% |
| $200,000+ | 82 | 7.8% |
Household Income by Householder Age in New Hope
The median household income in New Hope is $76,149, with the highest median household income of $108,750 found in the 25 to 44 years age bracket for the primary householder. A total of 426 households (40.5%) fall into this category.
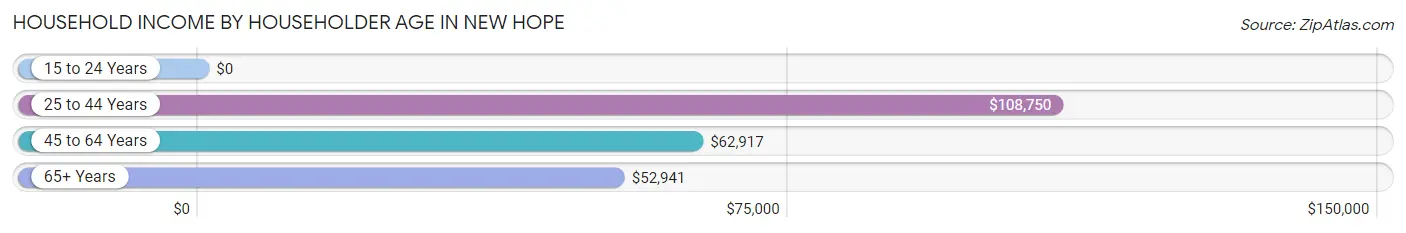
| Income Bracket | # Households | Median Income |
| 15 to 24 Years | 0 (0.0%) | $0 |
| 25 to 44 Years | 426 (40.5%) | $108,750 |
| 45 to 64 Years | 376 (35.7%) | $62,917 |
| 65+ Years | 250 (23.8%) | $52,941 |
| Total | 1,052 (100.0%) | $76,149 |
Poverty in New Hope
Income Below Poverty by Sex and Age in New Hope
With 1.7% poverty level for males and 2.3% for females among the residents of New Hope, 12 to 14 year old males and 65 to 74 year old females are the most vulnerable to poverty, with 11 males (12.5%) and 33 females (15.2%) in their respective age groups living below the poverty level.
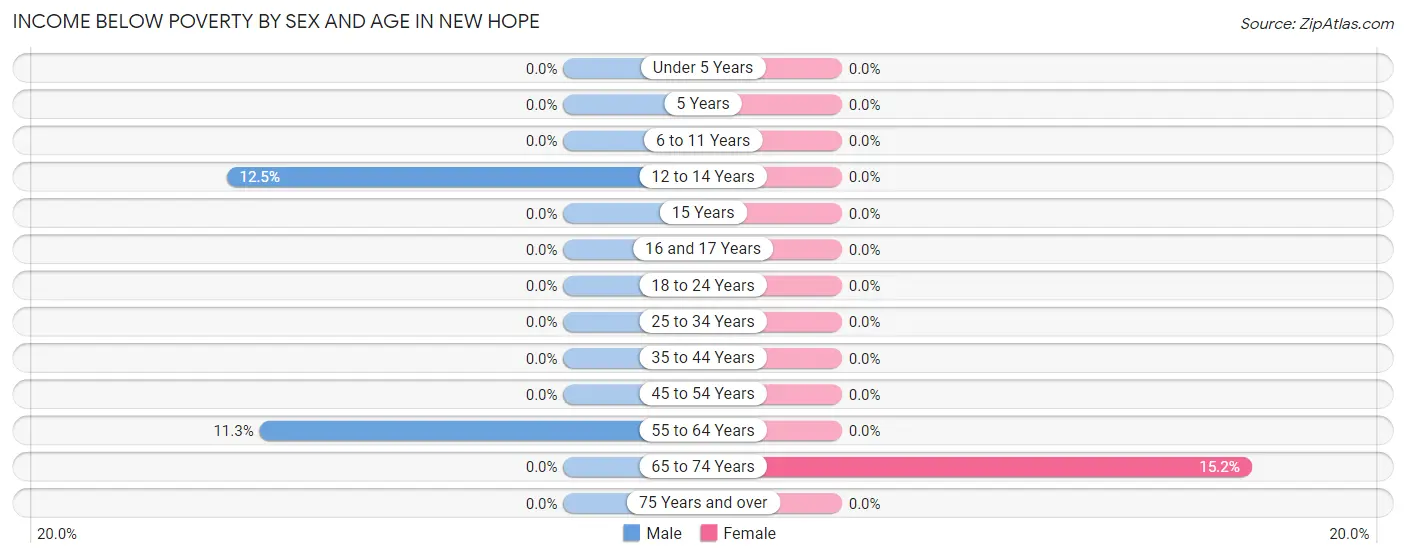
| Age Bracket | Male | Female |
| Under 5 Years | 0 (0.0%) | 0 (0.0%) |
| 5 Years | 0 (0.0%) | 0 (0.0%) |
| 6 to 11 Years | 0 (0.0%) | 0 (0.0%) |
| 12 to 14 Years | 11 (12.5%) | 0 (0.0%) |
| 15 Years | 0 (0.0%) | 0 (0.0%) |
| 16 and 17 Years | 0 (0.0%) | 0 (0.0%) |
| 18 to 24 Years | 0 (0.0%) | 0 (0.0%) |
| 25 to 34 Years | 0 (0.0%) | 0 (0.0%) |
| 35 to 44 Years | 0 (0.0%) | 0 (0.0%) |
| 45 to 54 Years | 0 (0.0%) | 0 (0.0%) |
| 55 to 64 Years | 15 (11.3%) | 0 (0.0%) |
| 65 to 74 Years | 0 (0.0%) | 33 (15.2%) |
| 75 Years and over | 0 (0.0%) | 0 (0.0%) |
| Total | 26 (1.7%) | 33 (2.3%) |
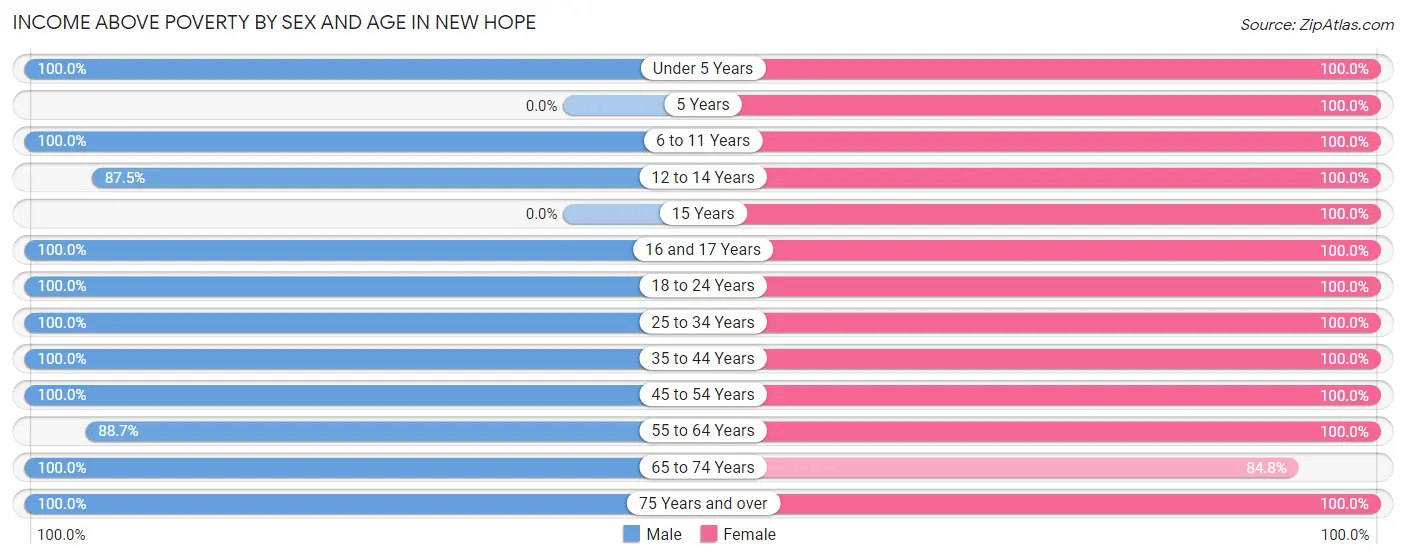
Income Above Poverty by Sex and Age in New Hope
According to the poverty statistics in New Hope, males aged under 5 years and females aged under 5 years are the age groups that are most secure financially, with 100.0% of males and 100.0% of females in these age groups living above the poverty line.
| Age Bracket | Male | Female |
| Under 5 Years | 147 (100.0%) | 120 (100.0%) |
| 5 Years | 0 (0.0%) | 86 (100.0%) |
| 6 to 11 Years | 108 (100.0%) | 151 (100.0%) |
| 12 to 14 Years | 77 (87.5%) | 57 (100.0%) |
| 15 Years | 0 (0.0%) | 8 (100.0%) |
| 16 and 17 Years | 4 (100.0%) | 8 (100.0%) |
| 18 to 24 Years | 137 (100.0%) | 44 (100.0%) |
| 25 to 34 Years | 218 (100.0%) | 156 (100.0%) |
| 35 to 44 Years | 383 (100.0%) | 197 (100.0%) |
| 45 to 54 Years | 157 (100.0%) | 219 (100.0%) |
| 55 to 64 Years | 118 (88.7%) | 151 (100.0%) |
| 65 to 74 Years | 101 (100.0%) | 184 (84.8%) |
| 75 Years and over | 48 (100.0%) | 45 (100.0%) |
| Total | 1,498 (98.3%) | 1,426 (97.7%) |
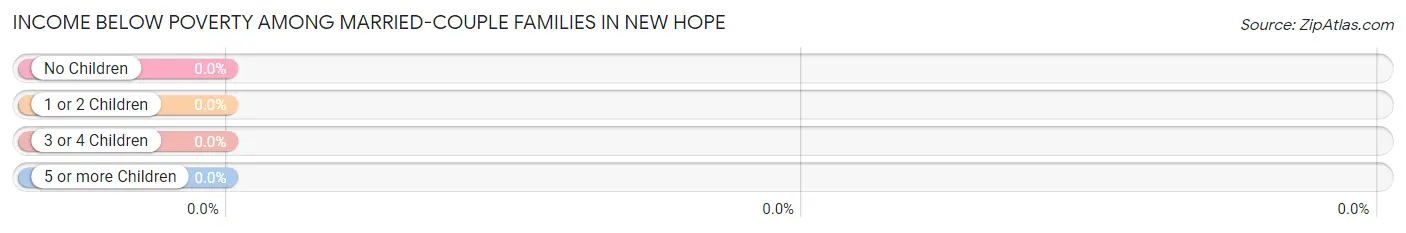
Income Below Poverty Among Married-Couple Families in New Hope
| Children | Above Poverty | Below Poverty |
| No Children | 306 (100.0%) | 0 (0.0%) |
| 1 or 2 Children | 264 (100.0%) | 0 (0.0%) |
| 3 or 4 Children | 58 (100.0%) | 0 (0.0%) |
| 5 or more Children | 0 (0.0%) | 0 (0.0%) |
| Total | 628 (100.0%) | 0 (0.0%) |
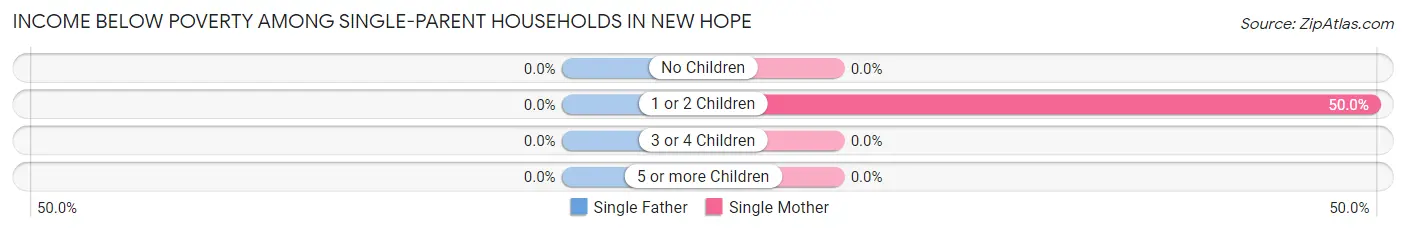
Income Below Poverty Among Single-Parent Households in New Hope
| Children | Single Father | Single Mother |
| No Children | 0 (0.0%) | 0 (0.0%) |
| 1 or 2 Children | 0 (0.0%) | 11 (50.0%) |
| 3 or 4 Children | 0 (0.0%) | 0 (0.0%) |
| 5 or more Children | 0 (0.0%) | 0 (0.0%) |
| Total | 0 (0.0%) | 11 (9.6%) |
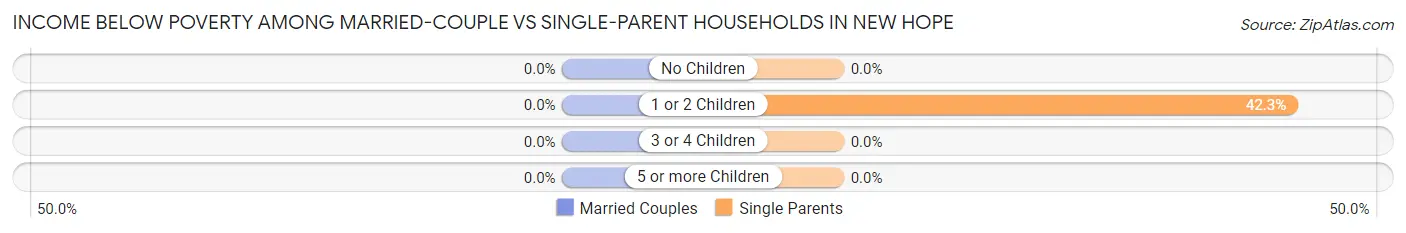
Income Below Poverty Among Married-Couple vs Single-Parent Households in New Hope
| Children | Married-Couple Families | Single-Parent Households |
| No Children | 0 (0.0%) | 0 (0.0%) |
| 1 or 2 Children | 0 (0.0%) | 11 (42.3%) |
| 3 or 4 Children | 0 (0.0%) | 0 (0.0%) |
| 5 or more Children | 0 (0.0%) | 0 (0.0%) |
| Total | 0 (0.0%) | 11 (5.6%) |
Employment Characteristics in New Hope
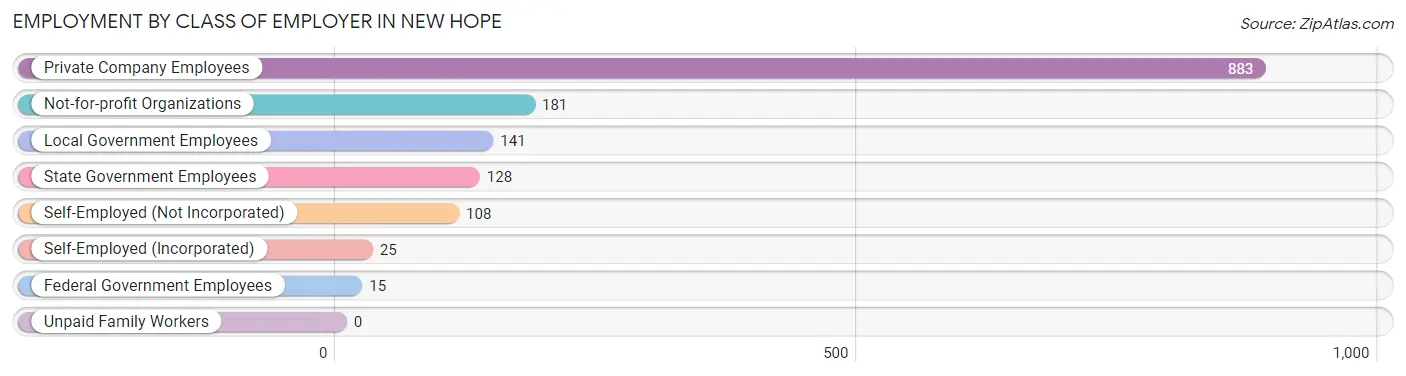
Employment by Class of Employer in New Hope
Among the 1,481 employed individuals in New Hope, private company employees (883 | 59.6%), not-for-profit organizations (181 | 12.2%), and local government employees (141 | 9.5%) make up the most common classes of employment.
| Employer Class | # Employees | % Employees |
| Private Company Employees | 883 | 59.6% |
| Self-Employed (Incorporated) | 25 | 1.7% |
| Self-Employed (Not Incorporated) | 108 | 7.3% |
| Not-for-profit Organizations | 181 | 12.2% |
| Local Government Employees | 141 | 9.5% |
| State Government Employees | 128 | 8.6% |
| Federal Government Employees | 15 | 1.0% |
| Unpaid Family Workers | 0 | 0.0% |
| Total | 1,481 | 100.0% |
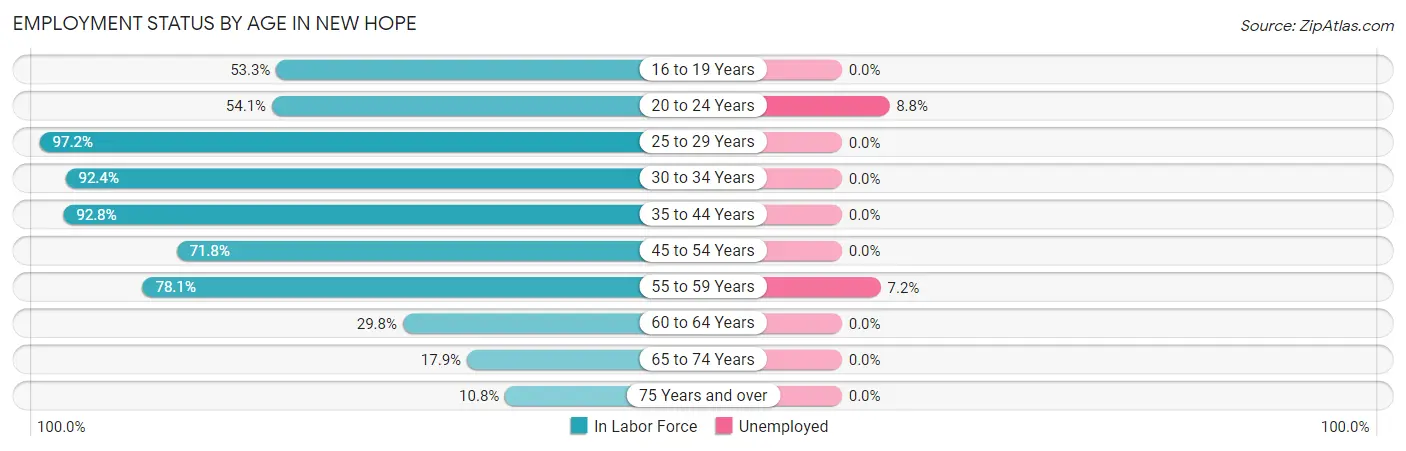
Employment Status by Age in New Hope
According to the labor force statistics for New Hope, out of the total population over 16 years of age (2,218), 67.5% or 1,497 individuals are in the labor force, with 1.1% or 16 of them unemployed. The age group with the highest labor force participation rate is 25 to 29 years, with 97.2% or 211 individuals in the labor force. Within the labor force, the 20 to 24 years age range has the highest percentage of unemployed individuals, with 8.8% or 7 of them being unemployed.
| Age Bracket | In Labor Force | Unemployed |
| 16 to 19 Years | 24 (53.3%) | 0 (0.0%) |
| 20 to 24 Years | 80 (54.1%) | 7 (8.8%) |
| 25 to 29 Years | 211 (97.2%) | 0 (0.0%) |
| 30 to 34 Years | 145 (92.4%) | 0 (0.0%) |
| 35 to 44 Years | 538 (92.8%) | 0 (0.0%) |
| 45 to 54 Years | 270 (71.8%) | 0 (0.0%) |
| 55 to 59 Years | 125 (78.1%) | 9 (7.2%) |
| 60 to 64 Years | 37 (29.8%) | 0 (0.0%) |
| 65 to 74 Years | 57 (17.9%) | 0 (0.0%) |
| 75 Years and over | 10 (10.8%) | 0 (0.0%) |
| Total | 1,497 (67.5%) | 16 (1.1%) |
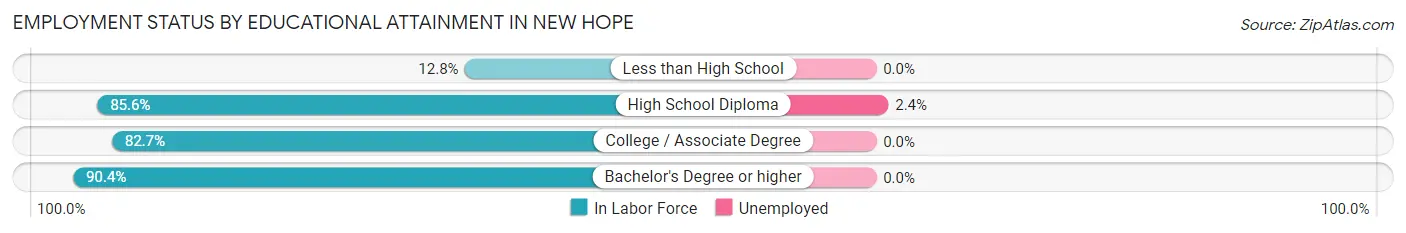
Employment Status by Educational Attainment in New Hope
According to labor force statistics for New Hope, 82.2% of individuals (1,327) out of the total population between 25 and 64 years of age (1,614) are in the labor force, with 0.7% or 9 of them being unemployed. The group with the highest labor force participation rate are those with the educational attainment of bachelor's degree or higher, with 90.4% or 519 individuals in the labor force. Within the labor force, individuals with high school diploma education have the highest percentage of unemployment, with 2.4% or 9 of them being unemployed.
| Educational Attainment | In Labor Force | Unemployed |
| Less than High School | 12 (12.8%) | 0 (0.0%) |
| High School Diploma | 374 (85.6%) | 10 (2.4%) |
| College / Associate Degree | 421 (82.7%) | 0 (0.0%) |
| Bachelor's Degree or higher | 519 (90.4%) | 0 (0.0%) |
| Total | 1,327 (82.2%) | 11 (0.7%) |
Employment Occupations by Sex in New Hope
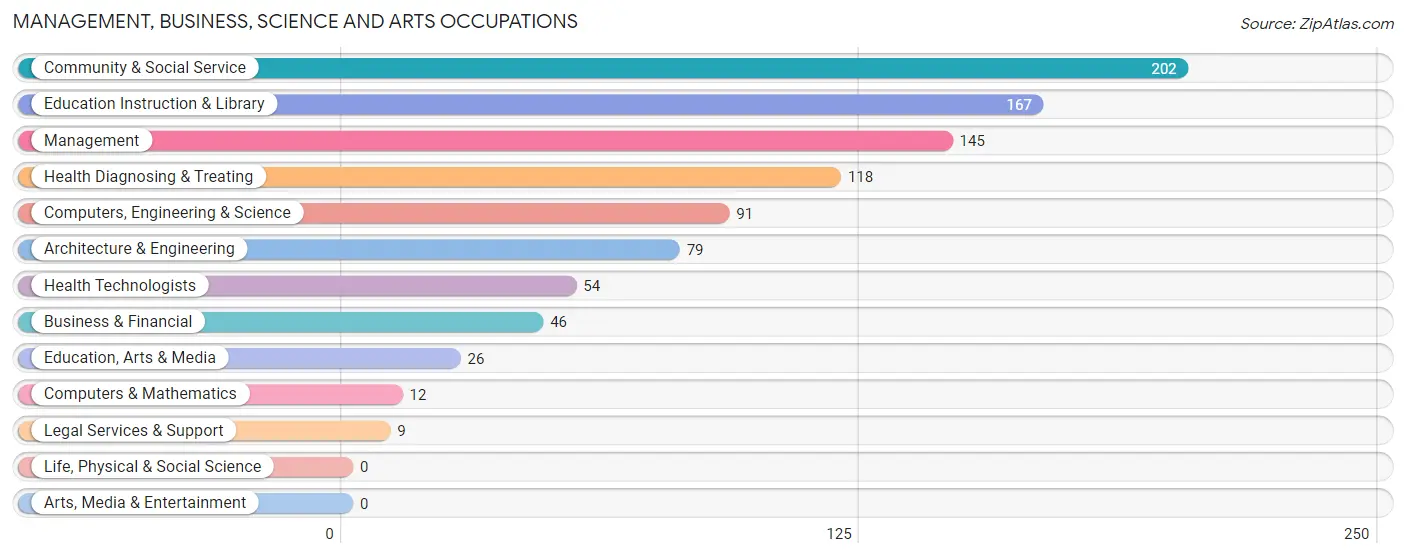
Management, Business, Science and Arts Occupations
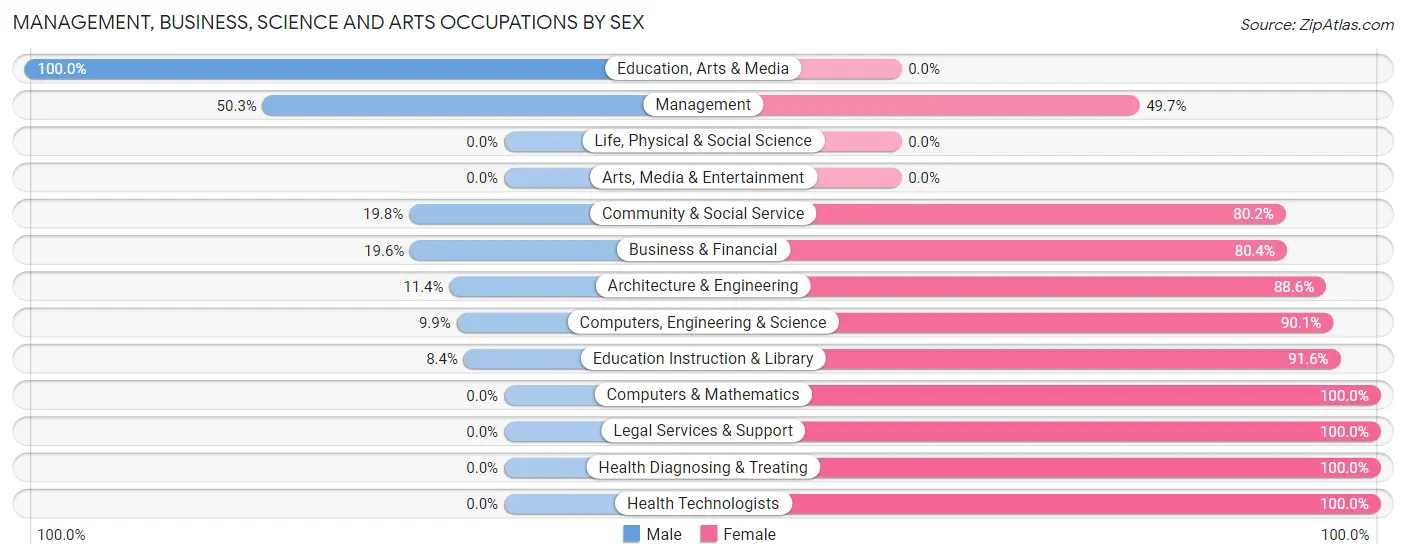
The most common Management, Business, Science and Arts occupations in New Hope are Community & Social Service (202 | 13.8%), Education Instruction & Library (167 | 11.4%), Management (145 | 9.9%), Health Diagnosing & Treating (118 | 8.1%), and Computers, Engineering & Science (91 | 6.2%).
Management, Business, Science and Arts Occupations by Sex
Within the Management, Business, Science and Arts occupations in New Hope, the most male-oriented occupations are Education, Arts & Media (100.0%), Management (50.3%), and Community & Social Service (19.8%), while the most female-oriented occupations are Computers & Mathematics (100.0%), Legal Services & Support (100.0%), and Health Diagnosing & Treating (100.0%).
| Occupation | Male | Female |
| Management | 73 (50.3%) | 72 (49.7%) |
| Business & Financial | 9 (19.6%) | 37 (80.4%) |
| Computers, Engineering & Science | 9 (9.9%) | 82 (90.1%) |
| Computers & Mathematics | 0 (0.0%) | 12 (100.0%) |
| Architecture & Engineering | 9 (11.4%) | 70 (88.6%) |
| Life, Physical & Social Science | 0 (0.0%) | 0 (0.0%) |
| Community & Social Service | 40 (19.8%) | 162 (80.2%) |
| Education, Arts & Media | 26 (100.0%) | 0 (0.0%) |
| Legal Services & Support | 0 (0.0%) | 9 (100.0%) |
| Education Instruction & Library | 14 (8.4%) | 153 (91.6%) |
| Arts, Media & Entertainment | 0 (0.0%) | 0 (0.0%) |
| Health Diagnosing & Treating | 0 (0.0%) | 118 (100.0%) |
| Health Technologists | 0 (0.0%) | 54 (100.0%) |
| Total (Category) | 131 (21.8%) | 471 (78.2%) |
| Total (Overall) | 843 (57.5%) | 623 (42.5%) |
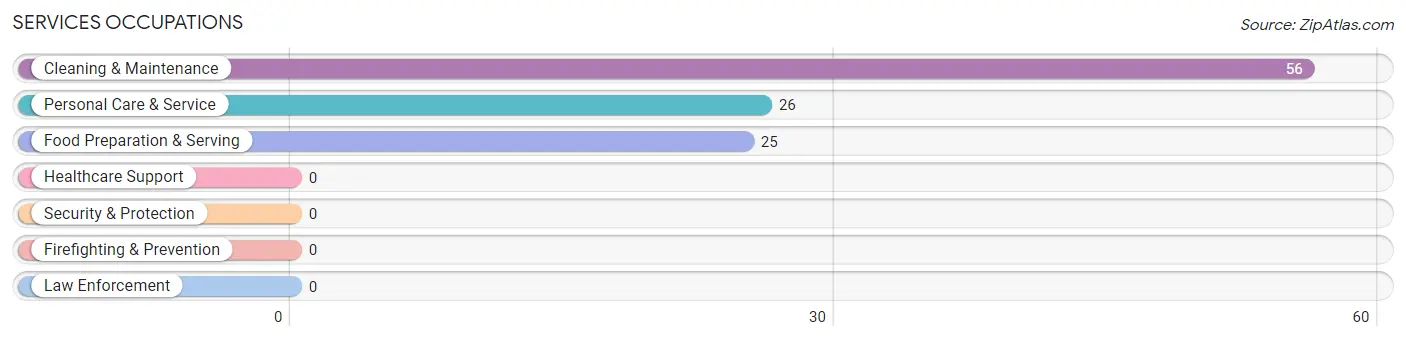
Services Occupations
The most common Services occupations in New Hope are Cleaning & Maintenance (56 | 3.8%), Personal Care & Service (26 | 1.8%), and Food Preparation & Serving (25 | 1.7%).
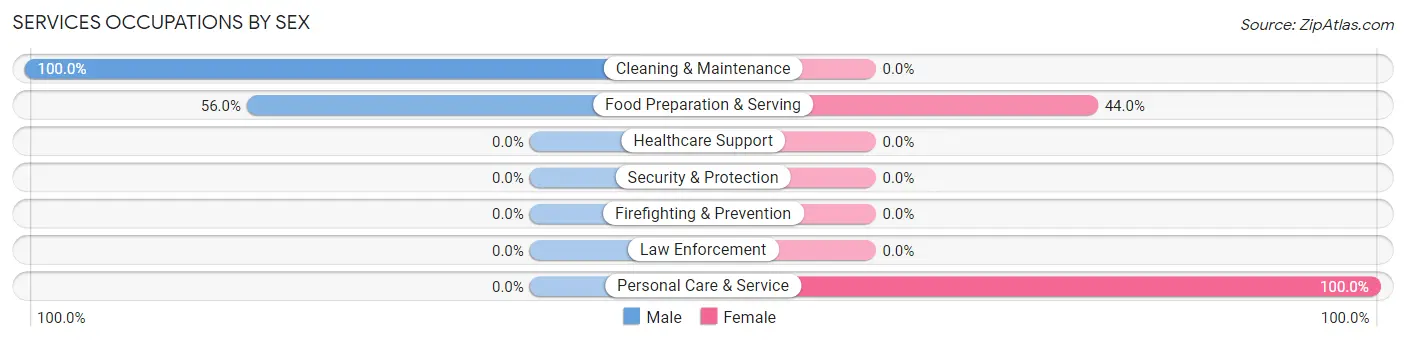
Services Occupations by Sex
Within the Services occupations in New Hope, the most male-oriented occupations are Cleaning & Maintenance (100.0%), and Food Preparation & Serving (56.0%), while the most female-oriented occupations are Personal Care & Service (100.0%), and Food Preparation & Serving (44.0%).
| Occupation | Male | Female |
| Healthcare Support | 0 (0.0%) | 0 (0.0%) |
| Security & Protection | 0 (0.0%) | 0 (0.0%) |
| Firefighting & Prevention | 0 (0.0%) | 0 (0.0%) |
| Law Enforcement | 0 (0.0%) | 0 (0.0%) |
| Food Preparation & Serving | 14 (56.0%) | 11 (44.0%) |
| Cleaning & Maintenance | 56 (100.0%) | 0 (0.0%) |
| Personal Care & Service | 0 (0.0%) | 26 (100.0%) |
| Total (Category) | 70 (65.4%) | 37 (34.6%) |
| Total (Overall) | 843 (57.5%) | 623 (42.5%) |
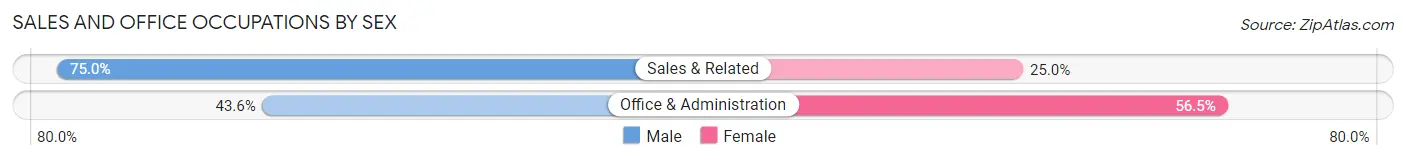
Sales and Office Occupations
The most common Sales and Office occupations in New Hope are Office & Administration (124 | 8.5%), and Sales & Related (68 | 4.6%).

Sales and Office Occupations by Sex
| Occupation | Male | Female |
| Sales & Related | 51 (75.0%) | 17 (25.0%) |
| Office & Administration | 54 (43.5%) | 70 (56.5%) |
| Total (Category) | 105 (54.7%) | 87 (45.3%) |
| Total (Overall) | 843 (57.5%) | 623 (42.5%) |
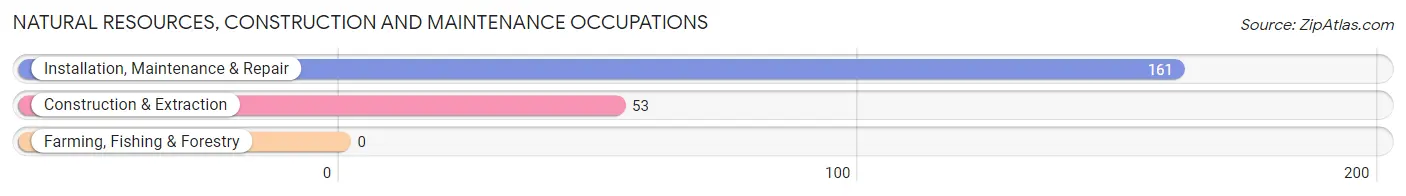
Natural Resources, Construction and Maintenance Occupations
The most common Natural Resources, Construction and Maintenance occupations in New Hope are Installation, Maintenance & Repair (161 | 11.0%), and Construction & Extraction (53 | 3.6%).
Natural Resources, Construction and Maintenance Occupations by Sex
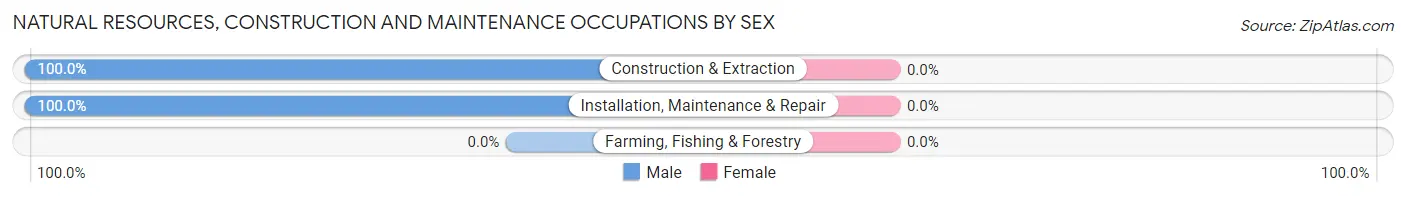
| Occupation | Male | Female |
| Farming, Fishing & Forestry | 0 (0.0%) | 0 (0.0%) |
| Construction & Extraction | 53 (100.0%) | 0 (0.0%) |
| Installation, Maintenance & Repair | 161 (100.0%) | 0 (0.0%) |
| Total (Category) | 214 (100.0%) | 0 (0.0%) |
| Total (Overall) | 843 (57.5%) | 623 (42.5%) |
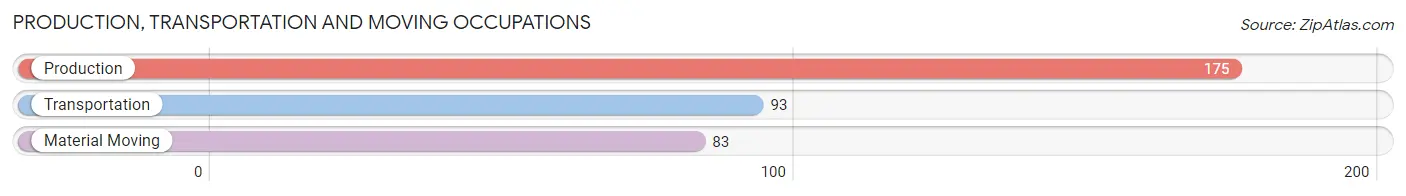
Production, Transportation and Moving Occupations
The most common Production, Transportation and Moving occupations in New Hope are Production (175 | 11.9%), Transportation (93 | 6.3%), and Material Moving (83 | 5.7%).
Production, Transportation and Moving Occupations by Sex
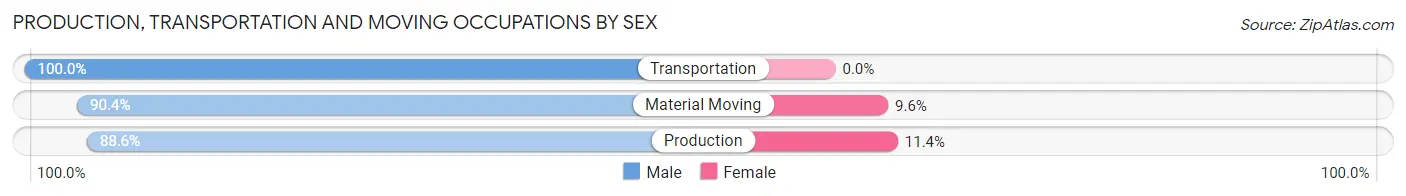
| Occupation | Male | Female |
| Production | 155 (88.6%) | 20 (11.4%) |
| Transportation | 93 (100.0%) | 0 (0.0%) |
| Material Moving | 75 (90.4%) | 8 (9.6%) |
| Total (Category) | 323 (92.0%) | 28 (8.0%) |
| Total (Overall) | 843 (57.5%) | 623 (42.5%) |
Employment Industries by Sex in New Hope
Employment Industries in New Hope
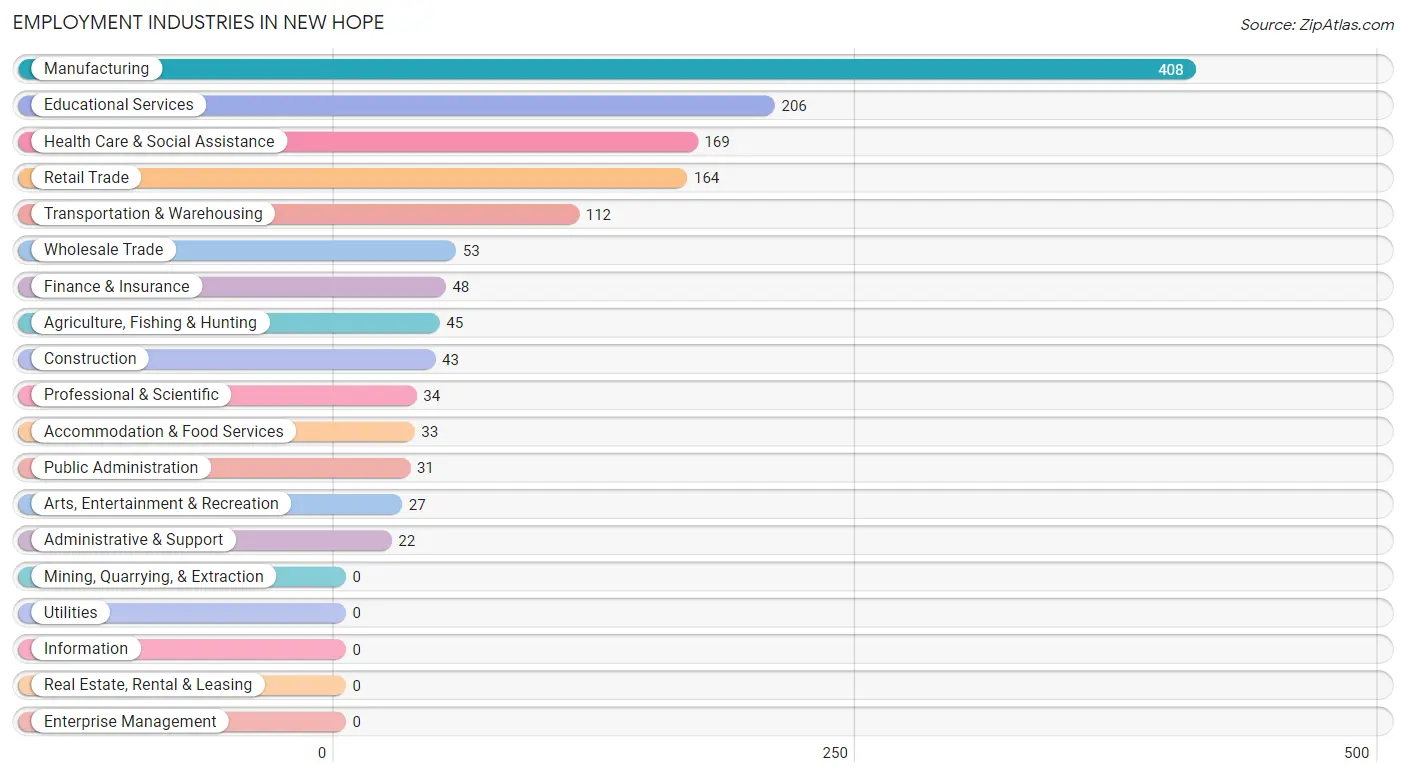
The major employment industries in New Hope include Manufacturing (408 | 27.8%), Educational Services (206 | 14.1%), Health Care & Social Assistance (169 | 11.5%), Retail Trade (164 | 11.2%), and Transportation & Warehousing (112 | 7.6%).
Employment Industries by Sex in New Hope
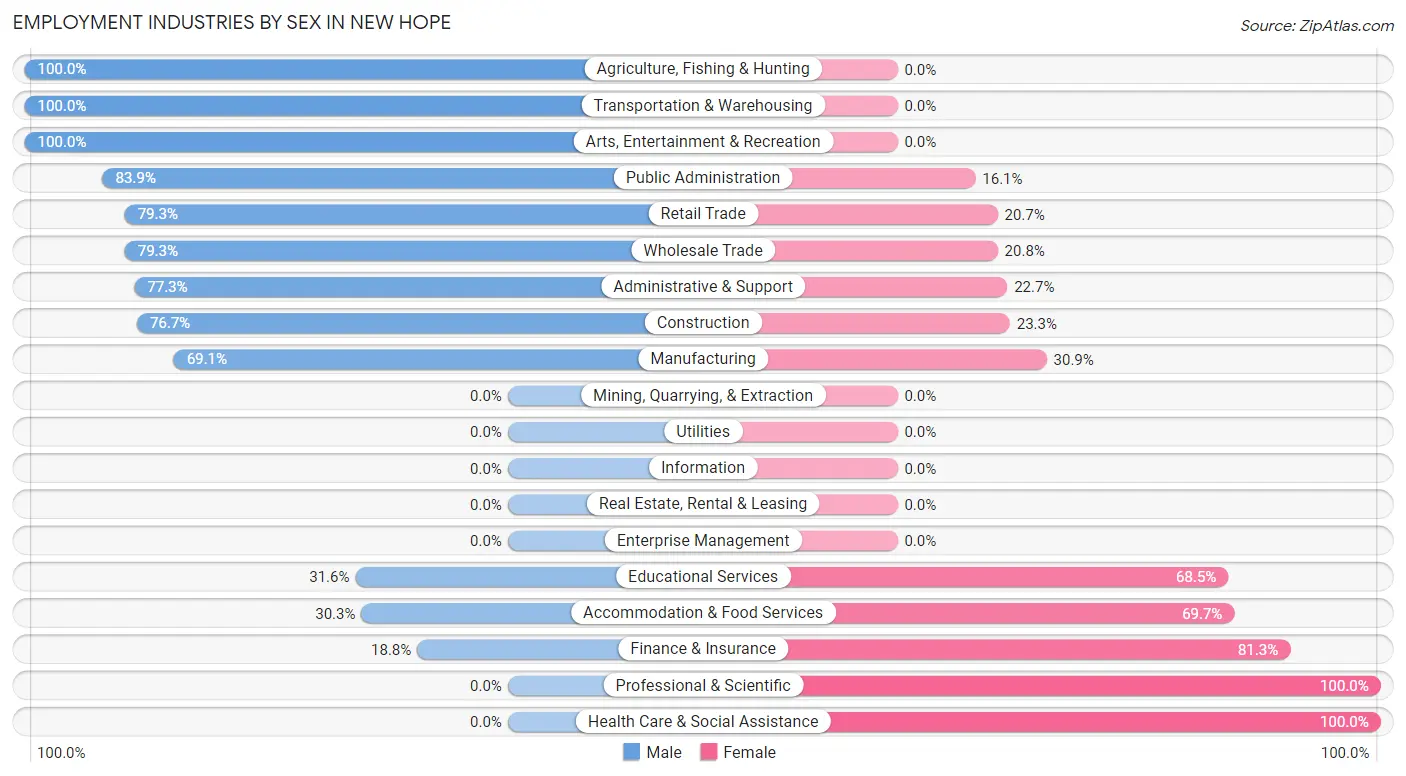
The New Hope industries that see more men than women are Agriculture, Fishing & Hunting (100.0%), Transportation & Warehousing (100.0%), and Arts, Entertainment & Recreation (100.0%), whereas the industries that tend to have a higher number of women are Professional & Scientific (100.0%), Health Care & Social Assistance (100.0%), and Finance & Insurance (81.2%).
| Industry | Male | Female |
| Agriculture, Fishing & Hunting | 45 (100.0%) | 0 (0.0%) |
| Mining, Quarrying, & Extraction | 0 (0.0%) | 0 (0.0%) |
| Construction | 33 (76.7%) | 10 (23.3%) |
| Manufacturing | 282 (69.1%) | 126 (30.9%) |
| Wholesale Trade | 42 (79.2%) | 11 (20.7%) |
| Retail Trade | 130 (79.3%) | 34 (20.7%) |
| Transportation & Warehousing | 112 (100.0%) | 0 (0.0%) |
| Utilities | 0 (0.0%) | 0 (0.0%) |
| Information | 0 (0.0%) | 0 (0.0%) |
| Finance & Insurance | 9 (18.8%) | 39 (81.2%) |
| Real Estate, Rental & Leasing | 0 (0.0%) | 0 (0.0%) |
| Professional & Scientific | 0 (0.0%) | 34 (100.0%) |
| Enterprise Management | 0 (0.0%) | 0 (0.0%) |
| Administrative & Support | 17 (77.3%) | 5 (22.7%) |
| Educational Services | 65 (31.6%) | 141 (68.4%) |
| Health Care & Social Assistance | 0 (0.0%) | 169 (100.0%) |
| Arts, Entertainment & Recreation | 27 (100.0%) | 0 (0.0%) |
| Accommodation & Food Services | 10 (30.3%) | 23 (69.7%) |
| Public Administration | 26 (83.9%) | 5 (16.1%) |
| Total | 843 (57.5%) | 623 (42.5%) |
Education in New Hope
School Enrollment in New Hope
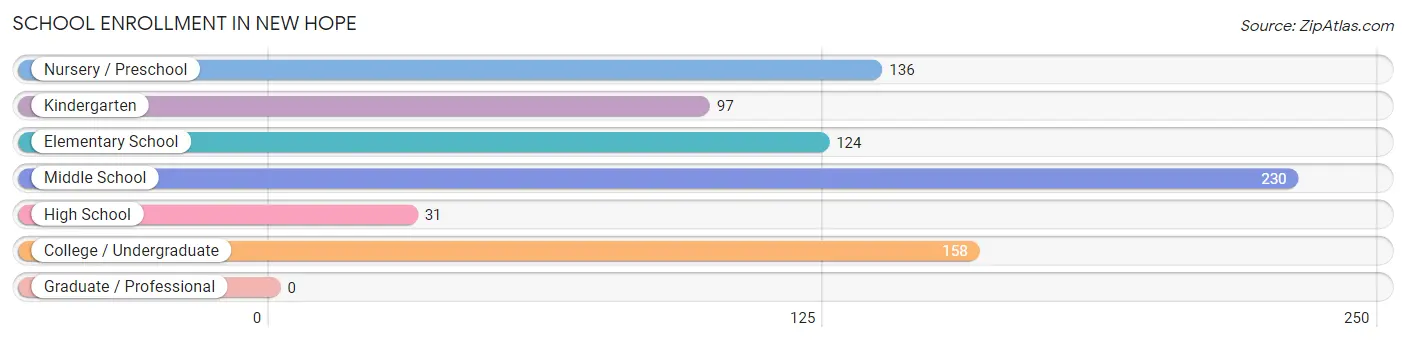
The most common levels of schooling among the 776 students in New Hope are middle school (230 | 29.6%), college / undergraduate (158 | 20.4%), and nursery / preschool (136 | 17.5%).
| School Level | # Students | % Students |
| Nursery / Preschool | 136 | 17.5% |
| Kindergarten | 97 | 12.5% |
| Elementary School | 124 | 16.0% |
| Middle School | 230 | 29.6% |
| High School | 31 | 4.0% |
| College / Undergraduate | 158 | 20.4% |
| Graduate / Professional | 0 | 0.0% |
| Total | 776 | 100.0% |
School Enrollment by Age by Funding Source in New Hope
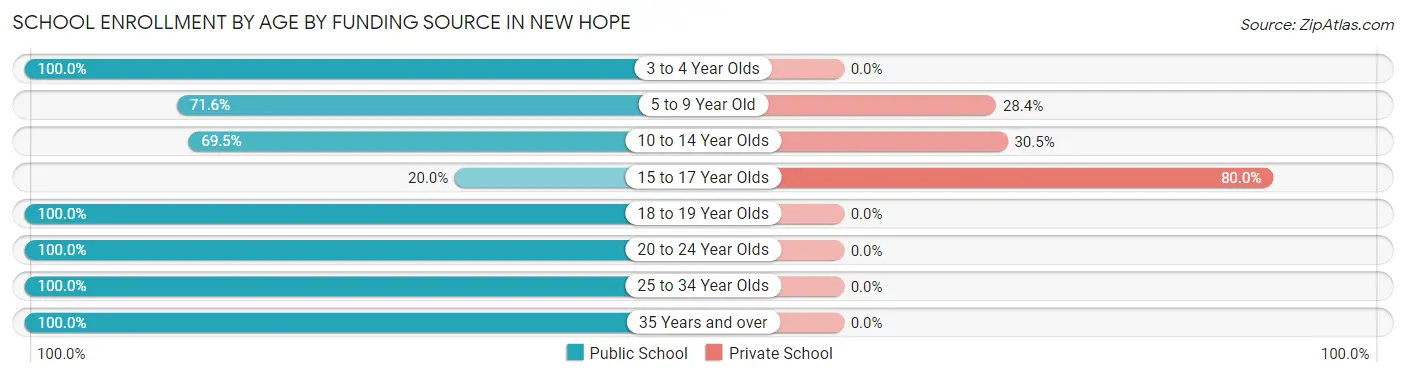
Out of a total of 776 students who are enrolled in schools in New Hope, 149 (19.2%) attend a private institution, while the remaining 627 (80.8%) are enrolled in public schools. The age group of 15 to 17 year olds has the highest likelihood of being enrolled in private schools, with 16 (80.0% in the age bracket) enrolled. Conversely, the age group of 3 to 4 year olds has the lowest likelihood of being enrolled in a private school, with 136 (100.0% in the age bracket) attending a public institution.
| Age Bracket | Public School | Private School |
| 3 to 4 Year Olds | 136 (100.0%) | 0 (0.0%) |
| 5 to 9 Year Old | 154 (71.6%) | 61 (28.4%) |
| 10 to 14 Year Olds | 164 (69.5%) | 72 (30.5%) |
| 15 to 17 Year Olds | 4 (20.0%) | 16 (80.0%) |
| 18 to 19 Year Olds | 21 (100.0%) | 0 (0.0%) |
| 20 to 24 Year Olds | 98 (100.0%) | 0 (0.0%) |
| 25 to 34 Year Olds | 47 (100.0%) | 0 (0.0%) |
| 35 Years and over | 3 (100.0%) | 0 (0.0%) |
| Total | 627 (80.8%) | 149 (19.2%) |
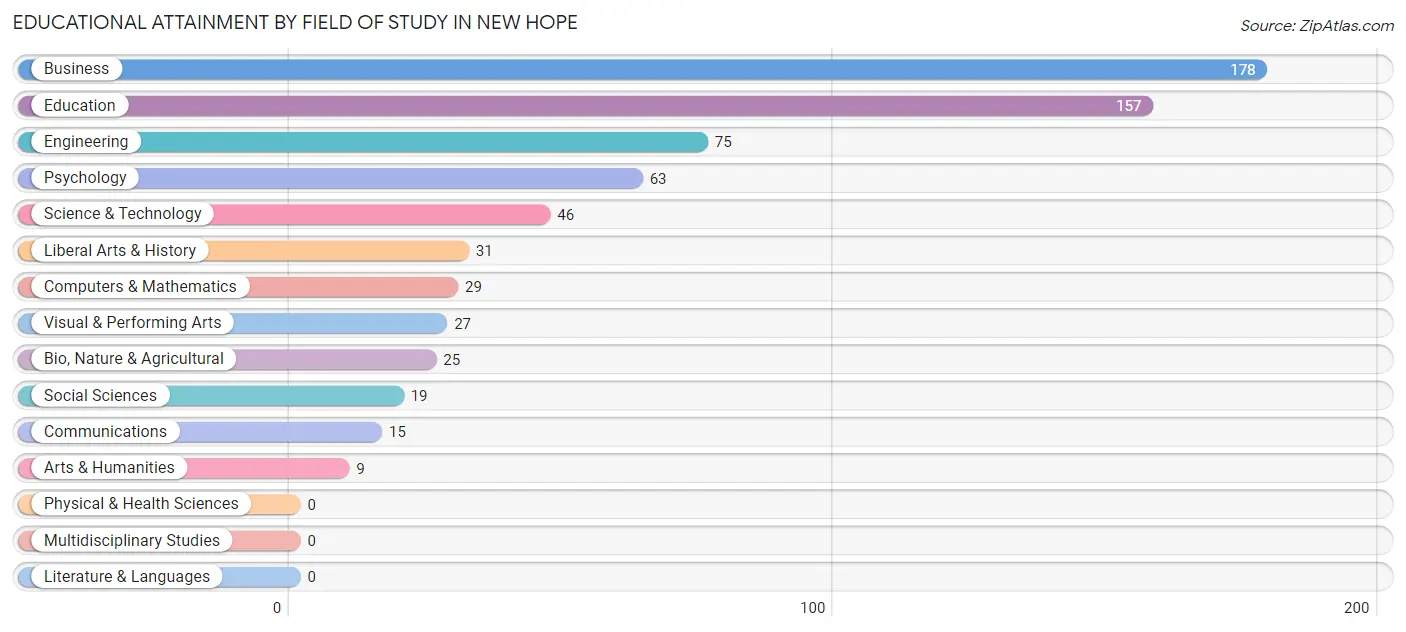
Educational Attainment by Field of Study in New Hope
Business (178 | 26.4%), education (157 | 23.3%), engineering (75 | 11.1%), psychology (63 | 9.3%), and science & technology (46 | 6.8%) are the most common fields of study among 674 individuals in New Hope who have obtained a bachelor's degree or higher.
| Field of Study | # Graduates | % Graduates |
| Computers & Mathematics | 29 | 4.3% |
| Bio, Nature & Agricultural | 25 | 3.7% |
| Physical & Health Sciences | 0 | 0.0% |
| Psychology | 63 | 9.3% |
| Social Sciences | 19 | 2.8% |
| Engineering | 75 | 11.1% |
| Multidisciplinary Studies | 0 | 0.0% |
| Science & Technology | 46 | 6.8% |
| Business | 178 | 26.4% |
| Education | 157 | 23.3% |
| Literature & Languages | 0 | 0.0% |
| Liberal Arts & History | 31 | 4.6% |
| Visual & Performing Arts | 27 | 4.0% |
| Communications | 15 | 2.2% |
| Arts & Humanities | 9 | 1.3% |
| Total | 674 | 100.0% |
Transportation & Commute in New Hope
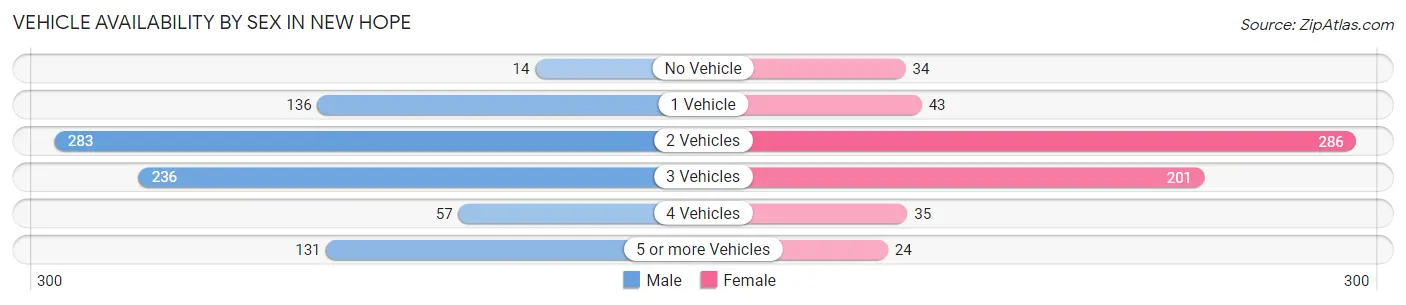
Vehicle Availability by Sex in New Hope
The most prevalent vehicle ownership categories in New Hope are males with 2 vehicles (283, accounting for 33.0%) and females with 2 vehicles (286, making up 45.4%).
| Vehicles Available | Male | Female |
| No Vehicle | 14 (1.6%) | 34 (5.5%) |
| 1 Vehicle | 136 (15.9%) | 43 (6.9%) |
| 2 Vehicles | 283 (33.0%) | 286 (45.9%) |
| 3 Vehicles | 236 (27.5%) | 201 (32.3%) |
| 4 Vehicles | 57 (6.7%) | 35 (5.6%) |
| 5 or more Vehicles | 131 (15.3%) | 24 (3.8%) |
| Total | 857 (100.0%) | 623 (100.0%) |
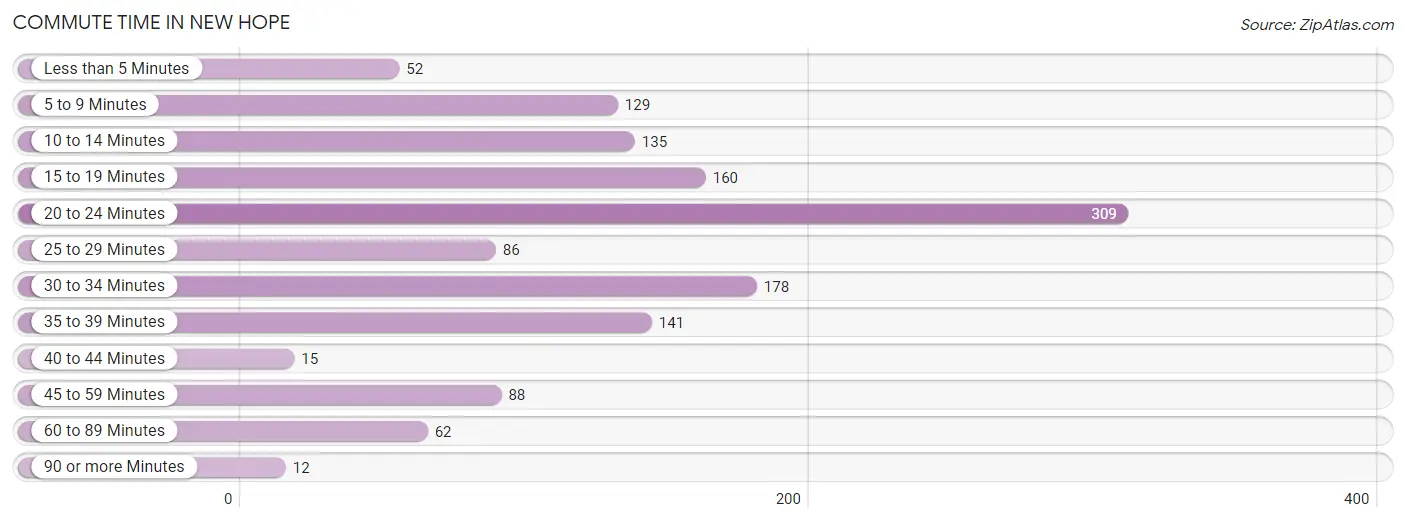
Commute Time in New Hope
The most frequently occuring commute durations in New Hope are 20 to 24 minutes (309 commuters, 22.6%), 30 to 34 minutes (178 commuters, 13.0%), and 15 to 19 minutes (160 commuters, 11.7%).
| Commute Time | # Commuters | % Commuters |
| Less than 5 Minutes | 52 | 3.8% |
| 5 to 9 Minutes | 129 | 9.4% |
| 10 to 14 Minutes | 135 | 9.9% |
| 15 to 19 Minutes | 160 | 11.7% |
| 20 to 24 Minutes | 309 | 22.6% |
| 25 to 29 Minutes | 86 | 6.3% |
| 30 to 34 Minutes | 178 | 13.0% |
| 35 to 39 Minutes | 141 | 10.3% |
| 40 to 44 Minutes | 15 | 1.1% |
| 45 to 59 Minutes | 88 | 6.4% |
| 60 to 89 Minutes | 62 | 4.5% |
| 90 or more Minutes | 12 | 0.9% |
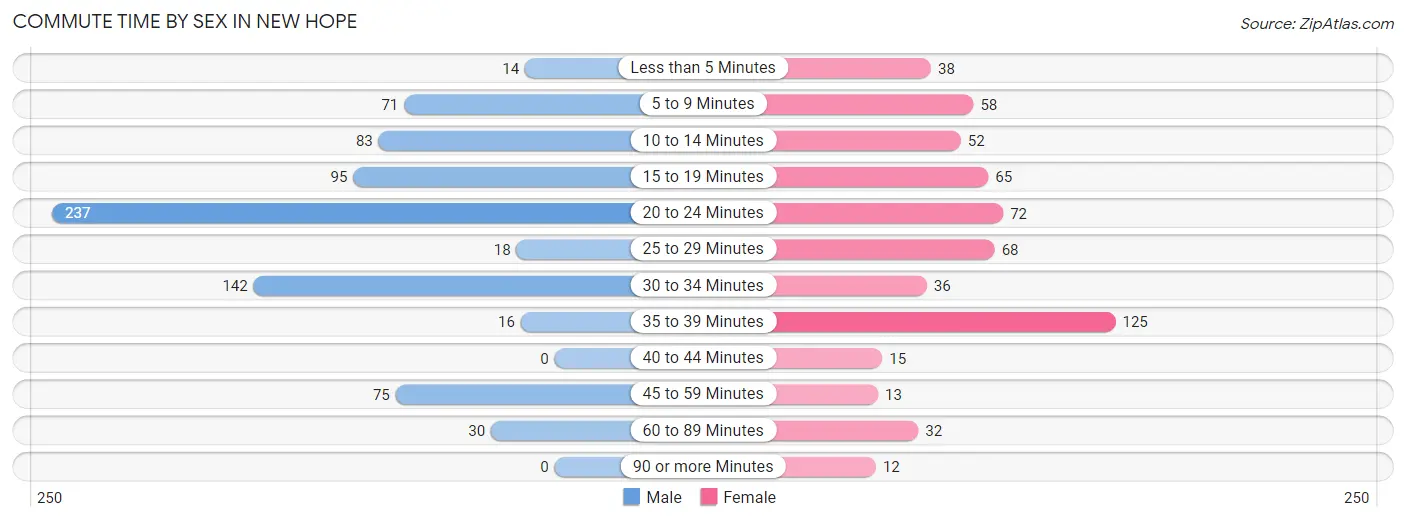
Commute Time by Sex in New Hope
The most common commute times in New Hope are 20 to 24 minutes (237 commuters, 30.3%) for males and 35 to 39 minutes (125 commuters, 21.3%) for females.
| Commute Time | Male | Female |
| Less than 5 Minutes | 14 (1.8%) | 38 (6.5%) |
| 5 to 9 Minutes | 71 (9.1%) | 58 (9.9%) |
| 10 to 14 Minutes | 83 (10.6%) | 52 (8.9%) |
| 15 to 19 Minutes | 95 (12.2%) | 65 (11.1%) |
| 20 to 24 Minutes | 237 (30.3%) | 72 (12.3%) |
| 25 to 29 Minutes | 18 (2.3%) | 68 (11.6%) |
| 30 to 34 Minutes | 142 (18.2%) | 36 (6.1%) |
| 35 to 39 Minutes | 16 (2.1%) | 125 (21.3%) |
| 40 to 44 Minutes | 0 (0.0%) | 15 (2.6%) |
| 45 to 59 Minutes | 75 (9.6%) | 13 (2.2%) |
| 60 to 89 Minutes | 30 (3.8%) | 32 (5.5%) |
| 90 or more Minutes | 0 (0.0%) | 12 (2.1%) |
Time of Departure to Work by Sex in New Hope
The most frequent times of departure to work in New Hope are 6:00 AM to 6:29 AM (207, 26.5%) for males and 7:00 AM to 7:29 AM (168, 28.7%) for females.
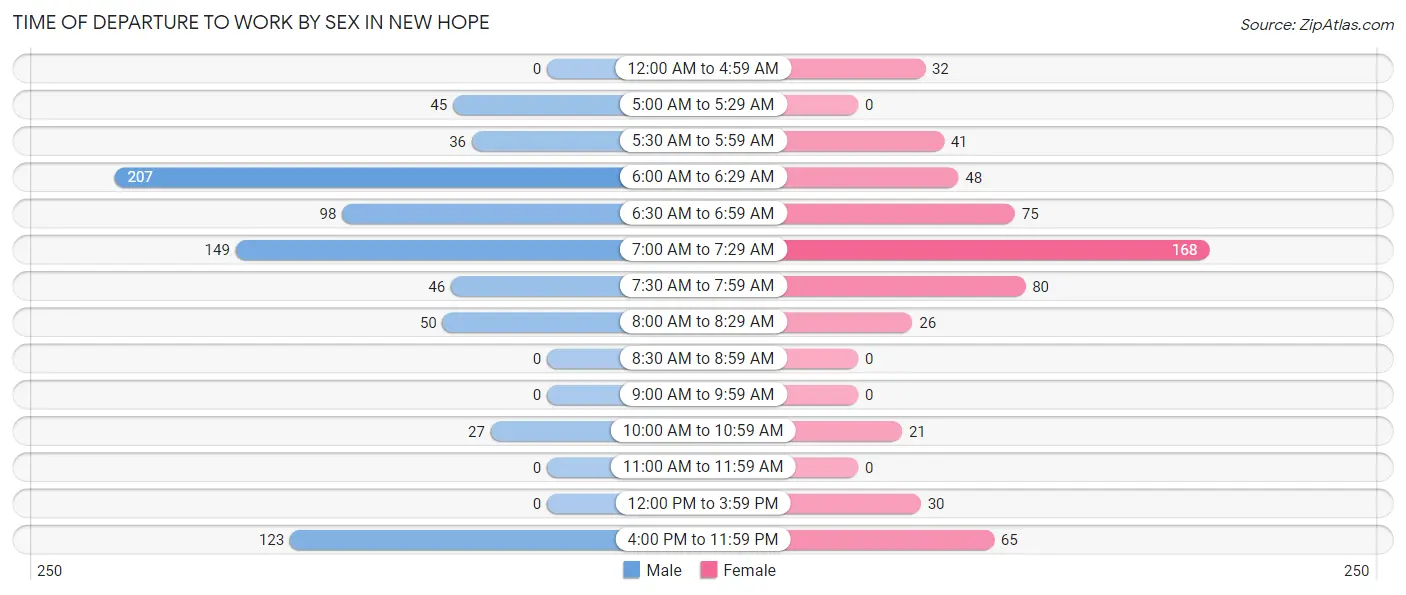
| Time of Departure | Male | Female |
| 12:00 AM to 4:59 AM | 0 (0.0%) | 32 (5.5%) |
| 5:00 AM to 5:29 AM | 45 (5.8%) | 0 (0.0%) |
| 5:30 AM to 5:59 AM | 36 (4.6%) | 41 (7.0%) |
| 6:00 AM to 6:29 AM | 207 (26.5%) | 48 (8.2%) |
| 6:30 AM to 6:59 AM | 98 (12.6%) | 75 (12.8%) |
| 7:00 AM to 7:29 AM | 149 (19.1%) | 168 (28.7%) |
| 7:30 AM to 7:59 AM | 46 (5.9%) | 80 (13.7%) |
| 8:00 AM to 8:29 AM | 50 (6.4%) | 26 (4.4%) |
| 8:30 AM to 8:59 AM | 0 (0.0%) | 0 (0.0%) |
| 9:00 AM to 9:59 AM | 0 (0.0%) | 0 (0.0%) |
| 10:00 AM to 10:59 AM | 27 (3.5%) | 21 (3.6%) |
| 11:00 AM to 11:59 AM | 0 (0.0%) | 0 (0.0%) |
| 12:00 PM to 3:59 PM | 0 (0.0%) | 30 (5.1%) |
| 4:00 PM to 11:59 PM | 123 (15.8%) | 65 (11.1%) |
| Total | 781 (100.0%) | 586 (100.0%) |
Housing Occupancy in New Hope
Occupancy by Ownership in New Hope
Of the total 1,052 dwellings in New Hope, owner-occupied units account for 896 (85.2%), while renter-occupied units make up 156 (14.8%).
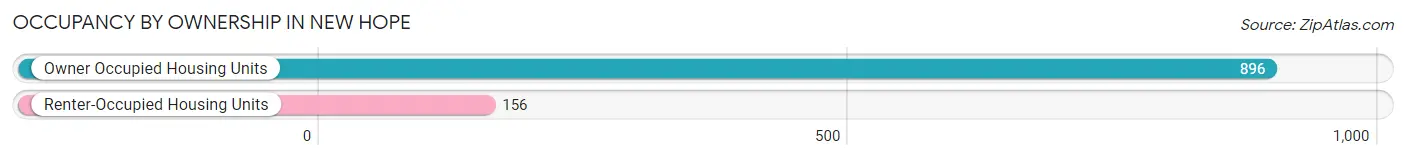
| Occupancy | # Housing Units | % Housing Units |
| Owner Occupied Housing Units | 896 | 85.2% |
| Renter-Occupied Housing Units | 156 | 14.8% |
| Total Occupied Housing Units | 1,052 | 100.0% |
Occupancy by Household Size in New Hope
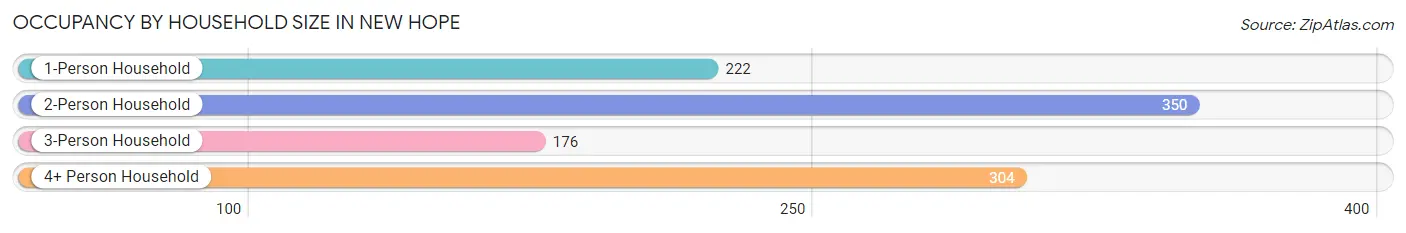
| Household Size | # Housing Units | % Housing Units |
| 1-Person Household | 222 | 21.1% |
| 2-Person Household | 350 | 33.3% |
| 3-Person Household | 176 | 16.7% |
| 4+ Person Household | 304 | 28.9% |
| Total Housing Units | 1,052 | 100.0% |
Occupancy by Ownership by Household Size in New Hope
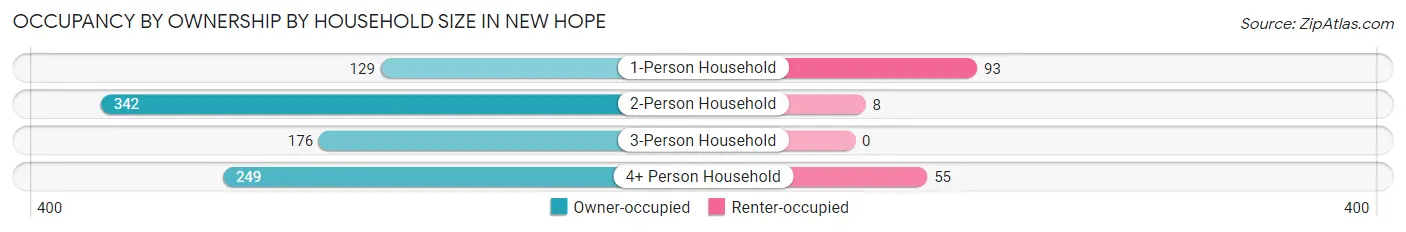
| Household Size | Owner-occupied | Renter-occupied |
| 1-Person Household | 129 (58.1%) | 93 (41.9%) |
| 2-Person Household | 342 (97.7%) | 8 (2.3%) |
| 3-Person Household | 176 (100.0%) | 0 (0.0%) |
| 4+ Person Household | 249 (81.9%) | 55 (18.1%) |
| Total Housing Units | 896 (85.2%) | 156 (14.8%) |
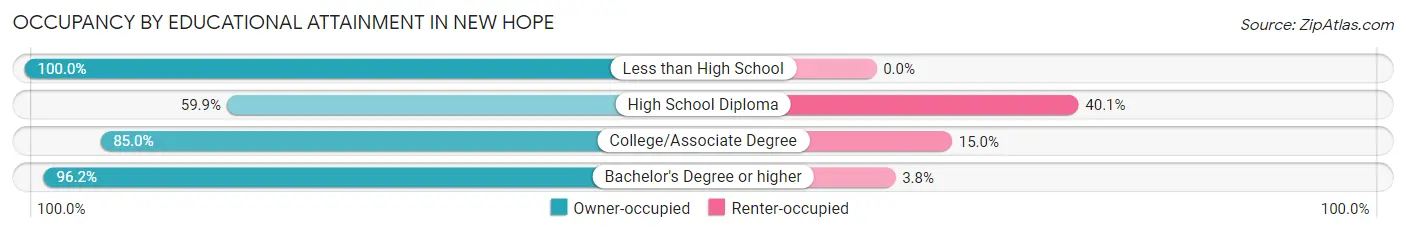
Occupancy by Educational Attainment in New Hope
| Household Size | Owner-occupied | Renter-occupied |
| Less than High School | 78 (100.0%) | 0 (0.0%) |
| High School Diploma | 130 (59.9%) | 87 (40.1%) |
| College/Associate Degree | 306 (85.0%) | 54 (15.0%) |
| Bachelor's Degree or higher | 382 (96.2%) | 15 (3.8%) |
Occupancy by Age of Householder in New Hope
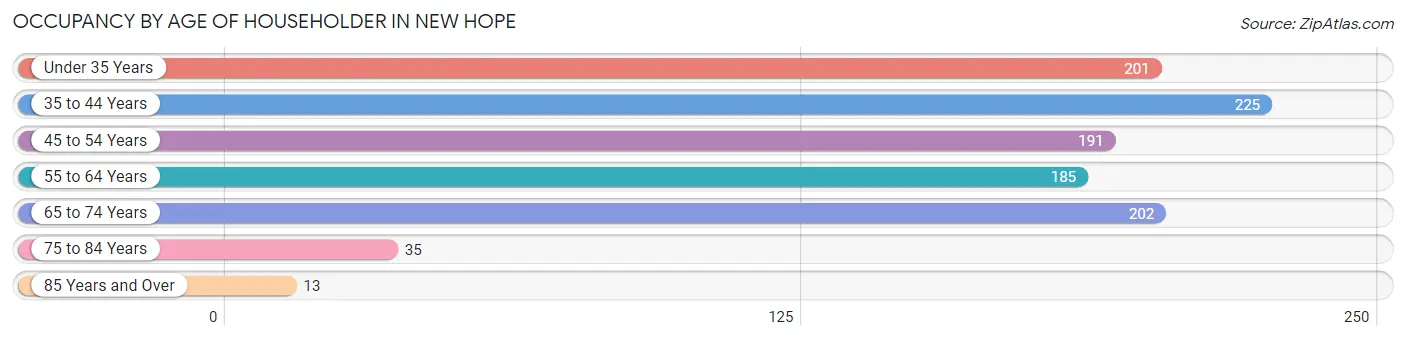
| Age Bracket | # Households | % Households |
| Under 35 Years | 201 | 19.1% |
| 35 to 44 Years | 225 | 21.4% |
| 45 to 54 Years | 191 | 18.2% |
| 55 to 64 Years | 185 | 17.6% |
| 65 to 74 Years | 202 | 19.2% |
| 75 to 84 Years | 35 | 3.3% |
| 85 Years and Over | 13 | 1.2% |
| Total | 1,052 | 100.0% |
Housing Finances in New Hope
Median Income by Occupancy in New Hope
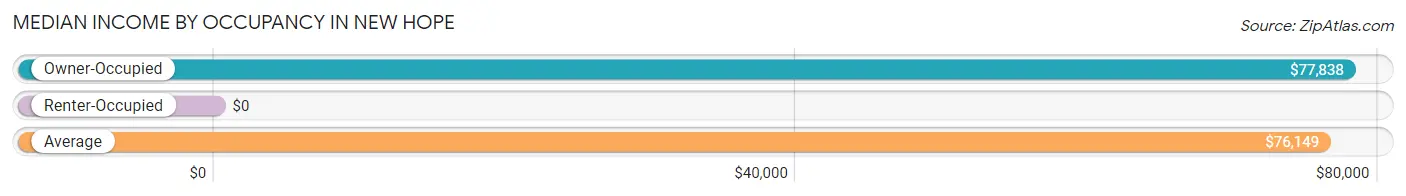
| Occupancy Type | # Households | Median Income |
| Owner-Occupied | 896 (85.2%) | $77,838 |
| Renter-Occupied | 156 (14.8%) | $0 |
| Average | 1,052 (100.0%) | $76,149 |
Occupancy by Householder Income Bracket in New Hope
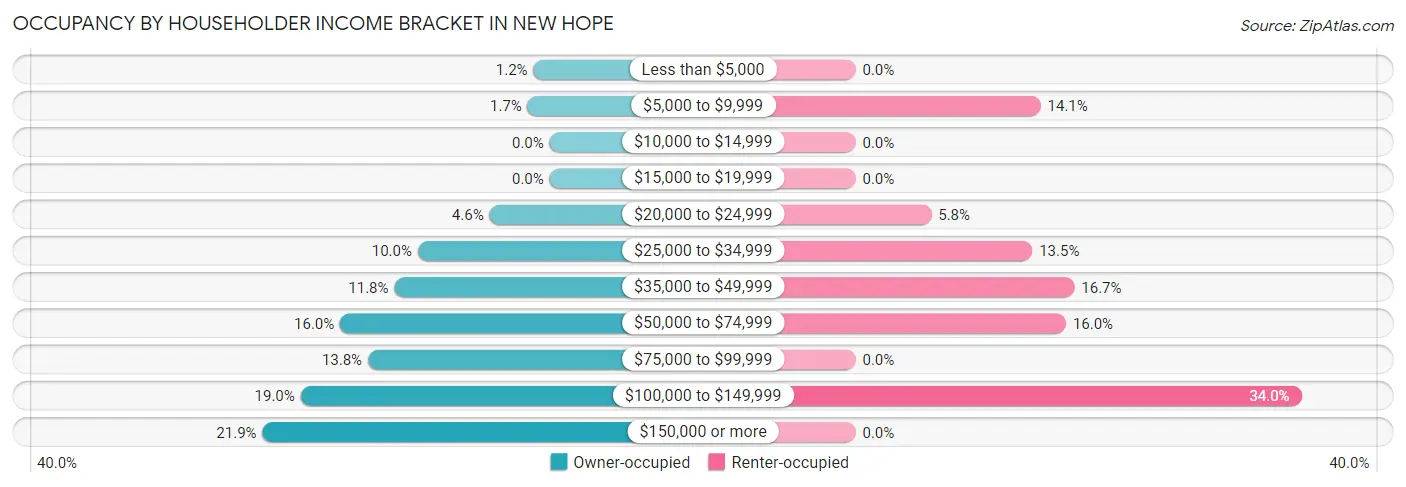
| Income Bracket | Owner-occupied | Renter-occupied |
| Less than $5,000 | 11 (1.2%) | 0 (0.0%) |
| $5,000 to $9,999 | 15 (1.7%) | 22 (14.1%) |
| $10,000 to $14,999 | 0 (0.0%) | 0 (0.0%) |
| $15,000 to $19,999 | 0 (0.0%) | 0 (0.0%) |
| $20,000 to $24,999 | 41 (4.6%) | 9 (5.8%) |
| $25,000 to $34,999 | 90 (10.0%) | 21 (13.5%) |
| $35,000 to $49,999 | 106 (11.8%) | 26 (16.7%) |
| $50,000 to $74,999 | 143 (16.0%) | 25 (16.0%) |
| $75,000 to $99,999 | 124 (13.8%) | 0 (0.0%) |
| $100,000 to $149,999 | 170 (19.0%) | 53 (34.0%) |
| $150,000 or more | 196 (21.9%) | 0 (0.0%) |
| Total | 896 (100.0%) | 156 (100.0%) |
Monthly Housing Cost Tiers in New Hope
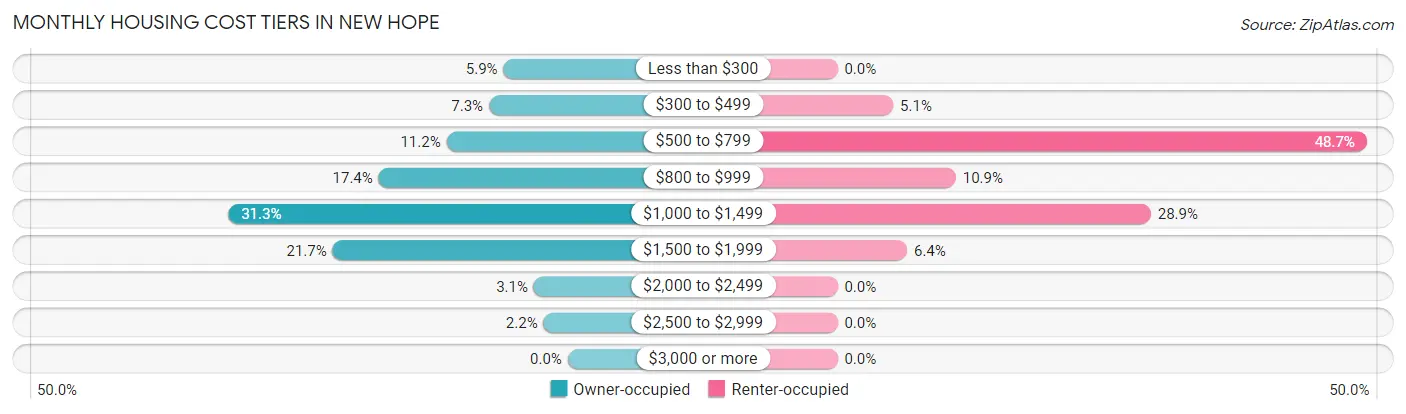
| Monthly Cost | Owner-occupied | Renter-occupied |
| Less than $300 | 53 (5.9%) | 0 (0.0%) |
| $300 to $499 | 65 (7.2%) | 8 (5.1%) |
| $500 to $799 | 100 (11.2%) | 76 (48.7%) |
| $800 to $999 | 156 (17.4%) | 17 (10.9%) |
| $1,000 to $1,499 | 280 (31.2%) | 45 (28.8%) |
| $1,500 to $1,999 | 194 (21.6%) | 10 (6.4%) |
| $2,000 to $2,499 | 28 (3.1%) | 0 (0.0%) |
| $2,500 to $2,999 | 20 (2.2%) | 0 (0.0%) |
| $3,000 or more | 0 (0.0%) | 0 (0.0%) |
| Total | 896 (100.0%) | 156 (100.0%) |
Physical Housing Characteristics in New Hope
Housing Structures in New Hope
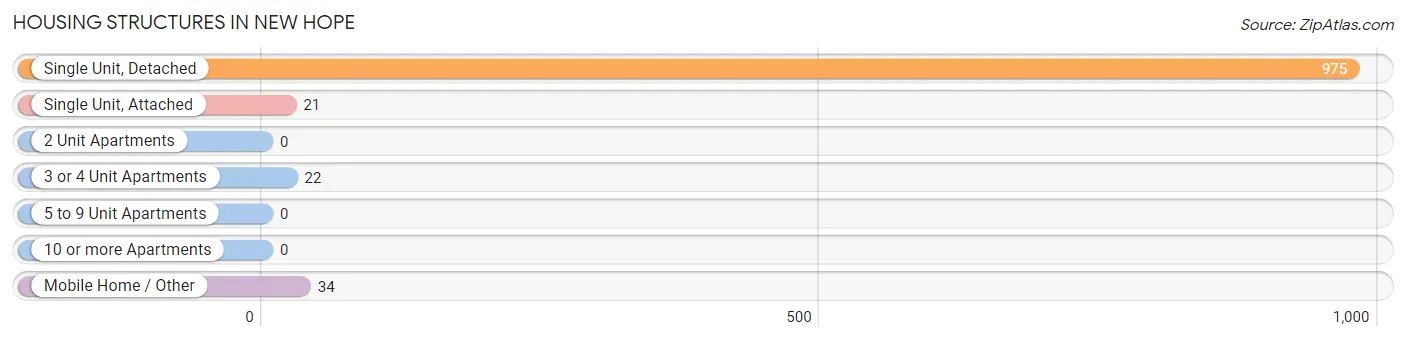
| Structure Type | # Housing Units | % Housing Units |
| Single Unit, Detached | 975 | 92.7% |
| Single Unit, Attached | 21 | 2.0% |
| 2 Unit Apartments | 0 | 0.0% |
| 3 or 4 Unit Apartments | 22 | 2.1% |
| 5 to 9 Unit Apartments | 0 | 0.0% |
| 10 or more Apartments | 0 | 0.0% |
| Mobile Home / Other | 34 | 3.2% |
| Total | 1,052 | 100.0% |
Housing Structures by Occupancy in New Hope
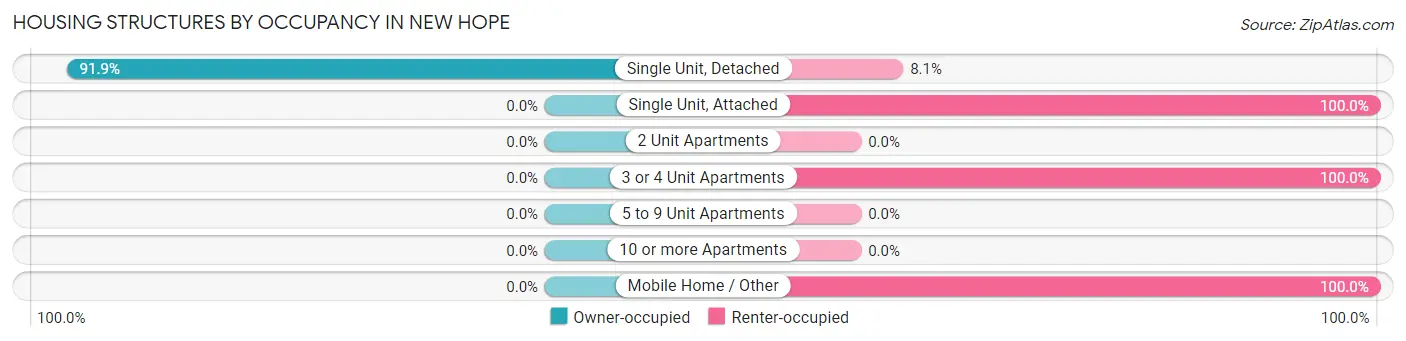
| Structure Type | Owner-occupied | Renter-occupied |
| Single Unit, Detached | 896 (91.9%) | 79 (8.1%) |
| Single Unit, Attached | 0 (0.0%) | 21 (100.0%) |
| 2 Unit Apartments | 0 (0.0%) | 0 (0.0%) |
| 3 or 4 Unit Apartments | 0 (0.0%) | 22 (100.0%) |
| 5 to 9 Unit Apartments | 0 (0.0%) | 0 (0.0%) |
| 10 or more Apartments | 0 (0.0%) | 0 (0.0%) |
| Mobile Home / Other | 0 (0.0%) | 34 (100.0%) |
| Total | 896 (85.2%) | 156 (14.8%) |
Housing Structures by Number of Rooms in New Hope
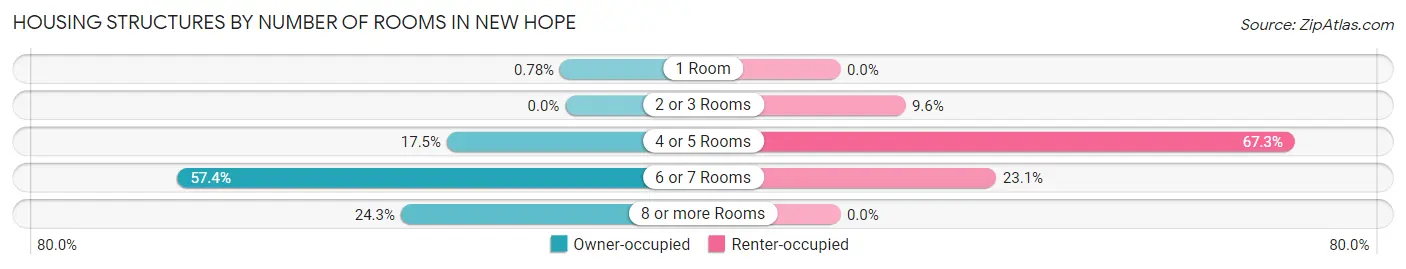
| Number of Rooms | Owner-occupied | Renter-occupied |
| 1 Room | 7 (0.8%) | 0 (0.0%) |
| 2 or 3 Rooms | 0 (0.0%) | 15 (9.6%) |
| 4 or 5 Rooms | 157 (17.5%) | 105 (67.3%) |
| 6 or 7 Rooms | 514 (57.4%) | 36 (23.1%) |
| 8 or more Rooms | 218 (24.3%) | 0 (0.0%) |
| Total | 896 (100.0%) | 156 (100.0%) |
Housing Structure by Heating Type in New Hope
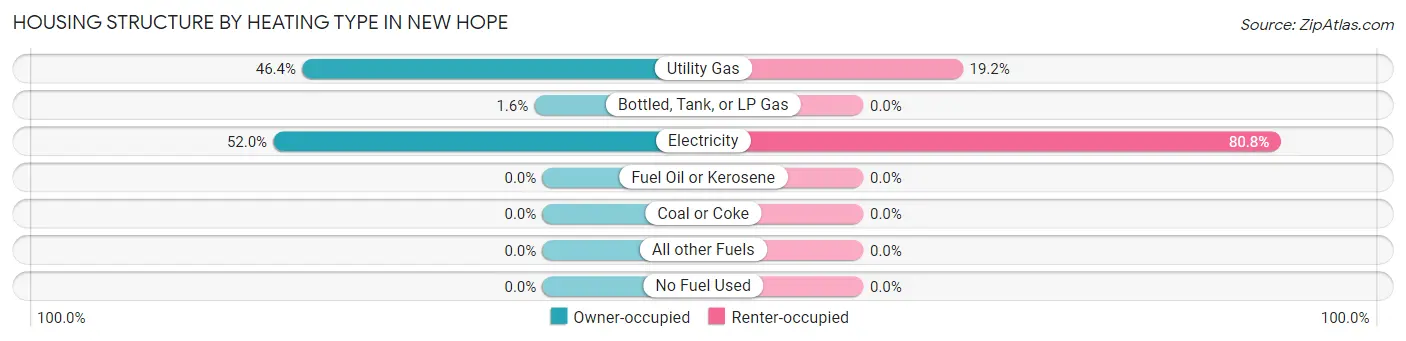
| Heating Type | Owner-occupied | Renter-occupied |
| Utility Gas | 416 (46.4%) | 30 (19.2%) |
| Bottled, Tank, or LP Gas | 14 (1.6%) | 0 (0.0%) |
| Electricity | 466 (52.0%) | 126 (80.8%) |
| Fuel Oil or Kerosene | 0 (0.0%) | 0 (0.0%) |
| Coal or Coke | 0 (0.0%) | 0 (0.0%) |
| All other Fuels | 0 (0.0%) | 0 (0.0%) |
| No Fuel Used | 0 (0.0%) | 0 (0.0%) |
| Total | 896 (100.0%) | 156 (100.0%) |
Household Vehicle Usage in New Hope
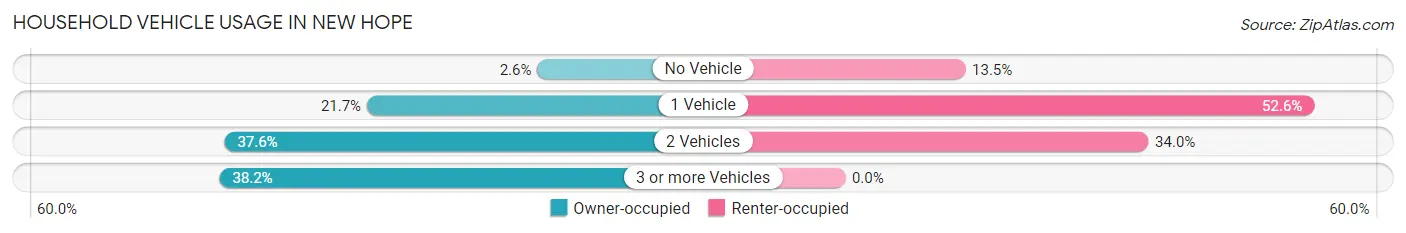
| Vehicles per Household | Owner-occupied | Renter-occupied |
| No Vehicle | 23 (2.6%) | 21 (13.5%) |
| 1 Vehicle | 194 (21.6%) | 82 (52.6%) |
| 2 Vehicles | 337 (37.6%) | 53 (34.0%) |
| 3 or more Vehicles | 342 (38.2%) | 0 (0.0%) |
| Total | 896 (100.0%) | 156 (100.0%) |
Real Estate & Mortgages in New Hope
Real Estate and Mortgage Overview in New Hope
| Characteristic | Without Mortgage | With Mortgage |
| Housing Units | 204 | 692 |
| Median Property Value | $185,600 | $200,500 |
| Median Household Income | $51,250 | $186 |
| Monthly Housing Costs | $411 | $0 |
| Real Estate Taxes | $967 | $31 |
Property Value by Mortgage Status in New Hope
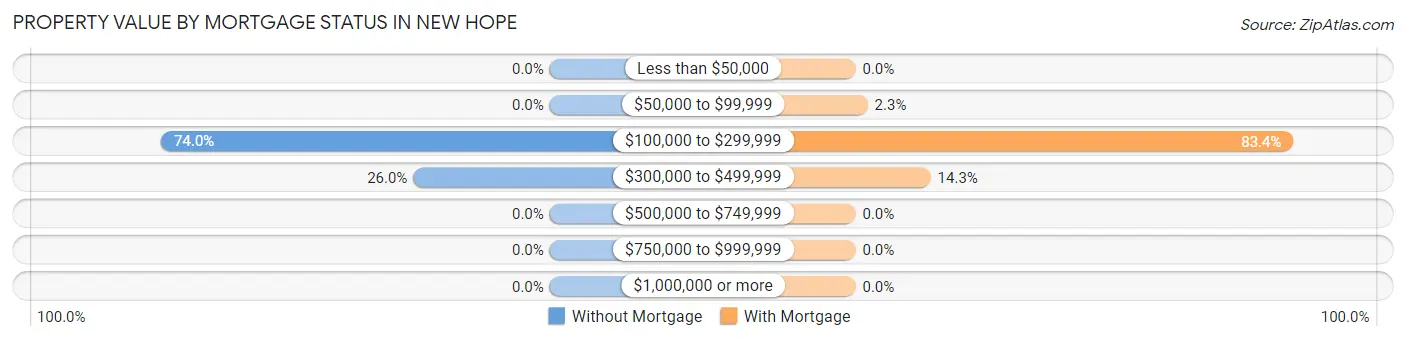
| Property Value | Without Mortgage | With Mortgage |
| Less than $50,000 | 0 (0.0%) | 0 (0.0%) |
| $50,000 to $99,999 | 0 (0.0%) | 16 (2.3%) |
| $100,000 to $299,999 | 151 (74.0%) | 577 (83.4%) |
| $300,000 to $499,999 | 53 (26.0%) | 99 (14.3%) |
| $500,000 to $749,999 | 0 (0.0%) | 0 (0.0%) |
| $750,000 to $999,999 | 0 (0.0%) | 0 (0.0%) |
| $1,000,000 or more | 0 (0.0%) | 0 (0.0%) |
| Total | 204 (100.0%) | 692 (100.0%) |
Household Income by Mortgage Status in New Hope
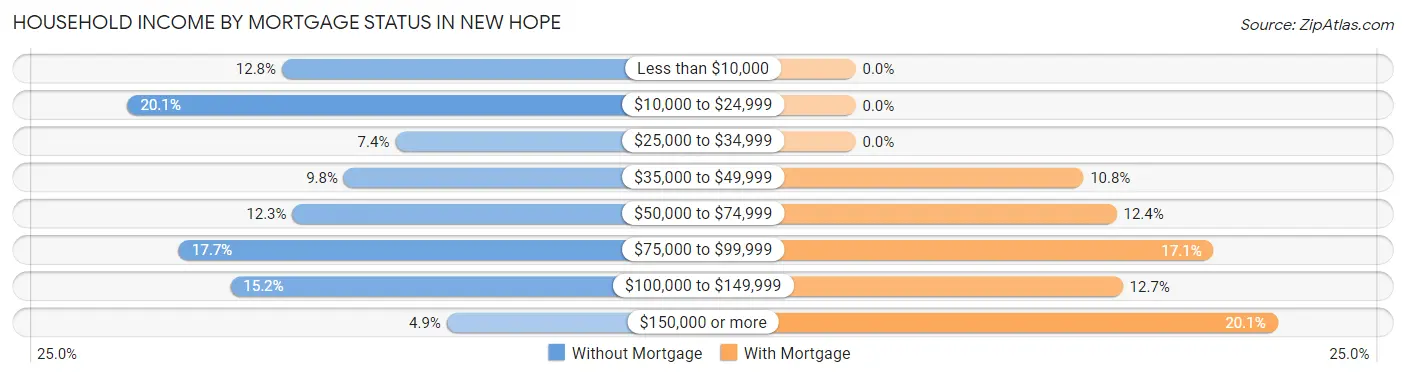
| Household Income | Without Mortgage | With Mortgage |
| Less than $10,000 | 26 (12.8%) | 0 (0.0%) |
| $10,000 to $24,999 | 41 (20.1%) | 0 (0.0%) |
| $25,000 to $34,999 | 15 (7.3%) | 0 (0.0%) |
| $35,000 to $49,999 | 20 (9.8%) | 75 (10.8%) |
| $50,000 to $74,999 | 25 (12.2%) | 86 (12.4%) |
| $75,000 to $99,999 | 36 (17.6%) | 118 (17.1%) |
| $100,000 to $149,999 | 31 (15.2%) | 88 (12.7%) |
| $150,000 or more | 10 (4.9%) | 139 (20.1%) |
| Total | 204 (100.0%) | 692 (100.0%) |
Property Value to Household Income Ratio in New Hope
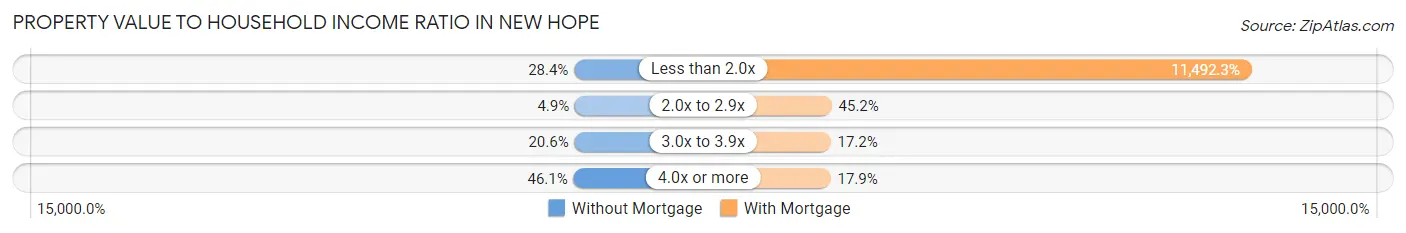
| Value-to-Income Ratio | Without Mortgage | With Mortgage |
| Less than 2.0x | 58 (28.4%) | 79,527 (11,492.3%) |
| 2.0x to 2.9x | 10 (4.9%) | 313 (45.2%) |
| 3.0x to 3.9x | 42 (20.6%) | 119 (17.2%) |
| 4.0x or more | 94 (46.1%) | 124 (17.9%) |
| Total | 204 (100.0%) | 692 (100.0%) |
Real Estate Taxes by Mortgage Status in New Hope
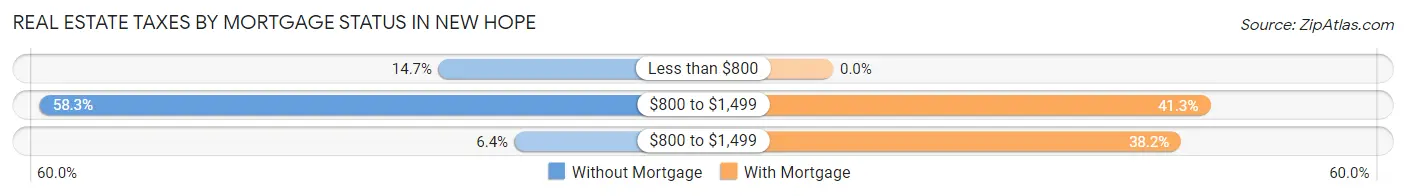
| Property Taxes | Without Mortgage | With Mortgage |
| Less than $800 | 30 (14.7%) | 0 (0.0%) |
| $800 to $1,499 | 119 (58.3%) | 286 (41.3%) |
| $800 to $1,499 | 13 (6.4%) | 264 (38.2%) |
| Total | 204 (100.0%) | 692 (100.0%) |
Health & Disability in New Hope
Health Insurance Coverage by Age in New Hope
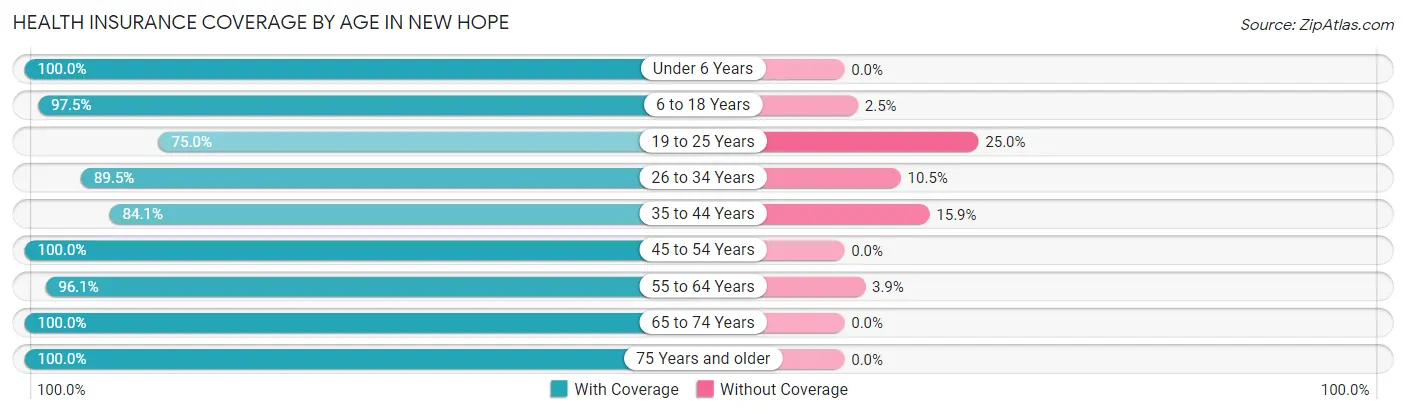
| Age Bracket | With Coverage | Without Coverage |
| Under 6 Years | 353 (100.0%) | 0 (0.0%) |
| 6 to 18 Years | 424 (97.5%) | 11 (2.5%) |
| 19 to 25 Years | 153 (75.0%) | 51 (25.0%) |
| 26 to 34 Years | 298 (89.5%) | 35 (10.5%) |
| 35 to 44 Years | 488 (84.1%) | 92 (15.9%) |
| 45 to 54 Years | 368 (100.0%) | 0 (0.0%) |
| 55 to 64 Years | 273 (96.1%) | 11 (3.9%) |
| 65 to 74 Years | 318 (100.0%) | 0 (0.0%) |
| 75 Years and older | 93 (100.0%) | 0 (0.0%) |
| Total | 2,768 (93.3%) | 200 (6.7%) |
Health Insurance Coverage by Citizenship Status in New Hope
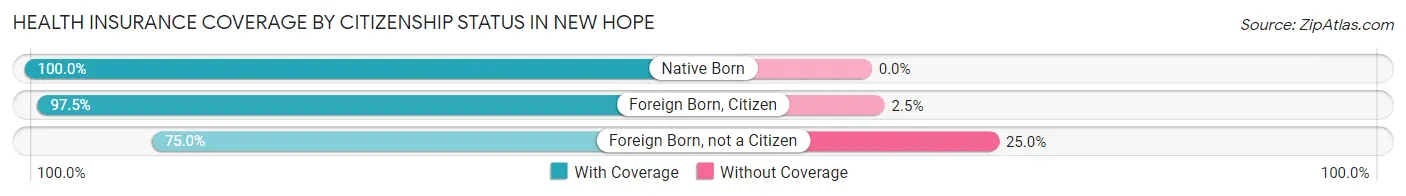
| Citizenship Status | With Coverage | Without Coverage |
| Native Born | 353 (100.0%) | 0 (0.0%) |
| Foreign Born, Citizen | 424 (97.5%) | 11 (2.5%) |
| Foreign Born, not a Citizen | 153 (75.0%) | 51 (25.0%) |
Health Insurance Coverage by Household Income in New Hope
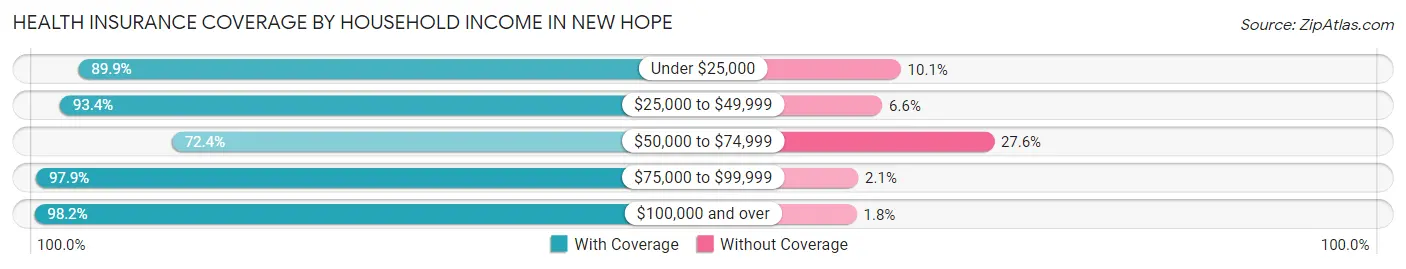
| Household Income | With Coverage | Without Coverage |
| Under $25,000 | 98 (89.9%) | 11 (10.1%) |
| $25,000 to $49,999 | 494 (93.4%) | 35 (6.6%) |
| $50,000 to $74,999 | 310 (72.4%) | 118 (27.6%) |
| $75,000 to $99,999 | 321 (97.9%) | 7 (2.1%) |
| $100,000 and over | 1,544 (98.2%) | 29 (1.8%) |
Public vs Private Health Insurance Coverage by Age in New Hope
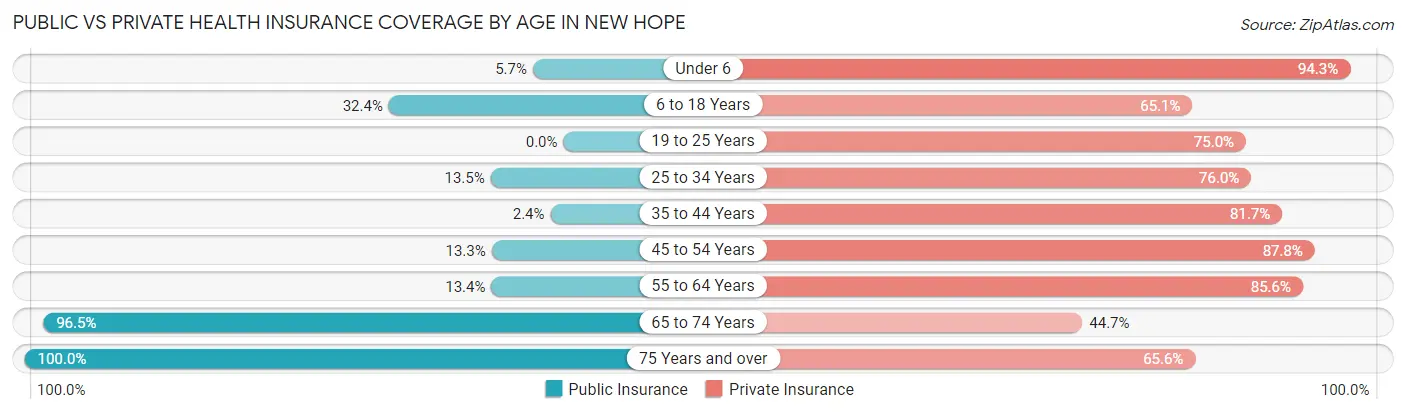
| Age Bracket | Public Insurance | Private Insurance |
| Under 6 | 20 (5.7%) | 333 (94.3%) |
| 6 to 18 Years | 141 (32.4%) | 283 (65.1%) |
| 19 to 25 Years | 0 (0.0%) | 153 (75.0%) |
| 25 to 34 Years | 45 (13.5%) | 253 (76.0%) |
| 35 to 44 Years | 14 (2.4%) | 474 (81.7%) |
| 45 to 54 Years | 49 (13.3%) | 323 (87.8%) |
| 55 to 64 Years | 38 (13.4%) | 243 (85.6%) |
| 65 to 74 Years | 307 (96.5%) | 142 (44.7%) |
| 75 Years and over | 93 (100.0%) | 61 (65.6%) |
| Total | 707 (23.8%) | 2,265 (76.3%) |
Disability Status by Sex by Age in New Hope
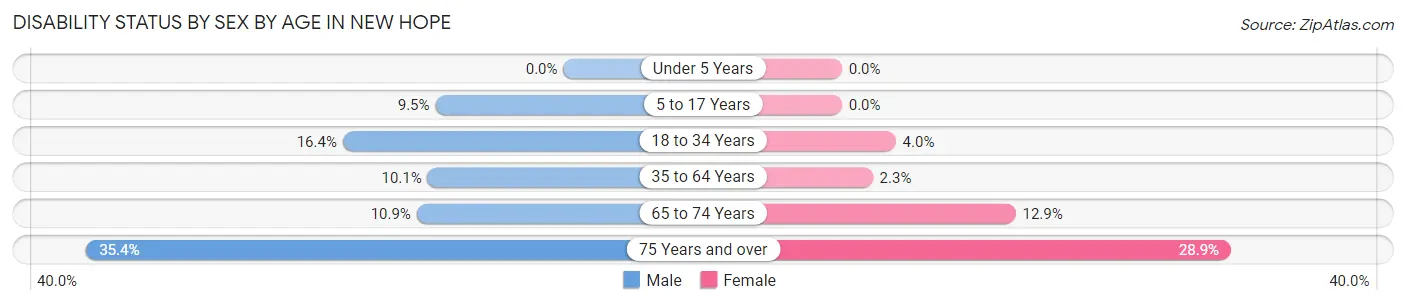
| Age Bracket | Male | Female |
| Under 5 Years | 0 (0.0%) | 0 (0.0%) |
| 5 to 17 Years | 19 (9.5%) | 0 (0.0%) |
| 18 to 34 Years | 57 (16.4%) | 8 (4.0%) |
| 35 to 64 Years | 67 (10.1%) | 13 (2.3%) |
| 65 to 74 Years | 11 (10.9%) | 28 (12.9%) |
| 75 Years and over | 17 (35.4%) | 13 (28.9%) |
Disability Class by Sex by Age in New Hope
Disability Class: Hearing Difficulty
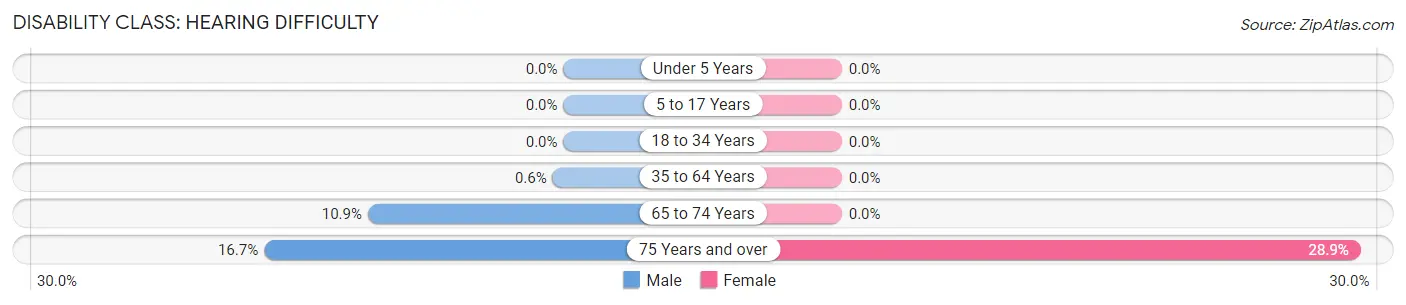
| Age Bracket | Male | Female |
| Under 5 Years | 0 (0.0%) | 0 (0.0%) |
| 5 to 17 Years | 0 (0.0%) | 0 (0.0%) |
| 18 to 34 Years | 0 (0.0%) | 0 (0.0%) |
| 35 to 64 Years | 4 (0.6%) | 0 (0.0%) |
| 65 to 74 Years | 11 (10.9%) | 0 (0.0%) |
| 75 Years and over | 8 (16.7%) | 13 (28.9%) |
Disability Class: Vision Difficulty
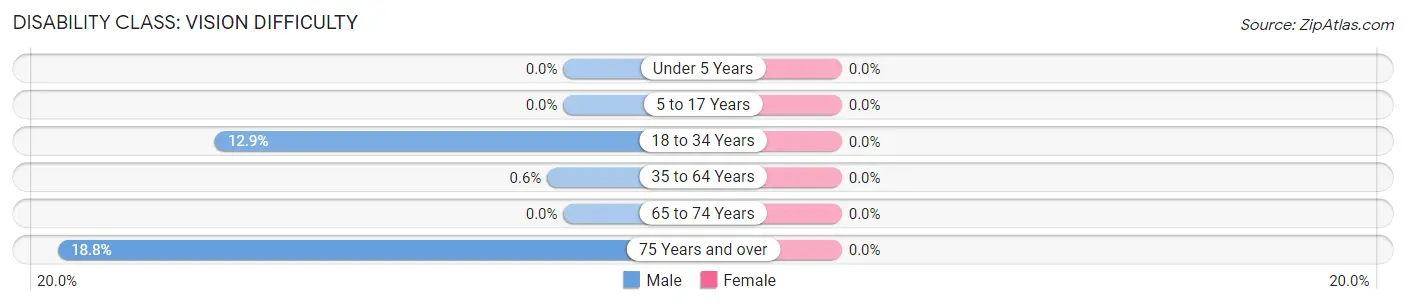
| Age Bracket | Male | Female |
| Under 5 Years | 0 (0.0%) | 0 (0.0%) |
| 5 to 17 Years | 0 (0.0%) | 0 (0.0%) |
| 18 to 34 Years | 45 (12.9%) | 0 (0.0%) |
| 35 to 64 Years | 4 (0.6%) | 0 (0.0%) |
| 65 to 74 Years | 0 (0.0%) | 0 (0.0%) |
| 75 Years and over | 9 (18.8%) | 0 (0.0%) |
Disability Class: Cognitive Difficulty
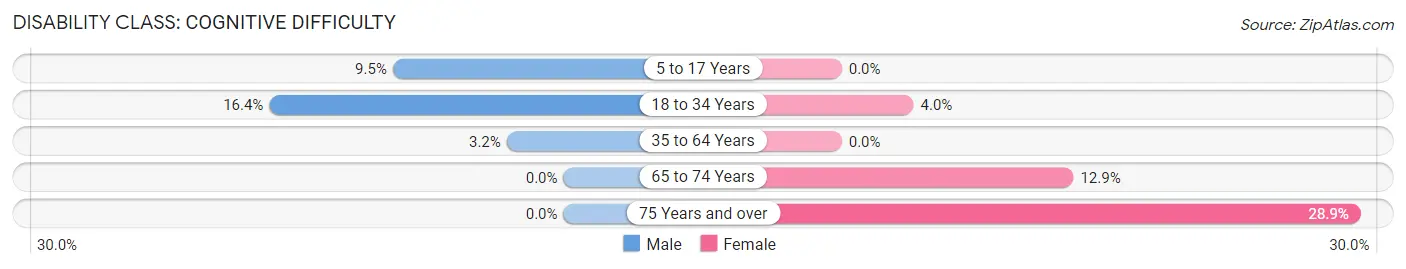
| Age Bracket | Male | Female |
| 5 to 17 Years | 19 (9.5%) | 0 (0.0%) |
| 18 to 34 Years | 57 (16.4%) | 8 (4.0%) |
| 35 to 64 Years | 21 (3.2%) | 0 (0.0%) |
| 65 to 74 Years | 0 (0.0%) | 28 (12.9%) |
| 75 Years and over | 0 (0.0%) | 13 (28.9%) |
Disability Class: Ambulatory Difficulty
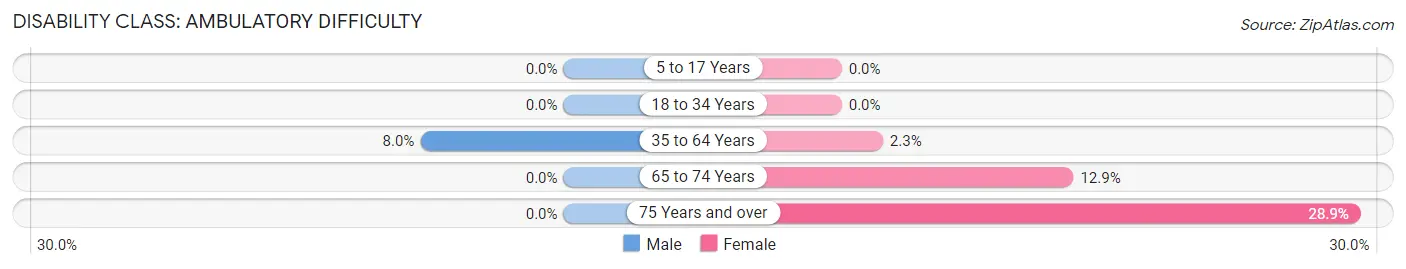
| Age Bracket | Male | Female |
| 5 to 17 Years | 0 (0.0%) | 0 (0.0%) |
| 18 to 34 Years | 0 (0.0%) | 0 (0.0%) |
| 35 to 64 Years | 53 (8.0%) | 13 (2.3%) |
| 65 to 74 Years | 0 (0.0%) | 28 (12.9%) |
| 75 Years and over | 0 (0.0%) | 13 (28.9%) |
Disability Class: Self-Care Difficulty
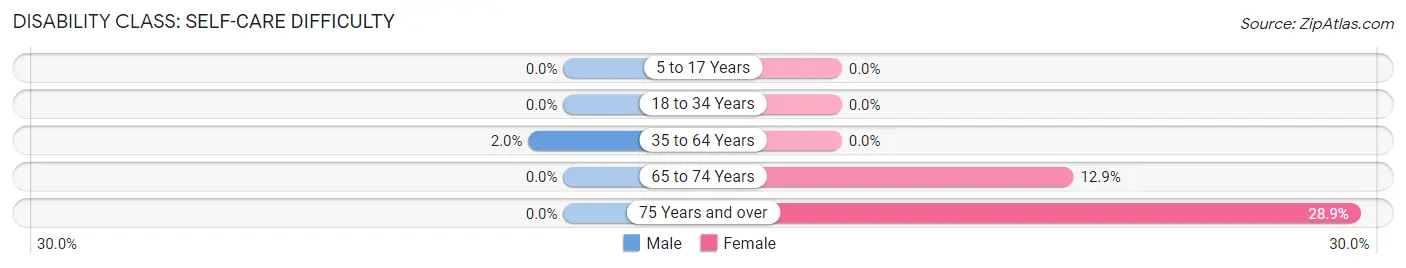
| Age Bracket | Male | Female |
| 5 to 17 Years | 0 (0.0%) | 0 (0.0%) |
| 18 to 34 Years | 0 (0.0%) | 0 (0.0%) |
| 35 to 64 Years | 13 (1.9%) | 0 (0.0%) |
| 65 to 74 Years | 0 (0.0%) | 28 (12.9%) |
| 75 Years and over | 0 (0.0%) | 13 (28.9%) |
Technology Access in New Hope
Computing Device Access in New Hope
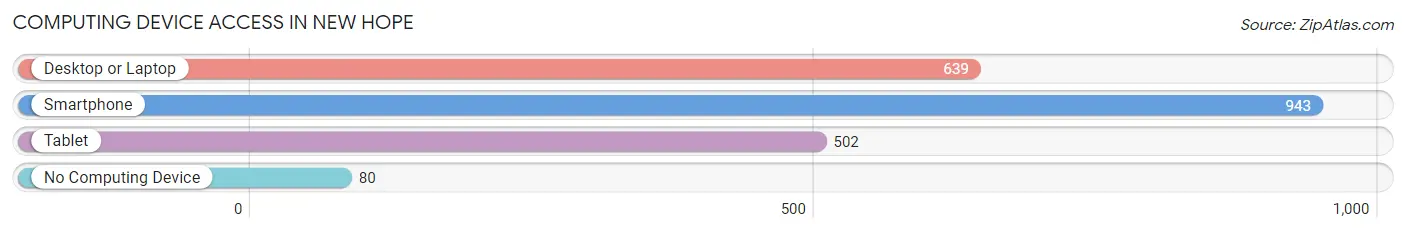
| Device Type | # Households | % Households |
| Desktop or Laptop | 639 | 60.7% |
| Smartphone | 943 | 89.6% |
| Tablet | 502 | 47.7% |
| No Computing Device | 80 | 7.6% |
| Total | 1,052 | 100.0% |
Internet Access in New Hope
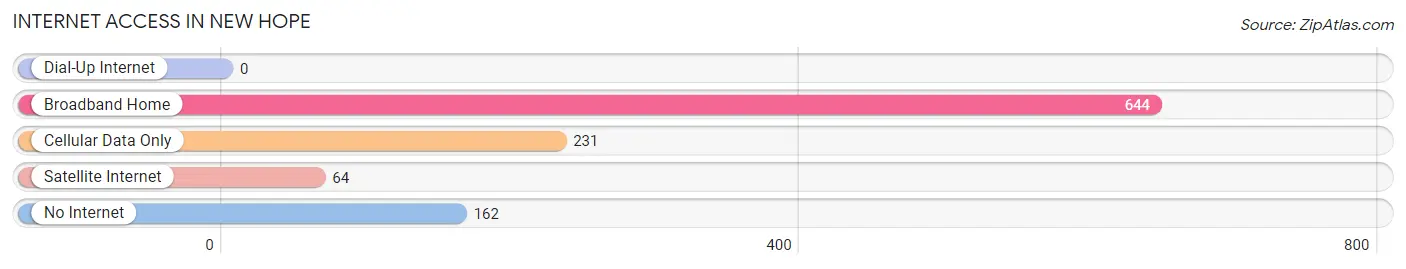
| Internet Type | # Households | % Households |
| Dial-Up Internet | 0 | 0.0% |
| Broadband Home | 644 | 61.2% |
| Cellular Data Only | 231 | 22.0% |
| Satellite Internet | 64 | 6.1% |
| No Internet | 162 | 15.4% |
| Total | 1,052 | 100.0% |
New Hope Summary
New Hope is a small town located in the state of Mississippi, United States. It is situated in the northern part of the state, in Marshall County. The town was founded in 1837 and has a population of approximately 1,000 people.
History
New Hope was founded in 1837 by a group of settlers from North Carolina. The town was named after the nearby New Hope Church, which was established in 1836. The town was originally a farming community, but it soon developed into a small trading center. The town was incorporated in 1845 and was the county seat of Marshall County until 1858.
In the late 19th century, New Hope was a thriving community with a population of over 1,000 people. The town had several stores, a hotel, a bank, a post office, and a cotton gin. The town also had a school and a newspaper.
In the early 20th century, the town began to decline as the railroad bypassed it. The population decreased to around 500 people by the 1950s. In the late 20th century, the town began to experience a resurgence as new businesses opened and the population increased.
Geography
New Hope is located in the northern part of Mississippi, in Marshall County. The town is situated on the banks of the Tallahatchie River. The town is surrounded by rolling hills and forests. The climate is humid subtropical, with hot summers and mild winters.
Economy
The economy of New Hope is largely based on agriculture. The town is home to several farms that produce cotton, soybeans, corn, and other crops. The town also has several small businesses, including restaurants, stores, and a bank.
Demographics
As of the 2010 census, the population of New Hope was 1,000 people. The racial makeup of the town was 97.2% White, 0.7% African American, 0.3% Native American, 0.2% Asian, and 1.6% from other races. The median household income was $30,000 and the median family income was $35,000. The per capita income was $14,000.
Conclusion
New Hope is a small town located in the northern part of Mississippi. It was founded in 1837 and has a population of approximately 1,000 people. The town is largely agricultural, with several farms producing cotton, soybeans, corn, and other crops. The town also has several small businesses, including restaurants, stores, and a bank. The population of New Hope is mostly White, with a small percentage of African American, Native American, and Asian residents. The median household income is $30,000 and the median family income is $35,000.
Common Questions
What is the Total Population of New Hope?
Total Population of New Hope is 2,983.
What is the Total Male Population of New Hope?
Total Male Population of New Hope is 1,524.
What is the Total Female Population of New Hope?
Total Female Population of New Hope is 1,459.
What is the Ratio of Males per 100 Females in New Hope?
There are 104.46 Males per 100 Females in New Hope.
What is the Ratio of Females per 100 Males in New Hope?
There are 95.73 Females per 100 Males in New Hope.
What is the Median Population Age in New Hope?
Median Population Age in New Hope is 37.6 Years.
What is the Average Family Size in New Hope
Average Family Size in New Hope is 3.3 People.
What is the Average Household Size in New Hope
Average Household Size in New Hope is 2.8 People.
What is Per Capita Income in New Hope?
Per Capita income in New Hope is $36,150.
What is the Median Family Income in New Hope?
Median Family Income in New Hope is $88,125.
What is the Median Household income in New Hope?
Median Household Income in New Hope is $76,149.
What is Income or Wage Gap in New Hope?
Income or Wage Gap in New Hope is 27.6%.
Women in New Hope earn 72.4 cents for every dollar earned by a man.
What is Inequality or Gini Index in New Hope?
Inequality or Gini Index in New Hope is 0.40.
How Large is the Labor Force in New Hope?
There are 1,497 People in the Labor Forcein in New Hope.
What is the Percentage of People in the Labor Force in New Hope?
67.5% of People are in the Labor Force in New Hope.
What is the Unemployment Rate in New Hope?
Unemployment Rate in New Hope is 1.1%.