Zip Codes with the Highest Percentage of Population Employed in Transportation & Warehousing in Saint Louis, MO
RELATED REPORTS & OPTIONS
Transportation & Warehousing
Saint Louis
Compare Zip Codes
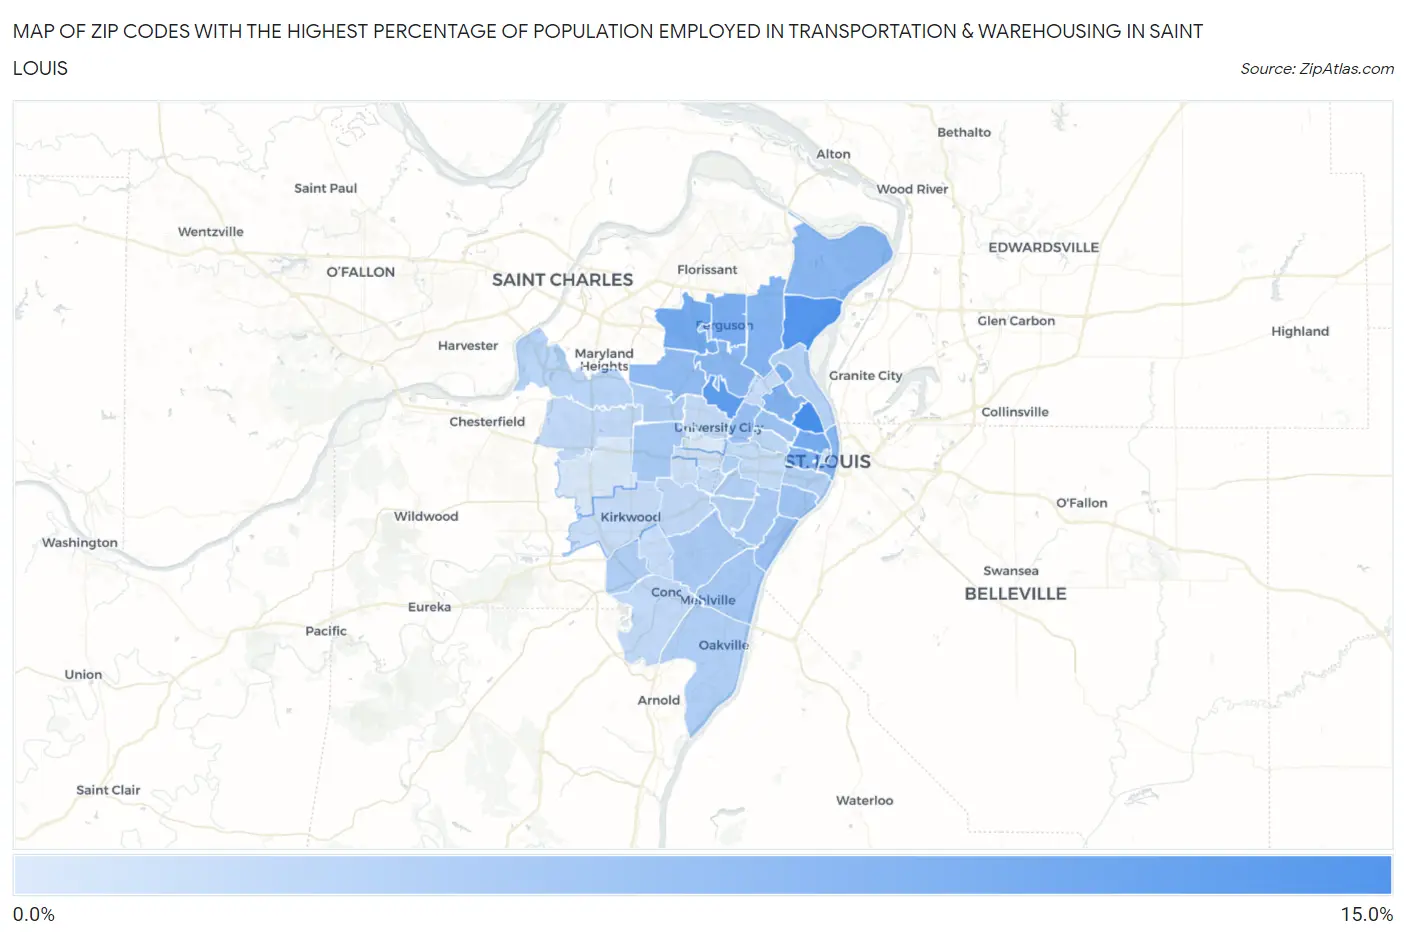
Map of Zip Codes with the Highest Percentage of Population Employed in Transportation & Warehousing in Saint Louis
0.0%
15.0%
Zip Codes with the Highest Percentage of Population Employed in Transportation & Warehousing in Saint Louis, MO
| Zip Code | % Employed | vs State | vs National | |
| 1. | 63107 | 13.6% | 5.0%(+8.68)#60 | 4.9%(+8.70)#1,361 |
| 2. | 63137 | 12.2% | 5.0%(+7.25)#76 | 4.9%(+7.27)#1,775 |
| 3. | 63133 | 11.5% | 5.0%(+6.48)#94 | 4.9%(+6.51)#2,093 |
| 4. | 63106 | 9.3% | 5.0%(+4.32)#148 | 4.9%(+4.35)#3,400 |
| 5. | 63134 | 9.2% | 5.0%(+4.21)#152 | 4.9%(+4.24)#3,498 |
| 6. | 63135 | 8.9% | 5.0%(+3.91)#165 | 4.9%(+3.94)#3,829 |
| 7. | 63103 | 8.3% | 5.0%(+3.32)#193 | 4.9%(+3.34)#4,524 |
| 8. | 63115 | 8.1% | 5.0%(+3.09)#204 | 4.9%(+3.12)#4,811 |
| 9. | 63136 | 7.8% | 5.0%(+2.86)#217 | 4.9%(+2.89)#5,134 |
| 10. | 63138 | 7.4% | 5.0%(+2.44)#238 | 4.9%(+2.47)#5,798 |
| 11. | 63121 | 7.3% | 5.0%(+2.33)#248 | 4.9%(+2.35)#6,005 |
| 12. | 63102 | 7.2% | 5.0%(+2.28)#255 | 4.9%(+2.30)#6,100 |
| 13. | 63114 | 6.8% | 5.0%(+1.84)#279 | 4.9%(+1.87)#6,934 |
| 14. | 63112 | 5.8% | 5.0%(+0.781)#355 | 4.9%(+0.808)#9,491 |
| 15. | 63111 | 5.7% | 5.0%(+0.752)#358 | 4.9%(+0.778)#9,589 |
| 16. | 63113 | 5.4% | 5.0%(+0.431)#390 | 4.9%(+0.457)#10,559 |
| 17. | 63118 | 5.2% | 5.0%(+0.235)#414 | 4.9%(+0.262)#11,210 |
| 18. | 63140 | 5.1% | 5.0%(+0.170)#420 | 4.9%(+0.197)#11,459 |
| 19. | 63125 | 5.0% | 5.0%(-0.005)#432 | 4.9%(+0.022)#12,039 |
| 20. | 63124 | 4.7% | 5.0%(-0.275)#470 | 4.9%(-0.248)#13,034 |
| 21. | 63123 | 4.4% | 5.0%(-0.606)#505 | 4.9%(-0.579)#14,304 |
| 22. | 63116 | 4.3% | 5.0%(-0.712)#517 | 4.9%(-0.686)#14,764 |
| 23. | 63127 | 4.0% | 5.0%(-0.945)#547 | 4.9%(-0.919)#15,773 |
| 24. | 63132 | 3.8% | 5.0%(-1.14)#565 | 4.9%(-1.12)#16,651 |
| 25. | 63129 | 3.8% | 5.0%(-1.17)#570 | 4.9%(-1.14)#16,777 |
| 26. | 63139 | 3.6% | 5.0%(-1.38)#594 | 4.9%(-1.35)#17,681 |
| 27. | 63104 | 3.6% | 5.0%(-1.39)#596 | 4.9%(-1.36)#17,720 |
| 28. | 63109 | 3.4% | 5.0%(-1.55)#616 | 4.9%(-1.53)#18,407 |
| 29. | 63147 | 3.4% | 5.0%(-1.58)#620 | 4.9%(-1.55)#18,519 |
| 30. | 63146 | 3.1% | 5.0%(-1.85)#641 | 4.9%(-1.83)#19,715 |
| 31. | 63108 | 2.9% | 5.0%(-2.09)#673 | 4.9%(-2.06)#20,752 |
| 32. | 63128 | 2.4% | 5.0%(-2.56)#715 | 4.9%(-2.53)#22,756 |
| 33. | 63119 | 2.4% | 5.0%(-2.58)#721 | 4.9%(-2.56)#22,859 |
| 34. | 63141 | 2.3% | 5.0%(-2.63)#722 | 4.9%(-2.60)#23,025 |
| 35. | 63143 | 2.2% | 5.0%(-2.73)#734 | 4.9%(-2.70)#23,385 |
| 36. | 63130 | 2.2% | 5.0%(-2.80)#742 | 4.9%(-2.77)#23,658 |
| 37. | 63110 | 2.1% | 5.0%(-2.85)#749 | 4.9%(-2.83)#23,859 |
| 38. | 63120 | 1.9% | 5.0%(-3.12)#769 | 4.9%(-3.10)#24,785 |
| 39. | 63122 | 1.8% | 5.0%(-3.19)#777 | 4.9%(-3.17)#25,023 |
| 40. | 63126 | 1.8% | 5.0%(-3.22)#780 | 4.9%(-3.19)#25,093 |
| 41. | 63144 | 1.5% | 5.0%(-3.45)#796 | 4.9%(-3.42)#25,780 |
| 42. | 63117 | 1.2% | 5.0%(-3.76)#820 | 4.9%(-3.73)#26,558 |
| 43. | 63101 | 0.69% | 5.0%(-4.29)#850 | 4.9%(-4.26)#27,550 |
| 44. | 63131 | 0.55% | 5.0%(-4.43)#855 | 4.9%(-4.40)#27,759 |
| 45. | 63105 | 0.060% | 5.0%(-4.91)#864 | 4.9%(-4.89)#28,082 |
1
Common Questions
What are the Top 10 Zip Codes with the Highest Percentage of Population Employed in Transportation & Warehousing in Saint Louis, MO?
Top 10 Zip Codes with the Highest Percentage of Population Employed in Transportation & Warehousing in Saint Louis, MO are:
What zip code has the Highest Percentage of Population Employed in Transportation & Warehousing in Saint Louis, MO?
63107 has the Highest Percentage of Population Employed in Transportation & Warehousing in Saint Louis, MO with 13.6%.
What is the Percentage of Population Employed in Transportation & Warehousing in Missouri?
Percentage of Population Employed in Transportation & Warehousing in Missouri is 5.0%.
What is the Percentage of Population Employed in Transportation & Warehousing in the United States?
Percentage of Population Employed in Transportation & Warehousing in the United States is 4.9%.