Zip Codes with the Highest Percentage of Population Employed in Food Preparation & Serving in Florissant, MO
RELATED REPORTS & OPTIONS
Food Preparation & Serving
Florissant
Compare Zip Codes
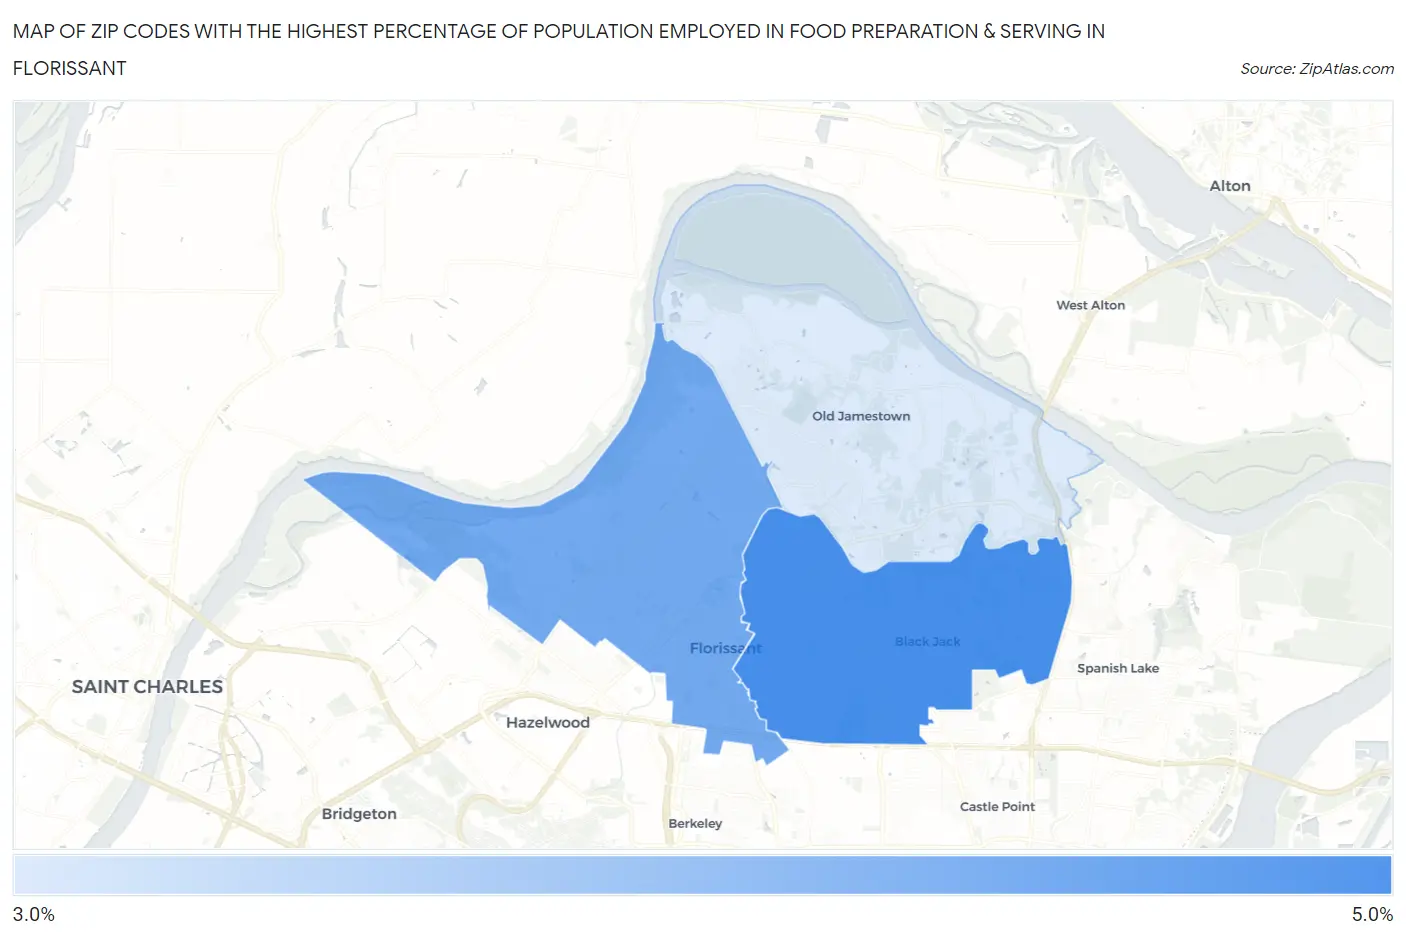
Map of Zip Codes with the Highest Percentage of Population Employed in Food Preparation & Serving in Florissant
0.0%
5.0%
Zip Codes with the Highest Percentage of Population Employed in Food Preparation & Serving in Florissant, MO
| Zip Code | % Employed | vs State | vs National | |
| 1. | 63033 | 4.2% | 5.2%(-1.08)#487 | 5.3%(-1.13)#16,474 |
| 2. | 63031 | 4.1% | 5.2%(-1.15)#494 | 5.3%(-1.20)#16,780 |
| 3. | 63034 | 3.9% | 5.2%(-1.34)#513 | 5.3%(-1.39)#17,534 |
1
Common Questions
What are the Top Zip Codes with the Highest Percentage of Population Employed in Food Preparation & Serving in Florissant, MO?
Top Zip Codes with the Highest Percentage of Population Employed in Food Preparation & Serving in Florissant, MO are:
What zip code has the Highest Percentage of Population Employed in Food Preparation & Serving in Florissant, MO?
63033 has the Highest Percentage of Population Employed in Food Preparation & Serving in Florissant, MO with 4.2%.
What is the Percentage of Population Employed in Food Preparation & Serving in Florissant, MO?
Percentage of Population Employed in Food Preparation & Serving in Florissant is 4.3%.
What is the Percentage of Population Employed in Food Preparation & Serving in Missouri?
Percentage of Population Employed in Food Preparation & Serving in Missouri is 5.2%.
What is the Percentage of Population Employed in Food Preparation & Serving in the United States?
Percentage of Population Employed in Food Preparation & Serving in the United States is 5.3%.