Zip Codes with the Highest Percentage of Population Employed in Food Preparation & Serving in Independence, MO
RELATED REPORTS & OPTIONS
Food Preparation & Serving
Independence
Compare Zip Codes
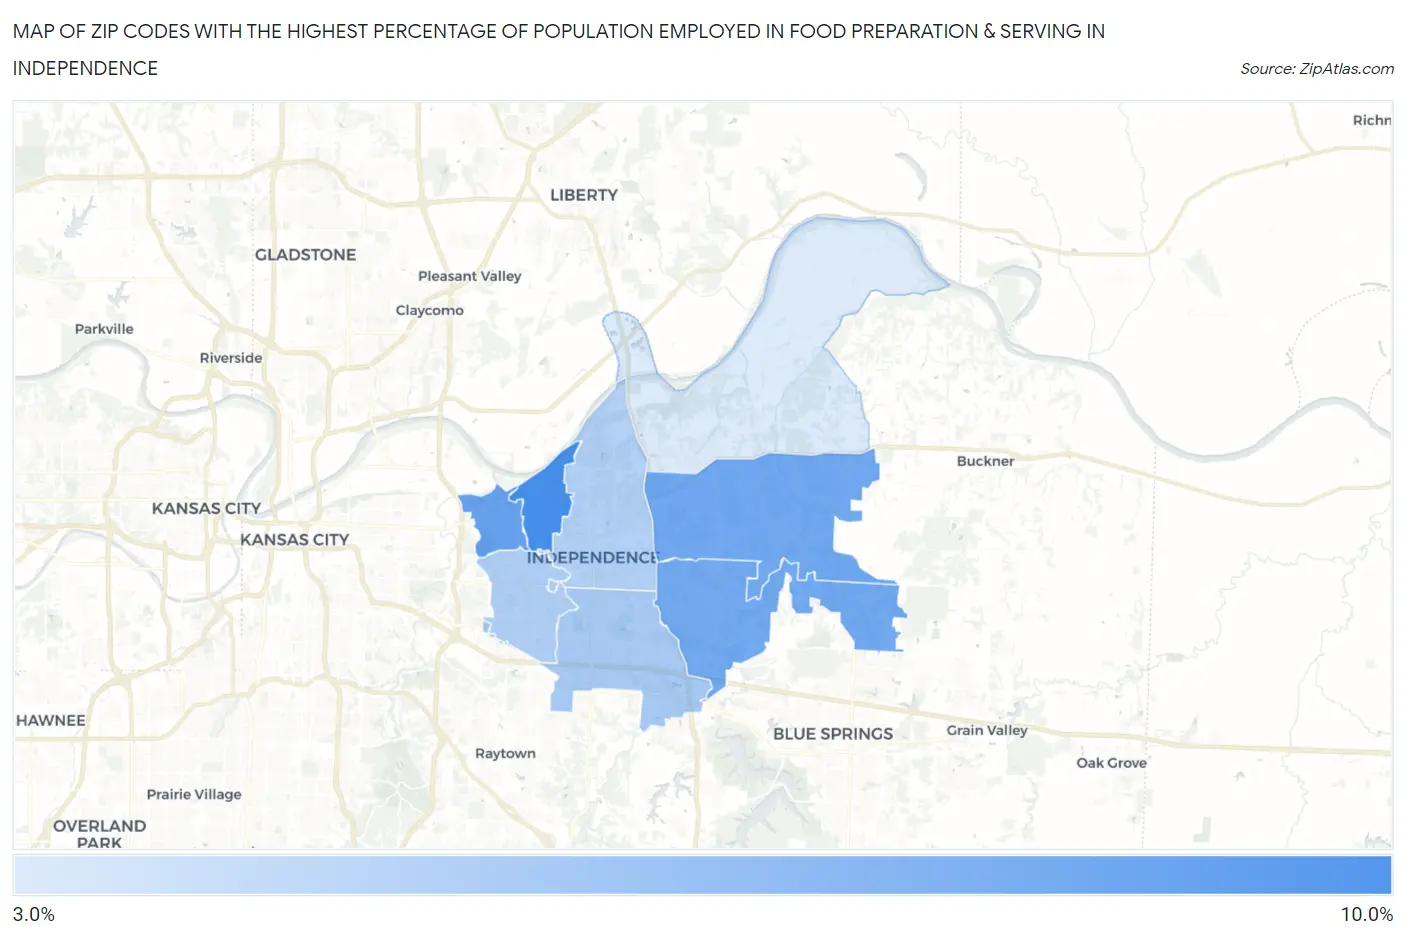
Map of Zip Codes with the Highest Percentage of Population Employed in Food Preparation & Serving in Independence
0.0%
10.0%
Zip Codes with the Highest Percentage of Population Employed in Food Preparation & Serving in Independence, MO
| Zip Code | % Employed | vs State | vs National | |
| 1. | 64054 | 9.1% | 5.2%(+3.88)#112 | 5.3%(+3.83)#3,399 |
| 2. | 64053 | 7.8% | 5.2%(+2.59)#159 | 5.3%(+2.54)#4,999 |
| 3. | 64056 | 7.4% | 5.2%(+2.16)#186 | 5.3%(+2.11)#5,748 |
| 4. | 64057 | 7.4% | 5.2%(+2.12)#191 | 5.3%(+2.07)#5,834 |
| 5. | 64055 | 5.3% | 5.2%(+0.039)#352 | 5.3%(-0.012)#11,857 |
| 6. | 64052 | 4.9% | 5.2%(-0.380)#401 | 5.3%(-0.430)#13,532 |
| 7. | 64050 | 4.8% | 5.2%(-0.438)#408 | 5.3%(-0.489)#13,773 |
| 8. | 64058 | 3.2% | 5.2%(-2.04)#609 | 5.3%(-2.09)#20,510 |
1
Common Questions
What are the Top 5 Zip Codes with the Highest Percentage of Population Employed in Food Preparation & Serving in Independence, MO?
Top 5 Zip Codes with the Highest Percentage of Population Employed in Food Preparation & Serving in Independence, MO are:
What zip code has the Highest Percentage of Population Employed in Food Preparation & Serving in Independence, MO?
64054 has the Highest Percentage of Population Employed in Food Preparation & Serving in Independence, MO with 9.1%.
What is the Percentage of Population Employed in Food Preparation & Serving in Independence, MO?
Percentage of Population Employed in Food Preparation & Serving in Independence is 5.7%.
What is the Percentage of Population Employed in Food Preparation & Serving in Missouri?
Percentage of Population Employed in Food Preparation & Serving in Missouri is 5.2%.
What is the Percentage of Population Employed in Food Preparation & Serving in the United States?
Percentage of Population Employed in Food Preparation & Serving in the United States is 5.3%.