Zip Codes with the Highest Percentage of Population Employed in Legal Services & Support in Florissant, MO
RELATED REPORTS & OPTIONS
Legal Services & Support
Florissant
Compare Zip Codes
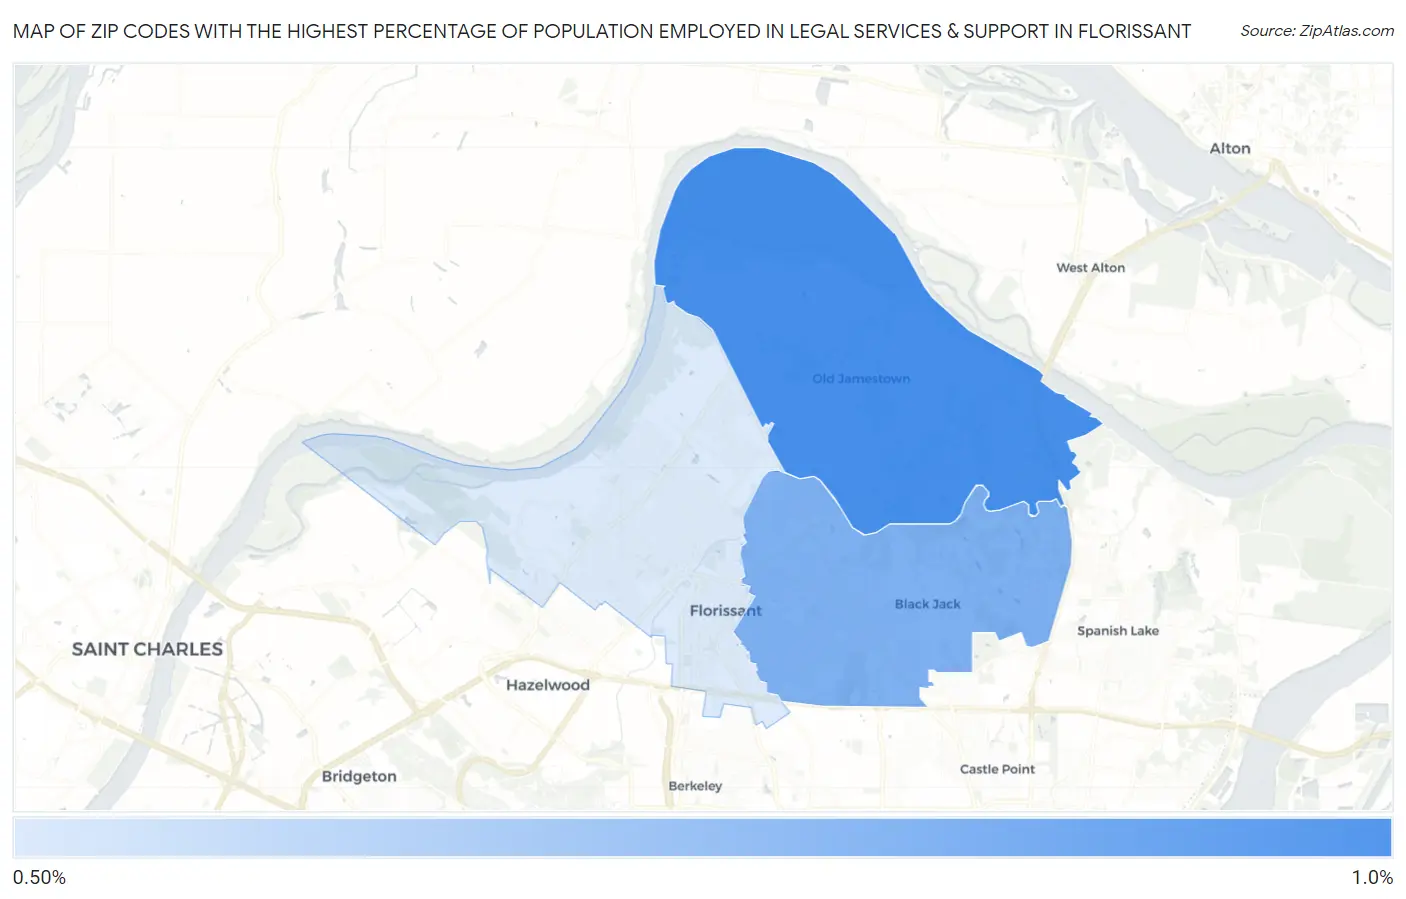
Map of Zip Codes with the Highest Percentage of Population Employed in Legal Services & Support in Florissant
0.0%
1.0%
Zip Codes with the Highest Percentage of Population Employed in Legal Services & Support in Florissant, MO
| Zip Code | % Employed | vs State | vs National | |
| 1. | 63034 | 0.90% | 0.99%(-0.094)#184 | 1.2%(-0.288)#8,641 |
| 2. | 63033 | 0.78% | 0.99%(-0.215)#209 | 1.2%(-0.408)#9,685 |
| 3. | 63031 | 0.57% | 0.99%(-0.423)#251 | 1.2%(-0.616)#11,860 |
1
Common Questions
What are the Top Zip Codes with the Highest Percentage of Population Employed in Legal Services & Support in Florissant, MO?
Top Zip Codes with the Highest Percentage of Population Employed in Legal Services & Support in Florissant, MO are:
What zip code has the Highest Percentage of Population Employed in Legal Services & Support in Florissant, MO?
63034 has the Highest Percentage of Population Employed in Legal Services & Support in Florissant, MO with 0.90%.
What is the Percentage of Population Employed in Legal Services & Support in Florissant, MO?
Percentage of Population Employed in Legal Services & Support in Florissant is 0.88%.
What is the Percentage of Population Employed in Legal Services & Support in Missouri?
Percentage of Population Employed in Legal Services & Support in Missouri is 0.99%.
What is the Percentage of Population Employed in Legal Services & Support in the United States?
Percentage of Population Employed in Legal Services & Support in the United States is 1.2%.