Zip Codes with the Highest Percentage of Population Employed in Food Preparation & Serving in Wildwood, MO
RELATED REPORTS & OPTIONS
Food Preparation & Serving
Wildwood
Compare Zip Codes
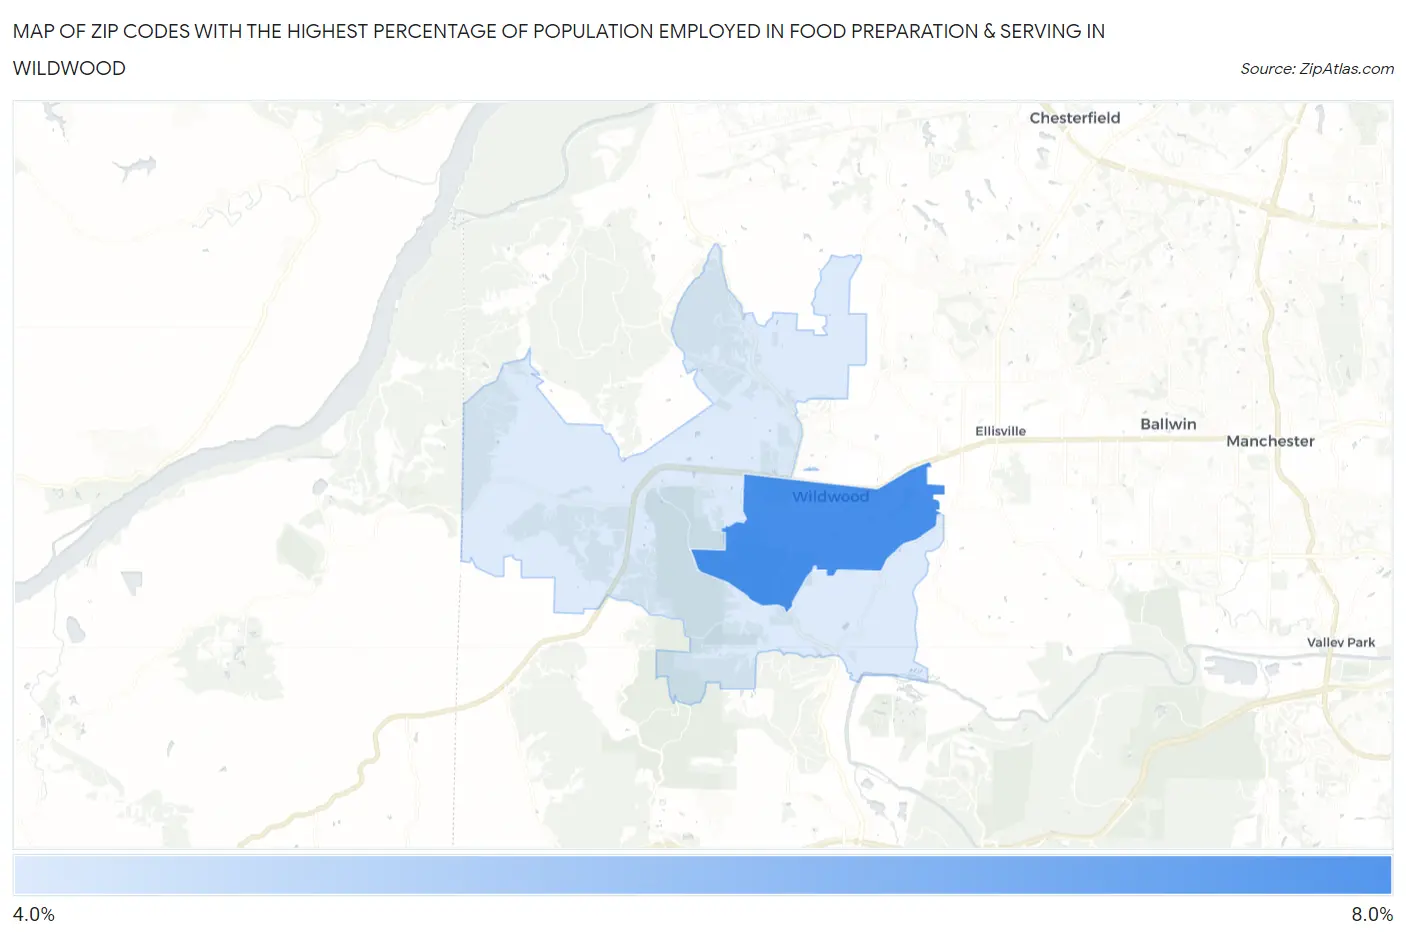
Map of Zip Codes with the Highest Percentage of Population Employed in Food Preparation & Serving in Wildwood
0.0%
8.0%
Zip Codes with the Highest Percentage of Population Employed in Food Preparation & Serving in Wildwood, MO
| Zip Code | % Employed | vs State | vs National | |
| 1. | 63040 | 7.7% | 5.2%(+2.47)#164 | 5.3%(+2.42)#5,197 |
| 2. | 63038 | 4.2% | 5.2%(-1.04)#484 | 5.3%(-1.10)#16,355 |
1
Common Questions
What are the Top Zip Codes with the Highest Percentage of Population Employed in Food Preparation & Serving in Wildwood, MO?
Top Zip Codes with the Highest Percentage of Population Employed in Food Preparation & Serving in Wildwood, MO are:
What zip code has the Highest Percentage of Population Employed in Food Preparation & Serving in Wildwood, MO?
63040 has the Highest Percentage of Population Employed in Food Preparation & Serving in Wildwood, MO with 7.7%.
What is the Percentage of Population Employed in Food Preparation & Serving in Wildwood, MO?
Percentage of Population Employed in Food Preparation & Serving in Wildwood is 4.0%.
What is the Percentage of Population Employed in Food Preparation & Serving in Missouri?
Percentage of Population Employed in Food Preparation & Serving in Missouri is 5.2%.
What is the Percentage of Population Employed in Food Preparation & Serving in the United States?
Percentage of Population Employed in Food Preparation & Serving in the United States is 5.3%.