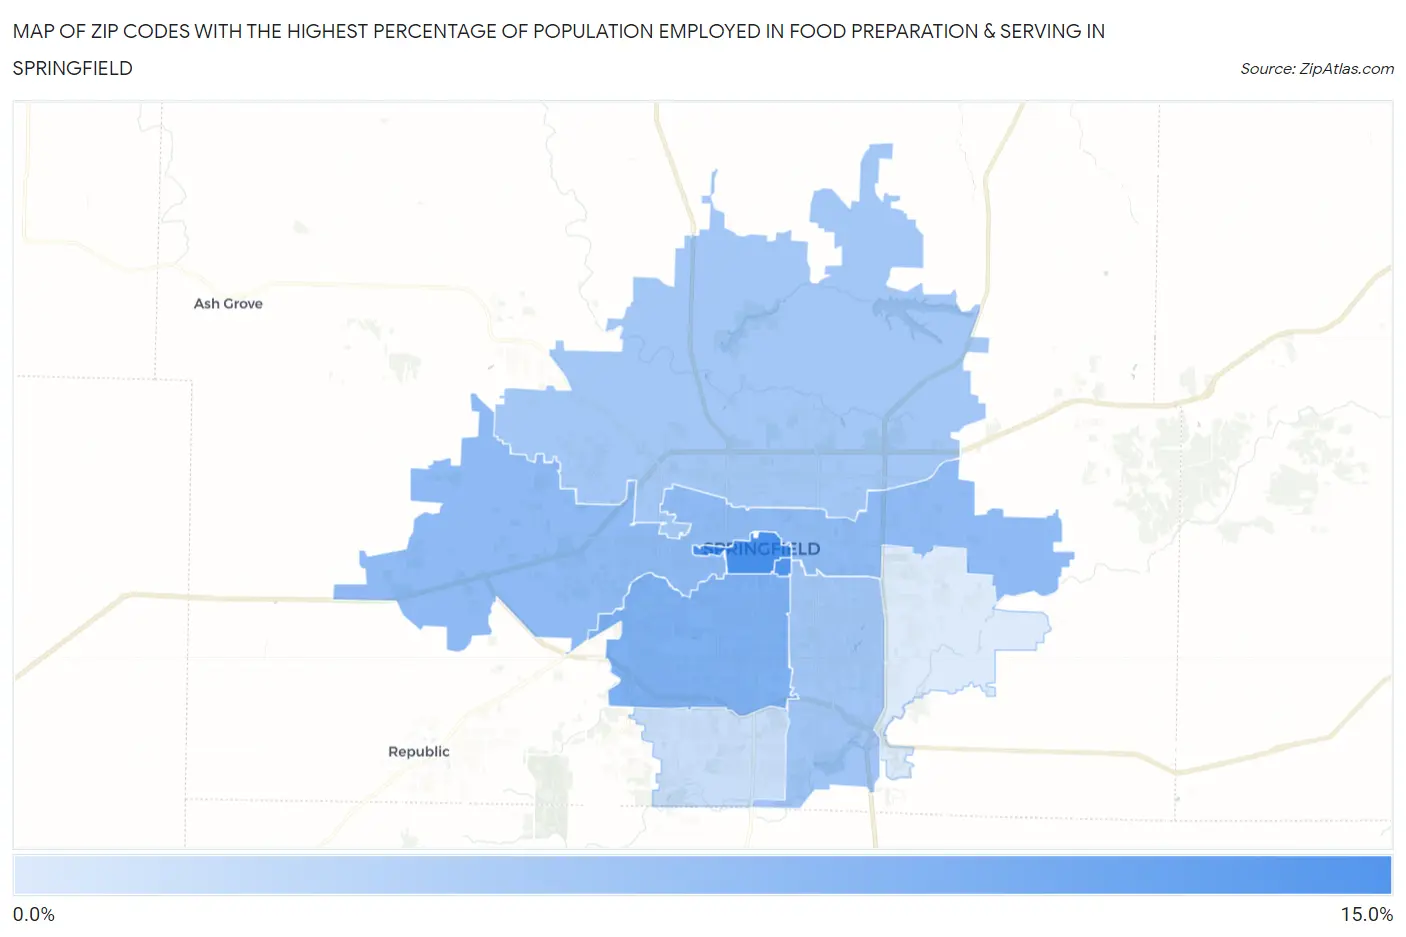
Zip Codes with the Highest Percentage of Population Employed in Food Preparation & Serving in Springfield, MO
RELATED REPORTS & OPTIONS
Food Preparation & Serving
Springfield
Compare Zip Codes
Map of Zip Codes with the Highest Percentage of Population Employed in Food Preparation & Serving in Springfield
0.0%
15.0%
Zip Codes with the Highest Percentage of Population Employed in Food Preparation & Serving in Springfield, MO
| Zip Code | % Employed | vs State | vs National | |
| 1. | 65806 | 11.0% | 5.2%(+5.76)#72 | 5.3%(+5.70)#2,060 |
| 2. | 65897 | 10.6% | 5.2%(+5.37)#78 | 5.3%(+5.32)#2,257 |
| 3. | 65807 | 7.7% | 5.2%(+2.44)#165 | 5.3%(+2.39)#5,258 |
| 4. | 65802 | 6.7% | 5.2%(+1.42)#242 | 5.3%(+1.37)#7,459 |
| 5. | 65804 | 5.7% | 5.2%(+0.426)#321 | 5.3%(+0.375)#10,480 |
| 6. | 65803 | 5.5% | 5.2%(+0.244)#331 | 5.3%(+0.193)#11,124 |
| 7. | 65810 | 3.3% | 5.2%(-1.90)#585 | 5.3%(-1.95)#19,904 |
| 8. | 65809 | 2.2% | 5.2%(-3.07)#717 | 5.3%(-3.12)#24,203 |
1
Common Questions
What are the Top 5 Zip Codes with the Highest Percentage of Population Employed in Food Preparation & Serving in Springfield, MO?
Top 5 Zip Codes with the Highest Percentage of Population Employed in Food Preparation & Serving in Springfield, MO are:
What zip code has the Highest Percentage of Population Employed in Food Preparation & Serving in Springfield, MO?
65806 has the Highest Percentage of Population Employed in Food Preparation & Serving in Springfield, MO with 11.0%.
What is the Percentage of Population Employed in Food Preparation & Serving in Springfield, MO?
Percentage of Population Employed in Food Preparation & Serving in Springfield is 7.7%.
What is the Percentage of Population Employed in Food Preparation & Serving in Missouri?
Percentage of Population Employed in Food Preparation & Serving in Missouri is 5.2%.
What is the Percentage of Population Employed in Food Preparation & Serving in the United States?
Percentage of Population Employed in Food Preparation & Serving in the United States is 5.3%.