Zip Codes with the Highest Percentage of Population Employed in Food Preparation & Serving in Cape Girardeau, MO
RELATED REPORTS & OPTIONS
Food Preparation & Serving
Cape Girardeau
Compare Zip Codes
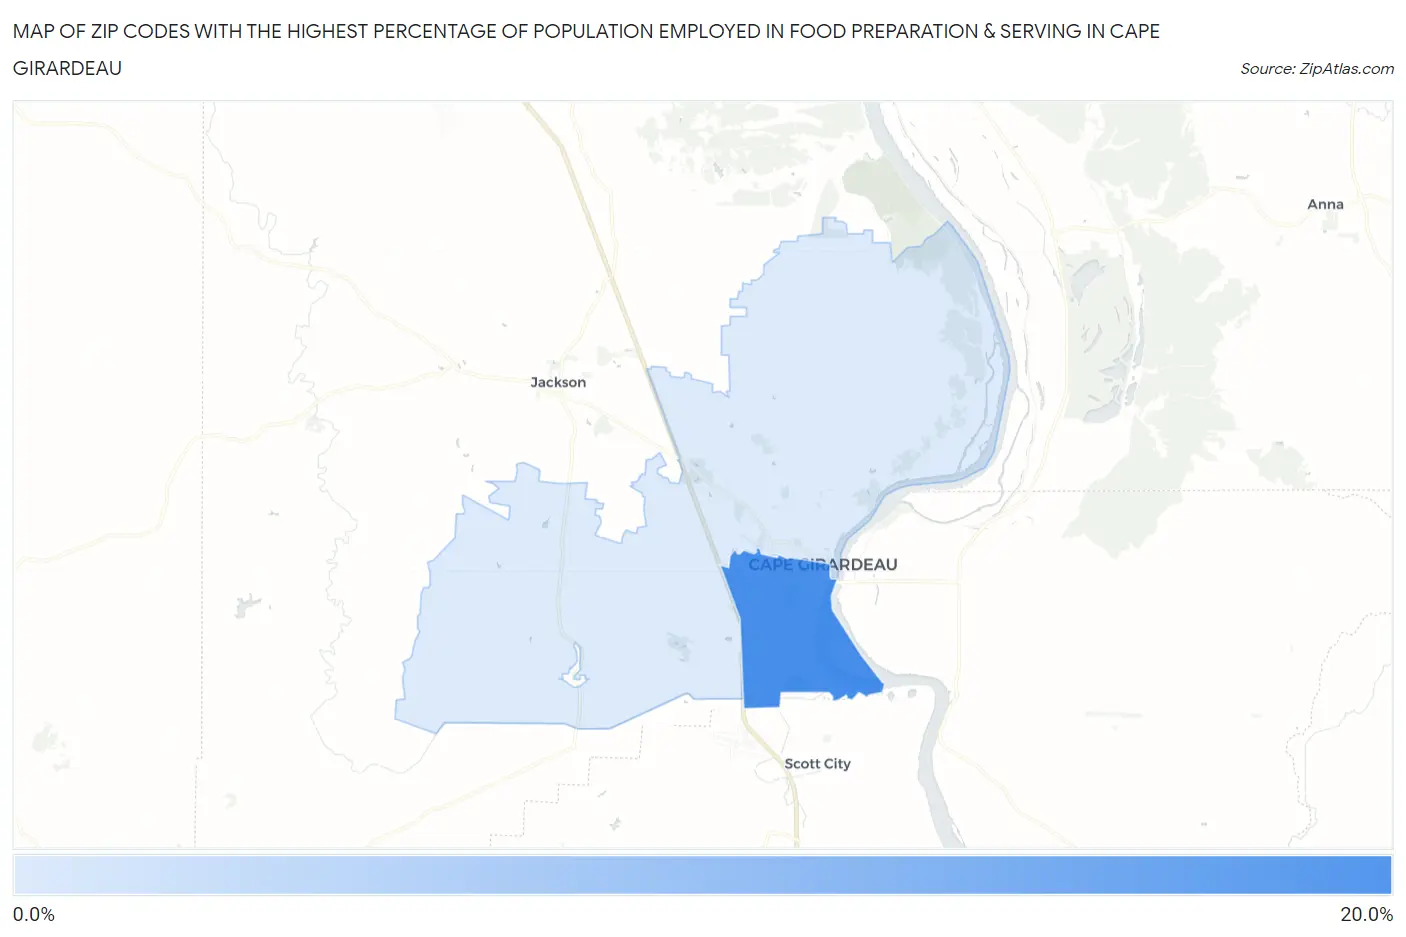
Map of Zip Codes with the Highest Percentage of Population Employed in Food Preparation & Serving in Cape Girardeau
0.0%
20.0%
Zip Codes with the Highest Percentage of Population Employed in Food Preparation & Serving in Cape Girardeau, MO
| Zip Code | % Employed | vs State | vs National | |
| 1. | 63703 | 16.7% | 5.2%(+11.4)#30 | 5.3%(+11.4)#773 |
| 2. | 63701 | 8.1% | 5.2%(+2.91)#147 | 5.3%(+2.86)#4,512 |
1
Common Questions
What are the Top Zip Codes with the Highest Percentage of Population Employed in Food Preparation & Serving in Cape Girardeau, MO?
Top Zip Codes with the Highest Percentage of Population Employed in Food Preparation & Serving in Cape Girardeau, MO are:
What zip code has the Highest Percentage of Population Employed in Food Preparation & Serving in Cape Girardeau, MO?
63703 has the Highest Percentage of Population Employed in Food Preparation & Serving in Cape Girardeau, MO with 16.7%.
What is the Percentage of Population Employed in Food Preparation & Serving in Cape Girardeau, MO?
Percentage of Population Employed in Food Preparation & Serving in Cape Girardeau is 10.6%.
What is the Percentage of Population Employed in Food Preparation & Serving in Missouri?
Percentage of Population Employed in Food Preparation & Serving in Missouri is 5.2%.
What is the Percentage of Population Employed in Food Preparation & Serving in the United States?
Percentage of Population Employed in Food Preparation & Serving in the United States is 5.3%.