Zip Codes with the Highest Percentage of Population Employed in Food Preparation & Serving in Saint Charles, MO
RELATED REPORTS & OPTIONS
Food Preparation & Serving
Saint Charles
Compare Zip Codes
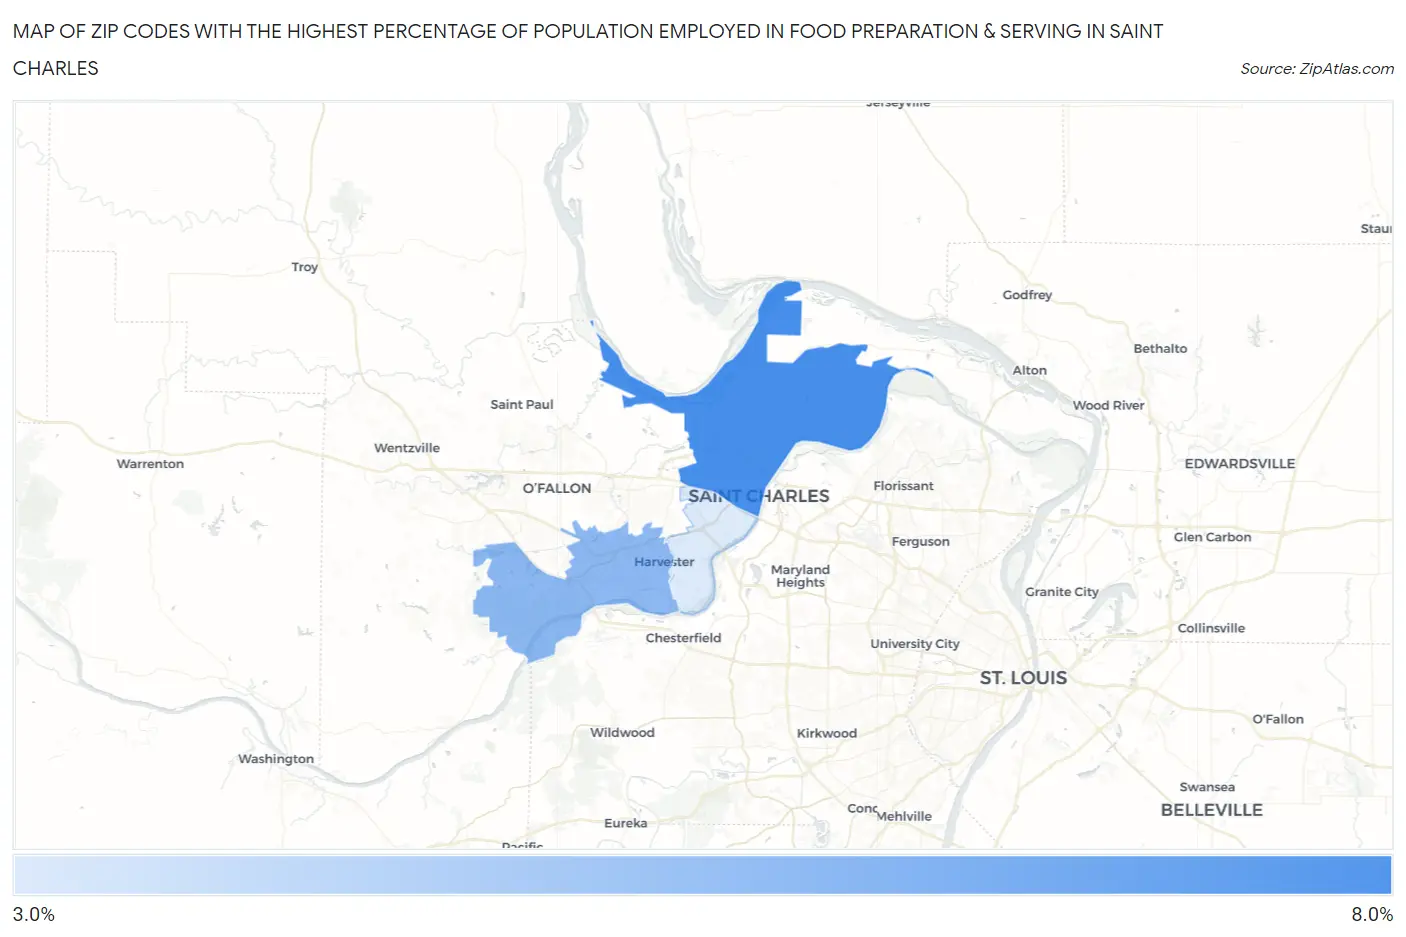
Map of Zip Codes with the Highest Percentage of Population Employed in Food Preparation & Serving in Saint Charles
0.0%
8.0%
Zip Codes with the Highest Percentage of Population Employed in Food Preparation & Serving in Saint Charles, MO
| Zip Code | % Employed | vs State | vs National | |
| 1. | 63301 | 6.0% | 5.2%(+0.788)#293 | 5.3%(+0.737)#9,269 |
| 2. | 63304 | 4.9% | 5.2%(-0.347)#396 | 5.3%(-0.397)#13,402 |
| 3. | 63303 | 3.6% | 5.2%(-1.66)#554 | 5.3%(-1.71)#18,870 |
1
Common Questions
What are the Top Zip Codes with the Highest Percentage of Population Employed in Food Preparation & Serving in Saint Charles, MO?
Top Zip Codes with the Highest Percentage of Population Employed in Food Preparation & Serving in Saint Charles, MO are:
What zip code has the Highest Percentage of Population Employed in Food Preparation & Serving in Saint Charles, MO?
63301 has the Highest Percentage of Population Employed in Food Preparation & Serving in Saint Charles, MO with 6.0%.
What is the Percentage of Population Employed in Food Preparation & Serving in Missouri?
Percentage of Population Employed in Food Preparation & Serving in Missouri is 5.2%.
What is the Percentage of Population Employed in Food Preparation & Serving in the United States?
Percentage of Population Employed in Food Preparation & Serving in the United States is 5.3%.