Zip Codes with the Highest Percentage of Population Employed in Computer & Mathematics in Warren, MI
RELATED REPORTS & OPTIONS
Computer & Mathematics
Warren
Compare Zip Codes
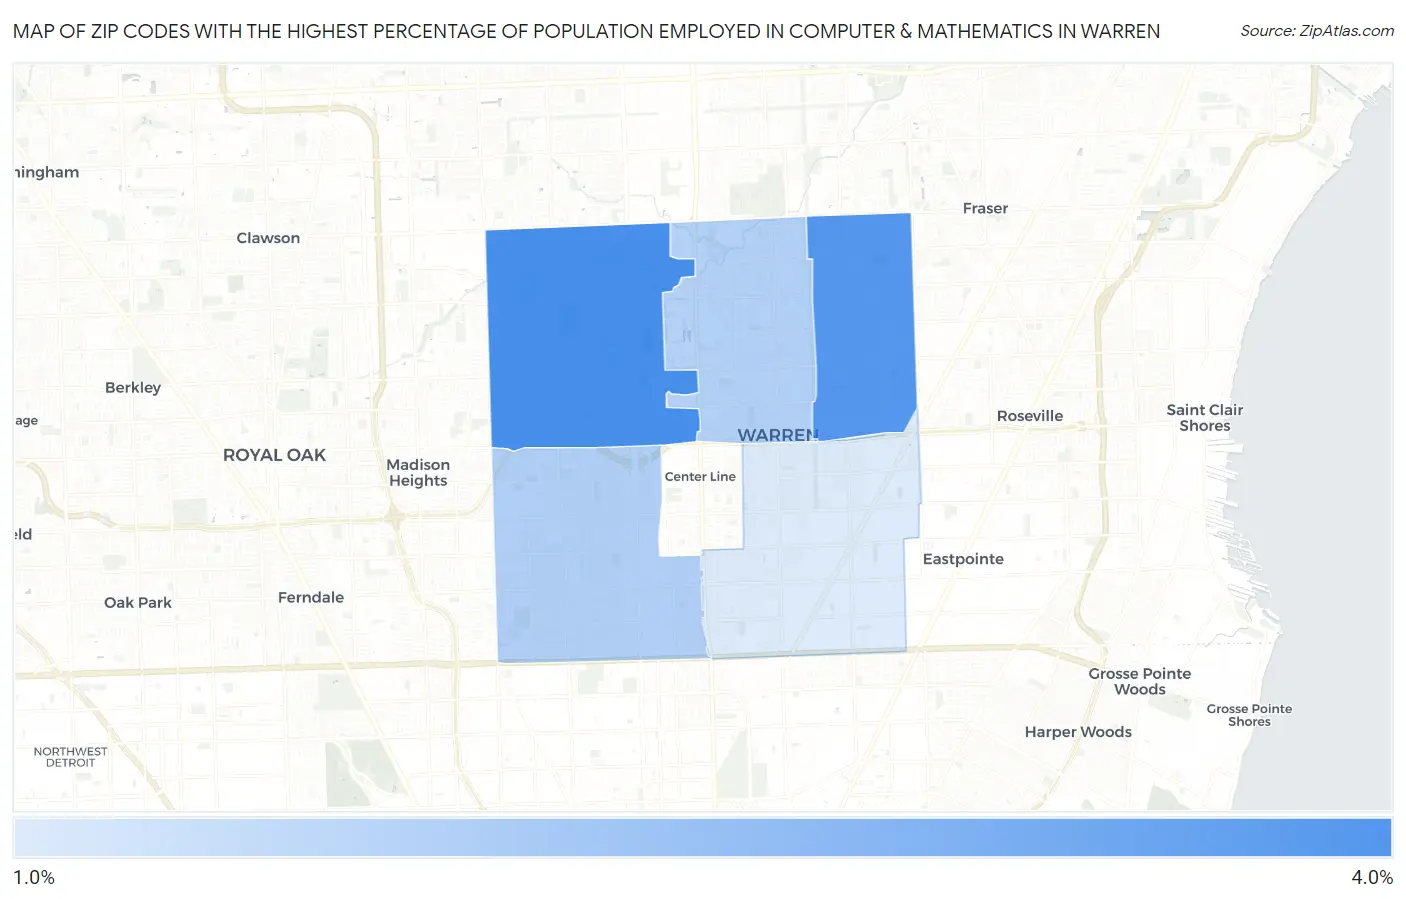
Map of Zip Codes with the Highest Percentage of Population Employed in Computer & Mathematics in Warren
0.0%
4.0%
Zip Codes with the Highest Percentage of Population Employed in Computer & Mathematics in Warren, MI
| Zip Code | % Employed | vs State | vs National | |
| 1. | 48092 | 3.6% | 2.9%(+0.706)#144 | 3.5%(+0.107)#5,890 |
| 2. | 48088 | 3.4% | 2.9%(+0.497)#161 | 3.5%(-0.102)#6,416 |
| 3. | 48091 | 2.0% | 2.9%(-0.974)#374 | 3.5%(-1.57)#12,032 |
| 4. | 48093 | 1.9% | 2.9%(-0.986)#378 | 3.5%(-1.58)#12,099 |
| 5. | 48089 | 1.3% | 2.9%(-1.64)#553 | 3.5%(-2.23)#15,587 |
1
Common Questions
What are the Top 3 Zip Codes with the Highest Percentage of Population Employed in Computer & Mathematics in Warren, MI?
Top 3 Zip Codes with the Highest Percentage of Population Employed in Computer & Mathematics in Warren, MI are:
What zip code has the Highest Percentage of Population Employed in Computer & Mathematics in Warren, MI?
48092 has the Highest Percentage of Population Employed in Computer & Mathematics in Warren, MI with 3.6%.
What is the Percentage of Population Employed in Computer & Mathematics in Warren, MI?
Percentage of Population Employed in Computer & Mathematics in Warren is 2.4%.
What is the Percentage of Population Employed in Computer & Mathematics in Michigan?
Percentage of Population Employed in Computer & Mathematics in Michigan is 2.9%.
What is the Percentage of Population Employed in Computer & Mathematics in the United States?
Percentage of Population Employed in Computer & Mathematics in the United States is 3.5%.