Zip Codes with the Highest Percentage of Population with a Degree in Visual and Performing Arts in Warren, MI
RELATED REPORTS & OPTIONS
Visual and Performing Arts
Warren
Compare Zip Codes
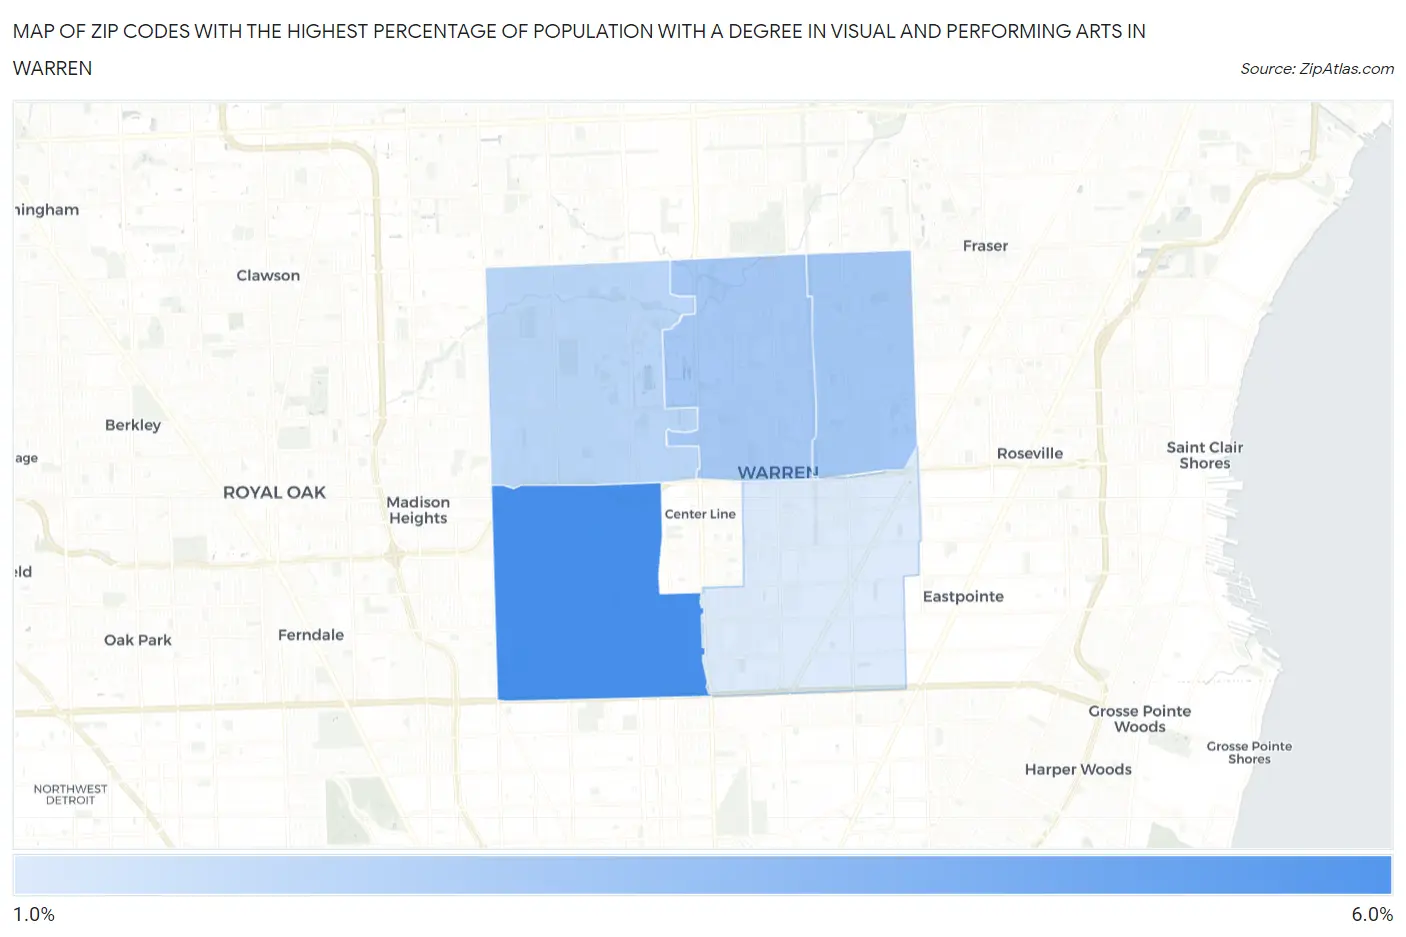
Map of Zip Codes with the Highest Percentage of Population with a Degree in Visual and Performing Arts in Warren
0.0%
6.0%
Zip Codes with the Highest Percentage of Population with a Degree in Visual and Performing Arts in Warren, MI
| Zip Code | % Graduates | vs State | vs National | |
| 1. | 48091 | 5.3% | 3.4%(+1.89)#143 | 4.3%(+1.04)#6,071 |
| 2. | 48088 | 3.0% | 3.4%(-0.408)#371 | 4.3%(-1.26)#12,751 |
| 3. | 48093 | 2.9% | 3.4%(-0.455)#378 | 4.3%(-1.31)#12,928 |
| 4. | 48092 | 2.5% | 3.4%(-0.916)#449 | 4.3%(-1.77)#14,668 |
| 5. | 48089 | 1.6% | 3.4%(-1.78)#610 | 4.3%(-2.63)#17,747 |
1
Common Questions
What are the Top 3 Zip Codes with the Highest Percentage of Population with a Degree in Visual and Performing Arts in Warren, MI?
Top 3 Zip Codes with the Highest Percentage of Population with a Degree in Visual and Performing Arts in Warren, MI are:
What zip code has the Highest Percentage of Population with a Degree in Visual and Performing Arts in Warren, MI?
48091 has the Highest Percentage of Population with a Degree in Visual and Performing Arts in Warren, MI with 5.3%.
What is the Percentage of Population with a Degree in Visual and Performing Arts in Warren, MI?
Percentage of Population with a Degree in Visual and Performing Arts in Warren is 3.1%.
What is the Percentage of Population with a Degree in Visual and Performing Arts in Michigan?
Percentage of Population with a Degree in Visual and Performing Arts in Michigan is 3.4%.
What is the Percentage of Population with a Degree in Visual and Performing Arts in the United States?
Percentage of Population with a Degree in Visual and Performing Arts in the United States is 4.3%.