Zip Codes with the Highest Percentage of Population Employed in Life, Physical & Social Science in Glen Burnie, MD
RELATED REPORTS & OPTIONS
Life, Physical & Social Science
Glen Burnie
Compare Zip Codes
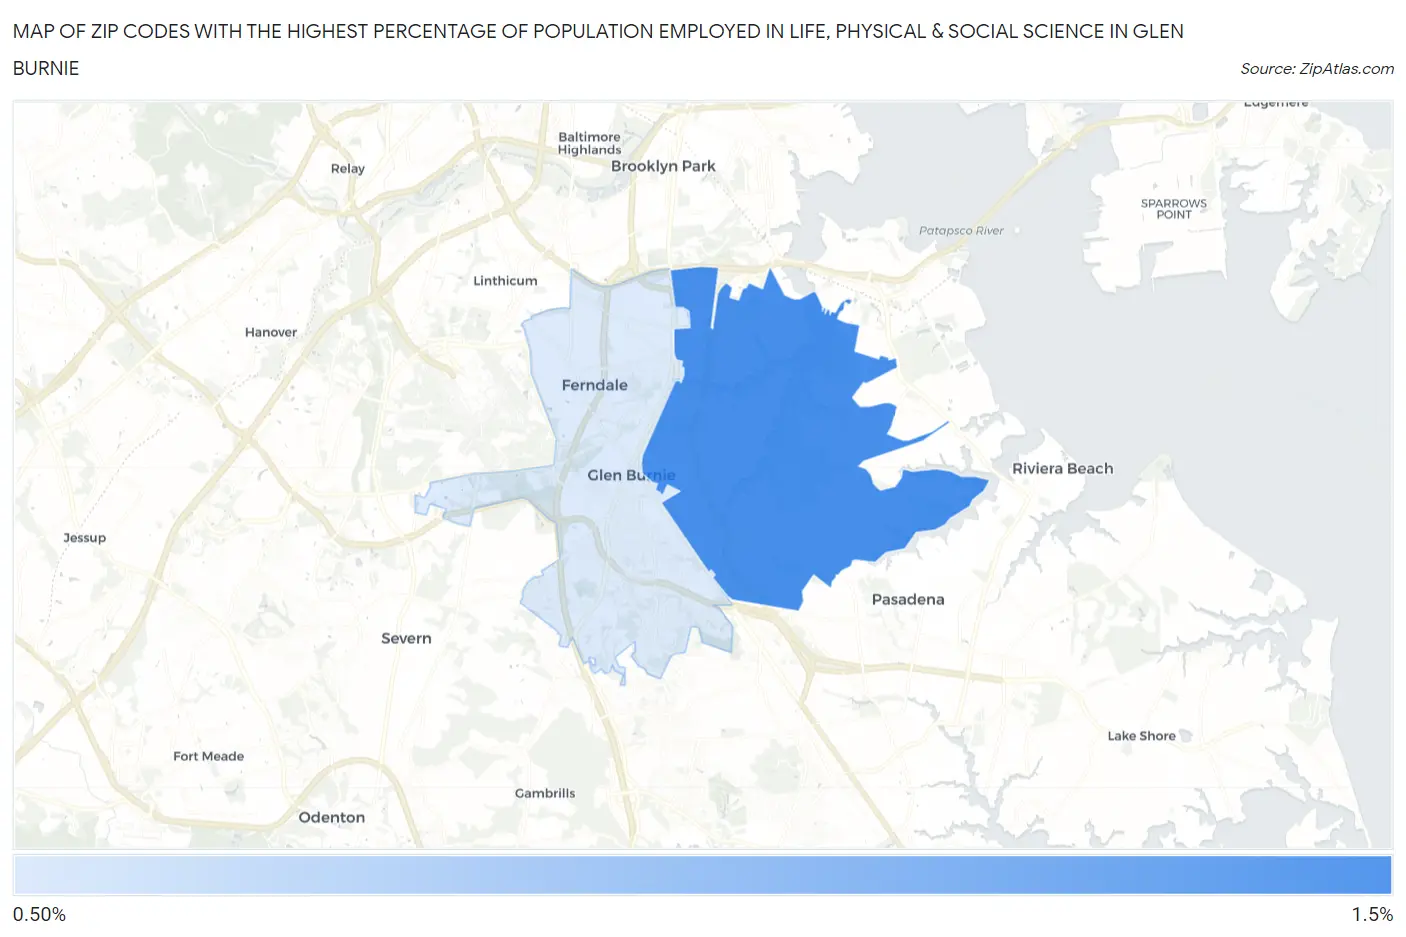
Map of Zip Codes with the Highest Percentage of Population Employed in Life, Physical & Social Science in Glen Burnie
0.0%
1.5%
Zip Codes with the Highest Percentage of Population Employed in Life, Physical & Social Science in Glen Burnie, MD
| Zip Code | % Employed | vs State | vs National | |
| 1. | 21060 | 1.3% | 2.2%(-0.894)#201 | 1.1%(+0.169)#7,061 |
| 2. | 21061 | 0.61% | 2.2%(-1.54)#271 | 1.1%(-0.482)#13,172 |
1
Common Questions
What are the Top Zip Codes with the Highest Percentage of Population Employed in Life, Physical & Social Science in Glen Burnie, MD?
Top Zip Codes with the Highest Percentage of Population Employed in Life, Physical & Social Science in Glen Burnie, MD are:
What zip code has the Highest Percentage of Population Employed in Life, Physical & Social Science in Glen Burnie, MD?
21060 has the Highest Percentage of Population Employed in Life, Physical & Social Science in Glen Burnie, MD with 1.3%.
What is the Percentage of Population Employed in Life, Physical & Social Science in Glen Burnie, MD?
Percentage of Population Employed in Life, Physical & Social Science in Glen Burnie is 0.77%.
What is the Percentage of Population Employed in Life, Physical & Social Science in Maryland?
Percentage of Population Employed in Life, Physical & Social Science in Maryland is 2.2%.
What is the Percentage of Population Employed in Life, Physical & Social Science in the United States?
Percentage of Population Employed in Life, Physical & Social Science in the United States is 1.1%.