Zip Codes with the Highest Percentage of Population Employed in Life, Physical & Social Science in Annapolis, MD

RELATED REPORTS & OPTIONS

Life, Physical & Social Science
Population
Families and Households
Female Fertility
Female Fertility (Unmarried)
Race (Community Size)
Race (Percentage)
Ancestry (Community Size)
AfricanAmericanApacheArabArgentineanArmenianAustrianBelgianBhutaneseBlackfeetBrazilianBritishBurmeseCanadianCentral AmericanCherokeeChileanChoctawColombianCosta RicanCroatianCubanCypriotCzechCzechoslovakianDanishDominicanDutchEastern EuropeanEcuadorianEnglishEstonianEthiopianEuropeanFilipinoFinnishFrenchFrench CanadianGermanGreekGuamanian / ChamorroGuatemalanHaitianHonduranHungarianIndian (Asian)IranianIrishIroquoisItalianJamaicanKoreanLebaneseLithuanianMexicanNative HawaiianNew ZealanderNicaraguanNigerianNorthern EuropeanNorwegianPakistaniPanamanianPennsylvania GermanPeruvianPolishPortuguesePuerto RicanRomanianRussianSalvadoranScandinavianScotch-IrishScottishSerbianSlavicSlovakSloveneSouth AfricanSouth AmericanSpaniardSpanishSri LankanSubsaharan AfricanSwedishSwissThaiTurkishUkrainianVenezuelanWelshYugoslavian
Ancestry (Percentage)
AfricanAmericanApacheArabArgentineanArmenianAustrianBelgianBhutaneseBlackfeetBrazilianBritishBurmeseCanadianCentral AmericanCherokeeChileanChoctawColombianCosta RicanCroatianCubanCypriotCzechCzechoslovakianDanishDominicanDutchEastern EuropeanEcuadorianEnglishEstonianEthiopianEuropeanFilipinoFinnishFrenchFrench CanadianGermanGreekGuamanian / ChamorroGuatemalanHaitianHonduranHungarianIndian (Asian)IranianIrishIroquoisItalianJamaicanKoreanLebaneseLithuanianMexicanNative HawaiianNew ZealanderNicaraguanNigerianNorthern EuropeanNorwegianPakistaniPanamanianPennsylvania GermanPeruvianPolishPortuguesePuerto RicanRomanianRussianSalvadoranScandinavianScotch-IrishScottishSerbianSlavicSlovakSloveneSouth AfricanSouth AmericanSpaniardSpanishSri LankanSubsaharan AfricanSwedishSwissThaiTurkishUkrainianVenezuelanWelshYugoslavian
Immigrant Origin (Total)
Immigrant Origin (Percentage)
Income
Income (Families)
Income (Households)
Poverty
Poverty (Families)
Unemployment
Employment Occupations
Employment Industries
Employer Class
Commute Time
Commute Means
School Enrollment
Education by Degree Field
Occupancy
Finances
Physical Characteristics
Annapolis
Compare Zip Codes
Comparison Subject

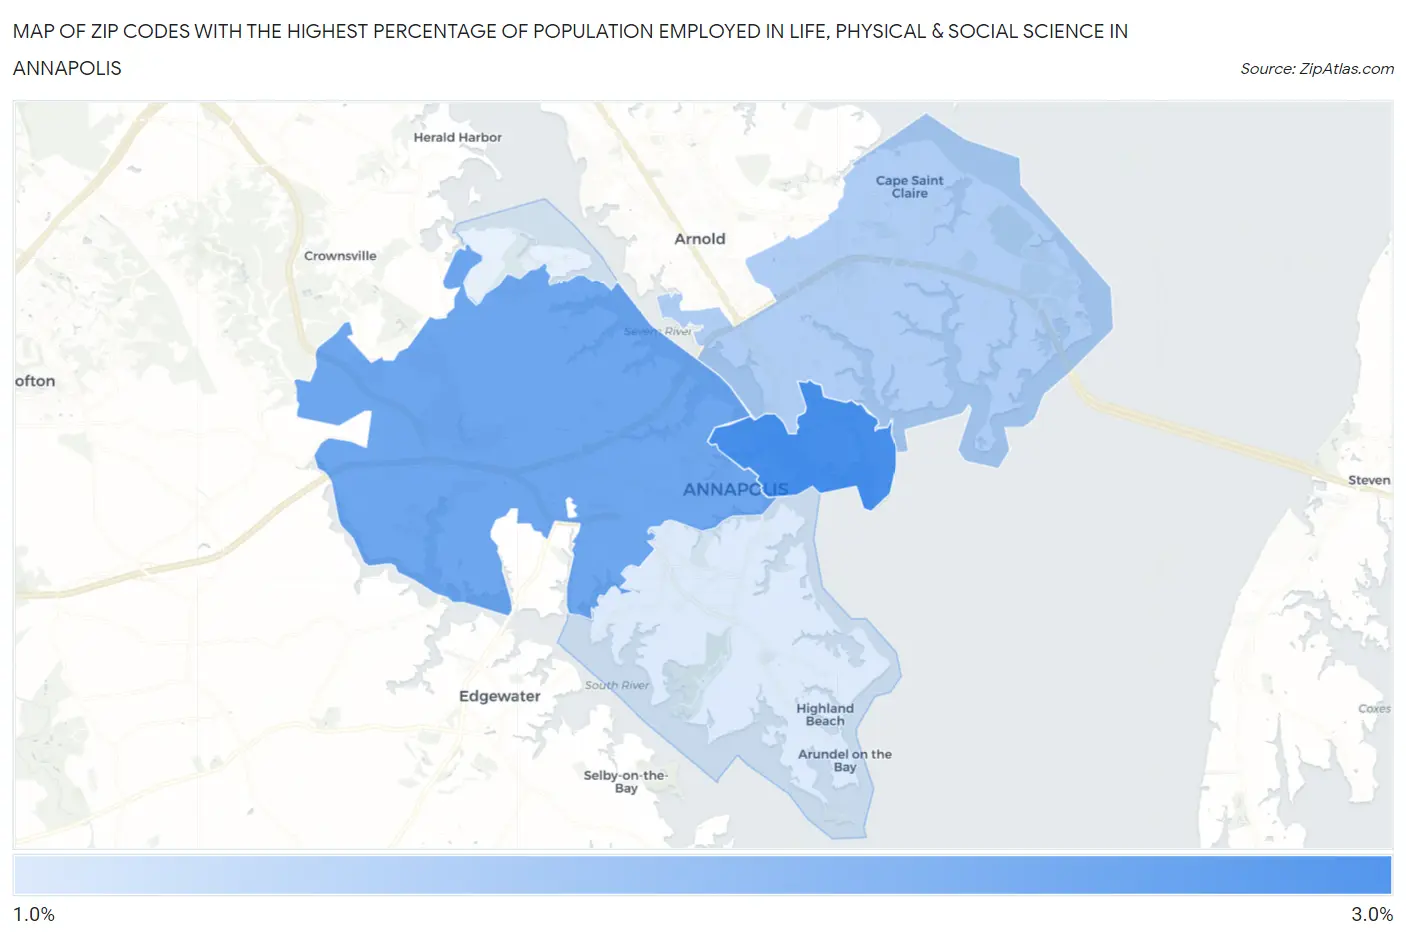
Map of Zip Codes with the Highest Percentage of Population Employed in Life, Physical & Social Science in Annapolis

0.0%
3.0%
Zip Codes with the Highest Percentage of Population Employed in Life, Physical & Social Science in Annapolis Map

Zip Codes with the Highest Percentage of Population Employed in Life, Physical & Social Science in Annapolis, MD

Zip Code % Employed vs State vs National
1.214022.7%2.2%(+0.501)#881.1%(+1.56)#2,306
2.214012.2%2.2%(+0.080)#1081.1%(+1.14)#3,103
3.214091.5%2.2%(-0.628)#1651.1%(+0.435)#5,518
4.214031.0%2.2%(-1.11)#2211.1%(-0.046)#8,661

Common Questions

What are the Top 3 Zip Codes with the Highest Percentage of Population Employed in Life, Physical & Social Science in Annapolis, MD?
Top 3 Zip Codes with the Highest Percentage of Population Employed in Life, Physical & Social Science in Annapolis, MD are:
#1
2.7%
#2
2.2%
#3
1.5%
What zip code has the Highest Percentage of Population Employed in Life, Physical & Social Science in Annapolis, MD?
21402 has the Highest Percentage of Population Employed in Life, Physical & Social Science in Annapolis, MD with 2.7%.
What is the Percentage of Population Employed in Life, Physical & Social Science in Annapolis, MD?
Percentage of Population Employed in Life, Physical & Social Science in Annapolis is 1.7%.
What is the Percentage of Population Employed in Life, Physical & Social Science in Maryland?
Percentage of Population Employed in Life, Physical & Social Science in Maryland is 2.2%.
What is the Percentage of Population Employed in Life, Physical & Social Science in the United States?
Percentage of Population Employed in Life, Physical & Social Science in the United States is 1.1%.