Zip Codes with the Highest Percentage of Population Employed in Life, Physical & Social Science in Bowie, MD
RELATED REPORTS & OPTIONS
Life, Physical & Social Science
Bowie
Compare Zip Codes
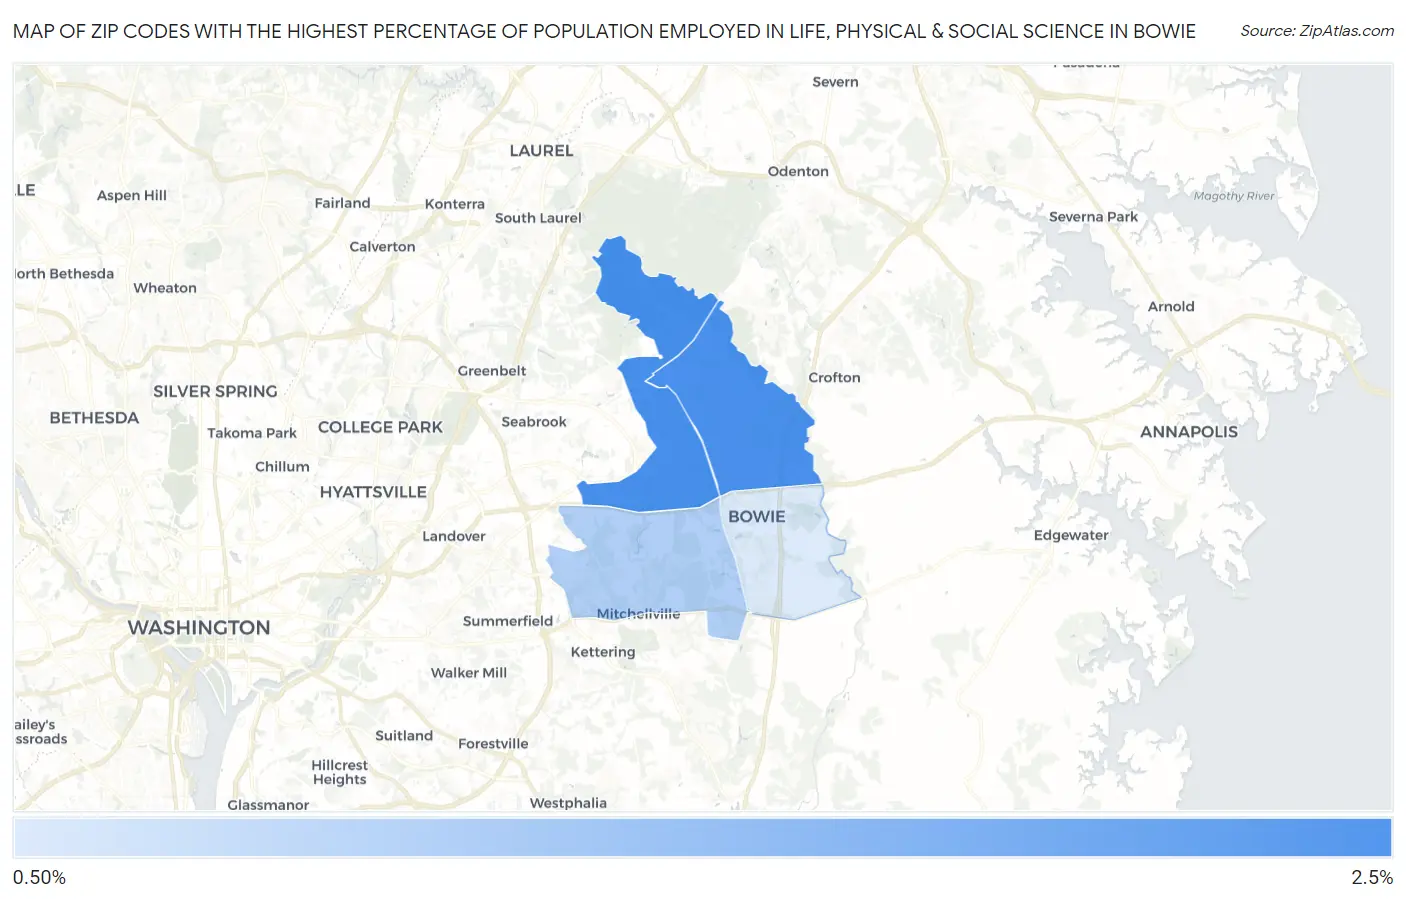
Map of Zip Codes with the Highest Percentage of Population Employed in Life, Physical & Social Science in Bowie
0.0%
2.5%
Zip Codes with the Highest Percentage of Population Employed in Life, Physical & Social Science in Bowie, MD
| Zip Code | % Employed | vs State | vs National | |
| 1. | 20720 | 2.3% | 2.2%(+0.118)#106 | 1.1%(+1.18)#3,021 |
| 2. | 20715 | 2.3% | 2.2%(+0.108)#107 | 1.1%(+1.17)#3,033 |
| 3. | 20721 | 1.6% | 2.2%(-0.594)#162 | 1.1%(+0.469)#5,335 |
| 4. | 20716 | 1.3% | 2.2%(-0.876)#197 | 1.1%(+0.187)#6,944 |
1
Common Questions
What are the Top 3 Zip Codes with the Highest Percentage of Population Employed in Life, Physical & Social Science in Bowie, MD?
Top 3 Zip Codes with the Highest Percentage of Population Employed in Life, Physical & Social Science in Bowie, MD are:
What zip code has the Highest Percentage of Population Employed in Life, Physical & Social Science in Bowie, MD?
20720 has the Highest Percentage of Population Employed in Life, Physical & Social Science in Bowie, MD with 2.3%.
What is the Percentage of Population Employed in Life, Physical & Social Science in Bowie, MD?
Percentage of Population Employed in Life, Physical & Social Science in Bowie is 1.9%.
What is the Percentage of Population Employed in Life, Physical & Social Science in Maryland?
Percentage of Population Employed in Life, Physical & Social Science in Maryland is 2.2%.
What is the Percentage of Population Employed in Life, Physical & Social Science in the United States?
Percentage of Population Employed in Life, Physical & Social Science in the United States is 1.1%.