Zip Codes with the Highest Percentage of Population Employed in Life, Physical & Social Science in Laurel, MD
RELATED REPORTS & OPTIONS
Life, Physical & Social Science
Laurel
Compare Zip Codes
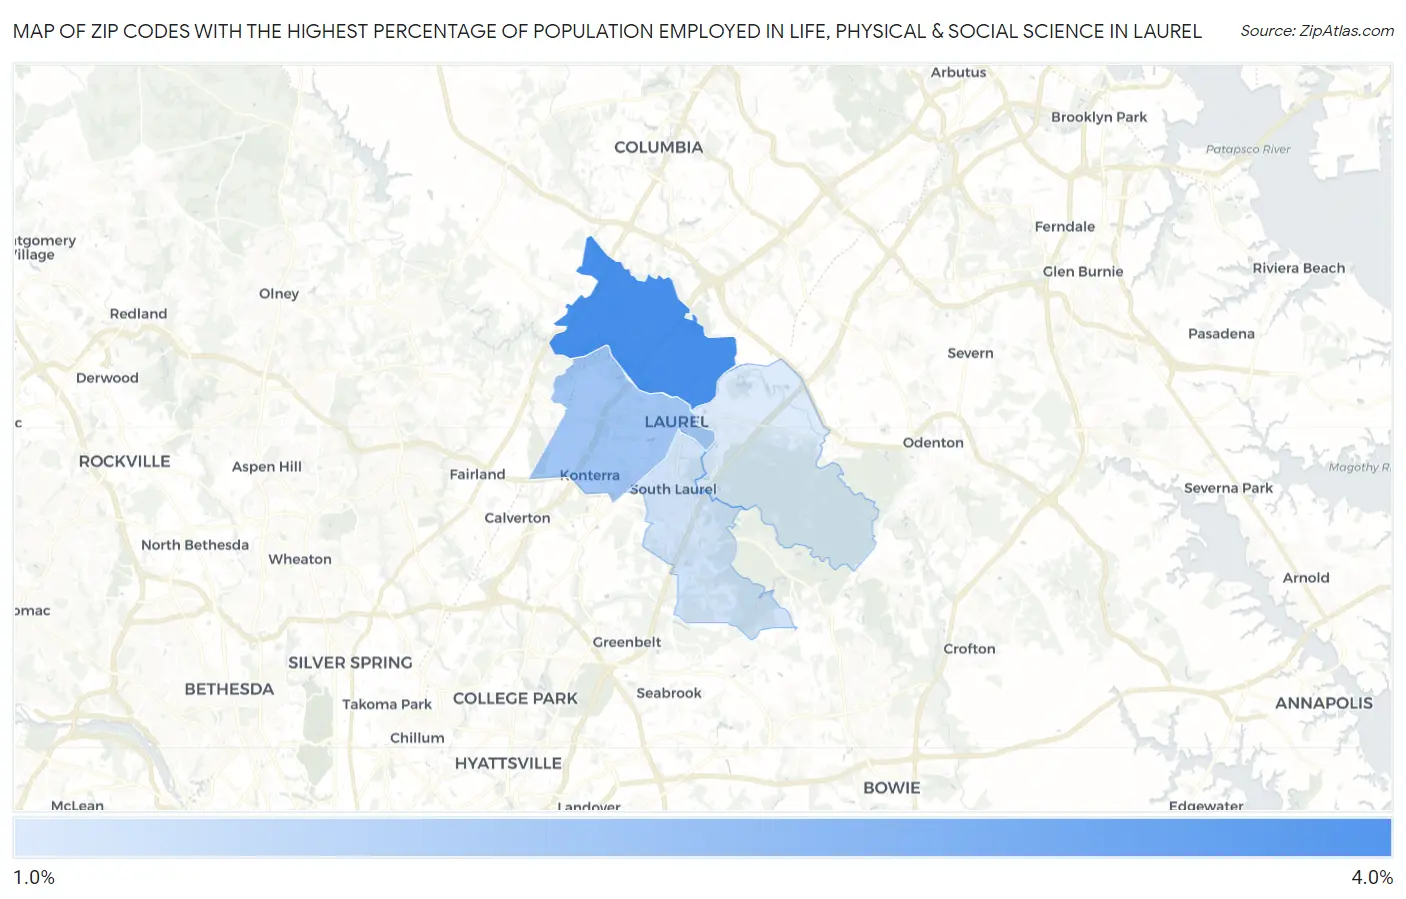
Map of Zip Codes with the Highest Percentage of Population Employed in Life, Physical & Social Science in Laurel
0.0%
4.0%
Zip Codes with the Highest Percentage of Population Employed in Life, Physical & Social Science in Laurel, MD
| Zip Code | % Employed | vs State | vs National | |
| 1. | 20723 | 3.8% | 2.2%(+1.68)#49 | 1.1%(+2.74)#1,244 |
| 2. | 20707 | 2.4% | 2.2%(+0.266)#99 | 1.1%(+1.33)#2,720 |
| 3. | 20708 | 1.7% | 2.2%(-0.496)#152 | 1.1%(+0.566)#4,911 |
| 4. | 20724 | 1.5% | 2.2%(-0.679)#172 | 1.1%(+0.384)#5,802 |
1
Common Questions
What are the Top 3 Zip Codes with the Highest Percentage of Population Employed in Life, Physical & Social Science in Laurel, MD?
Top 3 Zip Codes with the Highest Percentage of Population Employed in Life, Physical & Social Science in Laurel, MD are:
What zip code has the Highest Percentage of Population Employed in Life, Physical & Social Science in Laurel, MD?
20723 has the Highest Percentage of Population Employed in Life, Physical & Social Science in Laurel, MD with 3.8%.
What is the Percentage of Population Employed in Life, Physical & Social Science in Laurel, MD?
Percentage of Population Employed in Life, Physical & Social Science in Laurel is 2.5%.
What is the Percentage of Population Employed in Life, Physical & Social Science in Maryland?
Percentage of Population Employed in Life, Physical & Social Science in Maryland is 2.2%.
What is the Percentage of Population Employed in Life, Physical & Social Science in the United States?
Percentage of Population Employed in Life, Physical & Social Science in the United States is 1.1%.