Zip Codes with the Highest Percentage of Population with a Degree in Liberal Arts and History in Laurel, MD
RELATED REPORTS & OPTIONS
Liberal Arts and History
Laurel
Compare Zip Codes
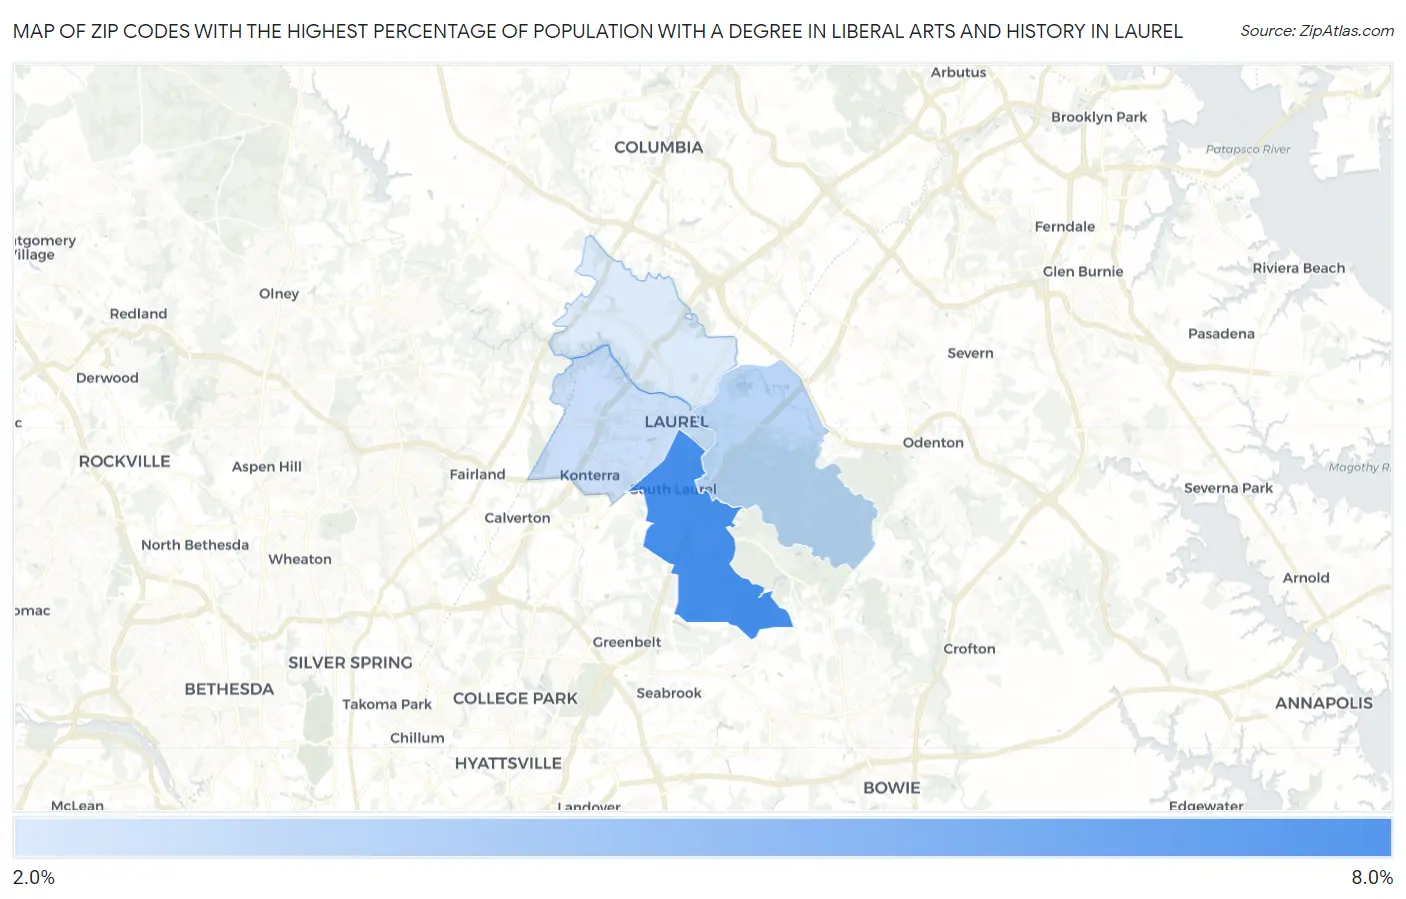
Map of Zip Codes with the Highest Percentage of Population with a Degree in Liberal Arts and History in Laurel
0.0%
8.0%
Zip Codes with the Highest Percentage of Population with a Degree in Liberal Arts and History in Laurel, MD
| Zip Code | % Graduates | vs State | vs National | |
| 1. | 20708 | 6.2% | 5.0%(+1.15)#127 | 4.9%(+1.32)#8,049 |
| 2. | 20724 | 3.7% | 5.0%(-1.31)#274 | 4.9%(-1.15)#15,808 |
| 3. | 20707 | 3.4% | 5.0%(-1.67)#289 | 4.9%(-1.50)#17,082 |
| 4. | 20723 | 3.0% | 5.0%(-2.05)#311 | 4.9%(-1.89)#18,431 |
1
Common Questions
What are the Top 3 Zip Codes with the Highest Percentage of Population with a Degree in Liberal Arts and History in Laurel, MD?
Top 3 Zip Codes with the Highest Percentage of Population with a Degree in Liberal Arts and History in Laurel, MD are:
What zip code has the Highest Percentage of Population with a Degree in Liberal Arts and History in Laurel, MD?
20708 has the Highest Percentage of Population with a Degree in Liberal Arts and History in Laurel, MD with 6.2%.
What is the Percentage of Population with a Degree in Liberal Arts and History in Laurel, MD?
Percentage of Population with a Degree in Liberal Arts and History in Laurel is 4.2%.
What is the Percentage of Population with a Degree in Liberal Arts and History in Maryland?
Percentage of Population with a Degree in Liberal Arts and History in Maryland is 5.0%.
What is the Percentage of Population with a Degree in Liberal Arts and History in the United States?
Percentage of Population with a Degree in Liberal Arts and History in the United States is 4.9%.