Zip Codes with the Highest Percentage of Population Employed in Security & Protection in Laurel, MD
RELATED REPORTS & OPTIONS
Security & Protection
Laurel
Compare Zip Codes
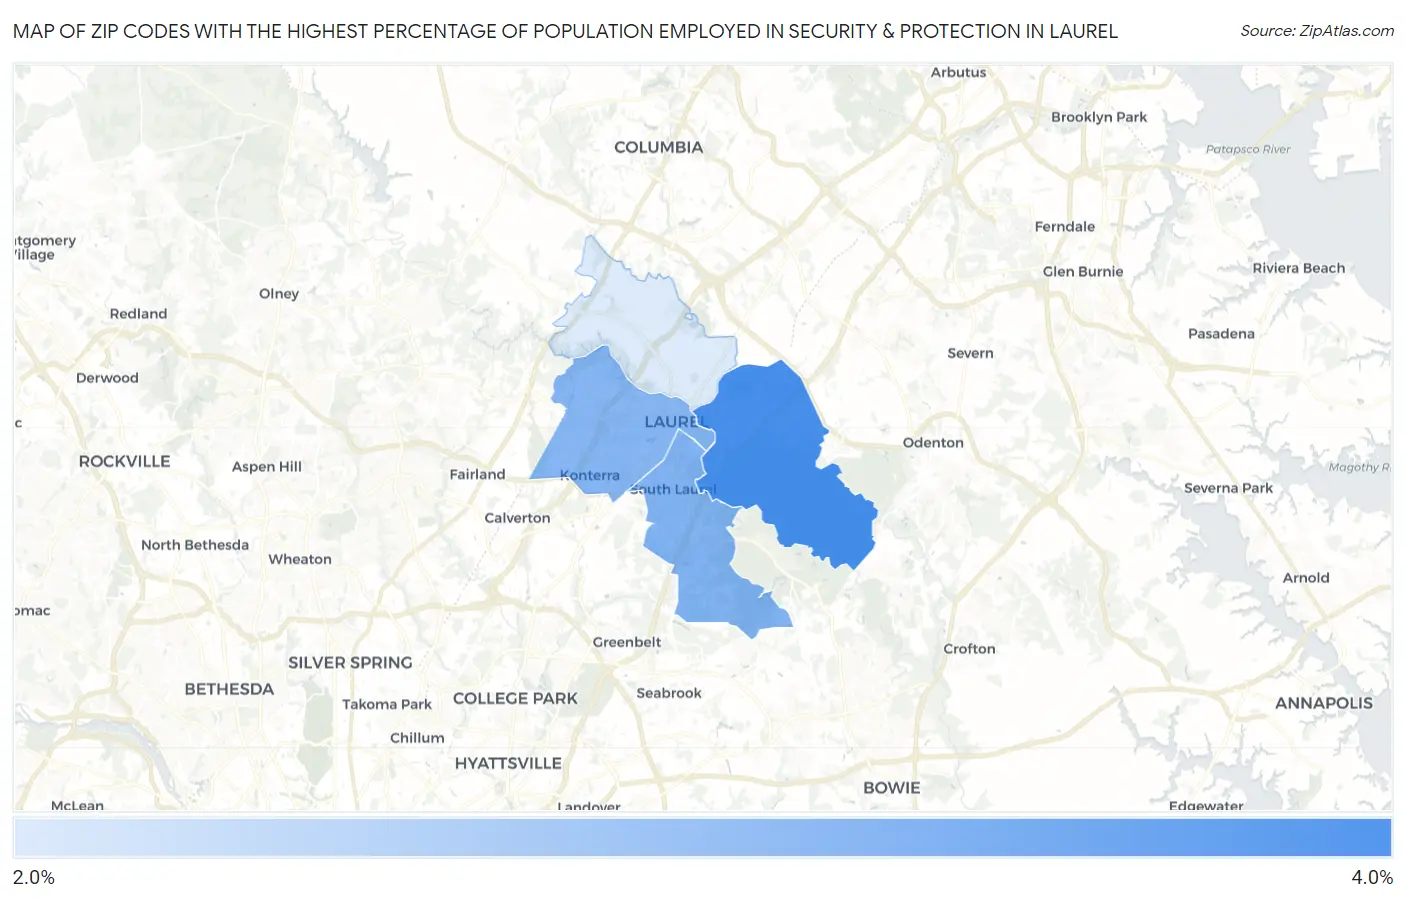
Map of Zip Codes with the Highest Percentage of Population Employed in Security & Protection in Laurel
0.0%
4.0%
Zip Codes with the Highest Percentage of Population Employed in Security & Protection in Laurel, MD
| Zip Code | % Employed | vs State | vs National | |
| 1. | 20724 | 3.4% | 2.8%(+0.646)#134 | 2.1%(+1.30)#5,822 |
| 2. | 20708 | 2.9% | 2.8%(+0.146)#172 | 2.1%(+0.796)#7,461 |
| 3. | 20707 | 2.9% | 2.8%(+0.101)#176 | 2.1%(+0.750)#7,640 |
| 4. | 20723 | 2.1% | 2.8%(-0.650)#238 | 2.1%(-0.001)#11,589 |
1
Common Questions
What are the Top 3 Zip Codes with the Highest Percentage of Population Employed in Security & Protection in Laurel, MD?
Top 3 Zip Codes with the Highest Percentage of Population Employed in Security & Protection in Laurel, MD are:
What zip code has the Highest Percentage of Population Employed in Security & Protection in Laurel, MD?
20724 has the Highest Percentage of Population Employed in Security & Protection in Laurel, MD with 3.4%.
What is the Percentage of Population Employed in Security & Protection in Laurel, MD?
Percentage of Population Employed in Security & Protection in Laurel is 2.7%.
What is the Percentage of Population Employed in Security & Protection in Maryland?
Percentage of Population Employed in Security & Protection in Maryland is 2.8%.
What is the Percentage of Population Employed in Security & Protection in the United States?
Percentage of Population Employed in Security & Protection in the United States is 2.1%.