Vivian, LA
Vivian Map
Vivian Overview
3,086
TOTAL POPULATION
1,719
MALE POPULATION
1,367
FEMALE POPULATION
125.75
MALES / 100 FEMALES
79.52
FEMALES / 100 MALES
32.8
MEDIAN AGE
3.4
AVG FAMILY SIZE
2.3
AVG HOUSEHOLD SIZE
$18,804
PER CAPITA INCOME
$30,000
AVG FAMILY INCOME
$23,875
AVG HOUSEHOLD INCOME
0.48
INEQUALITY / GINI INDEX
1,437
LABOR FORCE [ PEOPLE ]
60.4%
PERCENT IN LABOR FORCE
10.2%
UNEMPLOYMENT RATE
Vivian Zip Codes
Vivian Area Codes
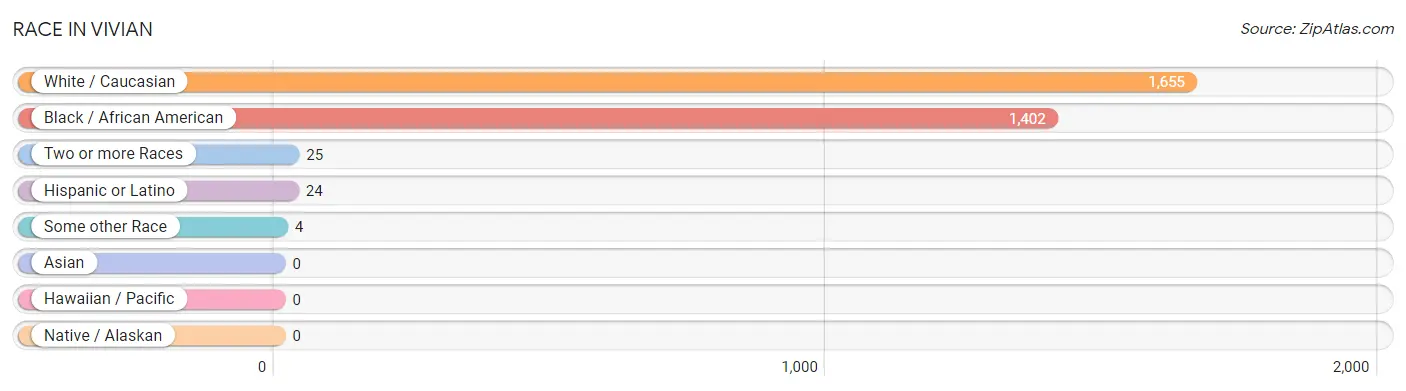
Race in Vivian
The most populous races in Vivian are White / Caucasian (1,655 | 53.6%), Black / African American (1,402 | 45.4%), and Two or more Races (25 | 0.8%).
| Race | # Population | % Population |
| Asian | 0 | 0.0% |
| Black / African American | 1,402 | 45.4% |
| Hawaiian / Pacific | 0 | 0.0% |
| Hispanic or Latino | 24 | 0.8% |
| Native / Alaskan | 0 | 0.0% |
| White / Caucasian | 1,655 | 53.6% |
| Two or more Races | 25 | 0.8% |
| Some other Race | 4 | 0.1% |
| Total | 3,086 | 100.0% |
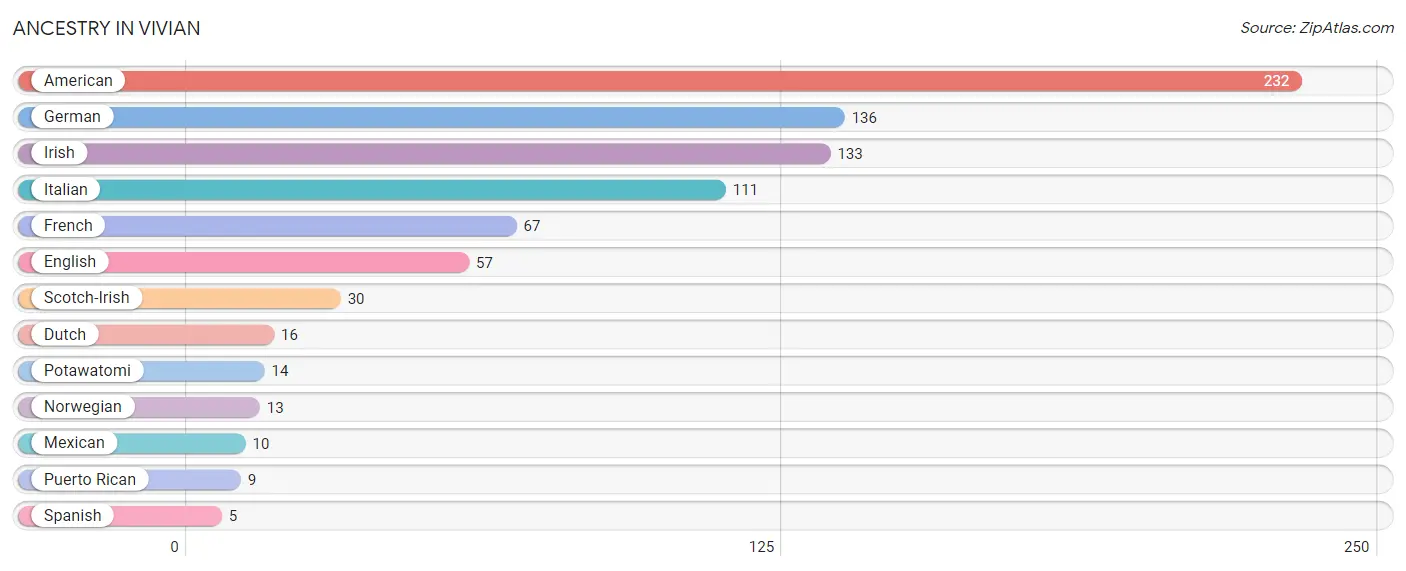
Ancestry in Vivian
The most populous ancestries reported in Vivian are American (232 | 7.5%), German (136 | 4.4%), Irish (133 | 4.3%), Italian (111 | 3.6%), and French (67 | 2.2%), together accounting for 22.0% of all Vivian residents.
| Ancestry | # Population | % Population |
| American | 232 | 7.5% |
| Dutch | 16 | 0.5% |
| English | 57 | 1.8% |
| French | 67 | 2.2% |
| German | 136 | 4.4% |
| Irish | 133 | 4.3% |
| Italian | 111 | 3.6% |
| Mexican | 10 | 0.3% |
| Norwegian | 13 | 0.4% |
| Potawatomi | 14 | 0.4% |
| Puerto Rican | 9 | 0.3% |
| Scotch-Irish | 30 | 1.0% |
| Spanish | 5 | 0.2% | View All 13 Rows |
Immigrants in Vivian

| Immigration Origin | # Population | % Population | View All 0 Rows |
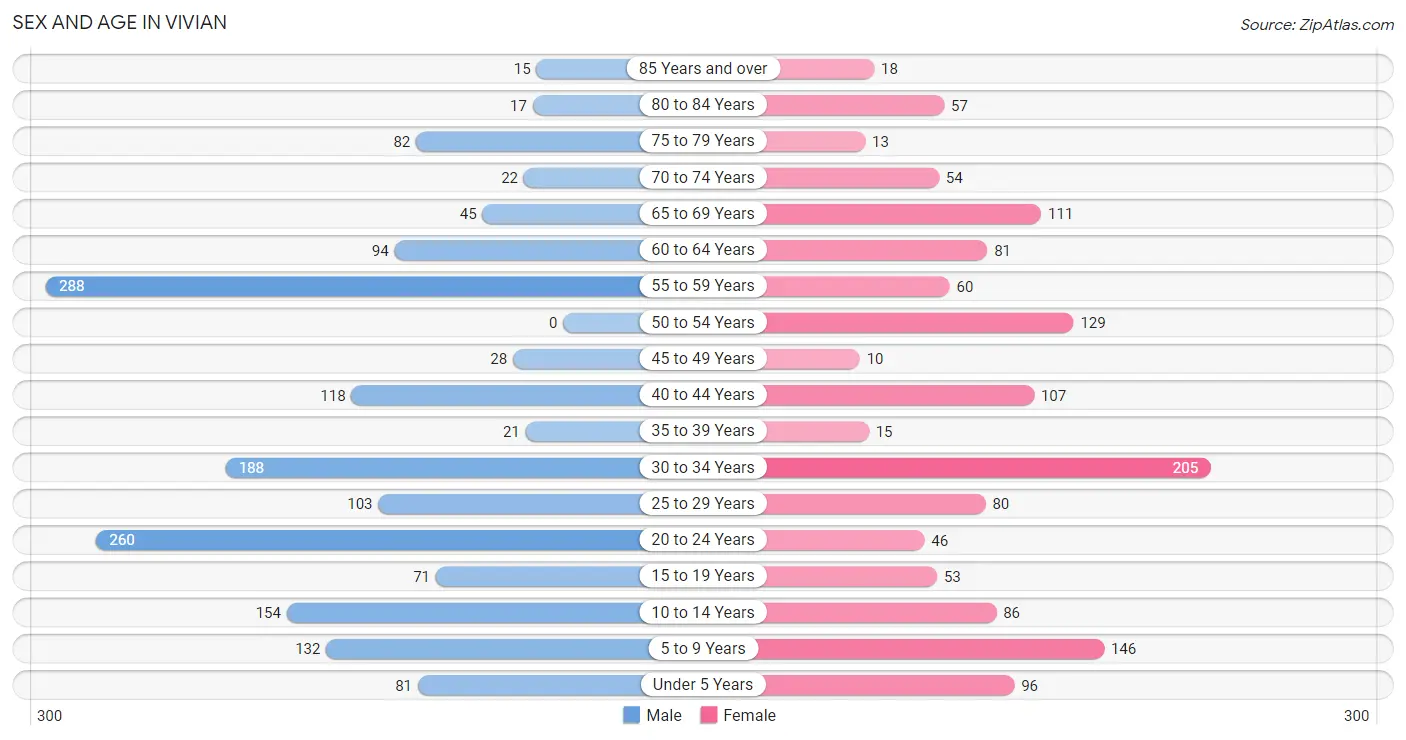
Sex and Age in Vivian
Sex and Age in Vivian
The most populous age groups in Vivian are 55 to 59 Years (288 | 16.8%) for men and 30 to 34 Years (205 | 15.0%) for women.
| Age Bracket | Male | Female |
| Under 5 Years | 81 (4.7%) | 96 (7.0%) |
| 5 to 9 Years | 132 (7.7%) | 146 (10.7%) |
| 10 to 14 Years | 154 (9.0%) | 86 (6.3%) |
| 15 to 19 Years | 71 (4.1%) | 53 (3.9%) |
| 20 to 24 Years | 260 (15.1%) | 46 (3.4%) |
| 25 to 29 Years | 103 (6.0%) | 80 (5.9%) |
| 30 to 34 Years | 188 (10.9%) | 205 (15.0%) |
| 35 to 39 Years | 21 (1.2%) | 15 (1.1%) |
| 40 to 44 Years | 118 (6.9%) | 107 (7.8%) |
| 45 to 49 Years | 28 (1.6%) | 10 (0.7%) |
| 50 to 54 Years | 0 (0.0%) | 129 (9.4%) |
| 55 to 59 Years | 288 (16.8%) | 60 (4.4%) |
| 60 to 64 Years | 94 (5.5%) | 81 (5.9%) |
| 65 to 69 Years | 45 (2.6%) | 111 (8.1%) |
| 70 to 74 Years | 22 (1.3%) | 54 (4.0%) |
| 75 to 79 Years | 82 (4.8%) | 13 (0.9%) |
| 80 to 84 Years | 17 (1.0%) | 57 (4.2%) |
| 85 Years and over | 15 (0.9%) | 18 (1.3%) |
| Total | 1,719 (100.0%) | 1,367 (100.0%) |
Families and Households in Vivian
Median Family Size in Vivian
The median family size in Vivian is 3.40 persons per family, with married-couple families (230 | 35.9%) accounting for the largest median family size of 3.72 persons per family. On the other hand, single male/father families (153 | 23.9%) represent the smallest median family size with 3.03 persons per family.

| Family Type | # Families | Family Size |
| Married-Couple | 230 (35.9%) | 3.72 |
| Single Male/Father | 153 (23.9%) | 3.03 |
| Single Female/Mother | 257 (40.2%) | 3.33 |
| Total Families | 640 (100.0%) | 3.40 |
Median Household Size in Vivian
The median household size in Vivian is 2.29 persons per household, with married-couple households (230 | 17.1%) accounting for the largest median household size of 3.72 persons per household. non-family households (702 | 52.3%) represent the smallest median household size with 1.10 persons per household.
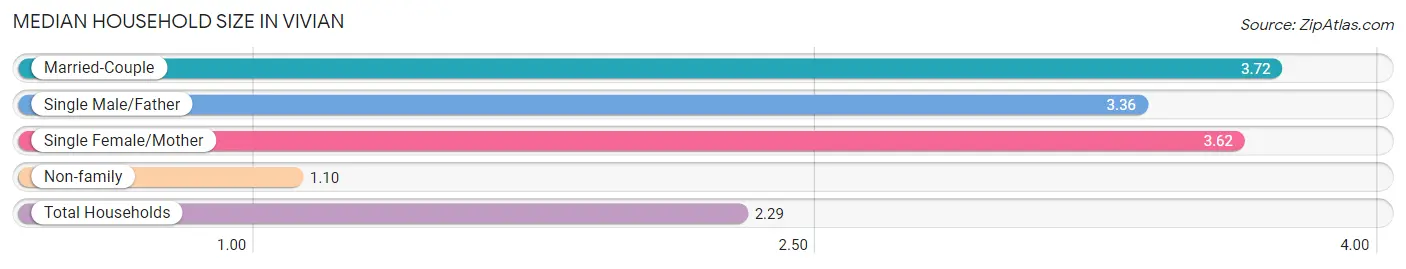
| Household Type | # Households | Household Size |
| Married-Couple | 230 (17.1%) | 3.72 |
| Single Male/Father | 153 (11.4%) | 3.36 |
| Single Female/Mother | 257 (19.2%) | 3.62 |
| Non-family | 702 (52.3%) | 1.10 |
| Total Households | 1,342 (100.0%) | 2.29 |
Household Size by Marriage Status in Vivian
Out of a total of 1,342 households in Vivian, 640 (47.7%) are family households, while 702 (52.3%) are nonfamily households. The most numerous type of family households are 2-person households, comprising 272, and the most common type of nonfamily households are 1-person households, comprising 646.
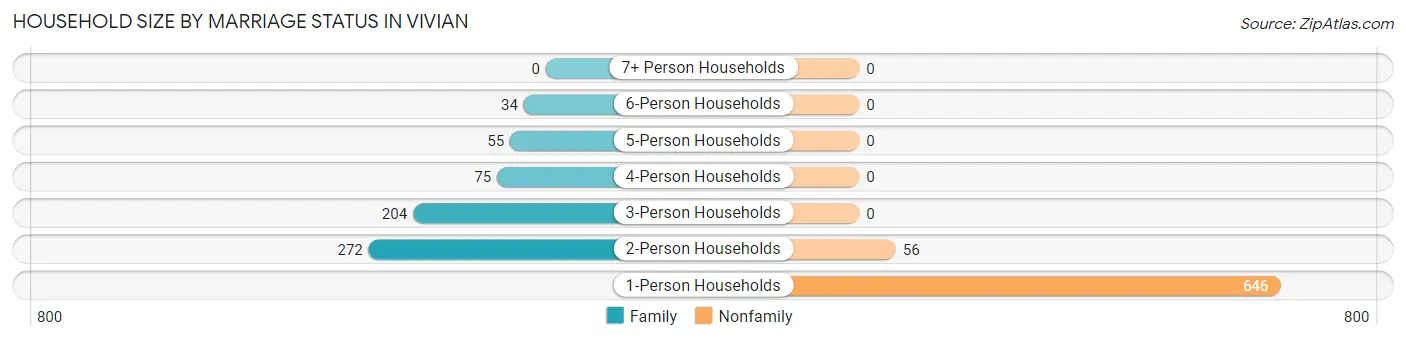
| Household Size | Family Households | Nonfamily Households |
| 1-Person Households | - | 646 (48.1%) |
| 2-Person Households | 272 (20.3%) | 56 (4.2%) |
| 3-Person Households | 204 (15.2%) | 0 (0.0%) |
| 4-Person Households | 75 (5.6%) | 0 (0.0%) |
| 5-Person Households | 55 (4.1%) | 0 (0.0%) |
| 6-Person Households | 34 (2.5%) | 0 (0.0%) |
| 7+ Person Households | 0 (0.0%) | 0 (0.0%) |
| Total | 640 (47.7%) | 702 (52.3%) |
Female Fertility in Vivian
Fertility by Age in Vivian
Average fertility rate in Vivian is 7.0 births per 1,000 women. Women in the age bracket of 20 to 34 years have the highest fertility rate with 12.0 births per 1,000 women. Women in the age bracket of 20 to 34 years acount for 100.0% of all women with births.
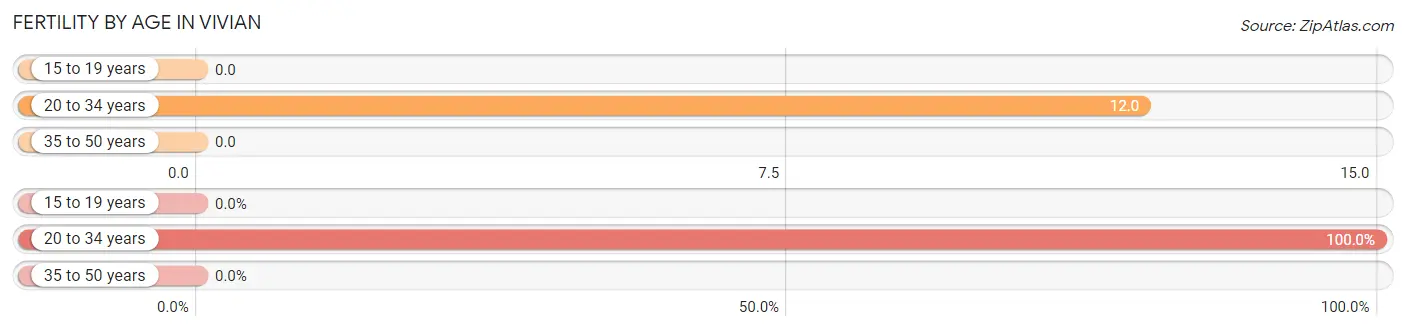
| Age Bracket | Women with Births | Births / 1,000 Women |
| 15 to 19 years | 0 (0.0%) | 0.0 |
| 20 to 34 years | 4 (100.0%) | 12.0 |
| 35 to 50 years | 0 (0.0%) | 0.0 |
| Total | 4 (100.0%) | 7.0 |
Fertility by Age by Marriage Status in Vivian
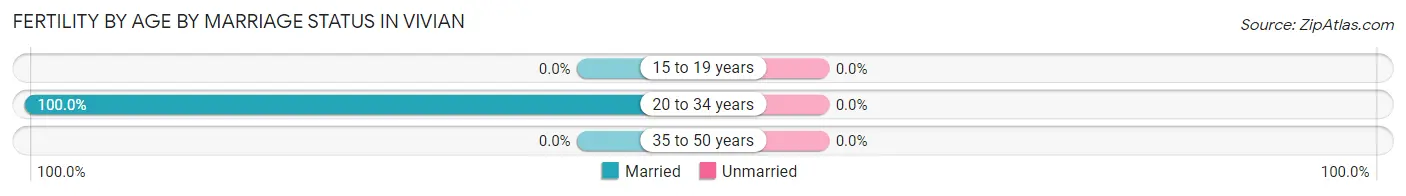
| Age Bracket | Married | Unmarried |
| 15 to 19 years | 0 (0.0%) | 0 (0.0%) |
| 20 to 34 years | 4 (100.0%) | 0 (0.0%) |
| 35 to 50 years | 0 (0.0%) | 0 (0.0%) |
| Total | 4 (100.0%) | 0 (0.0%) |
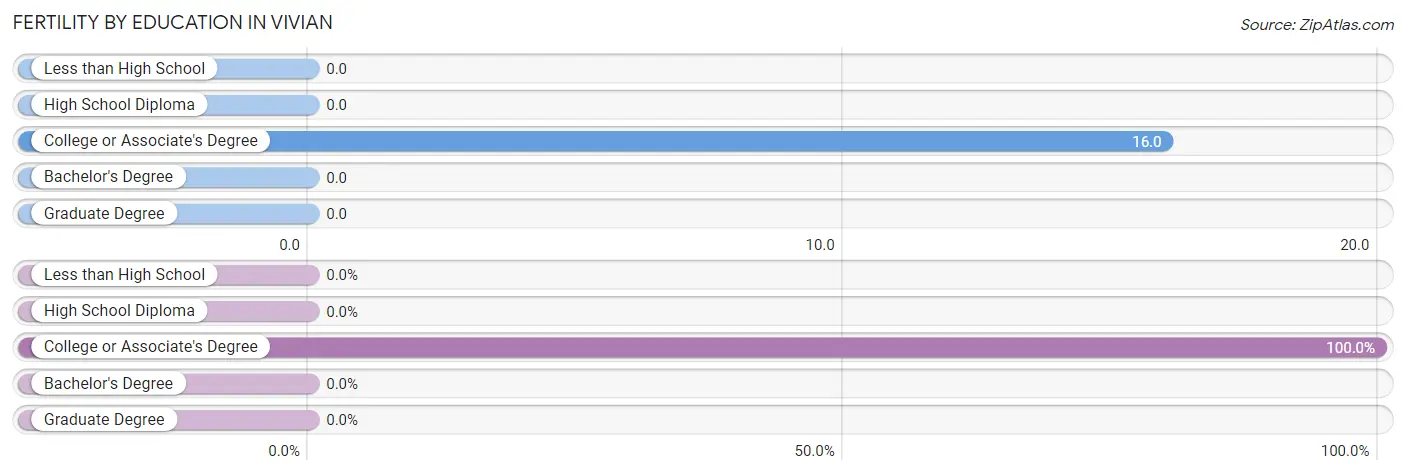
Fertility by Education in Vivian
| Educational Attainment | Women with Births | Births / 1,000 Women |
| Less than High School | 0 (0.0%) | 0.0 |
| High School Diploma | 0 (0.0%) | 0.0 |
| College or Associate's Degree | 4 (100.0%) | 16.0 |
| Bachelor's Degree | 0 (0.0%) | 0.0 |
| Graduate Degree | 0 (0.0%) | 0.0 |
| Total | 4 (100.0%) | 7.0 |
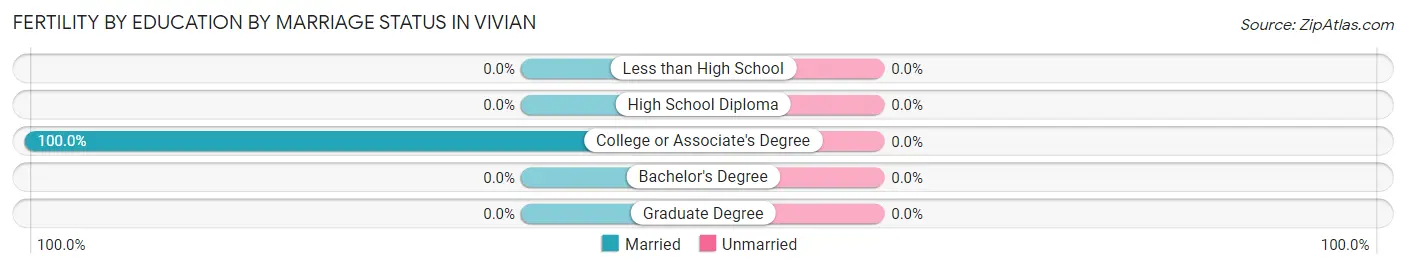
Fertility by Education by Marriage Status in Vivian
| Educational Attainment | Married | Unmarried |
| Less than High School | 0 (0.0%) | 0 (0.0%) |
| High School Diploma | 0 (0.0%) | 0 (0.0%) |
| College or Associate's Degree | 4 (100.0%) | 0 (0.0%) |
| Bachelor's Degree | 0 (0.0%) | 0 (0.0%) |
| Graduate Degree | 0 (0.0%) | 0 (0.0%) |
| Total | 4 (100.0%) | 0 (0.0%) |
Income in Vivian
Income Overview in Vivian
Per Capita Income in Vivian is $18,804, while median incomes of families and households are $30,000 and $23,875 respectively.
| Characteristic | Number | Measure |
| Per Capita Income | 3,086 | $18,804 |
| Median Family Income | 640 | $30,000 |
| Mean Family Income | 640 | $47,293 |
| Median Household Income | 1,342 | $23,875 |
| Mean Household Income | 1,342 | $39,273 |
| Income Deficit | 640 | $0 |
| Wage / Income Gap (%) | 3,086 | 0.00% |
| Wage / Income Gap ($) | 3,086 | 100.00¢ per $1 |
| Gini / Inequality Index | 3,086 | 0.48 |
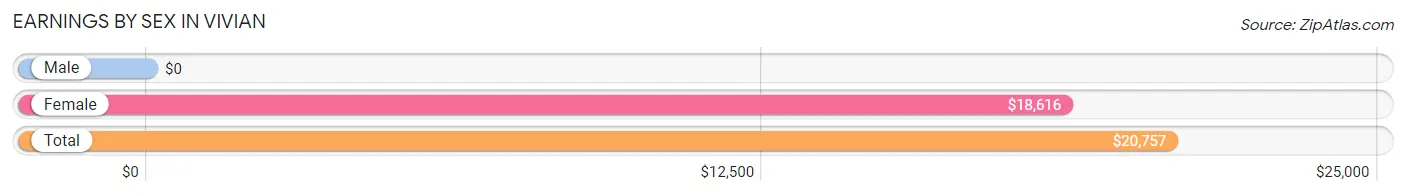
Earnings by Sex in Vivian
| Sex | Number | Average Earnings |
| Male | 795 (57.2%) | $0 |
| Female | 594 (42.8%) | $18,616 |
| Total | 1,389 (100.0%) | $20,757 |
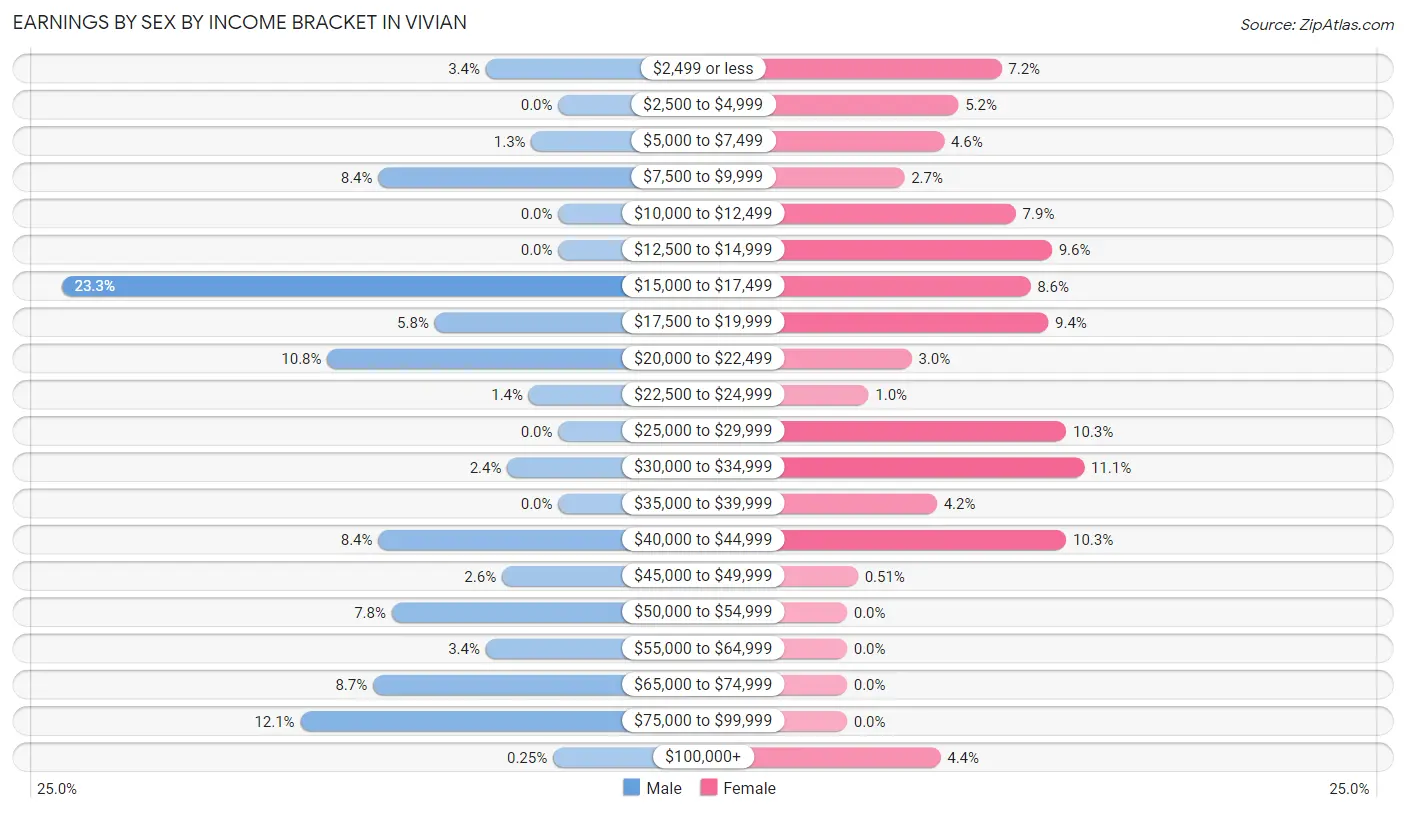
Earnings by Sex by Income Bracket in Vivian
The most common earnings brackets in Vivian are $15,000 to $17,499 for men (185 | 23.3%) and $30,000 to $34,999 for women (66 | 11.1%).
| Income | Male | Female |
| $2,499 or less | 27 (3.4%) | 43 (7.2%) |
| $2,500 to $4,999 | 0 (0.0%) | 31 (5.2%) |
| $5,000 to $7,499 | 10 (1.3%) | 27 (4.5%) |
| $7,500 to $9,999 | 67 (8.4%) | 16 (2.7%) |
| $10,000 to $12,499 | 0 (0.0%) | 47 (7.9%) |
| $12,500 to $14,999 | 0 (0.0%) | 57 (9.6%) |
| $15,000 to $17,499 | 185 (23.3%) | 51 (8.6%) |
| $17,500 to $19,999 | 46 (5.8%) | 56 (9.4%) |
| $20,000 to $22,499 | 86 (10.8%) | 18 (3.0%) |
| $22,500 to $24,999 | 11 (1.4%) | 6 (1.0%) |
| $25,000 to $29,999 | 0 (0.0%) | 61 (10.3%) |
| $30,000 to $34,999 | 19 (2.4%) | 66 (11.1%) |
| $35,000 to $39,999 | 0 (0.0%) | 25 (4.2%) |
| $40,000 to $44,999 | 67 (8.4%) | 61 (10.3%) |
| $45,000 to $49,999 | 21 (2.6%) | 3 (0.5%) |
| $50,000 to $54,999 | 62 (7.8%) | 0 (0.0%) |
| $55,000 to $64,999 | 27 (3.4%) | 0 (0.0%) |
| $65,000 to $74,999 | 69 (8.7%) | 0 (0.0%) |
| $75,000 to $99,999 | 96 (12.1%) | 0 (0.0%) |
| $100,000+ | 2 (0.3%) | 26 (4.4%) |
| Total | 795 (100.0%) | 594 (100.0%) |
Earnings by Sex by Educational Attainment in Vivian
Average earnings in Vivian are $40,938 for men and $19,799 for women, a difference of 51.6%. Men with an educational attainment of high school diploma enjoy the highest average annual earnings of $55,192, while those with college or associate's degree education earn the least with $17,047. Women with an educational attainment of college or associate's degree earn the most with the average annual earnings of $28,431, while those with high school diploma education have the smallest earnings of $13,250.
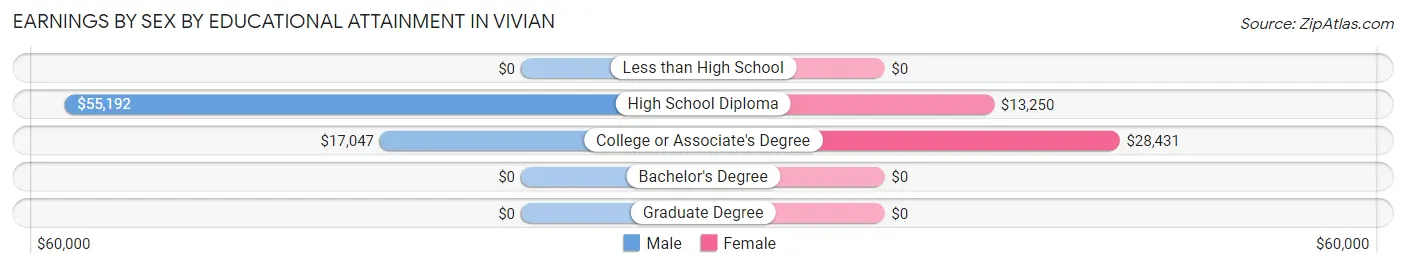
| Educational Attainment | Male Income | Female Income |
| Less than High School | - | - |
| High School Diploma | $55,192 | $13,250 |
| College or Associate's Degree | $17,047 | $28,431 |
| Bachelor's Degree | - | - |
| Graduate Degree | - | - |
| Total | $40,938 | $19,799 |
Family Income in Vivian
Family Income Brackets in Vivian
According to the Vivian family income data, there are 144 families falling into the $15,000 to $24,999 income range, which is the most common income bracket and makes up 22.5% of all families.
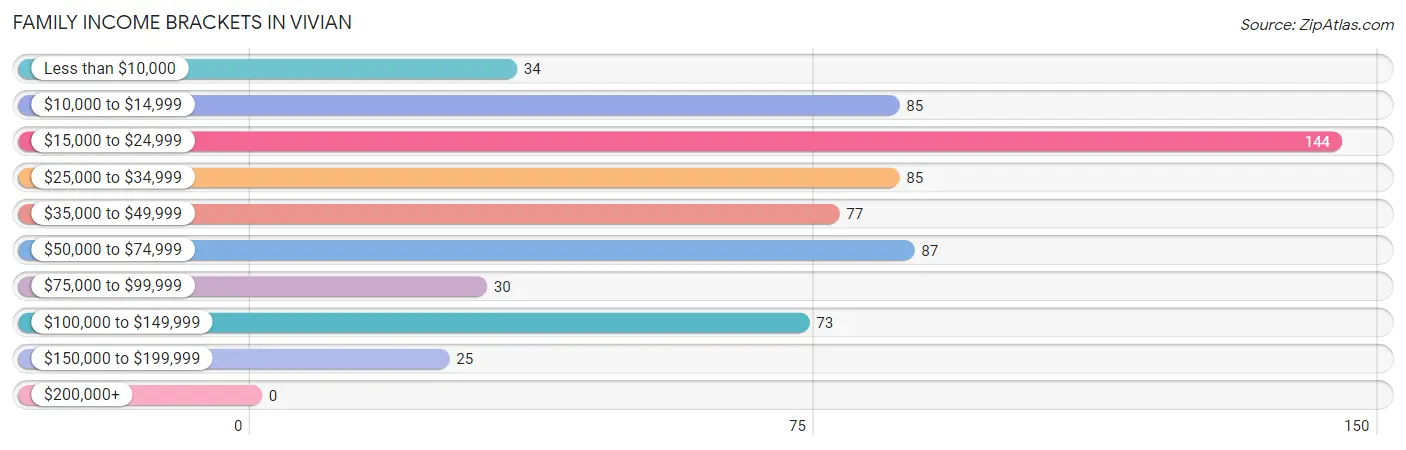
| Income Bracket | # Families | % Families |
| Less than $10,000 | 34 | 5.3% |
| $10,000 to $14,999 | 85 | 13.3% |
| $15,000 to $24,999 | 144 | 22.5% |
| $25,000 to $34,999 | 85 | 13.3% |
| $35,000 to $49,999 | 77 | 12.0% |
| $50,000 to $74,999 | 87 | 13.6% |
| $75,000 to $99,999 | 30 | 4.7% |
| $100,000 to $149,999 | 73 | 11.4% |
| $150,000 to $199,999 | 25 | 3.9% |
| $200,000+ | 0 | 0.0% |
Family Income by Famaliy Size in Vivian
4-person families (31 | 4.8%) account for the highest median family income in Vivian with $54,886 per family, while 2-person families (324 | 50.6%) have the highest median income of $21,480 per family member.
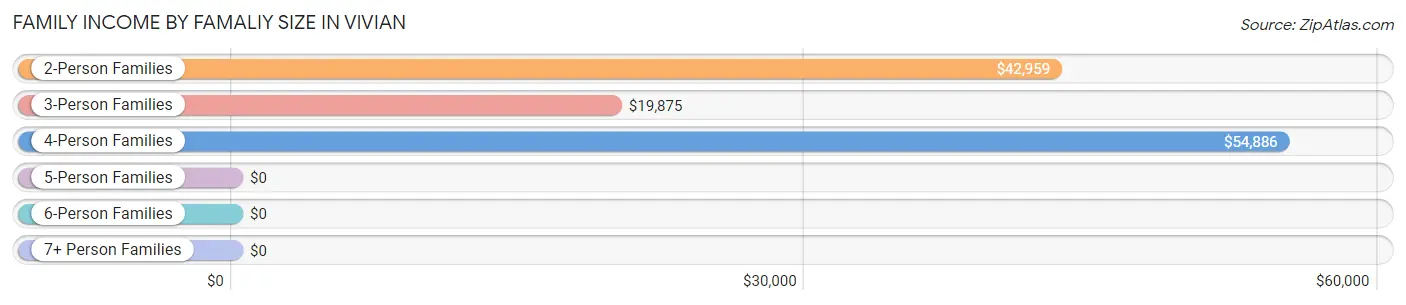
| Income Bracket | # Families | Median Income |
| 2-Person Families | 324 (50.6%) | $42,959 |
| 3-Person Families | 196 (30.6%) | $19,875 |
| 4-Person Families | 31 (4.8%) | $54,886 |
| 5-Person Families | 55 (8.6%) | $0 |
| 6-Person Families | 34 (5.3%) | $0 |
| 7+ Person Families | 0 (0.0%) | $0 |
| Total | 640 (100.0%) | $30,000 |
Family Income by Number of Earners in Vivian
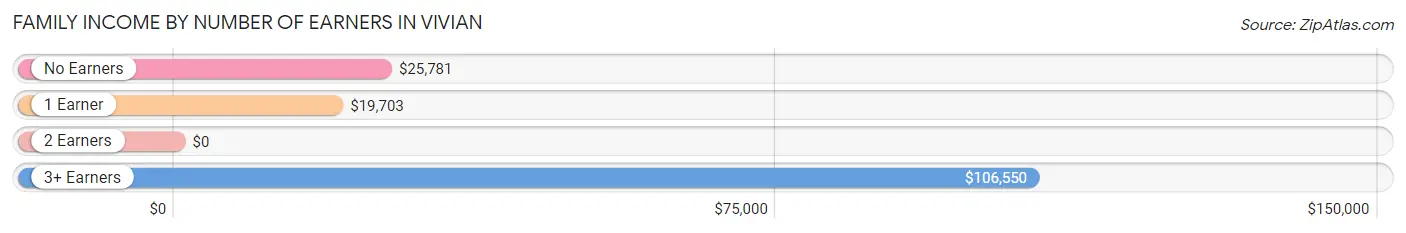
| Number of Earners | # Families | Median Income |
| No Earners | 155 (24.2%) | $25,781 |
| 1 Earner | 301 (47.0%) | $19,703 |
| 2 Earners | 104 (16.3%) | $0 |
| 3+ Earners | 80 (12.5%) | $106,550 |
| Total | 640 (100.0%) | $30,000 |
Household Income in Vivian
Household Income Brackets in Vivian
With 315 households falling in the category, the $15,000 to $24,999 income range is the most frequent in Vivian, accounting for 23.5% of all households.
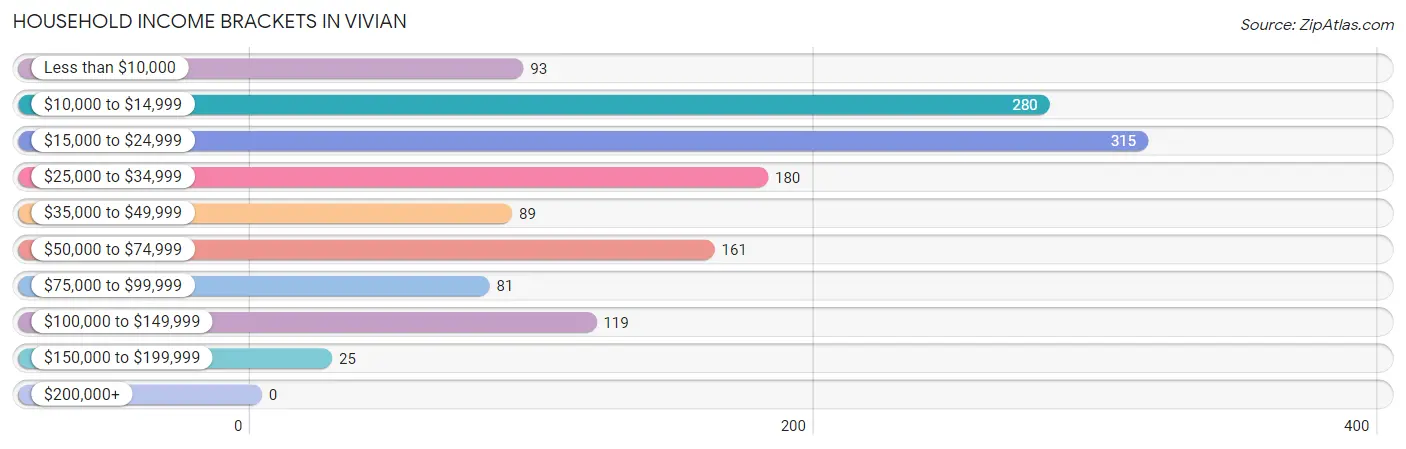
| Income Bracket | # Households | % Households |
| Less than $10,000 | 93 | 6.9% |
| $10,000 to $14,999 | 280 | 20.9% |
| $15,000 to $24,999 | 315 | 23.5% |
| $25,000 to $34,999 | 180 | 13.4% |
| $35,000 to $49,999 | 89 | 6.6% |
| $50,000 to $74,999 | 161 | 12.0% |
| $75,000 to $99,999 | 81 | 6.0% |
| $100,000 to $149,999 | 119 | 8.9% |
| $150,000 to $199,999 | 25 | 1.9% |
| $200,000+ | 0 | 0.0% |
Household Income by Householder Age in Vivian
The median household income in Vivian is $23,875, with the highest median household income of $26,058 found in the 65+ years age bracket for the primary householder. A total of 317 households (23.6%) fall into this category. Meanwhile, the 15 to 24 years age bracket for the primary householder has the lowest median household income of $0, with 11 households (0.8%) in this group.
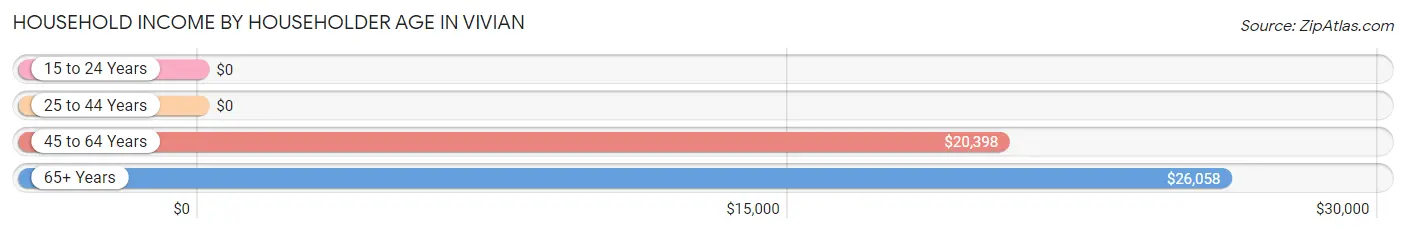
| Income Bracket | # Households | Median Income |
| 15 to 24 Years | 11 (0.8%) | $0 |
| 25 to 44 Years | 473 (35.2%) | $0 |
| 45 to 64 Years | 541 (40.3%) | $20,398 |
| 65+ Years | 317 (23.6%) | $26,058 |
| Total | 1,342 (100.0%) | $23,875 |
Poverty in Vivian
Income Below Poverty by Sex and Age in Vivian
With 36.1% poverty level for males and 51.6% for females among the residents of Vivian, under 5 year old males and 15 year old females are the most vulnerable to poverty, with 57 males (70.4%) and 12 females (100.0%) in their respective age groups living below the poverty level.
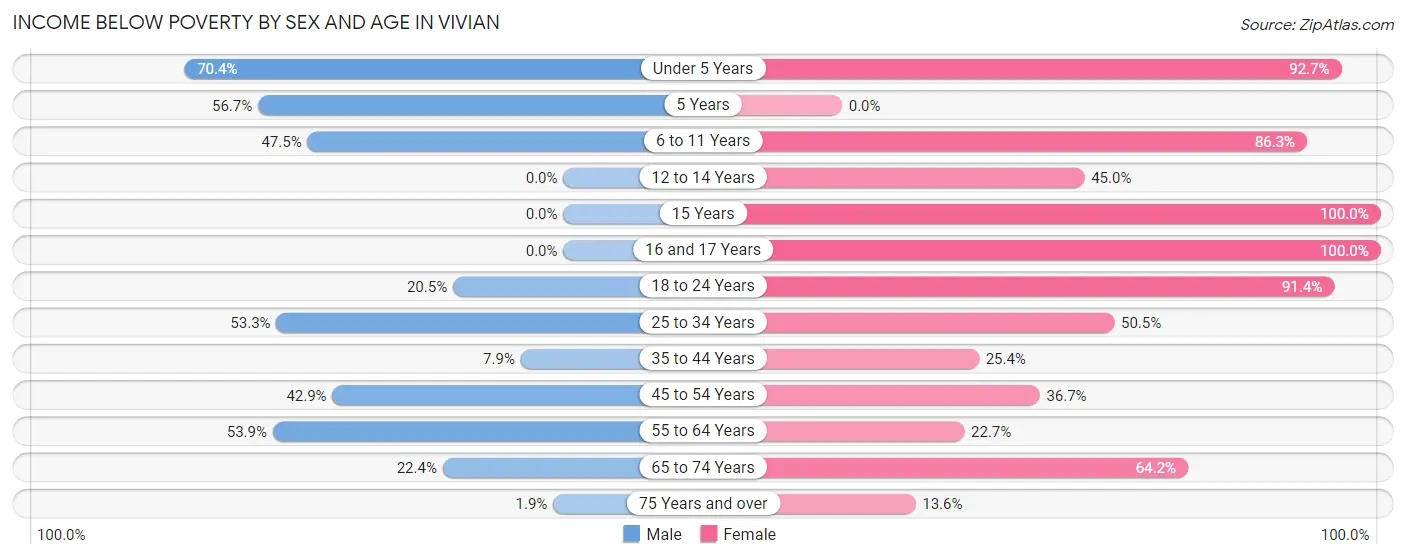
| Age Bracket | Male | Female |
| Under 5 Years | 57 (70.4%) | 89 (92.7%) |
| 5 Years | 17 (56.7%) | 0 (0.0%) |
| 6 to 11 Years | 85 (47.5%) | 120 (86.3%) |
| 12 to 14 Years | 0 (0.0%) | 27 (45.0%) |
| 15 Years | 0 (0.0%) | 12 (100.0%) |
| 16 and 17 Years | 0 (0.0%) | 29 (100.0%) |
| 18 to 24 Years | 58 (20.5%) | 53 (91.4%) |
| 25 to 34 Years | 155 (53.3%) | 144 (50.5%) |
| 35 to 44 Years | 11 (7.9%) | 31 (25.4%) |
| 45 to 54 Years | 12 (42.9%) | 51 (36.7%) |
| 55 to 64 Years | 206 (53.9%) | 32 (22.7%) |
| 65 to 74 Years | 15 (22.4%) | 106 (64.2%) |
| 75 Years and over | 2 (1.9%) | 12 (13.6%) |
| Total | 618 (36.1%) | 706 (51.6%) |
Income Above Poverty by Sex and Age in Vivian
According to the poverty statistics in Vivian, males aged 12 to 14 years and females aged 5 years are the age groups that are most secure financially, with 100.0% of males and 100.0% of females in these age groups living above the poverty line.
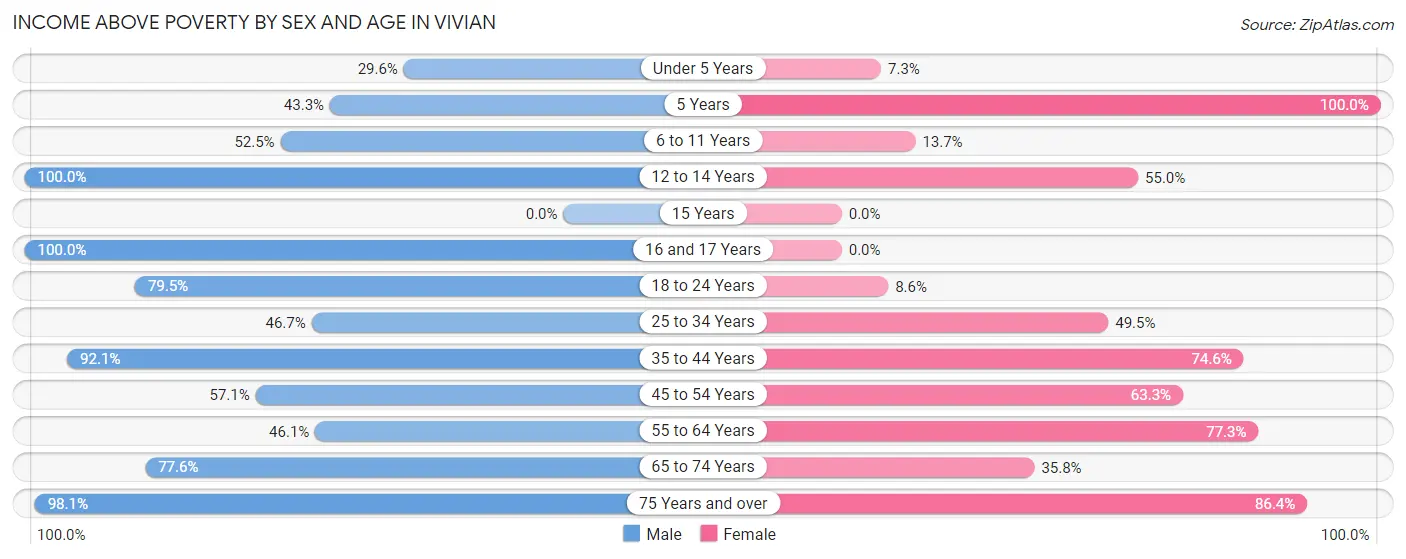
| Age Bracket | Male | Female |
| Under 5 Years | 24 (29.6%) | 7 (7.3%) |
| 5 Years | 13 (43.3%) | 33 (100.0%) |
| 6 to 11 Years | 94 (52.5%) | 19 (13.7%) |
| 12 to 14 Years | 77 (100.0%) | 33 (55.0%) |
| 15 Years | 0 (0.0%) | 0 (0.0%) |
| 16 and 17 Years | 48 (100.0%) | 0 (0.0%) |
| 18 to 24 Years | 225 (79.5%) | 5 (8.6%) |
| 25 to 34 Years | 136 (46.7%) | 141 (49.5%) |
| 35 to 44 Years | 128 (92.1%) | 91 (74.6%) |
| 45 to 54 Years | 16 (57.1%) | 88 (63.3%) |
| 55 to 64 Years | 176 (46.1%) | 109 (77.3%) |
| 65 to 74 Years | 52 (77.6%) | 59 (35.8%) |
| 75 Years and over | 104 (98.1%) | 76 (86.4%) |
| Total | 1,093 (63.9%) | 661 (48.3%) |
Income Below Poverty Among Married-Couple Families in Vivian
The poverty statistics for married-couple families in Vivian show that 3.5% or 8 of the total 230 families live below the poverty line. Families with no children have the highest poverty rate of 6.5%, comprising of 8 families. On the other hand, families with 1 or 2 children have the lowest poverty rate of 0.0%, which includes 0 families.
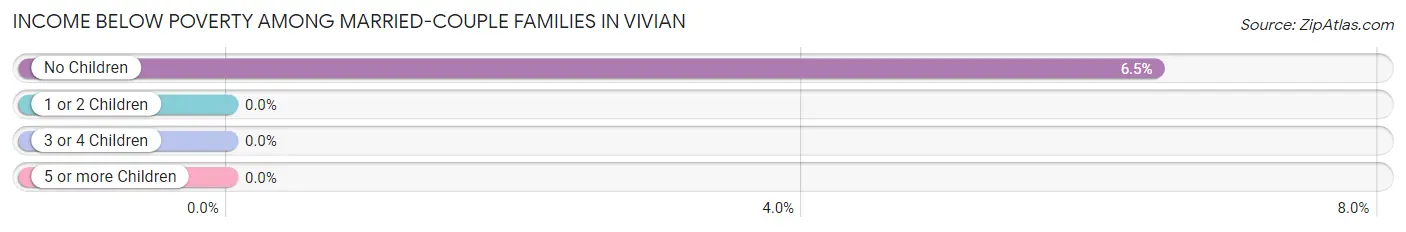
| Children | Above Poverty | Below Poverty |
| No Children | 116 (93.5%) | 8 (6.5%) |
| 1 or 2 Children | 102 (100.0%) | 0 (0.0%) |
| 3 or 4 Children | 4 (100.0%) | 0 (0.0%) |
| 5 or more Children | 0 (0.0%) | 0 (0.0%) |
| Total | 222 (96.5%) | 8 (3.5%) |
Income Below Poverty Among Single-Parent Households in Vivian
According to the poverty data in Vivian, 47.7% or 73 single-father households and 64.6% or 166 single-mother households are living below the poverty line. Among single-father households, those with no children have the highest poverty rate, with 31 households (58.5%) experiencing poverty. Likewise, among single-mother households, those with 1 or 2 children have the highest poverty rate, with 151 households (87.8%) falling below the poverty line.

| Children | Single Father | Single Mother |
| No Children | 31 (58.5%) | 15 (17.6%) |
| 1 or 2 Children | 42 (42.0%) | 151 (87.8%) |
| 3 or 4 Children | 0 (0.0%) | 0 (0.0%) |
| 5 or more Children | 0 (0.0%) | 0 (0.0%) |
| Total | 73 (47.7%) | 166 (64.6%) |
Income Below Poverty Among Married-Couple vs Single-Parent Households in Vivian
The poverty data for Vivian shows that 8 of the married-couple family households (3.5%) and 239 of the single-parent households (58.3%) are living below the poverty level. Within the married-couple family households, those with no children have the highest poverty rate, with 8 households (6.5%) falling below the poverty line. Among the single-parent households, those with 1 or 2 children have the highest poverty rate, with 193 household (71.0%) living below poverty.
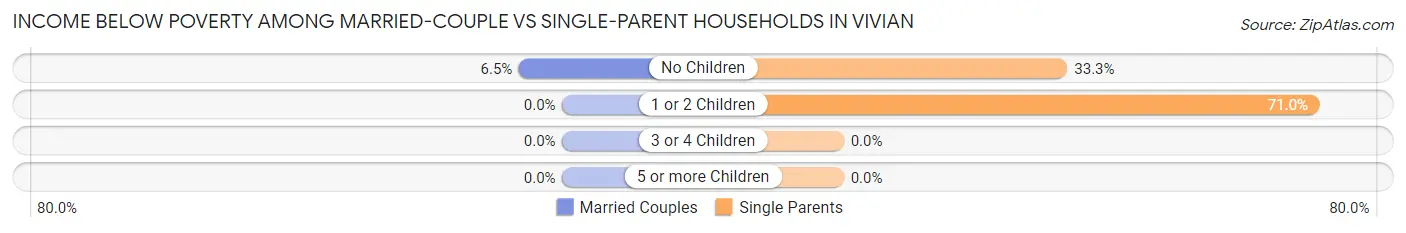
| Children | Married-Couple Families | Single-Parent Households |
| No Children | 8 (6.5%) | 46 (33.3%) |
| 1 or 2 Children | 0 (0.0%) | 193 (71.0%) |
| 3 or 4 Children | 0 (0.0%) | 0 (0.0%) |
| 5 or more Children | 0 (0.0%) | 0 (0.0%) |
| Total | 8 (3.5%) | 239 (58.3%) |
Employment Characteristics in Vivian
Employment by Class of Employer in Vivian
Among the 1,245 employed individuals in Vivian, private company employees (1,049 | 84.3%), not-for-profit organizations (80 | 6.4%), and local government employees (57 | 4.6%) make up the most common classes of employment.
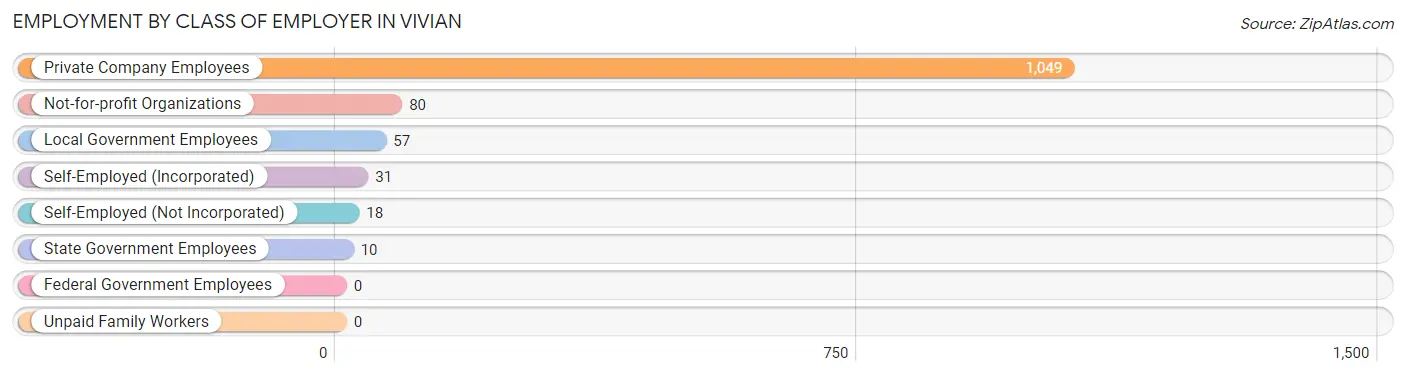
| Employer Class | # Employees | % Employees |
| Private Company Employees | 1,049 | 84.3% |
| Self-Employed (Incorporated) | 31 | 2.5% |
| Self-Employed (Not Incorporated) | 18 | 1.5% |
| Not-for-profit Organizations | 80 | 6.4% |
| Local Government Employees | 57 | 4.6% |
| State Government Employees | 10 | 0.8% |
| Federal Government Employees | 0 | 0.0% |
| Unpaid Family Workers | 0 | 0.0% |
| Total | 1,245 | 100.0% |
Employment Status by Age in Vivian
According to the labor force statistics for Vivian, out of the total population over 16 years of age (2,379), 60.4% or 1,437 individuals are in the labor force, with 10.2% or 147 of them unemployed. The age group with the highest labor force participation rate is 35 to 44 years, with 91.6% or 239 individuals in the labor force. Within the labor force, the 65 to 74 years age range has the highest percentage of unemployed individuals, with 42.1% or 8 of them being unemployed.
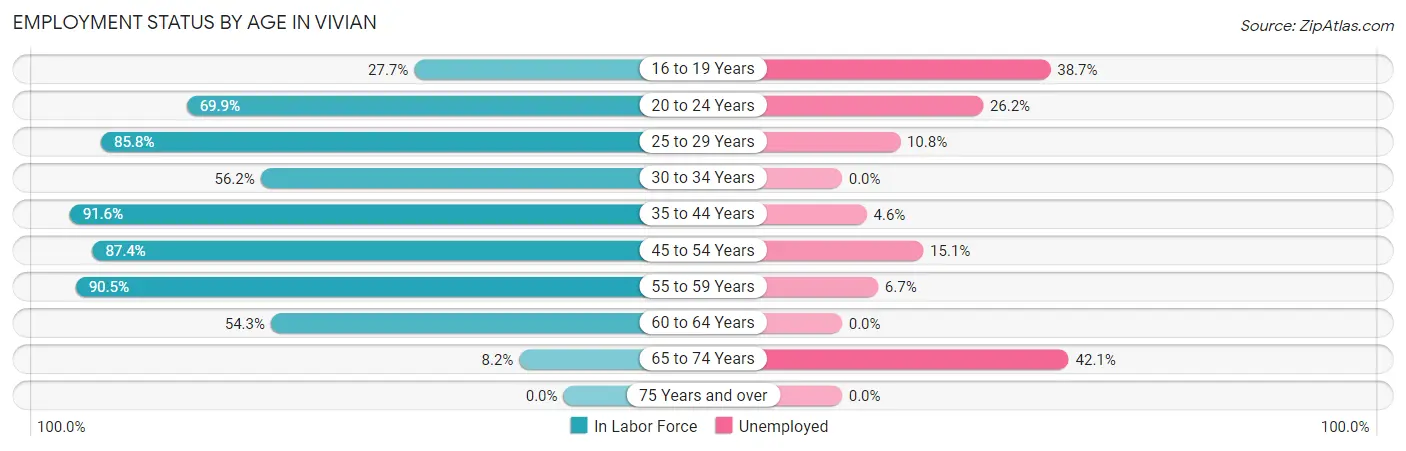
| Age Bracket | In Labor Force | Unemployed |
| 16 to 19 Years | 31 (27.7%) | 12 (38.7%) |
| 20 to 24 Years | 214 (69.9%) | 56 (26.2%) |
| 25 to 29 Years | 157 (85.8%) | 17 (10.8%) |
| 30 to 34 Years | 221 (56.2%) | 0 (0.0%) |
| 35 to 44 Years | 239 (91.6%) | 11 (4.6%) |
| 45 to 54 Years | 146 (87.4%) | 22 (15.1%) |
| 55 to 59 Years | 315 (90.5%) | 21 (6.7%) |
| 60 to 64 Years | 95 (54.3%) | 0 (0.0%) |
| 65 to 74 Years | 19 (8.2%) | 8 (42.1%) |
| 75 Years and over | 0 (0.0%) | 0 (0.0%) |
| Total | 1,437 (60.4%) | 147 (10.2%) |
Employment Status by Educational Attainment in Vivian
According to labor force statistics for Vivian, 76.8% of individuals (1,173) out of the total population between 25 and 64 years of age (1,527) are in the labor force, with 6.1% or 72 of them being unemployed. The group with the highest labor force participation rate are those with the educational attainment of bachelor's degree or higher, with 90.9% or 90 individuals in the labor force. Within the labor force, individuals with high school diploma education have the highest percentage of unemployment, with 14.4% or 50 of them being unemployed.
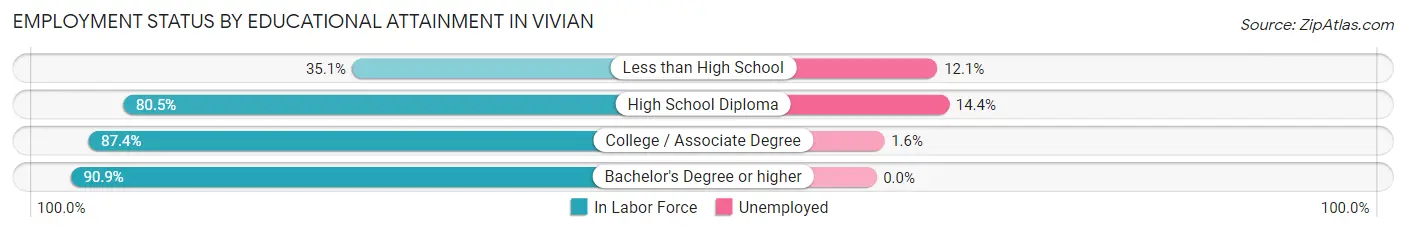
| Educational Attainment | In Labor Force | Unemployed |
| Less than High School | 91 (35.1%) | 31 (12.1%) |
| High School Diploma | 347 (80.5%) | 62 (14.4%) |
| College / Associate Degree | 645 (87.4%) | 12 (1.6%) |
| Bachelor's Degree or higher | 90 (90.9%) | 0 (0.0%) |
| Total | 1,173 (76.8%) | 93 (6.1%) |
Employment Occupations by Sex in Vivian
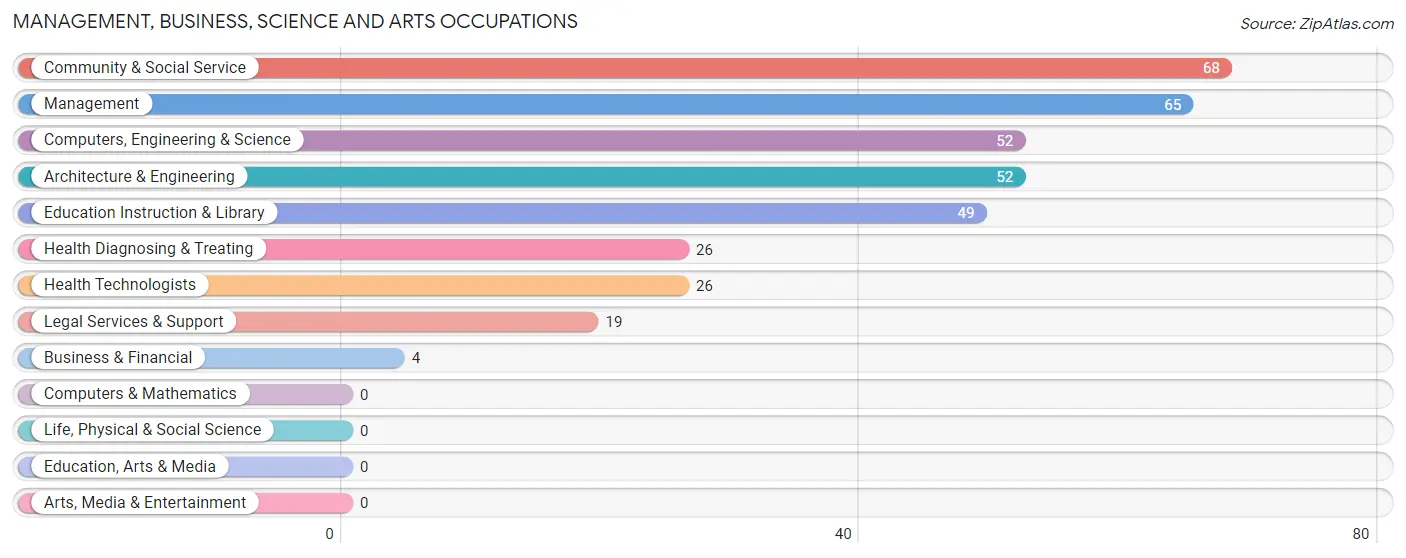
Management, Business, Science and Arts Occupations
The most common Management, Business, Science and Arts occupations in Vivian are Community & Social Service (68 | 5.3%), Management (65 | 5.0%), Computers, Engineering & Science (52 | 4.0%), Architecture & Engineering (52 | 4.0%), and Education Instruction & Library (49 | 3.8%).
Management, Business, Science and Arts Occupations by Sex
Within the Management, Business, Science and Arts occupations in Vivian, the most male-oriented occupations are Business & Financial (100.0%), Computers, Engineering & Science (100.0%), and Architecture & Engineering (100.0%), while the most female-oriented occupations are Legal Services & Support (100.0%), Health Diagnosing & Treating (100.0%), and Health Technologists (100.0%).
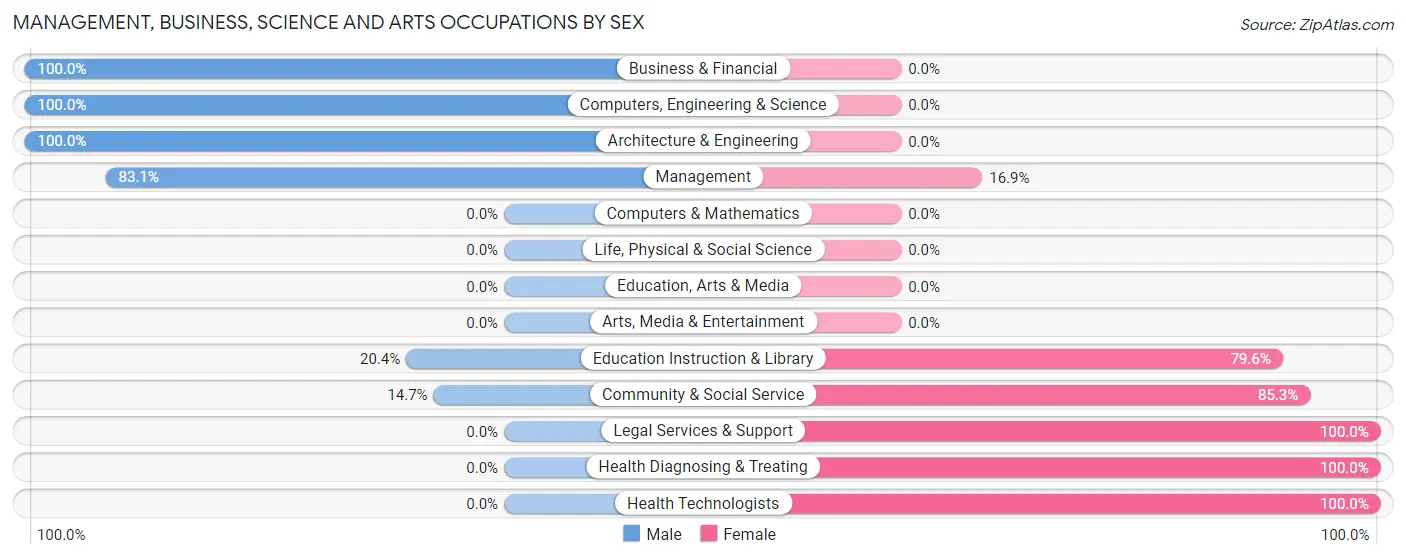
| Occupation | Male | Female |
| Management | 54 (83.1%) | 11 (16.9%) |
| Business & Financial | 4 (100.0%) | 0 (0.0%) |
| Computers, Engineering & Science | 52 (100.0%) | 0 (0.0%) |
| Computers & Mathematics | 0 (0.0%) | 0 (0.0%) |
| Architecture & Engineering | 52 (100.0%) | 0 (0.0%) |
| Life, Physical & Social Science | 0 (0.0%) | 0 (0.0%) |
| Community & Social Service | 10 (14.7%) | 58 (85.3%) |
| Education, Arts & Media | 0 (0.0%) | 0 (0.0%) |
| Legal Services & Support | 0 (0.0%) | 19 (100.0%) |
| Education Instruction & Library | 10 (20.4%) | 39 (79.6%) |
| Arts, Media & Entertainment | 0 (0.0%) | 0 (0.0%) |
| Health Diagnosing & Treating | 0 (0.0%) | 26 (100.0%) |
| Health Technologists | 0 (0.0%) | 26 (100.0%) |
| Total (Category) | 120 (55.8%) | 95 (44.2%) |
| Total (Overall) | 770 (59.7%) | 520 (40.3%) |
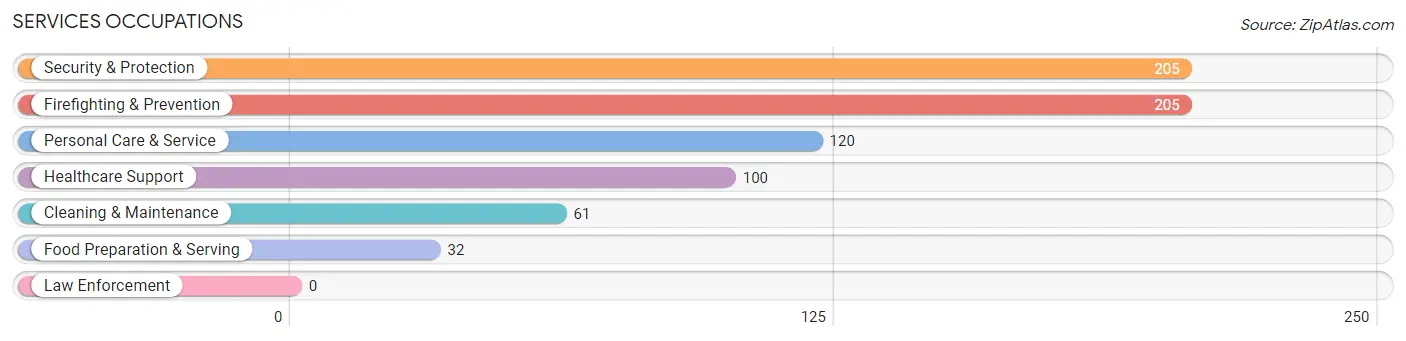
Services Occupations
The most common Services occupations in Vivian are Security & Protection (205 | 15.9%), Firefighting & Prevention (205 | 15.9%), Personal Care & Service (120 | 9.3%), Healthcare Support (100 | 7.7%), and Cleaning & Maintenance (61 | 4.7%).
Services Occupations by Sex
Within the Services occupations in Vivian, the most male-oriented occupations are Security & Protection (100.0%), Firefighting & Prevention (100.0%), and Personal Care & Service (46.7%), while the most female-oriented occupations are Healthcare Support (100.0%), Food Preparation & Serving (100.0%), and Cleaning & Maintenance (83.6%).
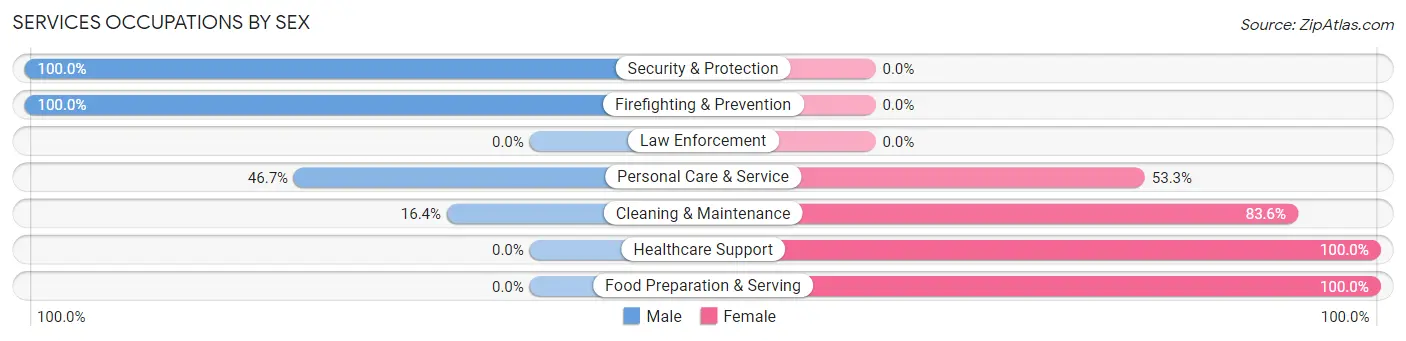
| Occupation | Male | Female |
| Healthcare Support | 0 (0.0%) | 100 (100.0%) |
| Security & Protection | 205 (100.0%) | 0 (0.0%) |
| Firefighting & Prevention | 205 (100.0%) | 0 (0.0%) |
| Law Enforcement | 0 (0.0%) | 0 (0.0%) |
| Food Preparation & Serving | 0 (0.0%) | 32 (100.0%) |
| Cleaning & Maintenance | 10 (16.4%) | 51 (83.6%) |
| Personal Care & Service | 56 (46.7%) | 64 (53.3%) |
| Total (Category) | 271 (52.3%) | 247 (47.7%) |
| Total (Overall) | 770 (59.7%) | 520 (40.3%) |
Sales and Office Occupations
The most common Sales and Office occupations in Vivian are Office & Administration (162 | 12.6%), and Sales & Related (69 | 5.3%).
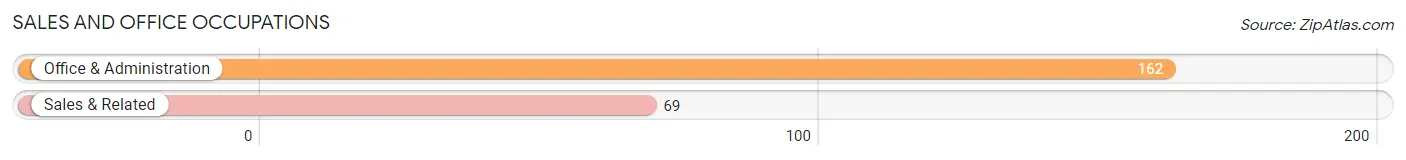
Sales and Office Occupations by Sex

| Occupation | Male | Female |
| Sales & Related | 11 (15.9%) | 58 (84.1%) |
| Office & Administration | 42 (25.9%) | 120 (74.1%) |
| Total (Category) | 53 (22.9%) | 178 (77.1%) |
| Total (Overall) | 770 (59.7%) | 520 (40.3%) |
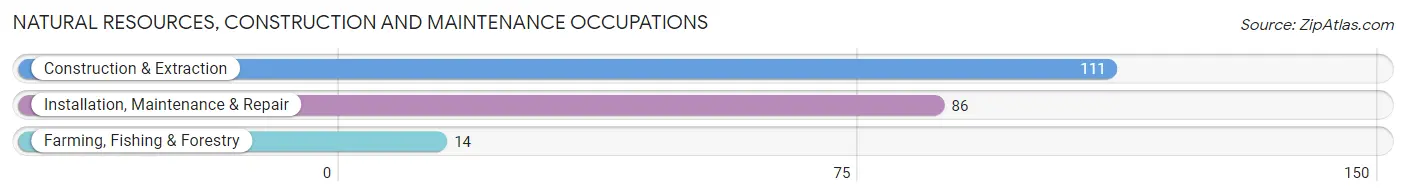
Natural Resources, Construction and Maintenance Occupations
The most common Natural Resources, Construction and Maintenance occupations in Vivian are Construction & Extraction (111 | 8.6%), Installation, Maintenance & Repair (86 | 6.7%), and Farming, Fishing & Forestry (14 | 1.1%).
Natural Resources, Construction and Maintenance Occupations by Sex
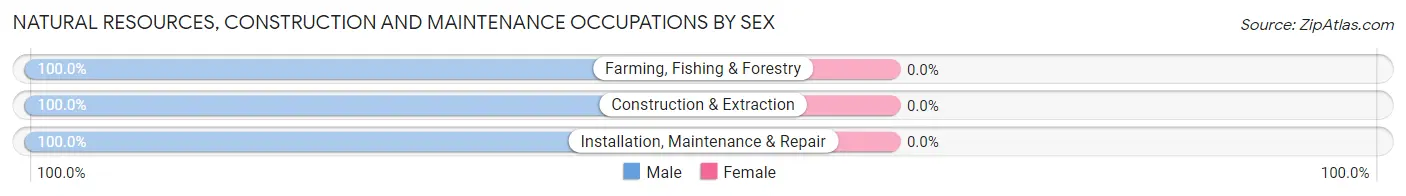
| Occupation | Male | Female |
| Farming, Fishing & Forestry | 14 (100.0%) | 0 (0.0%) |
| Construction & Extraction | 111 (100.0%) | 0 (0.0%) |
| Installation, Maintenance & Repair | 86 (100.0%) | 0 (0.0%) |
| Total (Category) | 211 (100.0%) | 0 (0.0%) |
| Total (Overall) | 770 (59.7%) | 520 (40.3%) |
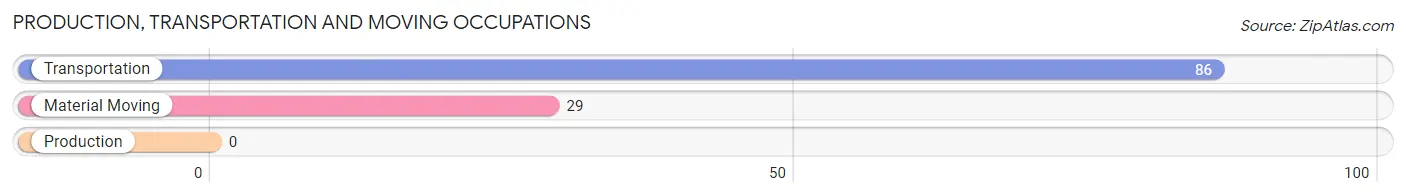
Production, Transportation and Moving Occupations
The most common Production, Transportation and Moving occupations in Vivian are Transportation (86 | 6.7%), and Material Moving (29 | 2.2%).
Production, Transportation and Moving Occupations by Sex
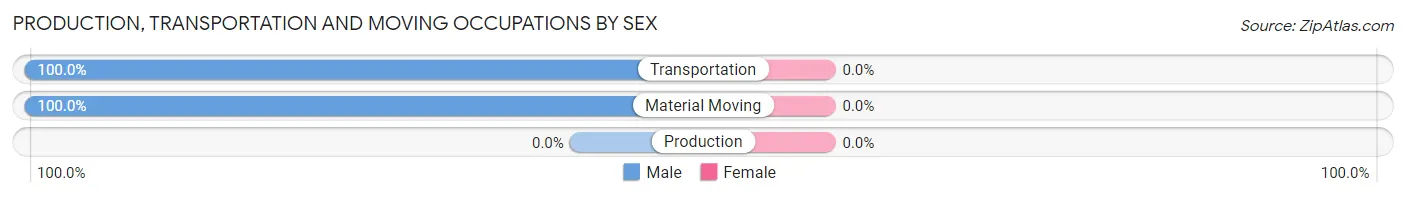
| Occupation | Male | Female |
| Production | 0 (0.0%) | 0 (0.0%) |
| Transportation | 86 (100.0%) | 0 (0.0%) |
| Material Moving | 29 (100.0%) | 0 (0.0%) |
| Total (Category) | 115 (100.0%) | 0 (0.0%) |
| Total (Overall) | 770 (59.7%) | 520 (40.3%) |
Employment Industries by Sex in Vivian
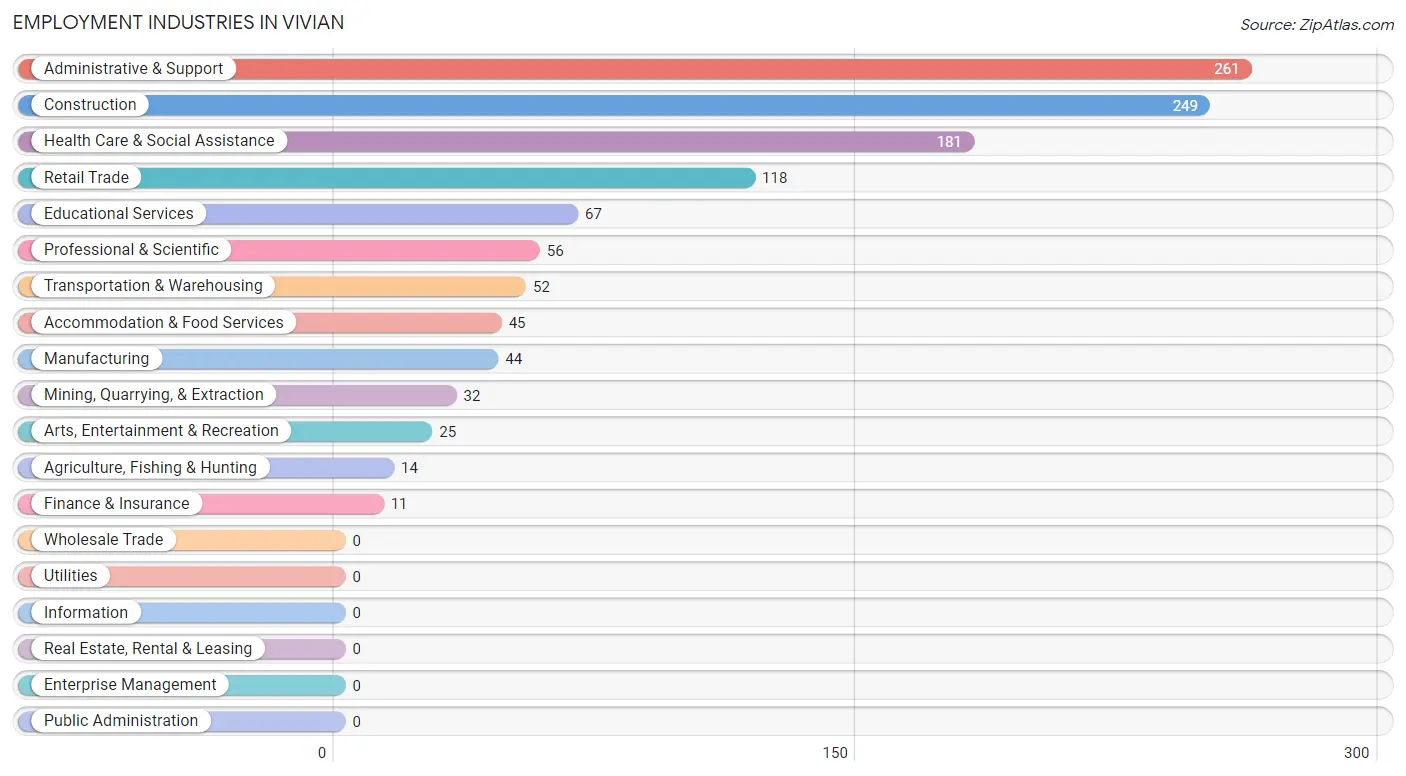
Employment Industries in Vivian
The major employment industries in Vivian include Administrative & Support (261 | 20.2%), Construction (249 | 19.3%), Health Care & Social Assistance (181 | 14.0%), Retail Trade (118 | 9.1%), and Educational Services (67 | 5.2%).
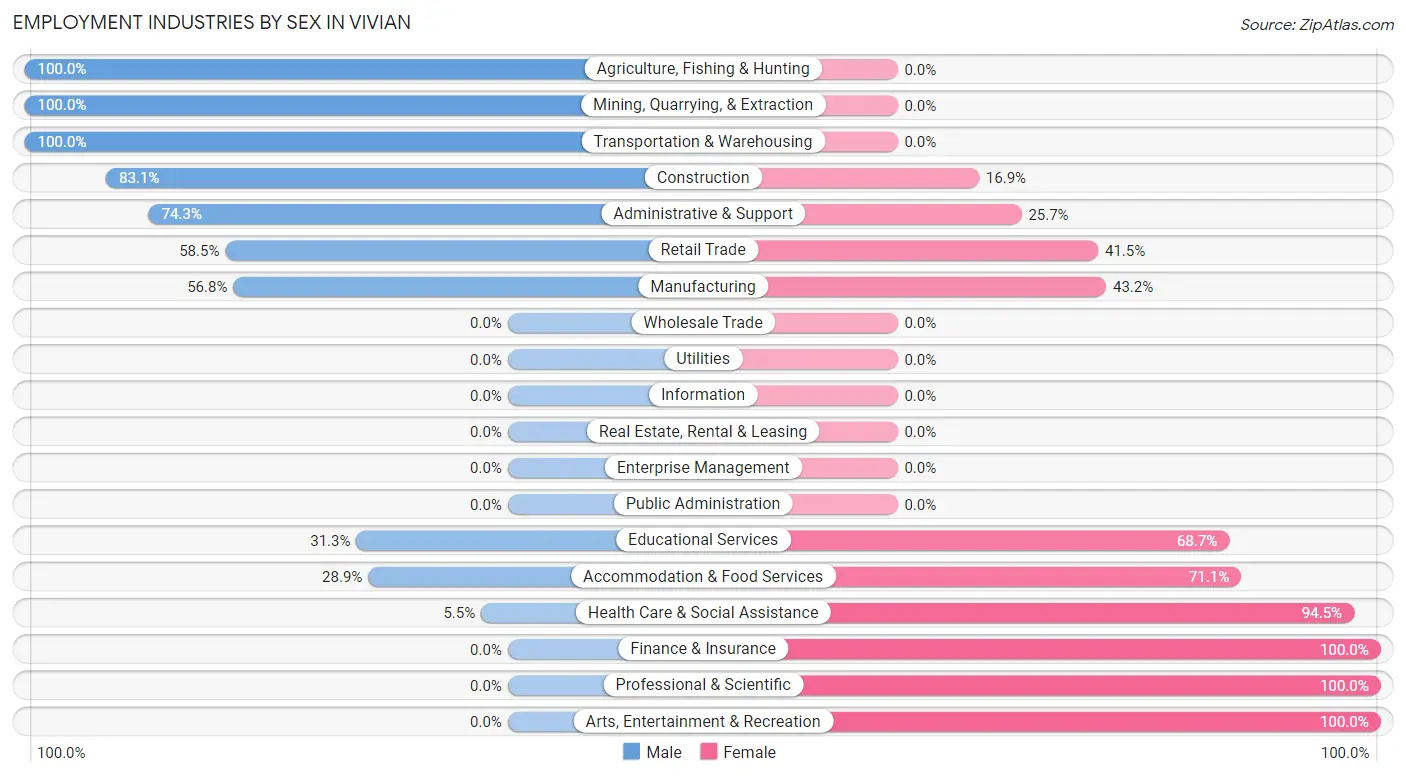
Employment Industries by Sex in Vivian
The Vivian industries that see more men than women are Agriculture, Fishing & Hunting (100.0%), Mining, Quarrying, & Extraction (100.0%), and Transportation & Warehousing (100.0%), whereas the industries that tend to have a higher number of women are Finance & Insurance (100.0%), Professional & Scientific (100.0%), and Arts, Entertainment & Recreation (100.0%).
| Industry | Male | Female |
| Agriculture, Fishing & Hunting | 14 (100.0%) | 0 (0.0%) |
| Mining, Quarrying, & Extraction | 32 (100.0%) | 0 (0.0%) |
| Construction | 207 (83.1%) | 42 (16.9%) |
| Manufacturing | 25 (56.8%) | 19 (43.2%) |
| Wholesale Trade | 0 (0.0%) | 0 (0.0%) |
| Retail Trade | 69 (58.5%) | 49 (41.5%) |
| Transportation & Warehousing | 52 (100.0%) | 0 (0.0%) |
| Utilities | 0 (0.0%) | 0 (0.0%) |
| Information | 0 (0.0%) | 0 (0.0%) |
| Finance & Insurance | 0 (0.0%) | 11 (100.0%) |
| Real Estate, Rental & Leasing | 0 (0.0%) | 0 (0.0%) |
| Professional & Scientific | 0 (0.0%) | 56 (100.0%) |
| Enterprise Management | 0 (0.0%) | 0 (0.0%) |
| Administrative & Support | 194 (74.3%) | 67 (25.7%) |
| Educational Services | 21 (31.3%) | 46 (68.7%) |
| Health Care & Social Assistance | 10 (5.5%) | 171 (94.5%) |
| Arts, Entertainment & Recreation | 0 (0.0%) | 25 (100.0%) |
| Accommodation & Food Services | 13 (28.9%) | 32 (71.1%) |
| Public Administration | 0 (0.0%) | 0 (0.0%) |
| Total | 770 (59.7%) | 520 (40.3%) |
Education in Vivian
School Enrollment in Vivian
The most common levels of schooling among the 824 students in Vivian are elementary school (247 | 30.0%), middle school (215 | 26.1%), and high school (160 | 19.4%).
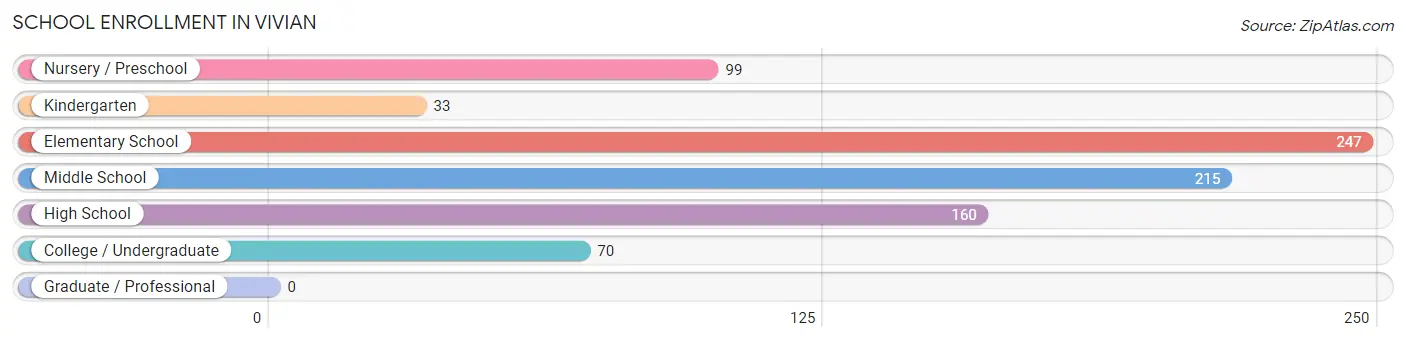
| School Level | # Students | % Students |
| Nursery / Preschool | 99 | 12.0% |
| Kindergarten | 33 | 4.0% |
| Elementary School | 247 | 30.0% |
| Middle School | 215 | 26.1% |
| High School | 160 | 19.4% |
| College / Undergraduate | 70 | 8.5% |
| Graduate / Professional | 0 | 0.0% |
| Total | 824 | 100.0% |
School Enrollment by Age by Funding Source in Vivian
Out of a total of 824 students who are enrolled in schools in Vivian, 37 (4.5%) attend a private institution, while the remaining 787 (95.5%) are enrolled in public schools. The age group of 20 to 24 year olds has the highest likelihood of being enrolled in private schools, with 11 (44.0% in the age bracket) enrolled. Conversely, the age group of 3 to 4 year olds has the lowest likelihood of being enrolled in a private school, with 101 (100.0% in the age bracket) attending a public institution.
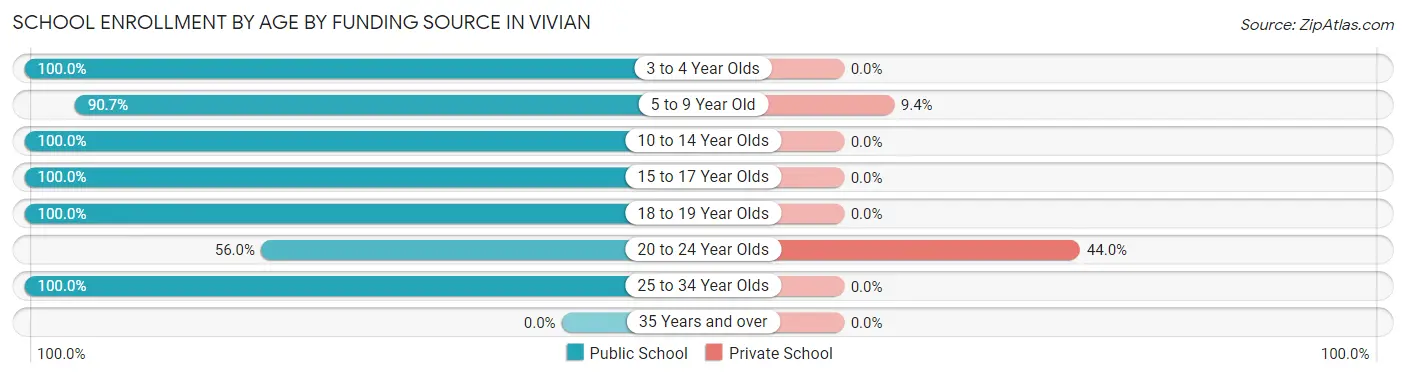
| Age Bracket | Public School | Private School |
| 3 to 4 Year Olds | 101 (100.0%) | 0 (0.0%) |
| 5 to 9 Year Old | 252 (90.6%) | 26 (9.3%) |
| 10 to 14 Year Olds | 240 (100.0%) | 0 (0.0%) |
| 15 to 17 Year Olds | 89 (100.0%) | 0 (0.0%) |
| 18 to 19 Year Olds | 35 (100.0%) | 0 (0.0%) |
| 20 to 24 Year Olds | 14 (56.0%) | 11 (44.0%) |
| 25 to 34 Year Olds | 56 (100.0%) | 0 (0.0%) |
| 35 Years and over | 0 (0.0%) | 0 (0.0%) |
| Total | 787 (95.5%) | 37 (4.5%) |
Educational Attainment by Field of Study in Vivian
Science & technology (65 | 42.8%), bio, nature & agricultural (54 | 35.5%), education (23 | 15.1%), and business (10 | 6.6%) are the most common fields of study among 152 individuals in Vivian who have obtained a bachelor's degree or higher.
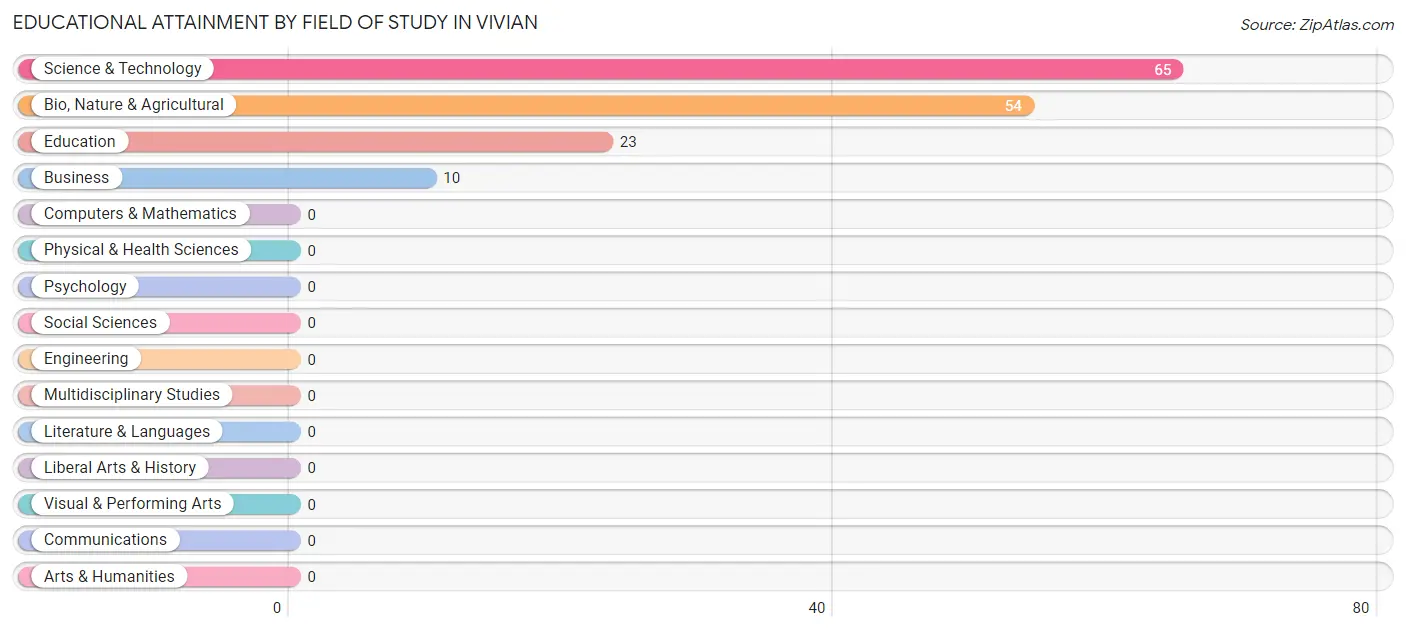
| Field of Study | # Graduates | % Graduates |
| Computers & Mathematics | 0 | 0.0% |
| Bio, Nature & Agricultural | 54 | 35.5% |
| Physical & Health Sciences | 0 | 0.0% |
| Psychology | 0 | 0.0% |
| Social Sciences | 0 | 0.0% |
| Engineering | 0 | 0.0% |
| Multidisciplinary Studies | 0 | 0.0% |
| Science & Technology | 65 | 42.8% |
| Business | 10 | 6.6% |
| Education | 23 | 15.1% |
| Literature & Languages | 0 | 0.0% |
| Liberal Arts & History | 0 | 0.0% |
| Visual & Performing Arts | 0 | 0.0% |
| Communications | 0 | 0.0% |
| Arts & Humanities | 0 | 0.0% |
| Total | 152 | 100.0% |
Transportation & Commute in Vivian
Vehicle Availability by Sex in Vivian
The most prevalent vehicle ownership categories in Vivian are males with 2 vehicles (404, accounting for 52.5%) and females with 2 vehicles (158, making up 85.1%).
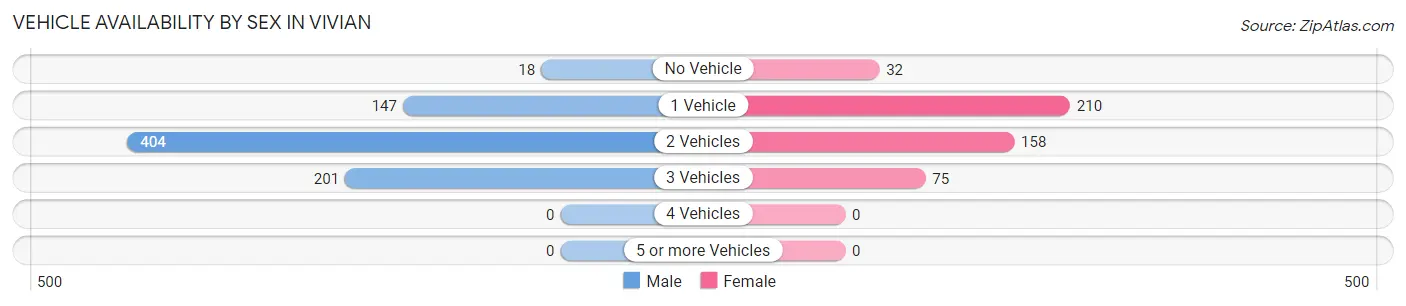
| Vehicles Available | Male | Female |
| No Vehicle | 18 (2.3%) | 32 (6.7%) |
| 1 Vehicle | 147 (19.1%) | 210 (44.2%) |
| 2 Vehicles | 404 (52.5%) | 158 (33.3%) |
| 3 Vehicles | 201 (26.1%) | 75 (15.8%) |
| 4 Vehicles | 0 (0.0%) | 0 (0.0%) |
| 5 or more Vehicles | 0 (0.0%) | 0 (0.0%) |
| Total | 770 (100.0%) | 475 (100.0%) |
Commute Time in Vivian
The most frequently occuring commute durations in Vivian are 45 to 59 minutes (310 commuters, 25.5%), 60 to 89 minutes (198 commuters, 16.3%), and 30 to 34 minutes (174 commuters, 14.3%).
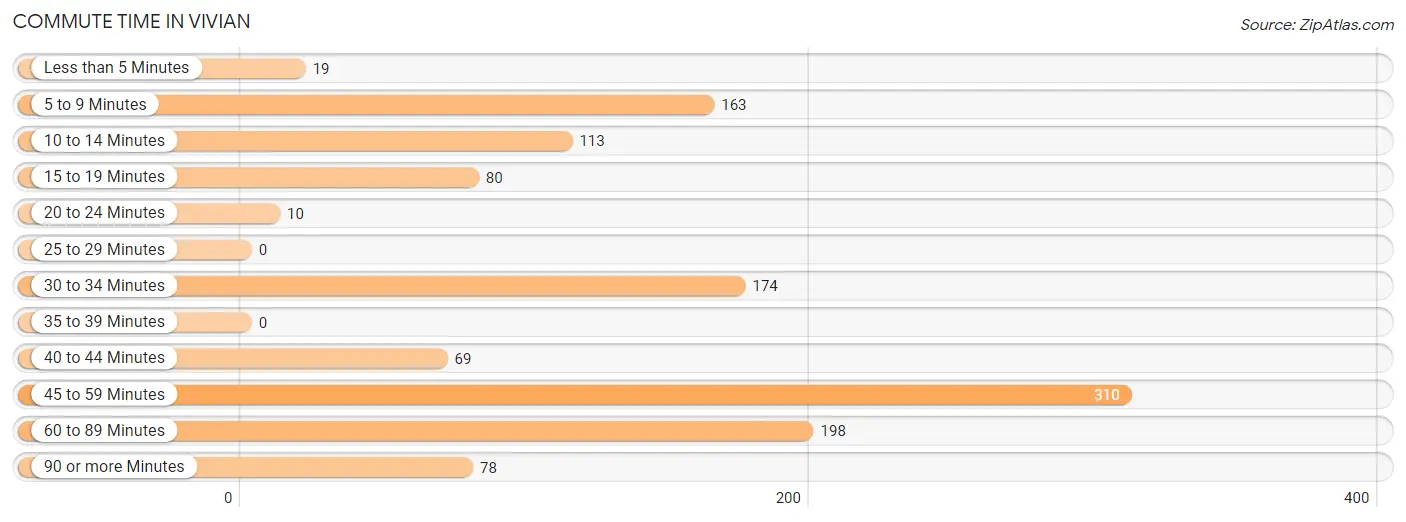
| Commute Time | # Commuters | % Commuters |
| Less than 5 Minutes | 19 | 1.6% |
| 5 to 9 Minutes | 163 | 13.4% |
| 10 to 14 Minutes | 113 | 9.3% |
| 15 to 19 Minutes | 80 | 6.6% |
| 20 to 24 Minutes | 10 | 0.8% |
| 25 to 29 Minutes | 0 | 0.0% |
| 30 to 34 Minutes | 174 | 14.3% |
| 35 to 39 Minutes | 0 | 0.0% |
| 40 to 44 Minutes | 69 | 5.7% |
| 45 to 59 Minutes | 310 | 25.5% |
| 60 to 89 Minutes | 198 | 16.3% |
| 90 or more Minutes | 78 | 6.4% |
Commute Time by Sex in Vivian
The most common commute times in Vivian are 60 to 89 minutes (185 commuters, 25.0%) for males and 45 to 59 minutes (254 commuters, 53.5%) for females.
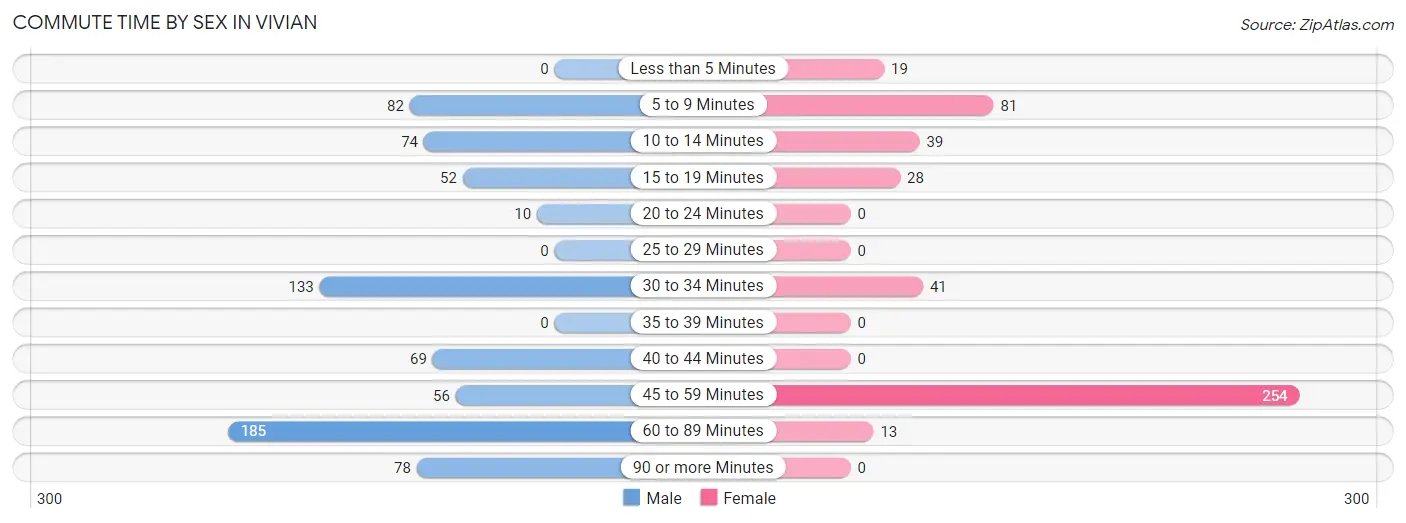
| Commute Time | Male | Female |
| Less than 5 Minutes | 0 (0.0%) | 19 (4.0%) |
| 5 to 9 Minutes | 82 (11.1%) | 81 (17.1%) |
| 10 to 14 Minutes | 74 (10.0%) | 39 (8.2%) |
| 15 to 19 Minutes | 52 (7.0%) | 28 (5.9%) |
| 20 to 24 Minutes | 10 (1.3%) | 0 (0.0%) |
| 25 to 29 Minutes | 0 (0.0%) | 0 (0.0%) |
| 30 to 34 Minutes | 133 (18.0%) | 41 (8.6%) |
| 35 to 39 Minutes | 0 (0.0%) | 0 (0.0%) |
| 40 to 44 Minutes | 69 (9.3%) | 0 (0.0%) |
| 45 to 59 Minutes | 56 (7.6%) | 254 (53.5%) |
| 60 to 89 Minutes | 185 (25.0%) | 13 (2.7%) |
| 90 or more Minutes | 78 (10.5%) | 0 (0.0%) |
Time of Departure to Work by Sex in Vivian
The most frequent times of departure to work in Vivian are 6:00 AM to 6:29 AM (377, 51.0%) for males and 6:00 AM to 6:29 AM (133, 28.0%) for females.
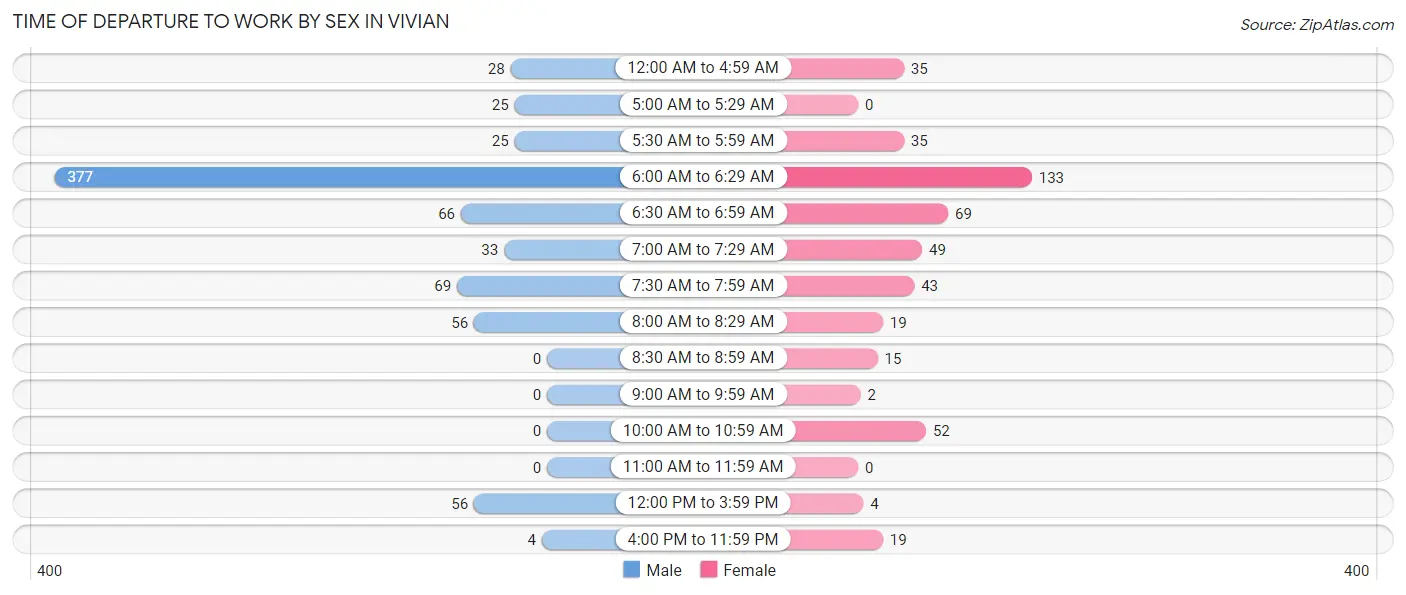
| Time of Departure | Male | Female |
| 12:00 AM to 4:59 AM | 28 (3.8%) | 35 (7.4%) |
| 5:00 AM to 5:29 AM | 25 (3.4%) | 0 (0.0%) |
| 5:30 AM to 5:59 AM | 25 (3.4%) | 35 (7.4%) |
| 6:00 AM to 6:29 AM | 377 (51.0%) | 133 (28.0%) |
| 6:30 AM to 6:59 AM | 66 (8.9%) | 69 (14.5%) |
| 7:00 AM to 7:29 AM | 33 (4.5%) | 49 (10.3%) |
| 7:30 AM to 7:59 AM | 69 (9.3%) | 43 (9.0%) |
| 8:00 AM to 8:29 AM | 56 (7.6%) | 19 (4.0%) |
| 8:30 AM to 8:59 AM | 0 (0.0%) | 15 (3.2%) |
| 9:00 AM to 9:59 AM | 0 (0.0%) | 2 (0.4%) |
| 10:00 AM to 10:59 AM | 0 (0.0%) | 52 (11.0%) |
| 11:00 AM to 11:59 AM | 0 (0.0%) | 0 (0.0%) |
| 12:00 PM to 3:59 PM | 56 (7.6%) | 4 (0.8%) |
| 4:00 PM to 11:59 PM | 4 (0.5%) | 19 (4.0%) |
| Total | 739 (100.0%) | 475 (100.0%) |
Housing Occupancy in Vivian
Occupancy by Ownership in Vivian
Of the total 1,342 dwellings in Vivian, owner-occupied units account for 931 (69.4%), while renter-occupied units make up 411 (30.6%).
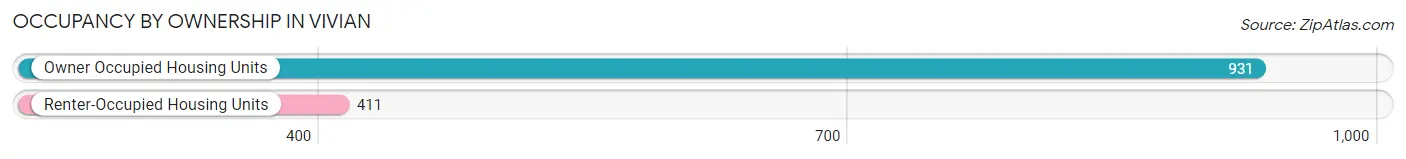
| Occupancy | # Housing Units | % Housing Units |
| Owner Occupied Housing Units | 931 | 69.4% |
| Renter-Occupied Housing Units | 411 | 30.6% |
| Total Occupied Housing Units | 1,342 | 100.0% |
Occupancy by Household Size in Vivian

| Household Size | # Housing Units | % Housing Units |
| 1-Person Household | 646 | 48.1% |
| 2-Person Household | 328 | 24.4% |
| 3-Person Household | 204 | 15.2% |
| 4+ Person Household | 164 | 12.2% |
| Total Housing Units | 1,342 | 100.0% |
Occupancy by Ownership by Household Size in Vivian
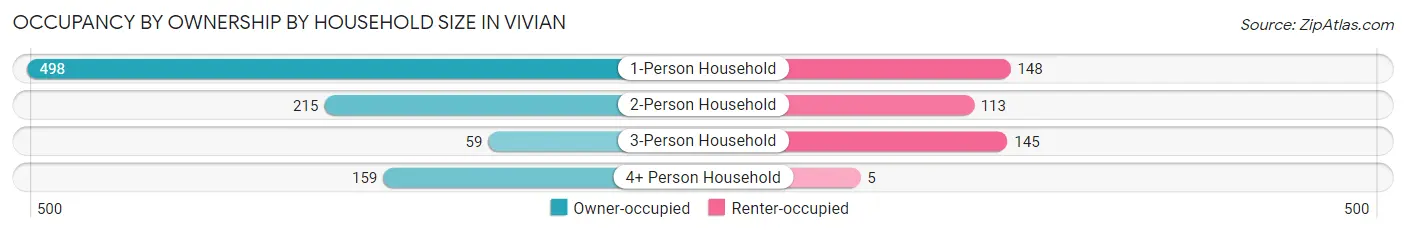
| Household Size | Owner-occupied | Renter-occupied |
| 1-Person Household | 498 (77.1%) | 148 (22.9%) |
| 2-Person Household | 215 (65.5%) | 113 (34.4%) |
| 3-Person Household | 59 (28.9%) | 145 (71.1%) |
| 4+ Person Household | 159 (97.0%) | 5 (3.0%) |
| Total Housing Units | 931 (69.4%) | 411 (30.6%) |
Occupancy by Educational Attainment in Vivian
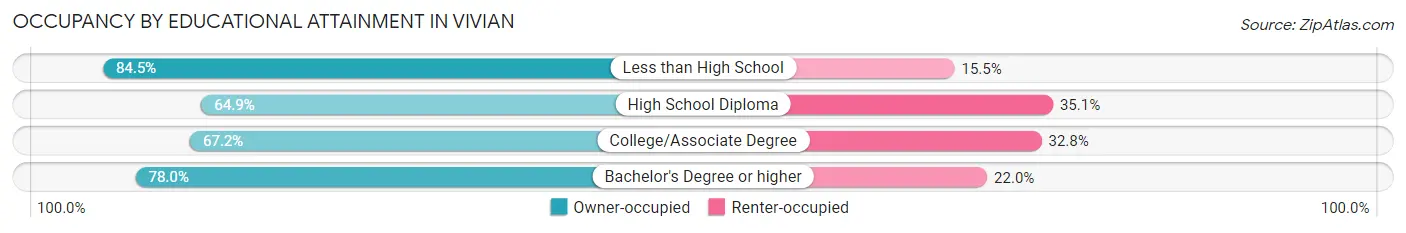
| Household Size | Owner-occupied | Renter-occupied |
| Less than High School | 163 (84.5%) | 30 (15.5%) |
| High School Diploma | 276 (64.9%) | 149 (35.1%) |
| College/Associate Degree | 453 (67.2%) | 221 (32.8%) |
| Bachelor's Degree or higher | 39 (78.0%) | 11 (22.0%) |
Occupancy by Age of Householder in Vivian
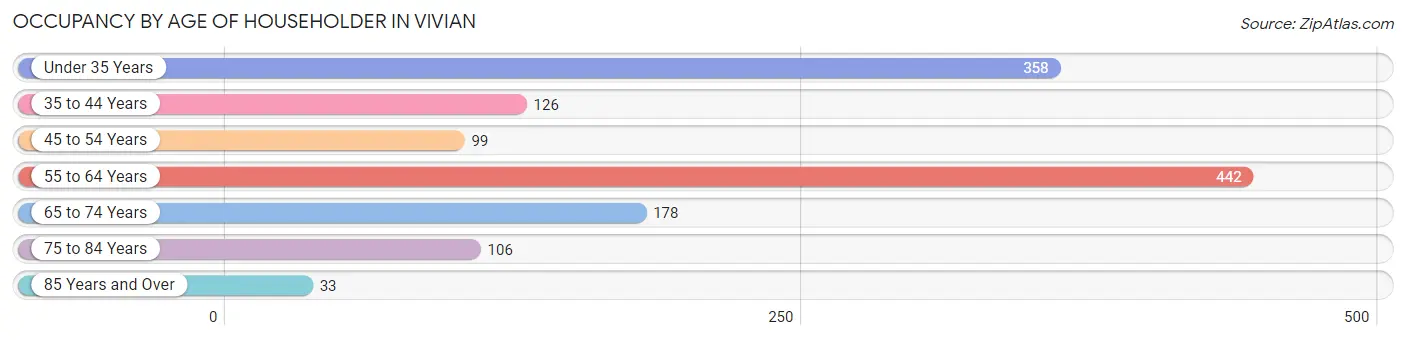
| Age Bracket | # Households | % Households |
| Under 35 Years | 358 | 26.7% |
| 35 to 44 Years | 126 | 9.4% |
| 45 to 54 Years | 99 | 7.4% |
| 55 to 64 Years | 442 | 32.9% |
| 65 to 74 Years | 178 | 13.3% |
| 75 to 84 Years | 106 | 7.9% |
| 85 Years and Over | 33 | 2.5% |
| Total | 1,342 | 100.0% |
Housing Finances in Vivian
Median Income by Occupancy in Vivian
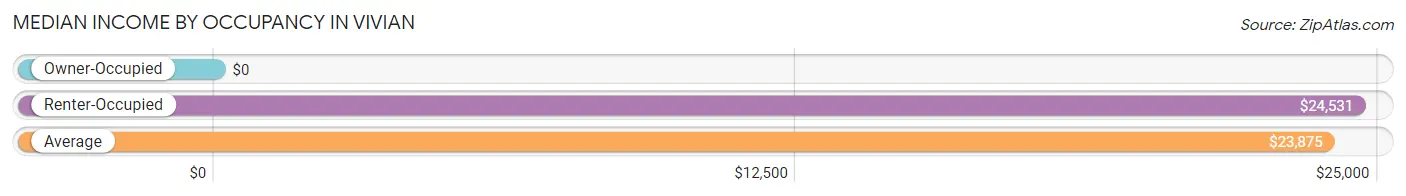
| Occupancy Type | # Households | Median Income |
| Owner-Occupied | 931 (69.4%) | $0 |
| Renter-Occupied | 411 (30.6%) | $24,531 |
| Average | 1,342 (100.0%) | $23,875 |
Occupancy by Householder Income Bracket in Vivian
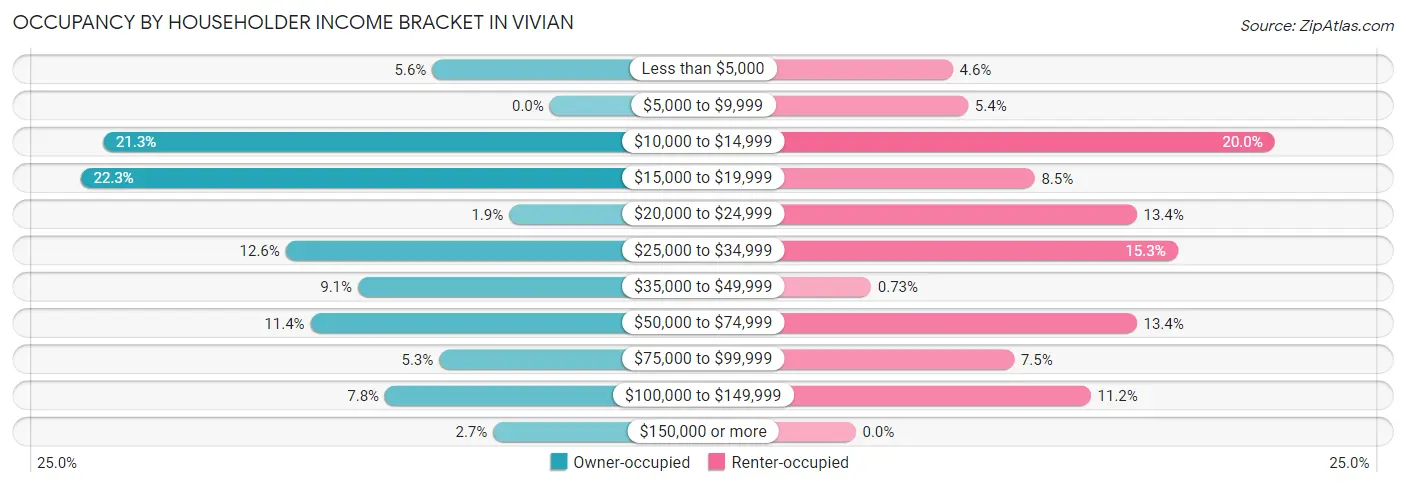
| Income Bracket | Owner-occupied | Renter-occupied |
| Less than $5,000 | 52 (5.6%) | 19 (4.6%) |
| $5,000 to $9,999 | 0 (0.0%) | 22 (5.3%) |
| $10,000 to $14,999 | 198 (21.3%) | 82 (20.0%) |
| $15,000 to $19,999 | 208 (22.3%) | 35 (8.5%) |
| $20,000 to $24,999 | 18 (1.9%) | 55 (13.4%) |
| $25,000 to $34,999 | 117 (12.6%) | 63 (15.3%) |
| $35,000 to $49,999 | 85 (9.1%) | 3 (0.7%) |
| $50,000 to $74,999 | 106 (11.4%) | 55 (13.4%) |
| $75,000 to $99,999 | 49 (5.3%) | 31 (7.5%) |
| $100,000 to $149,999 | 73 (7.8%) | 46 (11.2%) |
| $150,000 or more | 25 (2.7%) | 0 (0.0%) |
| Total | 931 (100.0%) | 411 (100.0%) |
Monthly Housing Cost Tiers in Vivian
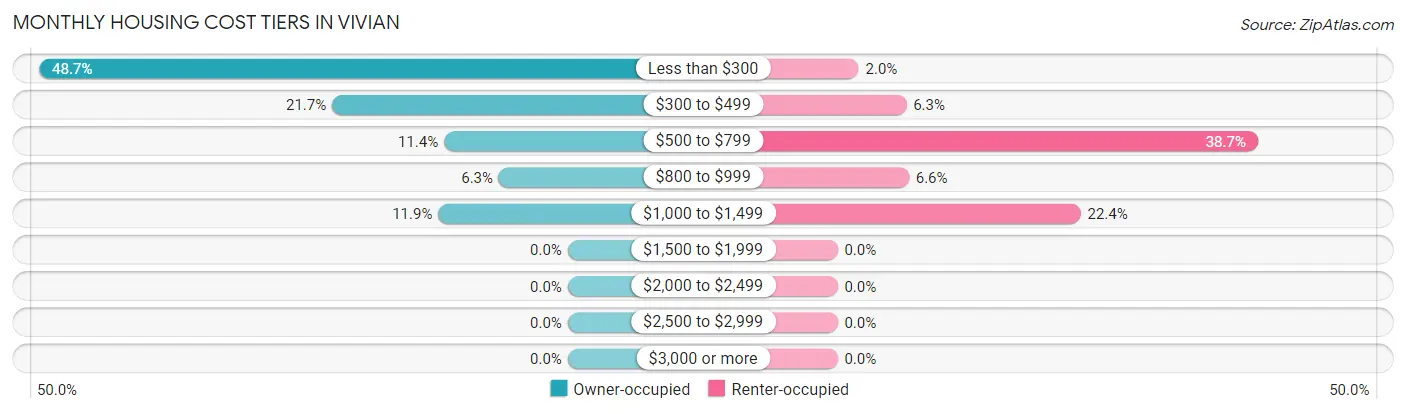
| Monthly Cost | Owner-occupied | Renter-occupied |
| Less than $300 | 453 (48.7%) | 8 (1.9%) |
| $300 to $499 | 202 (21.7%) | 26 (6.3%) |
| $500 to $799 | 106 (11.4%) | 159 (38.7%) |
| $800 to $999 | 59 (6.3%) | 27 (6.6%) |
| $1,000 to $1,499 | 111 (11.9%) | 92 (22.4%) |
| $1,500 to $1,999 | 0 (0.0%) | 0 (0.0%) |
| $2,000 to $2,499 | 0 (0.0%) | 0 (0.0%) |
| $2,500 to $2,999 | 0 (0.0%) | 0 (0.0%) |
| $3,000 or more | 0 (0.0%) | 0 (0.0%) |
| Total | 931 (100.0%) | 411 (100.0%) |
Physical Housing Characteristics in Vivian
Housing Structures in Vivian
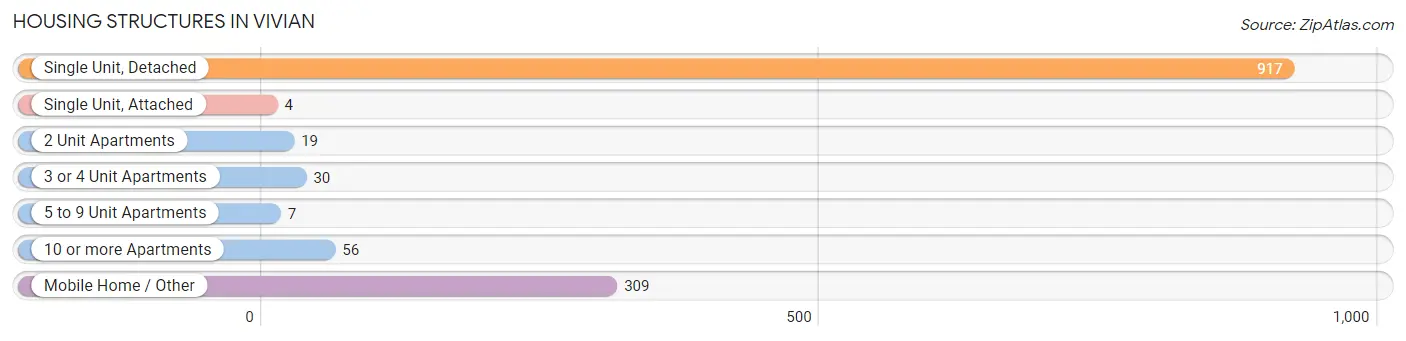
| Structure Type | # Housing Units | % Housing Units |
| Single Unit, Detached | 917 | 68.3% |
| Single Unit, Attached | 4 | 0.3% |
| 2 Unit Apartments | 19 | 1.4% |
| 3 or 4 Unit Apartments | 30 | 2.2% |
| 5 to 9 Unit Apartments | 7 | 0.5% |
| 10 or more Apartments | 56 | 4.2% |
| Mobile Home / Other | 309 | 23.0% |
| Total | 1,342 | 100.0% |
Housing Structures by Occupancy in Vivian
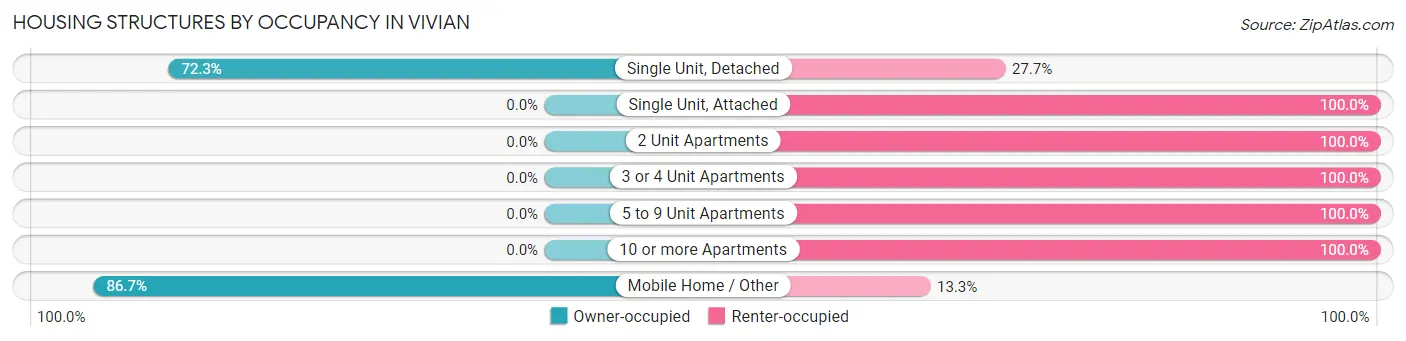
| Structure Type | Owner-occupied | Renter-occupied |
| Single Unit, Detached | 663 (72.3%) | 254 (27.7%) |
| Single Unit, Attached | 0 (0.0%) | 4 (100.0%) |
| 2 Unit Apartments | 0 (0.0%) | 19 (100.0%) |
| 3 or 4 Unit Apartments | 0 (0.0%) | 30 (100.0%) |
| 5 to 9 Unit Apartments | 0 (0.0%) | 7 (100.0%) |
| 10 or more Apartments | 0 (0.0%) | 56 (100.0%) |
| Mobile Home / Other | 268 (86.7%) | 41 (13.3%) |
| Total | 931 (69.4%) | 411 (30.6%) |
Housing Structures by Number of Rooms in Vivian
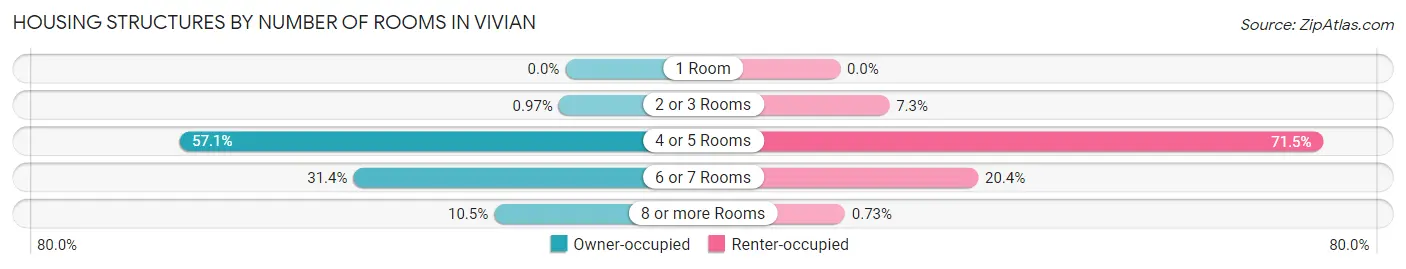
| Number of Rooms | Owner-occupied | Renter-occupied |
| 1 Room | 0 (0.0%) | 0 (0.0%) |
| 2 or 3 Rooms | 9 (1.0%) | 30 (7.3%) |
| 4 or 5 Rooms | 532 (57.1%) | 294 (71.5%) |
| 6 or 7 Rooms | 292 (31.4%) | 84 (20.4%) |
| 8 or more Rooms | 98 (10.5%) | 3 (0.7%) |
| Total | 931 (100.0%) | 411 (100.0%) |
Housing Structure by Heating Type in Vivian
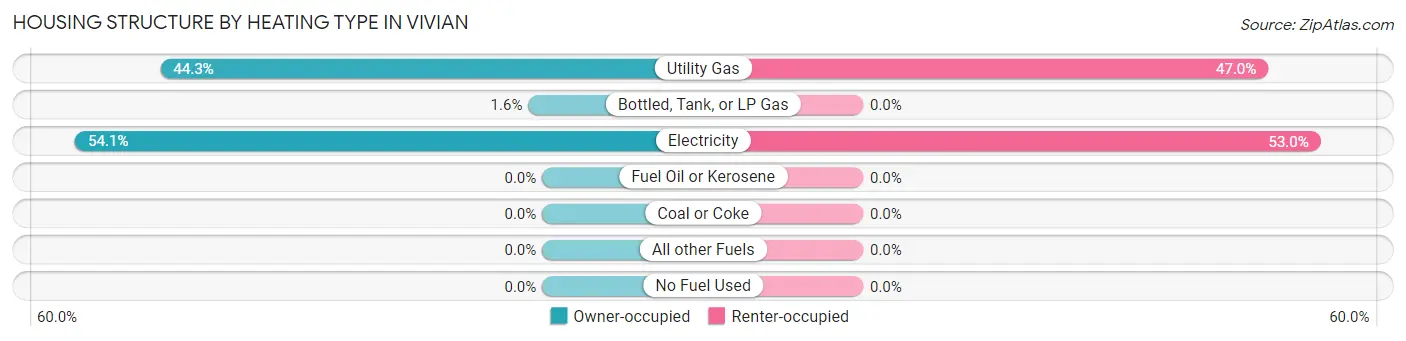
| Heating Type | Owner-occupied | Renter-occupied |
| Utility Gas | 412 (44.3%) | 193 (47.0%) |
| Bottled, Tank, or LP Gas | 15 (1.6%) | 0 (0.0%) |
| Electricity | 504 (54.1%) | 218 (53.0%) |
| Fuel Oil or Kerosene | 0 (0.0%) | 0 (0.0%) |
| Coal or Coke | 0 (0.0%) | 0 (0.0%) |
| All other Fuels | 0 (0.0%) | 0 (0.0%) |
| No Fuel Used | 0 (0.0%) | 0 (0.0%) |
| Total | 931 (100.0%) | 411 (100.0%) |
Household Vehicle Usage in Vivian
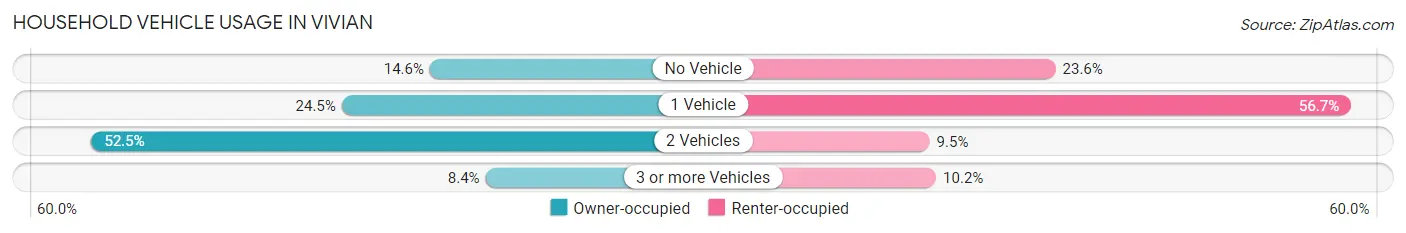
| Vehicles per Household | Owner-occupied | Renter-occupied |
| No Vehicle | 136 (14.6%) | 97 (23.6%) |
| 1 Vehicle | 228 (24.5%) | 233 (56.7%) |
| 2 Vehicles | 489 (52.5%) | 39 (9.5%) |
| 3 or more Vehicles | 78 (8.4%) | 42 (10.2%) |
| Total | 931 (100.0%) | 411 (100.0%) |
Real Estate & Mortgages in Vivian
Real Estate and Mortgage Overview in Vivian
| Characteristic | Without Mortgage | With Mortgage |
| Housing Units | 719 | 212 |
| Median Property Value | $54,200 | $87,000 |
| Median Household Income | $16,764 | $0 |
| Monthly Housing Costs | $281 | $0 |
| Real Estate Taxes | $308 | $16 |
Property Value by Mortgage Status in Vivian
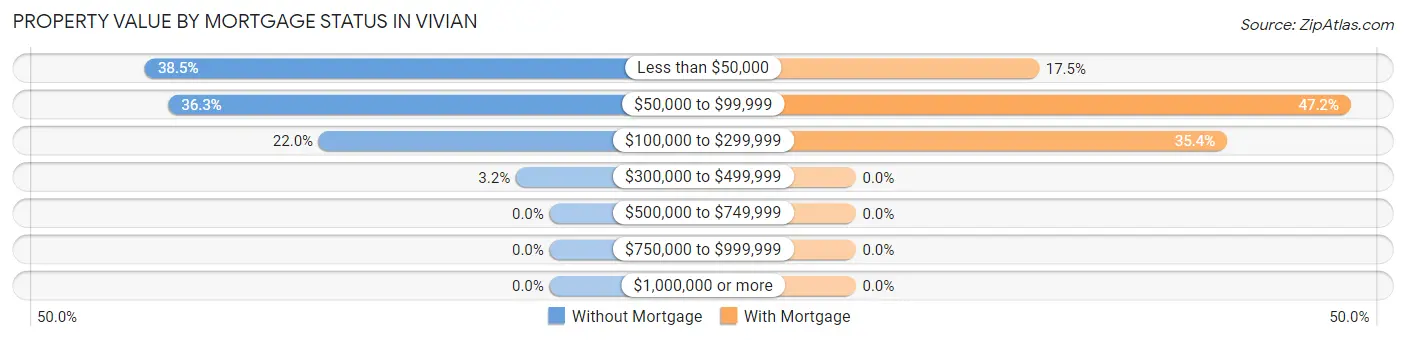
| Property Value | Without Mortgage | With Mortgage |
| Less than $50,000 | 277 (38.5%) | 37 (17.4%) |
| $50,000 to $99,999 | 261 (36.3%) | 100 (47.2%) |
| $100,000 to $299,999 | 158 (22.0%) | 75 (35.4%) |
| $300,000 to $499,999 | 23 (3.2%) | 0 (0.0%) |
| $500,000 to $749,999 | 0 (0.0%) | 0 (0.0%) |
| $750,000 to $999,999 | 0 (0.0%) | 0 (0.0%) |
| $1,000,000 or more | 0 (0.0%) | 0 (0.0%) |
| Total | 719 (100.0%) | 212 (100.0%) |
Household Income by Mortgage Status in Vivian
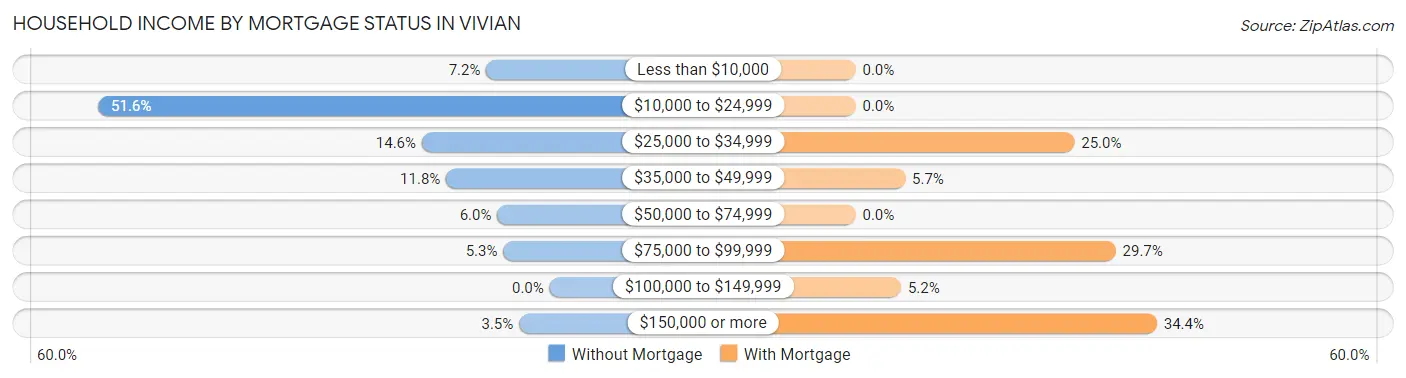
| Household Income | Without Mortgage | With Mortgage |
| Less than $10,000 | 52 (7.2%) | 0 (0.0%) |
| $10,000 to $24,999 | 371 (51.6%) | 0 (0.0%) |
| $25,000 to $34,999 | 105 (14.6%) | 53 (25.0%) |
| $35,000 to $49,999 | 85 (11.8%) | 12 (5.7%) |
| $50,000 to $74,999 | 43 (6.0%) | 0 (0.0%) |
| $75,000 to $99,999 | 38 (5.3%) | 63 (29.7%) |
| $100,000 to $149,999 | 0 (0.0%) | 11 (5.2%) |
| $150,000 or more | 25 (3.5%) | 73 (34.4%) |
| Total | 719 (100.0%) | 212 (100.0%) |
Property Value to Household Income Ratio in Vivian
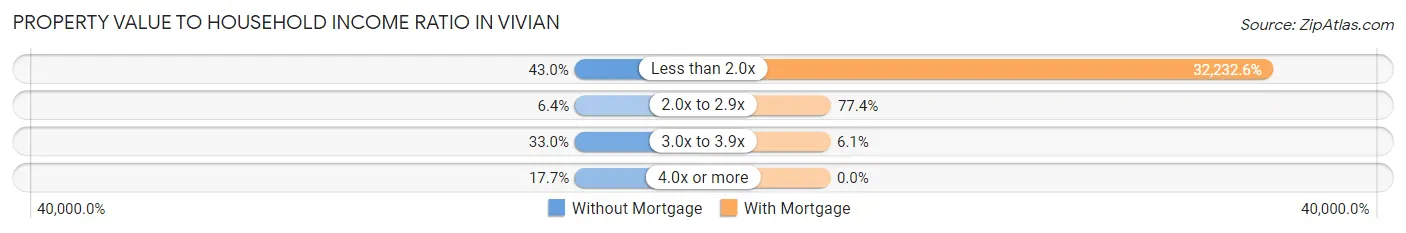
| Value-to-Income Ratio | Without Mortgage | With Mortgage |
| Less than 2.0x | 309 (43.0%) | 68,333 (32,232.5%) |
| 2.0x to 2.9x | 46 (6.4%) | 164 (77.4%) |
| 3.0x to 3.9x | 237 (33.0%) | 13 (6.1%) |
| 4.0x or more | 127 (17.7%) | 0 (0.0%) |
| Total | 719 (100.0%) | 212 (100.0%) |
Real Estate Taxes by Mortgage Status in Vivian
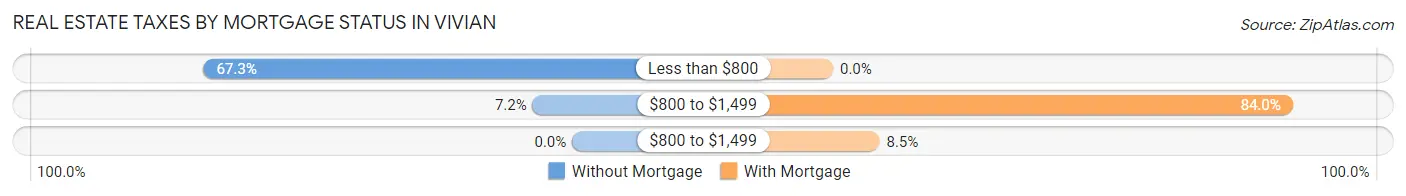
| Property Taxes | Without Mortgage | With Mortgage |
| Less than $800 | 484 (67.3%) | 0 (0.0%) |
| $800 to $1,499 | 52 (7.2%) | 178 (84.0%) |
| $800 to $1,499 | 0 (0.0%) | 18 (8.5%) |
| Total | 719 (100.0%) | 212 (100.0%) |
Health & Disability in Vivian
Health Insurance Coverage by Age in Vivian
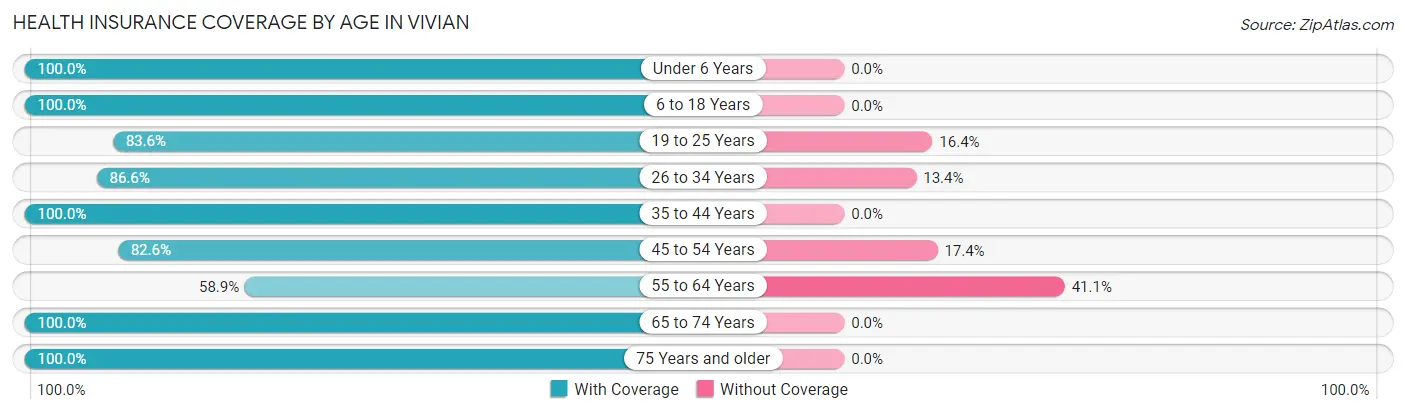
| Age Bracket | With Coverage | Without Coverage |
| Under 6 Years | 240 (100.0%) | 0 (0.0%) |
| 6 to 18 Years | 579 (100.0%) | 0 (0.0%) |
| 19 to 25 Years | 295 (83.6%) | 58 (16.4%) |
| 26 to 34 Years | 458 (86.6%) | 71 (13.4%) |
| 35 to 44 Years | 261 (100.0%) | 0 (0.0%) |
| 45 to 54 Years | 138 (82.6%) | 29 (17.4%) |
| 55 to 64 Years | 308 (58.9%) | 215 (41.1%) |
| 65 to 74 Years | 232 (100.0%) | 0 (0.0%) |
| 75 Years and older | 194 (100.0%) | 0 (0.0%) |
| Total | 2,705 (87.9%) | 373 (12.1%) |
Health Insurance Coverage by Citizenship Status in Vivian
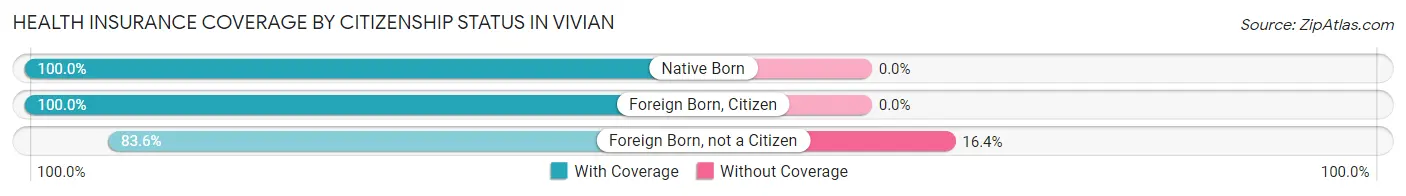
| Citizenship Status | With Coverage | Without Coverage |
| Native Born | 240 (100.0%) | 0 (0.0%) |
| Foreign Born, Citizen | 579 (100.0%) | 0 (0.0%) |
| Foreign Born, not a Citizen | 295 (83.6%) | 58 (16.4%) |
Health Insurance Coverage by Household Income in Vivian
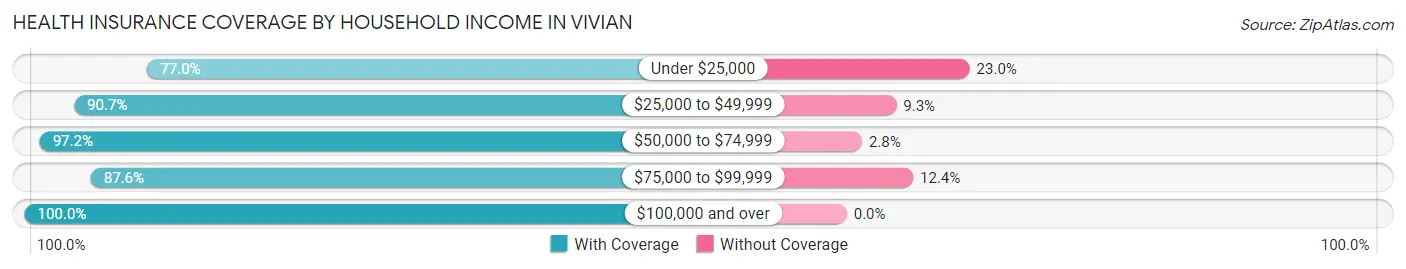
| Household Income | With Coverage | Without Coverage |
| Under $25,000 | 906 (77.0%) | 271 (23.0%) |
| $25,000 to $49,999 | 703 (90.7%) | 72 (9.3%) |
| $50,000 to $74,999 | 376 (97.2%) | 11 (2.8%) |
| $75,000 to $99,999 | 134 (87.6%) | 19 (12.4%) |
| $100,000 and over | 582 (100.0%) | 0 (0.0%) |
Public vs Private Health Insurance Coverage by Age in Vivian
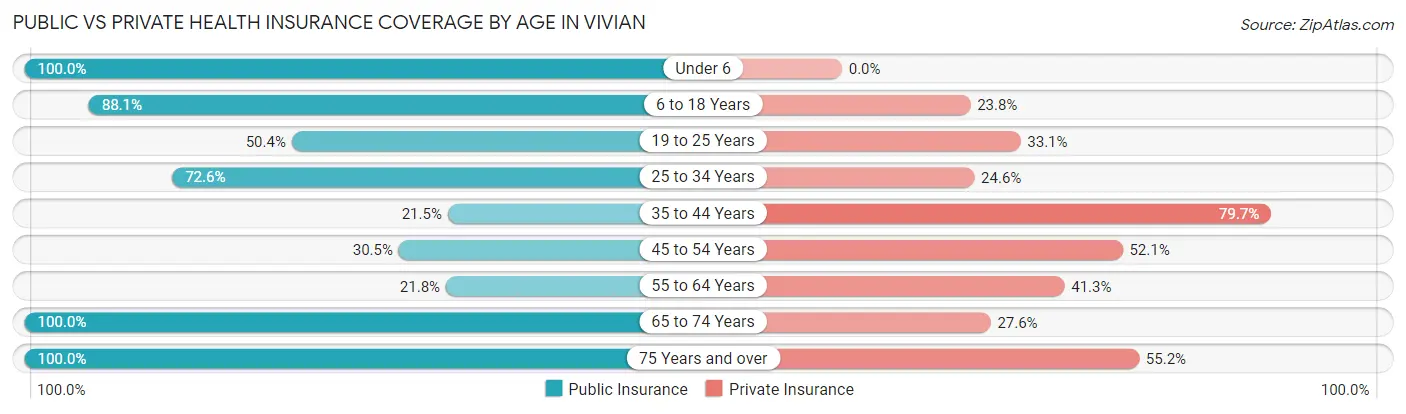
| Age Bracket | Public Insurance | Private Insurance |
| Under 6 | 240 (100.0%) | 0 (0.0%) |
| 6 to 18 Years | 510 (88.1%) | 138 (23.8%) |
| 19 to 25 Years | 178 (50.4%) | 117 (33.1%) |
| 25 to 34 Years | 384 (72.6%) | 130 (24.6%) |
| 35 to 44 Years | 56 (21.5%) | 208 (79.7%) |
| 45 to 54 Years | 51 (30.5%) | 87 (52.1%) |
| 55 to 64 Years | 114 (21.8%) | 216 (41.3%) |
| 65 to 74 Years | 232 (100.0%) | 64 (27.6%) |
| 75 Years and over | 194 (100.0%) | 107 (55.1%) |
| Total | 1,959 (63.6%) | 1,067 (34.7%) |
Disability Status by Sex by Age in Vivian
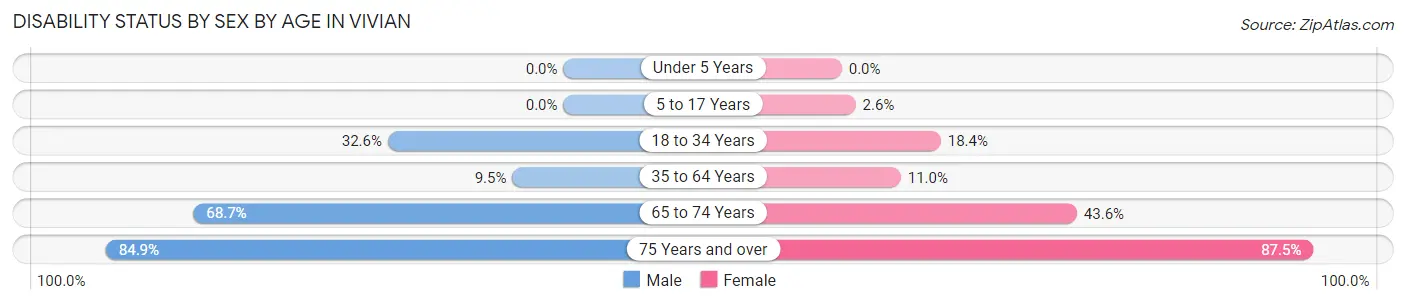
| Age Bracket | Male | Female |
| Under 5 Years | 0 (0.0%) | 0 (0.0%) |
| 5 to 17 Years | 0 (0.0%) | 7 (2.6%) |
| 18 to 34 Years | 187 (32.6%) | 63 (18.4%) |
| 35 to 64 Years | 52 (9.5%) | 44 (11.0%) |
| 65 to 74 Years | 46 (68.7%) | 72 (43.6%) |
| 75 Years and over | 90 (84.9%) | 77 (87.5%) |
Disability Class by Sex by Age in Vivian
Disability Class: Hearing Difficulty
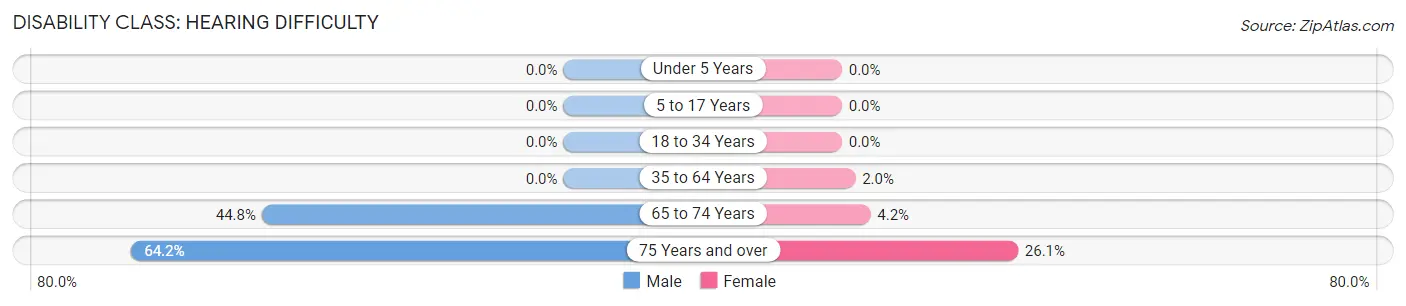
| Age Bracket | Male | Female |
| Under 5 Years | 0 (0.0%) | 0 (0.0%) |
| 5 to 17 Years | 0 (0.0%) | 0 (0.0%) |
| 18 to 34 Years | 0 (0.0%) | 0 (0.0%) |
| 35 to 64 Years | 0 (0.0%) | 8 (2.0%) |
| 65 to 74 Years | 30 (44.8%) | 7 (4.2%) |
| 75 Years and over | 68 (64.1%) | 23 (26.1%) |
Disability Class: Vision Difficulty
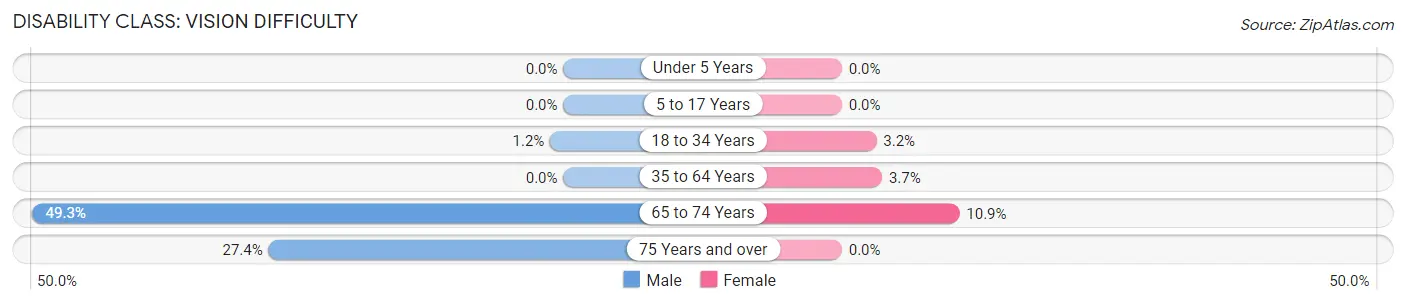
| Age Bracket | Male | Female |
| Under 5 Years | 0 (0.0%) | 0 (0.0%) |
| 5 to 17 Years | 0 (0.0%) | 0 (0.0%) |
| 18 to 34 Years | 7 (1.2%) | 11 (3.2%) |
| 35 to 64 Years | 0 (0.0%) | 15 (3.7%) |
| 65 to 74 Years | 33 (49.2%) | 18 (10.9%) |
| 75 Years and over | 29 (27.4%) | 0 (0.0%) |
Disability Class: Cognitive Difficulty
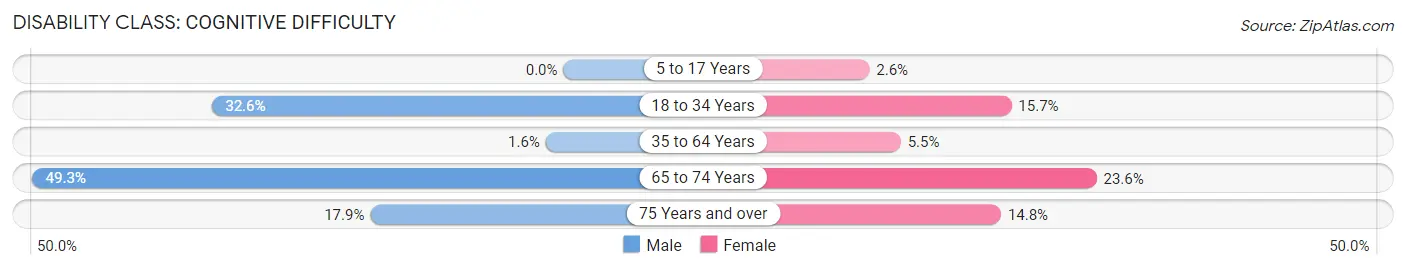
| Age Bracket | Male | Female |
| 5 to 17 Years | 0 (0.0%) | 7 (2.6%) |
| 18 to 34 Years | 187 (32.6%) | 54 (15.7%) |
| 35 to 64 Years | 9 (1.6%) | 22 (5.5%) |
| 65 to 74 Years | 33 (49.2%) | 39 (23.6%) |
| 75 Years and over | 19 (17.9%) | 13 (14.8%) |
Disability Class: Ambulatory Difficulty
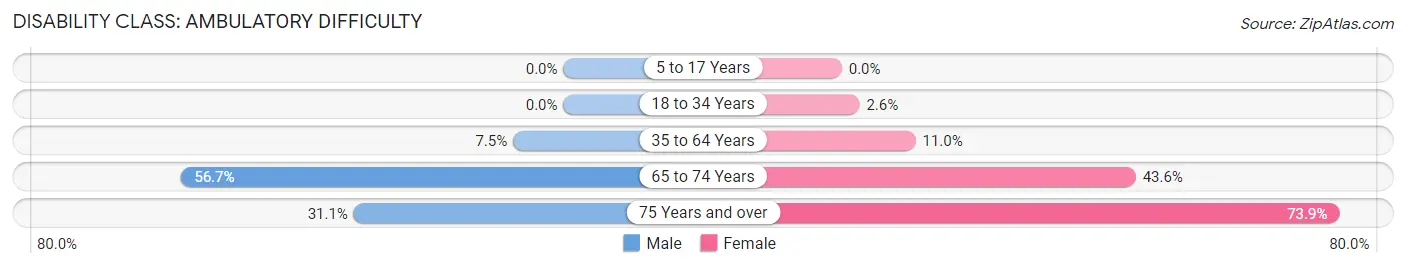
| Age Bracket | Male | Female |
| 5 to 17 Years | 0 (0.0%) | 0 (0.0%) |
| 18 to 34 Years | 0 (0.0%) | 9 (2.6%) |
| 35 to 64 Years | 41 (7.5%) | 44 (11.0%) |
| 65 to 74 Years | 38 (56.7%) | 72 (43.6%) |
| 75 Years and over | 33 (31.1%) | 65 (73.9%) |
Disability Class: Self-Care Difficulty
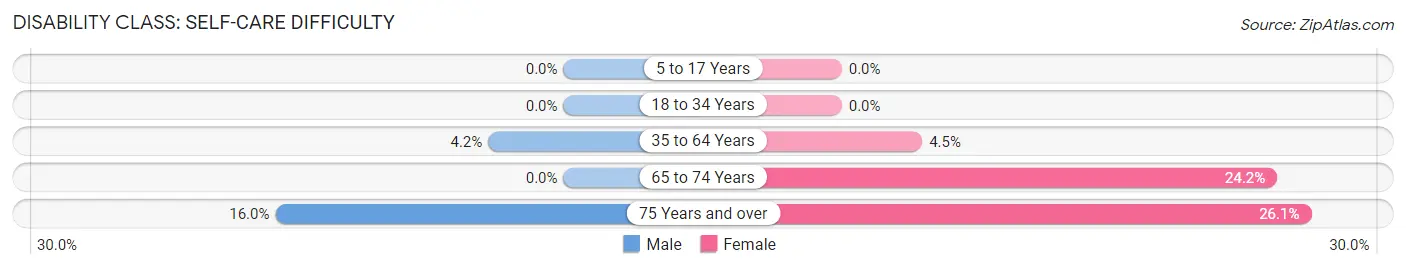
| Age Bracket | Male | Female |
| 5 to 17 Years | 0 (0.0%) | 0 (0.0%) |
| 18 to 34 Years | 0 (0.0%) | 0 (0.0%) |
| 35 to 64 Years | 23 (4.2%) | 18 (4.5%) |
| 65 to 74 Years | 0 (0.0%) | 40 (24.2%) |
| 75 Years and over | 17 (16.0%) | 23 (26.1%) |
Technology Access in Vivian
Computing Device Access in Vivian
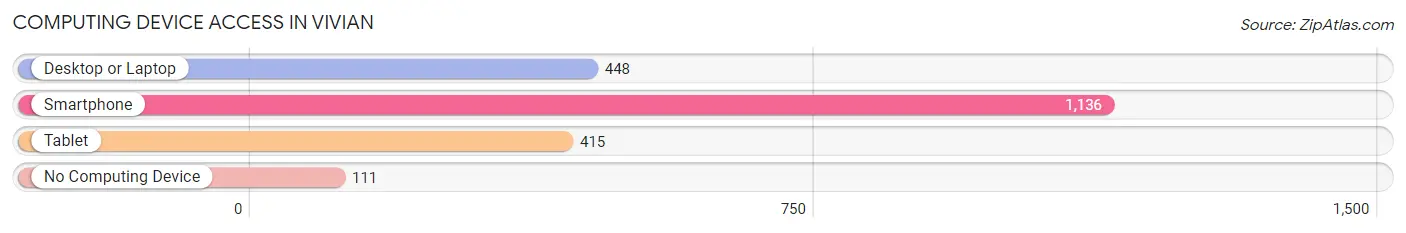
| Device Type | # Households | % Households |
| Desktop or Laptop | 448 | 33.4% |
| Smartphone | 1,136 | 84.7% |
| Tablet | 415 | 30.9% |
| No Computing Device | 111 | 8.3% |
| Total | 1,342 | 100.0% |
Internet Access in Vivian
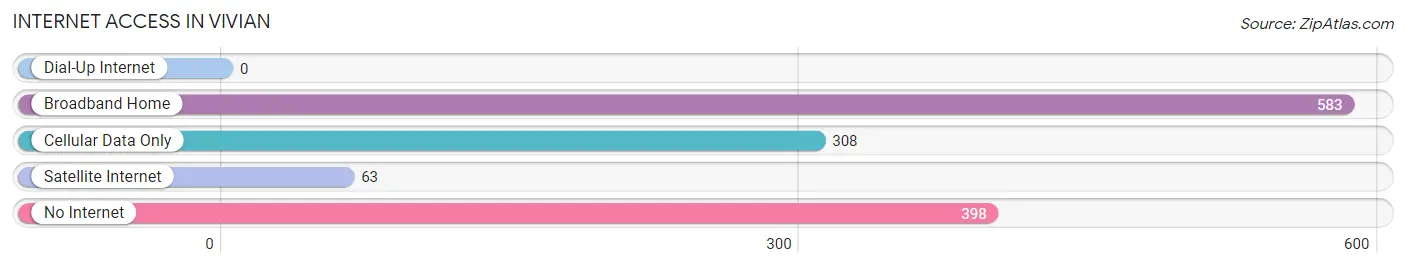
| Internet Type | # Households | % Households |
| Dial-Up Internet | 0 | 0.0% |
| Broadband Home | 583 | 43.4% |
| Cellular Data Only | 308 | 23.0% |
| Satellite Internet | 63 | 4.7% |
| No Internet | 398 | 29.7% |
| Total | 1,342 | 100.0% |
Vivian Summary
Vivian is a small town located in the northwest corner of Louisiana, in Caddo Parish. It is situated on the banks of the Red River, and is home to a population of approximately 4,000 people. The town was founded in 1883 and has a rich history of agriculture, industry, and culture.
Geography
Vivian is located in the northwest corner of Louisiana, in Caddo Parish. It is situated on the banks of the Red River, and is bordered by the towns of Oil City, Hosston, and Ida. The town is located in the Red River Valley, which is a flat, fertile region of the state. The area is known for its rich soil and abundant wildlife. The town is also located near the Sabine National Forest, which is a popular destination for outdoor recreation.
Economy
Vivian’s economy is largely based on agriculture and industry. The town is home to several large farms, which produce a variety of crops, including cotton, corn, soybeans, and wheat. The town is also home to several manufacturing plants, which produce a variety of products, including furniture, clothing, and automotive parts. Additionally, Vivian is home to several small businesses, including restaurants, retail stores, and service providers.
Demographics
As of the 2010 census, Vivian had a population of 4,000 people. The town is predominantly white, with a small African American population. The median household income is $35,000, and the median age is 37. The town is home to several churches, including Baptist, Methodist, and Catholic.
Conclusion
Vivian is a small town located in the northwest corner of Louisiana, in Caddo Parish. It is situated on the banks of the Red River, and is home to a population of approximately 4,000 people. The town was founded in 1883 and has a rich history of agriculture, industry, and culture. Vivian’s economy is largely based on agriculture and industry, and the town is home to several large farms and manufacturing plants. The town is predominantly white, with a small African American population, and the median household income is $35,000. Vivian is a vibrant community with a rich history and culture, and is a great place to live and work.
Common Questions
What is the Total Population of Vivian?
Total Population of Vivian is 3,086.
What is the Total Male Population of Vivian?
Total Male Population of Vivian is 1,719.
What is the Total Female Population of Vivian?
Total Female Population of Vivian is 1,367.
What is the Ratio of Males per 100 Females in Vivian?
There are 125.75 Males per 100 Females in Vivian.
What is the Ratio of Females per 100 Males in Vivian?
There are 79.52 Females per 100 Males in Vivian.
What is the Median Population Age in Vivian?
Median Population Age in Vivian is 32.8 Years.
What is the Average Family Size in Vivian
Average Family Size in Vivian is 3.4 People.
What is the Average Household Size in Vivian
Average Household Size in Vivian is 2.3 People.
What is Per Capita Income in Vivian?
Per Capita income in Vivian is $18,804.
What is the Median Family Income in Vivian?
Median Family Income in Vivian is $30,000.
What is the Median Household income in Vivian?
Median Household Income in Vivian is $23,875.
What is Inequality or Gini Index in Vivian?
Inequality or Gini Index in Vivian is 0.48.
How Large is the Labor Force in Vivian?
There are 1,437 People in the Labor Forcein in Vivian.
What is the Percentage of People in the Labor Force in Vivian?
60.4% of People are in the Labor Force in Vivian.
What is the Unemployment Rate in Vivian?
Unemployment Rate in Vivian is 10.2%.