Spokane, LA
Spokane Map
Spokane Overview
471
TOTAL POPULATION
262
MALE POPULATION
209
FEMALE POPULATION
125.36
MALES / 100 FEMALES
79.77
FEMALES / 100 MALES
59.0
MEDIAN AGE
3.8
AVG FAMILY SIZE
2.5
AVG HOUSEHOLD SIZE
$70,205
PER CAPITA INCOME
$98,750
AVG HOUSEHOLD INCOME
0.50
INEQUALITY / GINI INDEX
231
LABOR FORCE [ PEOPLE ]
52.3%
PERCENT IN LABOR FORCE
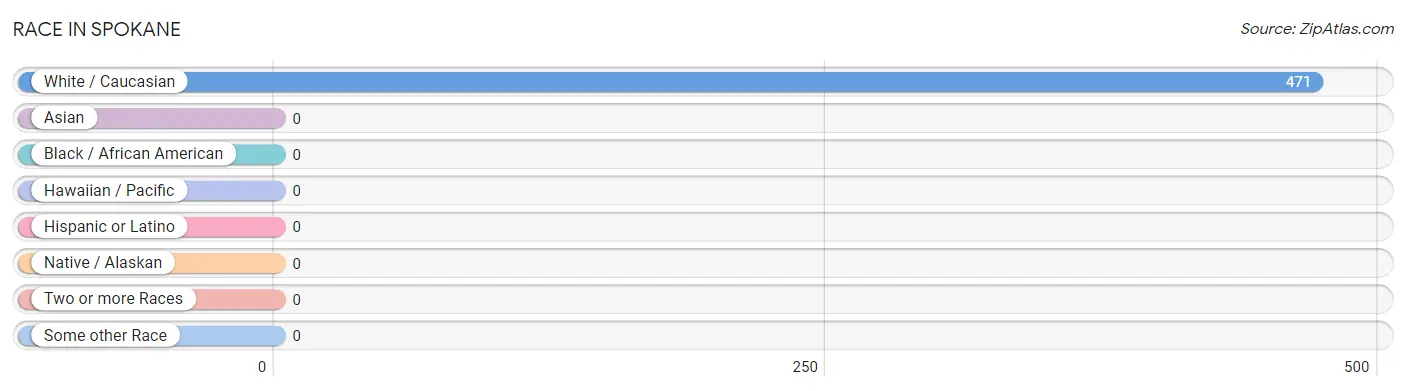
Race in Spokane
The most populous races in Spokane are , and White / Caucasian (471 | 100.0%).
| Race | # Population | % Population |
| Asian | 0 | 0.0% |
| Black / African American | 0 | 0.0% |
| Hawaiian / Pacific | 0 | 0.0% |
| Hispanic or Latino | 0 | 0.0% |
| Native / Alaskan | 0 | 0.0% |
| White / Caucasian | 471 | 100.0% |
| Two or more Races | 0 | 0.0% |
| Some other Race | 0 | 0.0% |
| Total | 471 | 100.0% |
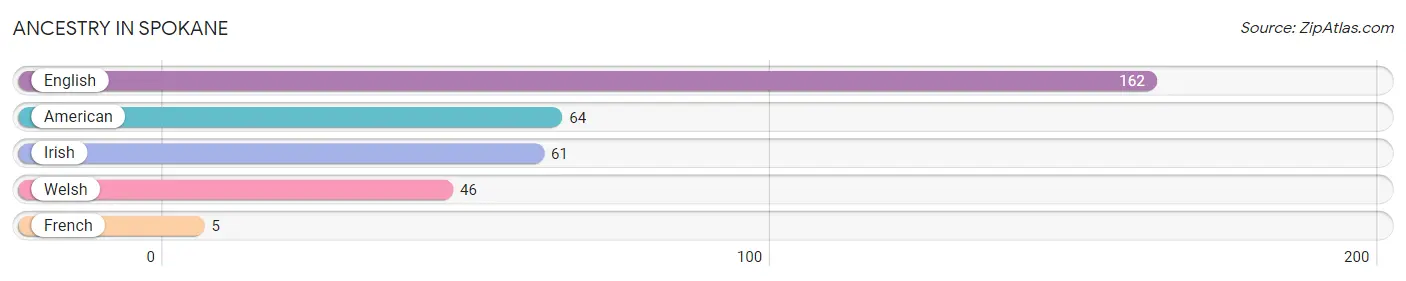
Ancestry in Spokane
The most populous ancestries reported in Spokane are English (162 | 34.4%), American (64 | 13.6%), Irish (61 | 13.0%), Welsh (46 | 9.8%), and French (5 | 1.1%), together accounting for 71.8% of all Spokane residents.
| Ancestry | # Population | % Population |
| American | 64 | 13.6% |
| English | 162 | 34.4% |
| French | 5 | 1.1% |
| Irish | 61 | 13.0% |
| Welsh | 46 | 9.8% | View All 5 Rows |
Immigrants in Spokane

| Immigration Origin | # Population | % Population | View All 0 Rows |
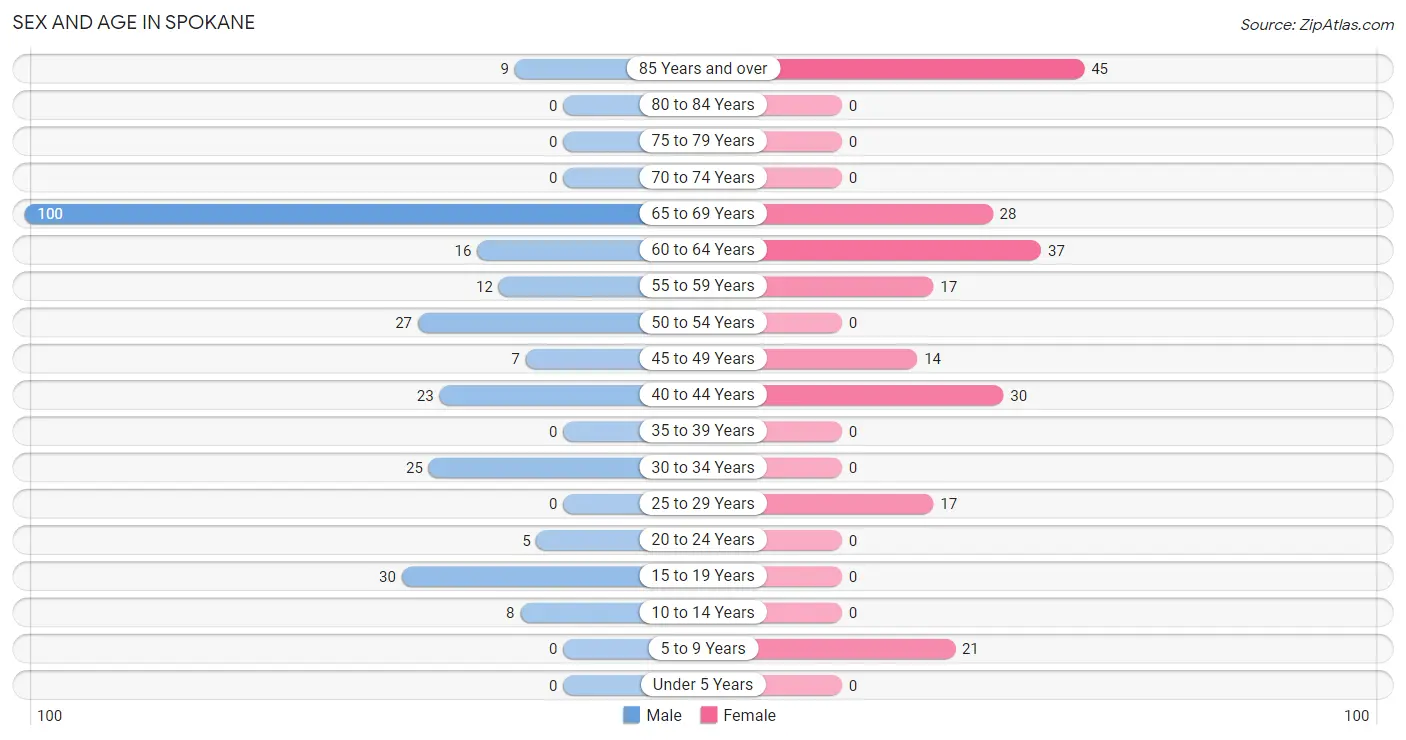
Sex and Age in Spokane
Sex and Age in Spokane
The most populous age groups in Spokane are 65 to 69 Years (100 | 38.2%) for men and 85 Years and over (45 | 21.5%) for women.
| Age Bracket | Male | Female |
| Under 5 Years | 0 (0.0%) | 0 (0.0%) |
| 5 to 9 Years | 0 (0.0%) | 21 (10.1%) |
| 10 to 14 Years | 8 (3.0%) | 0 (0.0%) |
| 15 to 19 Years | 30 (11.5%) | 0 (0.0%) |
| 20 to 24 Years | 5 (1.9%) | 0 (0.0%) |
| 25 to 29 Years | 0 (0.0%) | 17 (8.1%) |
| 30 to 34 Years | 25 (9.5%) | 0 (0.0%) |
| 35 to 39 Years | 0 (0.0%) | 0 (0.0%) |
| 40 to 44 Years | 23 (8.8%) | 30 (14.3%) |
| 45 to 49 Years | 7 (2.7%) | 14 (6.7%) |
| 50 to 54 Years | 27 (10.3%) | 0 (0.0%) |
| 55 to 59 Years | 12 (4.6%) | 17 (8.1%) |
| 60 to 64 Years | 16 (6.1%) | 37 (17.7%) |
| 65 to 69 Years | 100 (38.2%) | 28 (13.4%) |
| 70 to 74 Years | 0 (0.0%) | 0 (0.0%) |
| 75 to 79 Years | 0 (0.0%) | 0 (0.0%) |
| 80 to 84 Years | 0 (0.0%) | 0 (0.0%) |
| 85 Years and over | 9 (3.4%) | 45 (21.5%) |
| Total | 262 (100.0%) | 209 (100.0%) |
Families and Households in Spokane
Median Family Size in Spokane
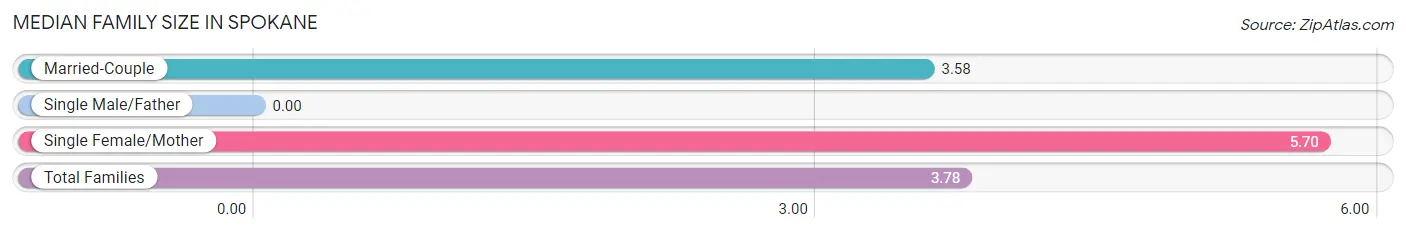
| Family Type | # Families | Family Size |
| Married-Couple | 92 (90.2%) | 3.58 |
| Single Male/Father | 0 (0.0%) | - |
| Single Female/Mother | 10 (9.8%) | 5.70 |
| Total Families | 102 (100.0%) | 3.78 |
Median Household Size in Spokane
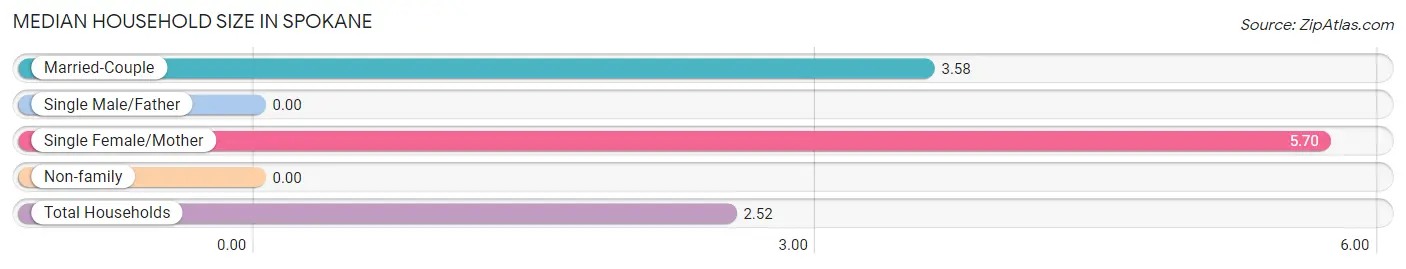
| Household Type | # Households | Household Size |
| Married-Couple | 92 (49.2%) | 3.58 |
| Single Male/Father | 0 (0.0%) | - |
| Single Female/Mother | 10 (5.3%) | 5.70 |
| Non-family | 85 (45.5%) | - |
| Total Households | 187 (100.0%) | 2.52 |
Household Size by Marriage Status in Spokane
Out of a total of 187 households in Spokane, 102 (54.5%) are family households, while 85 (45.5%) are nonfamily households. The most numerous type of family households are 2-person households, comprising 61, and the most common type of nonfamily households are 1-person households, comprising 85.
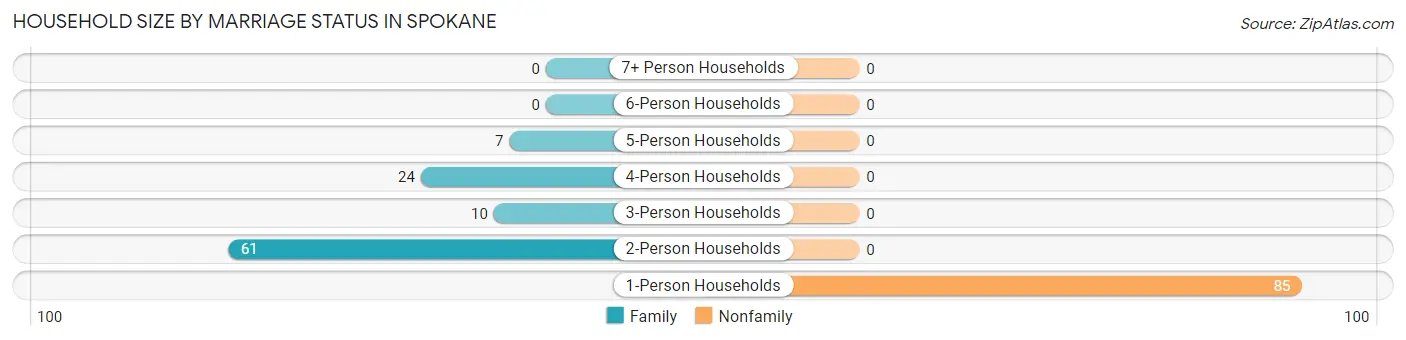
| Household Size | Family Households | Nonfamily Households |
| 1-Person Households | - | 85 (45.5%) |
| 2-Person Households | 61 (32.6%) | 0 (0.0%) |
| 3-Person Households | 10 (5.3%) | 0 (0.0%) |
| 4-Person Households | 24 (12.8%) | 0 (0.0%) |
| 5-Person Households | 7 (3.7%) | 0 (0.0%) |
| 6-Person Households | 0 (0.0%) | 0 (0.0%) |
| 7+ Person Households | 0 (0.0%) | 0 (0.0%) |
| Total | 102 (54.5%) | 85 (45.5%) |
Female Fertility in Spokane
Fertility by Age in Spokane
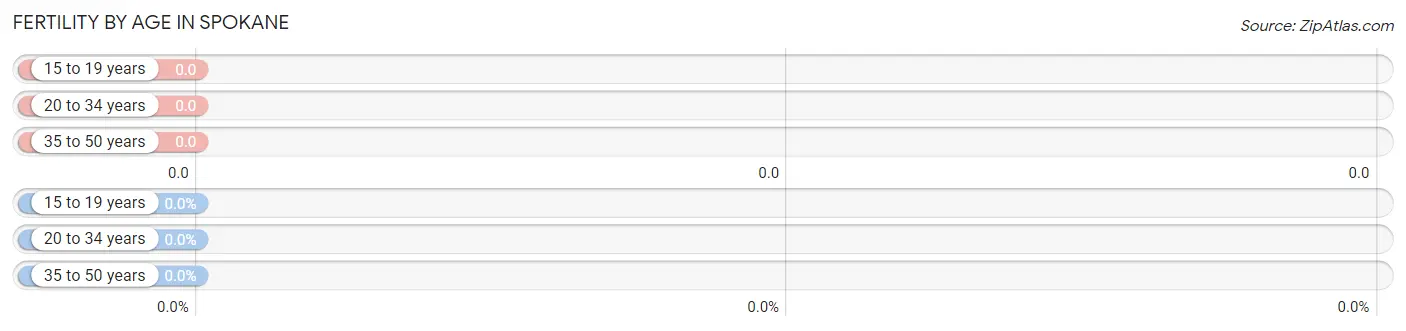
| Age Bracket | Women with Births | Births / 1,000 Women |
| 15 to 19 years | 0 (0.0%) | 0.0 |
| 20 to 34 years | 0 (0.0%) | 0.0 |
| 35 to 50 years | 0 (0.0%) | 0.0 |
| Total | 0 (0.0%) | 0.0 |
Fertility by Age by Marriage Status in Spokane
| Age Bracket | Married | Unmarried |
| 15 to 19 years | 0 (0.0%) | 0 (0.0%) |
| 20 to 34 years | 0 (0.0%) | 0 (0.0%) |
| 35 to 50 years | 0 (0.0%) | 0 (0.0%) |
| Total | 0 (0.0%) | 0 (0.0%) |
Fertility by Education in Spokane
| Educational Attainment | Women with Births | Births / 1,000 Women |
| Less than High School | 0 (0.0%) | 0.0 |
| High School Diploma | 0 (0.0%) | 0.0 |
| College or Associate's Degree | 0 (0.0%) | 0.0 |
| Bachelor's Degree | 0 (0.0%) | 0.0 |
| Graduate Degree | 0 (0.0%) | 0.0 |
| Total | 0 (0.0%) | 0.0 |
Fertility by Education by Marriage Status in Spokane
| Educational Attainment | Married | Unmarried |
| Less than High School | 0 (0.0%) | 0 (0.0%) |
| High School Diploma | 0 (0.0%) | 0 (0.0%) |
| College or Associate's Degree | 0 (0.0%) | 0 (0.0%) |
| Bachelor's Degree | 0 (0.0%) | 0 (0.0%) |
| Graduate Degree | 0 (0.0%) | 0 (0.0%) |
| Total | 0 (0.0%) | 0 (0.0%) |
Income in Spokane
Income Overview in Spokane
| Characteristic | Number | Measure |
| Per Capita Income | 471 | $70,205 |
| Median Family Income | 102 | $0 |
| Mean Family Income | 102 | $213,247 |
| Median Household Income | 187 | $98,750 |
| Mean Household Income | 187 | $147,701 |
| Income Deficit | 102 | $0 |
| Wage / Income Gap (%) | 471 | 0.00% |
| Wage / Income Gap ($) | 471 | 100.00¢ per $1 |
| Gini / Inequality Index | 471 | 0.50 |
Earnings by Sex in Spokane
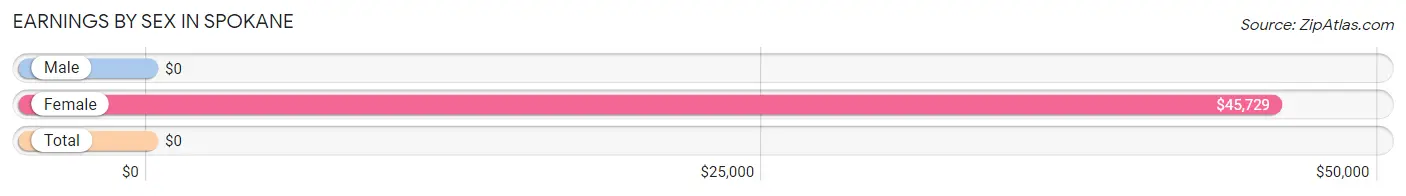
| Sex | Number | Average Earnings |
| Male | 111 (48.0%) | $0 |
| Female | 120 (51.9%) | $45,729 |
| Total | 231 (100.0%) | $0 |
Earnings by Sex by Income Bracket in Spokane
The most common earnings brackets in Spokane are $100,000+ for men (50 | 45.1%) and $45,000 to $49,999 for women (24 | 20.0%).
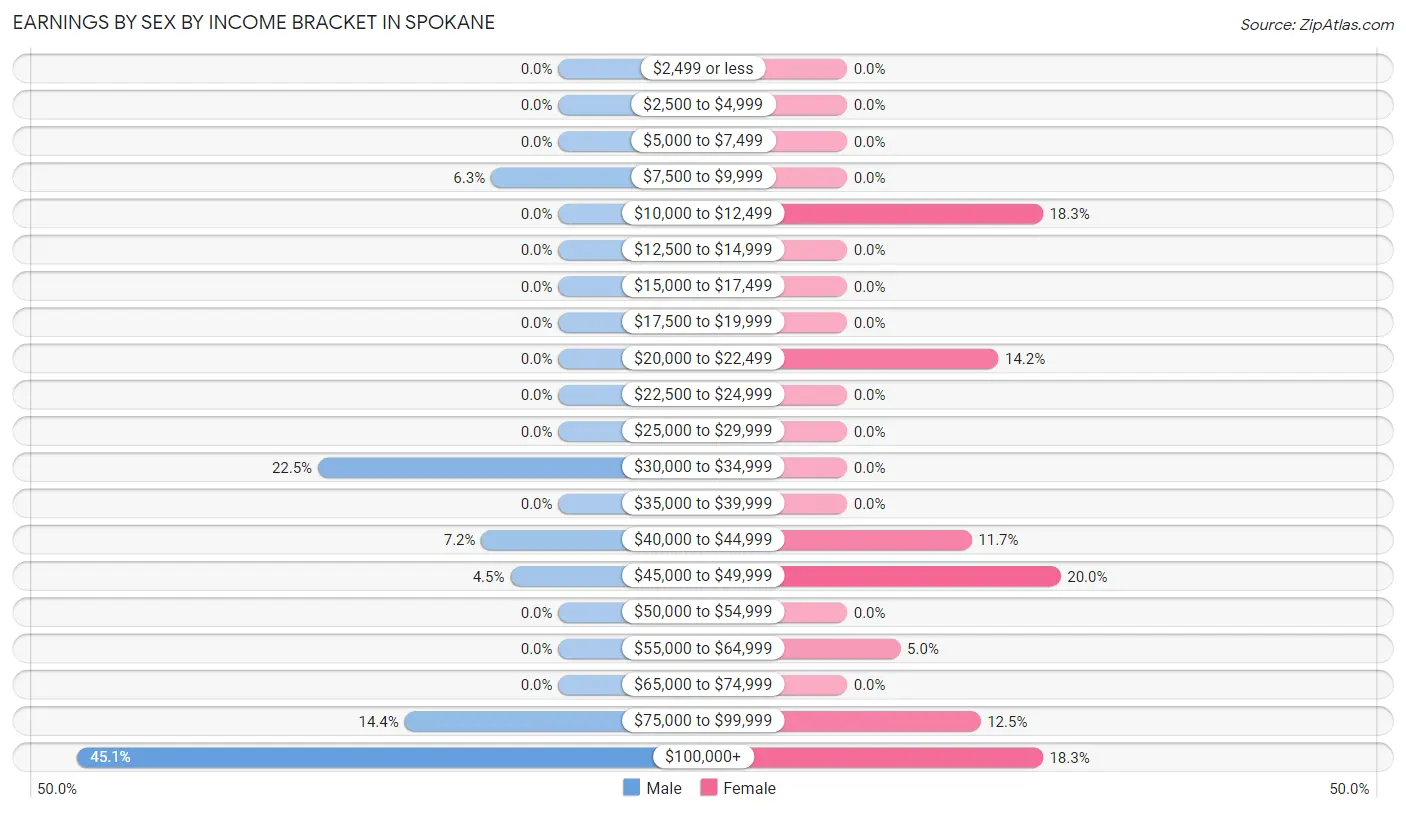
| Income | Male | Female |
| $2,499 or less | 0 (0.0%) | 0 (0.0%) |
| $2,500 to $4,999 | 0 (0.0%) | 0 (0.0%) |
| $5,000 to $7,499 | 0 (0.0%) | 0 (0.0%) |
| $7,500 to $9,999 | 7 (6.3%) | 0 (0.0%) |
| $10,000 to $12,499 | 0 (0.0%) | 22 (18.3%) |
| $12,500 to $14,999 | 0 (0.0%) | 0 (0.0%) |
| $15,000 to $17,499 | 0 (0.0%) | 0 (0.0%) |
| $17,500 to $19,999 | 0 (0.0%) | 0 (0.0%) |
| $20,000 to $22,499 | 0 (0.0%) | 17 (14.2%) |
| $22,500 to $24,999 | 0 (0.0%) | 0 (0.0%) |
| $25,000 to $29,999 | 0 (0.0%) | 0 (0.0%) |
| $30,000 to $34,999 | 25 (22.5%) | 0 (0.0%) |
| $35,000 to $39,999 | 0 (0.0%) | 0 (0.0%) |
| $40,000 to $44,999 | 8 (7.2%) | 14 (11.7%) |
| $45,000 to $49,999 | 5 (4.5%) | 24 (20.0%) |
| $50,000 to $54,999 | 0 (0.0%) | 0 (0.0%) |
| $55,000 to $64,999 | 0 (0.0%) | 6 (5.0%) |
| $65,000 to $74,999 | 0 (0.0%) | 0 (0.0%) |
| $75,000 to $99,999 | 16 (14.4%) | 15 (12.5%) |
| $100,000+ | 50 (45.1%) | 22 (18.3%) |
| Total | 111 (100.0%) | 120 (100.0%) |
Earnings by Sex by Educational Attainment in Spokane
| Educational Attainment | Male Income | Female Income |
| Less than High School | - | - |
| High School Diploma | - | - |
| College or Associate's Degree | - | - |
| Bachelor's Degree | - | - |
| Graduate Degree | - | - |
| Total | - | - |
Family Income in Spokane
Family Income Brackets in Spokane
According to the Spokane family income data, there are 45 families falling into the $200,000+ income range, which is the most common income bracket and makes up 44.1% of all families.
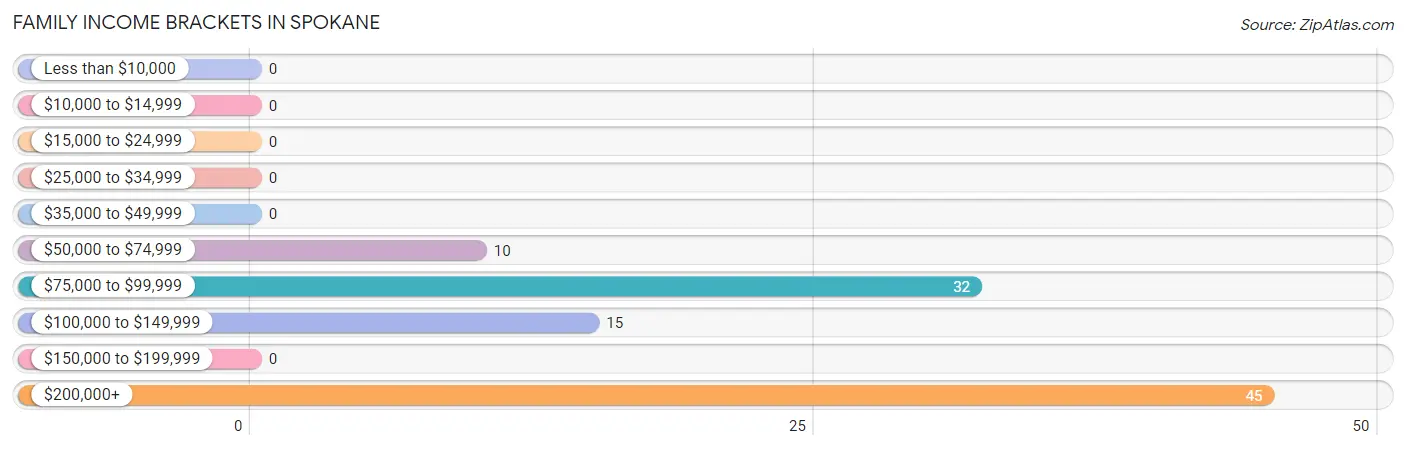
| Income Bracket | # Families | % Families |
| Less than $10,000 | 0 | 0.0% |
| $10,000 to $14,999 | 0 | 0.0% |
| $15,000 to $24,999 | 0 | 0.0% |
| $25,000 to $34,999 | 0 | 0.0% |
| $35,000 to $49,999 | 0 | 0.0% |
| $50,000 to $74,999 | 10 | 9.8% |
| $75,000 to $99,999 | 32 | 31.4% |
| $100,000 to $149,999 | 15 | 14.7% |
| $150,000 to $199,999 | 0 | 0.0% |
| $200,000+ | 45 | 44.1% |
Family Income by Famaliy Size in Spokane
2-person families (61 | 59.8%) account for the highest median family income in Spokane with $99,837 per family, while 2-person families (61 | 59.8%) have the highest median income of $49,918 per family member.
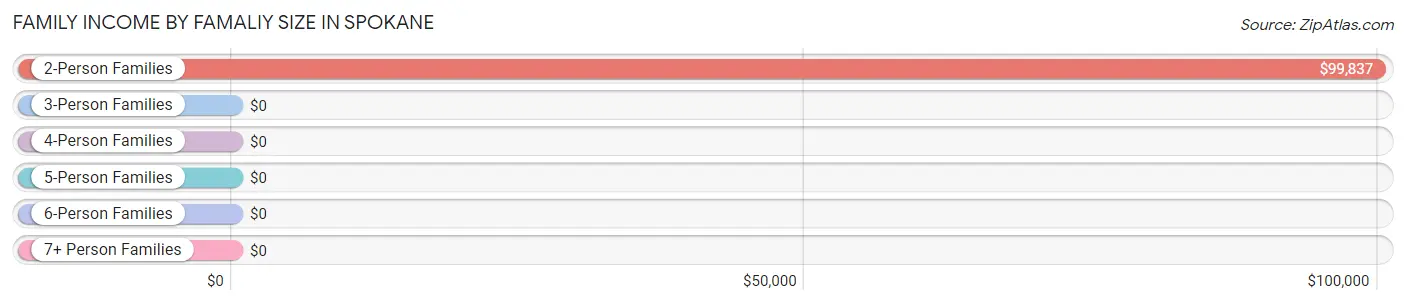
| Income Bracket | # Families | Median Income |
| 2-Person Families | 61 (59.8%) | $99,837 |
| 3-Person Families | 10 (9.8%) | $0 |
| 4-Person Families | 24 (23.5%) | $0 |
| 5-Person Families | 7 (6.9%) | $0 |
| 6-Person Families | 0 (0.0%) | $0 |
| 7+ Person Families | 0 (0.0%) | $0 |
| Total | 102 (100.0%) | $0 |
Family Income by Number of Earners in Spokane
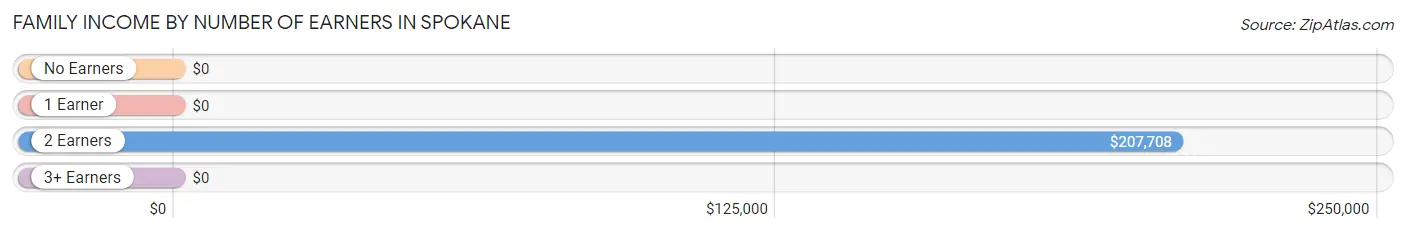
| Number of Earners | # Families | Median Income |
| No Earners | 9 (8.8%) | $0 |
| 1 Earner | 21 (20.6%) | $0 |
| 2 Earners | 72 (70.6%) | $207,708 |
| 3+ Earners | 0 (0.0%) | $0 |
| Total | 102 (100.0%) | $0 |
Household Income in Spokane
Household Income Brackets in Spokane
With 45 households falling in the category, the $200,000+ income range is the most frequent in Spokane, accounting for 24.1% of all households.
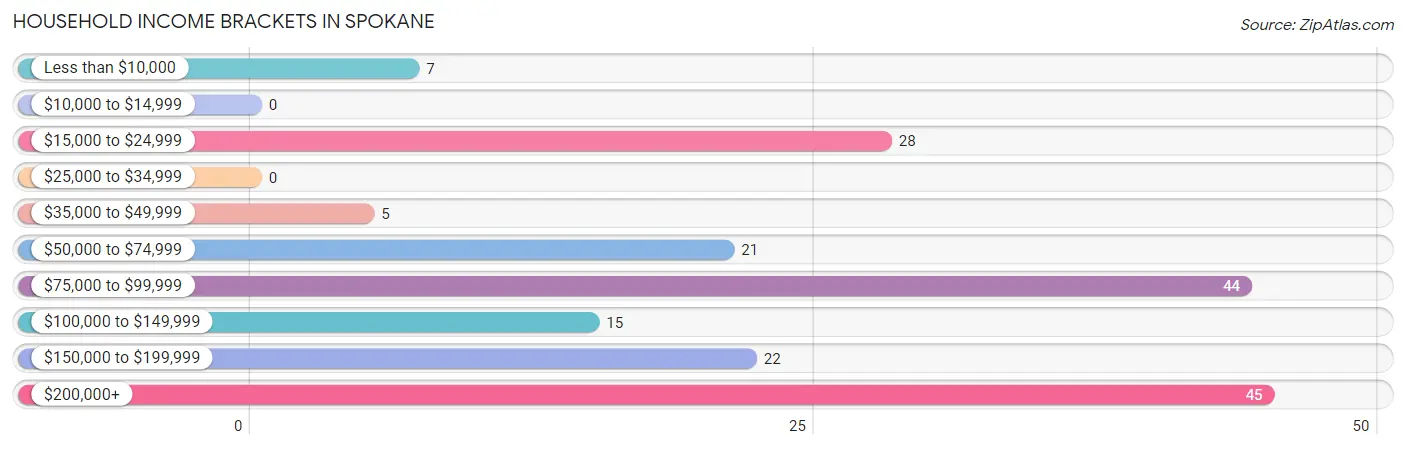
| Income Bracket | # Households | % Households |
| Less than $10,000 | 7 | 3.7% |
| $10,000 to $14,999 | 0 | 0.0% |
| $15,000 to $24,999 | 28 | 15.0% |
| $25,000 to $34,999 | 0 | 0.0% |
| $35,000 to $49,999 | 5 | 2.7% |
| $50,000 to $74,999 | 21 | 11.2% |
| $75,000 to $99,999 | 44 | 23.5% |
| $100,000 to $149,999 | 15 | 8.0% |
| $150,000 to $199,999 | 22 | 11.8% |
| $200,000+ | 45 | 24.1% |
Household Income by Householder Age in Spokane
The median household income in Spokane is $98,750, with the highest median household income of $107,500 found in the 45 to 64 years age bracket for the primary householder. A total of 72 households (38.5%) fall into this category. Meanwhile, the 15 to 24 years age bracket for the primary householder has the lowest median household income of $0, with 5 households (2.7%) in this group.
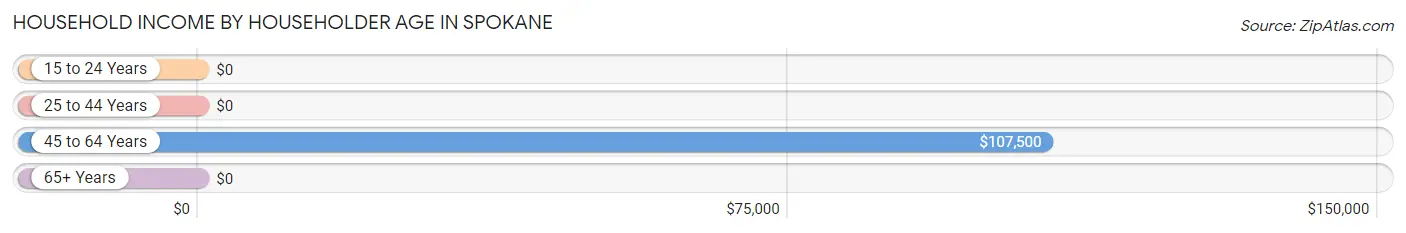
| Income Bracket | # Households | Median Income |
| 15 to 24 Years | 5 (2.7%) | $0 |
| 25 to 44 Years | 24 (12.8%) | $0 |
| 45 to 64 Years | 72 (38.5%) | $107,500 |
| 65+ Years | 86 (46.0%) | $0 |
| Total | 187 (100.0%) | $98,750 |
Poverty in Spokane
Income Below Poverty by Sex and Age in Spokane
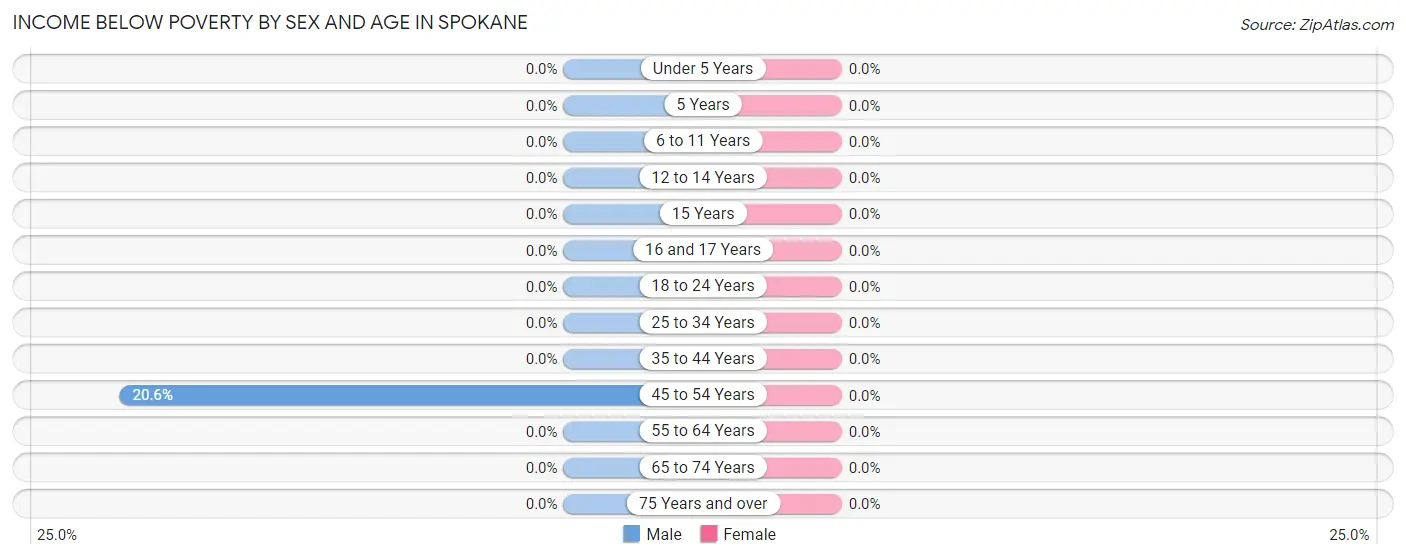
| Age Bracket | Male | Female |
| Under 5 Years | 0 (0.0%) | 0 (0.0%) |
| 5 Years | 0 (0.0%) | 0 (0.0%) |
| 6 to 11 Years | 0 (0.0%) | 0 (0.0%) |
| 12 to 14 Years | 0 (0.0%) | 0 (0.0%) |
| 15 Years | 0 (0.0%) | 0 (0.0%) |
| 16 and 17 Years | 0 (0.0%) | 0 (0.0%) |
| 18 to 24 Years | 0 (0.0%) | 0 (0.0%) |
| 25 to 34 Years | 0 (0.0%) | 0 (0.0%) |
| 35 to 44 Years | 0 (0.0%) | 0 (0.0%) |
| 45 to 54 Years | 7 (20.6%) | 0 (0.0%) |
| 55 to 64 Years | 0 (0.0%) | 0 (0.0%) |
| 65 to 74 Years | 0 (0.0%) | 0 (0.0%) |
| 75 Years and over | 0 (0.0%) | 0 (0.0%) |
| Total | 7 (2.7%) | 0 (0.0%) |
Income Above Poverty by Sex and Age in Spokane
According to the poverty statistics in Spokane, males aged 12 to 14 years and females aged 6 to 11 years are the age groups that are most secure financially, with 100.0% of males and 100.0% of females in these age groups living above the poverty line.
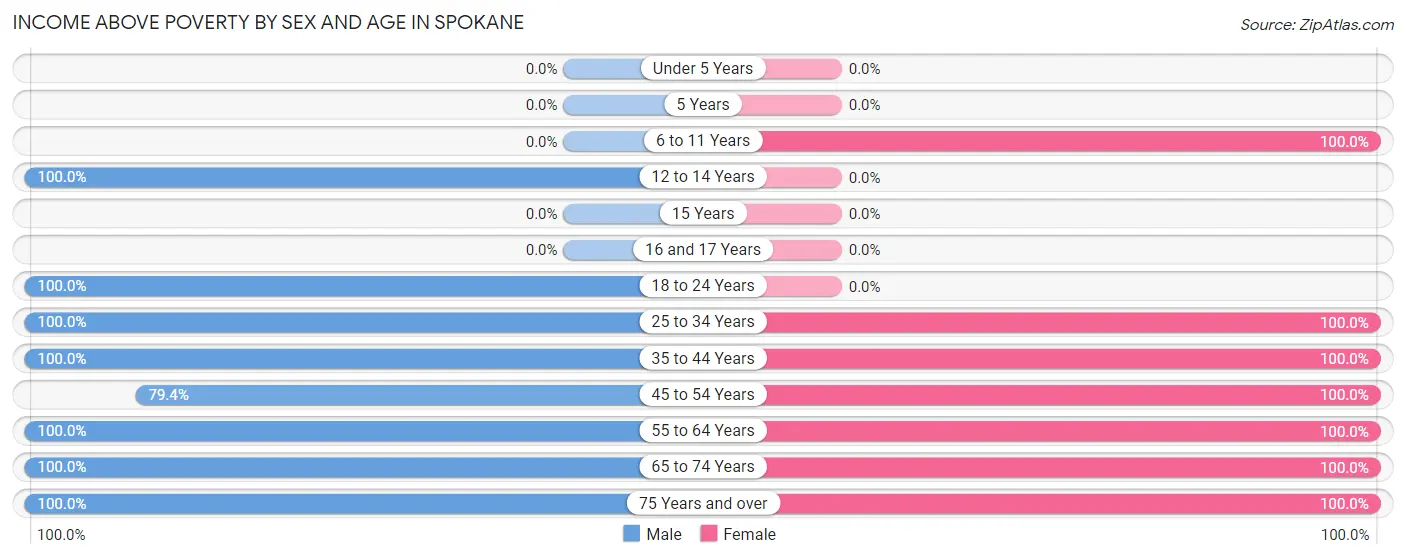
| Age Bracket | Male | Female |
| Under 5 Years | 0 (0.0%) | 0 (0.0%) |
| 5 Years | 0 (0.0%) | 0 (0.0%) |
| 6 to 11 Years | 0 (0.0%) | 21 (100.0%) |
| 12 to 14 Years | 8 (100.0%) | 0 (0.0%) |
| 15 Years | 0 (0.0%) | 0 (0.0%) |
| 16 and 17 Years | 0 (0.0%) | 0 (0.0%) |
| 18 to 24 Years | 35 (100.0%) | 0 (0.0%) |
| 25 to 34 Years | 25 (100.0%) | 17 (100.0%) |
| 35 to 44 Years | 23 (100.0%) | 30 (100.0%) |
| 45 to 54 Years | 27 (79.4%) | 14 (100.0%) |
| 55 to 64 Years | 28 (100.0%) | 54 (100.0%) |
| 65 to 74 Years | 100 (100.0%) | 28 (100.0%) |
| 75 Years and over | 9 (100.0%) | 45 (100.0%) |
| Total | 255 (97.3%) | 209 (100.0%) |
Income Below Poverty Among Married-Couple Families in Spokane
| Children | Above Poverty | Below Poverty |
| No Children | 61 (100.0%) | 0 (0.0%) |
| 1 or 2 Children | 31 (100.0%) | 0 (0.0%) |
| 3 or 4 Children | 0 (0.0%) | 0 (0.0%) |
| 5 or more Children | 0 (0.0%) | 0 (0.0%) |
| Total | 92 (100.0%) | 0 (0.0%) |
Income Below Poverty Among Single-Parent Households in Spokane
| Children | Single Father | Single Mother |
| No Children | 0 (0.0%) | 0 (0.0%) |
| 1 or 2 Children | 0 (0.0%) | 0 (0.0%) |
| 3 or 4 Children | 0 (0.0%) | 0 (0.0%) |
| 5 or more Children | 0 (0.0%) | 0 (0.0%) |
| Total | 0 (0.0%) | 0 (0.0%) |
Income Below Poverty Among Married-Couple vs Single-Parent Households in Spokane
| Children | Married-Couple Families | Single-Parent Households |
| No Children | 0 (0.0%) | 0 (0.0%) |
| 1 or 2 Children | 0 (0.0%) | 0 (0.0%) |
| 3 or 4 Children | 0 (0.0%) | 0 (0.0%) |
| 5 or more Children | 0 (0.0%) | 0 (0.0%) |
| Total | 0 (0.0%) | 0 (0.0%) |
Employment Characteristics in Spokane
Employment by Class of Employer in Spokane
Among the 231 employed individuals in Spokane, private company employees (189 | 81.8%), local government employees (21 | 9.1%), and self-employed (incorporated) (8 | 3.5%) make up the most common classes of employment.
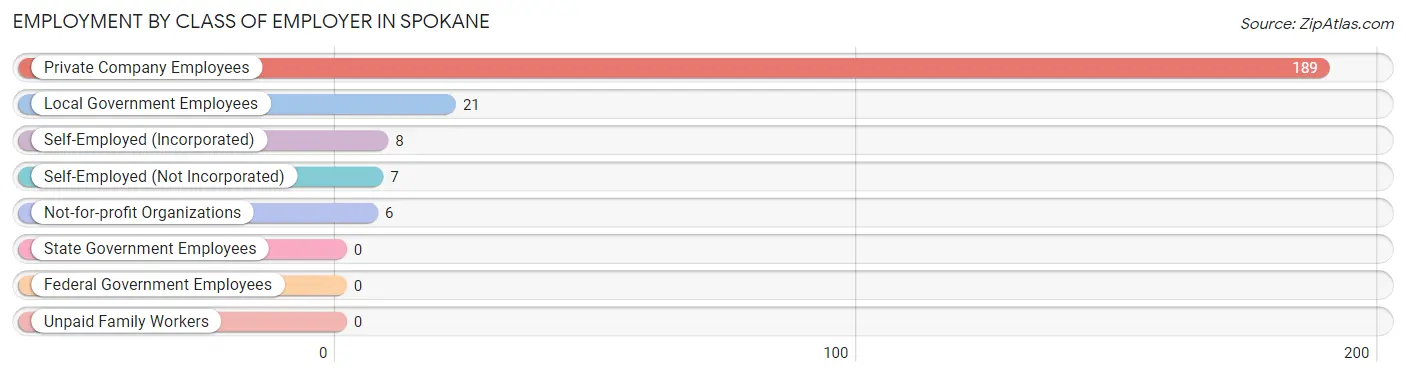
| Employer Class | # Employees | % Employees |
| Private Company Employees | 189 | 81.8% |
| Self-Employed (Incorporated) | 8 | 3.5% |
| Self-Employed (Not Incorporated) | 7 | 3.0% |
| Not-for-profit Organizations | 6 | 2.6% |
| Local Government Employees | 21 | 9.1% |
| State Government Employees | 0 | 0.0% |
| Federal Government Employees | 0 | 0.0% |
| Unpaid Family Workers | 0 | 0.0% |
| Total | 231 | 100.0% |
Employment Status by Age in Spokane
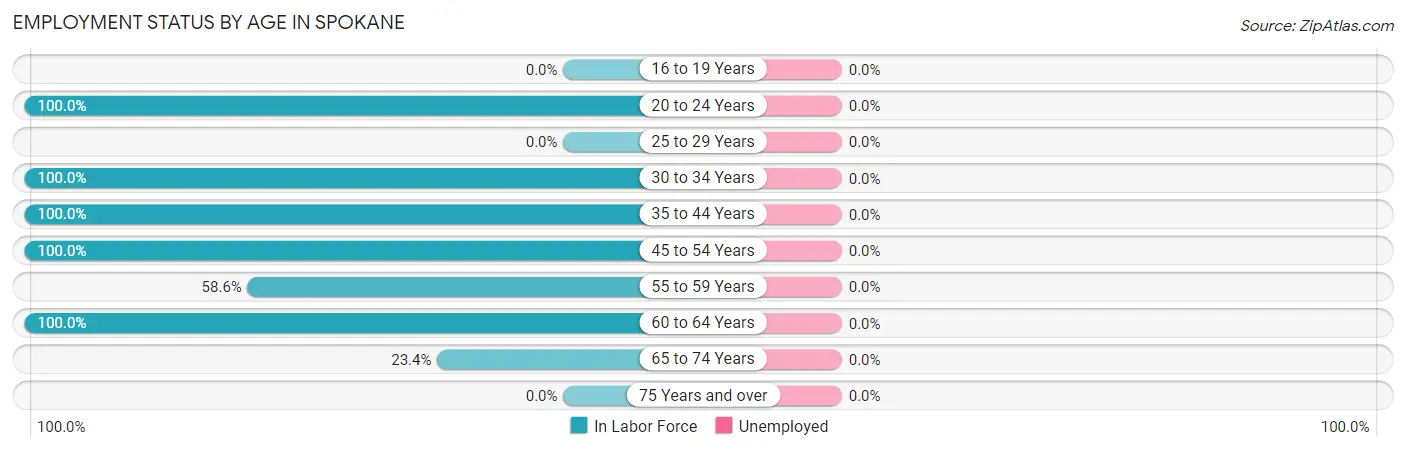
| Age Bracket | In Labor Force | Unemployed |
| 16 to 19 Years | 0 (0.0%) | 0 (0.0%) |
| 20 to 24 Years | 5 (100.0%) | 0 (0.0%) |
| 25 to 29 Years | 0 (0.0%) | 0 (0.0%) |
| 30 to 34 Years | 25 (100.0%) | 0 (0.0%) |
| 35 to 44 Years | 53 (100.0%) | 0 (0.0%) |
| 45 to 54 Years | 48 (100.0%) | 0 (0.0%) |
| 55 to 59 Years | 17 (58.6%) | 0 (0.0%) |
| 60 to 64 Years | 53 (100.0%) | 0 (0.0%) |
| 65 to 74 Years | 30 (23.4%) | 0 (0.0%) |
| 75 Years and over | 0 (0.0%) | 0 (0.0%) |
| Total | 231 (52.3%) | 0 (0.0%) |
Employment Status by Educational Attainment in Spokane
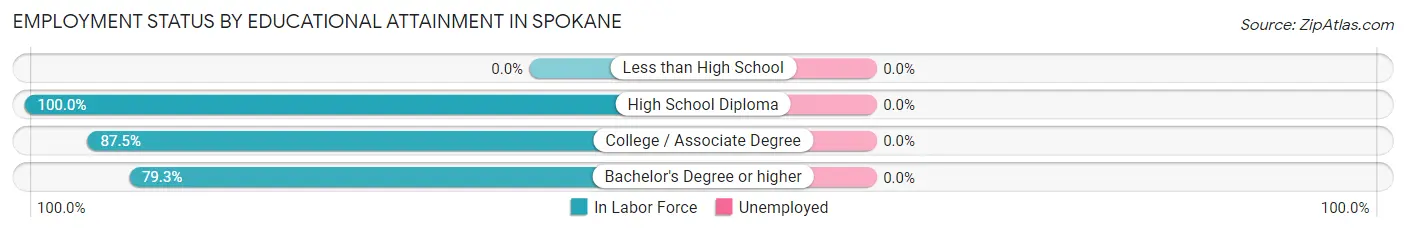
| Educational Attainment | In Labor Force | Unemployed |
| Less than High School | 0 (0.0%) | 0 (0.0%) |
| High School Diploma | 47 (100.0%) | 0 (0.0%) |
| College / Associate Degree | 84 (87.5%) | 0 (0.0%) |
| Bachelor's Degree or higher | 65 (79.3%) | 0 (0.0%) |
| Total | 196 (87.1%) | 0 (0.0%) |
Employment Occupations by Sex in Spokane
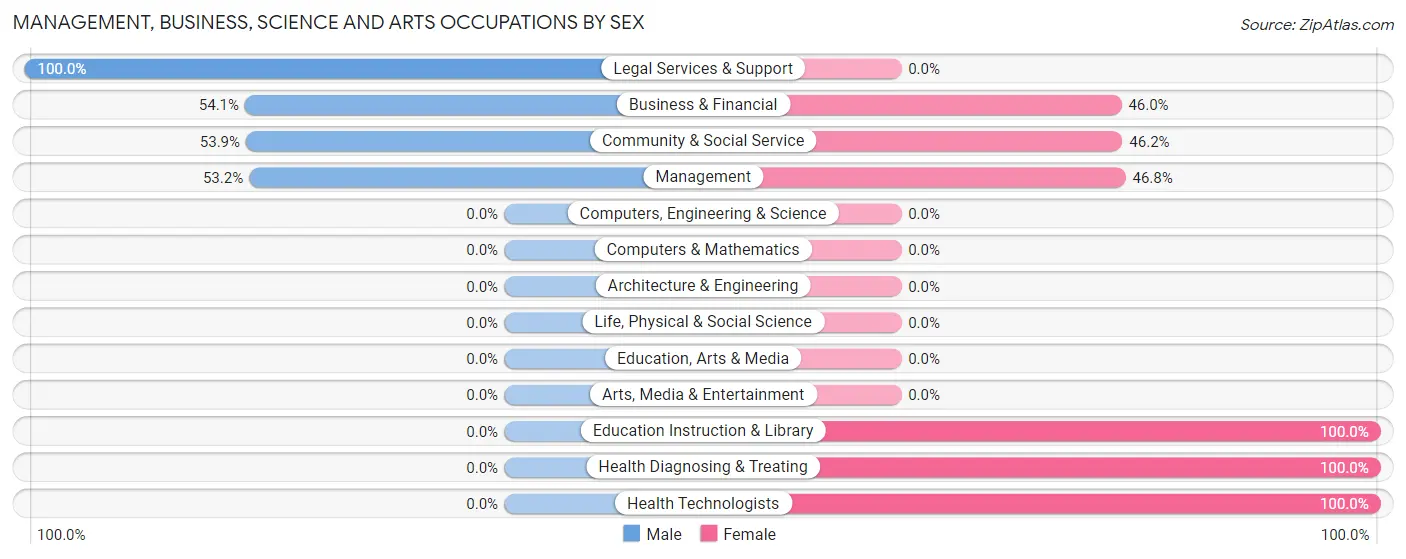
Management, Business, Science and Arts Occupations
The most common Management, Business, Science and Arts occupations in Spokane are Management (47 | 20.3%), Business & Financial (37 | 16.0%), Health Diagnosing & Treating (29 | 12.6%), Health Technologists (29 | 12.6%), and Community & Social Service (13 | 5.6%).
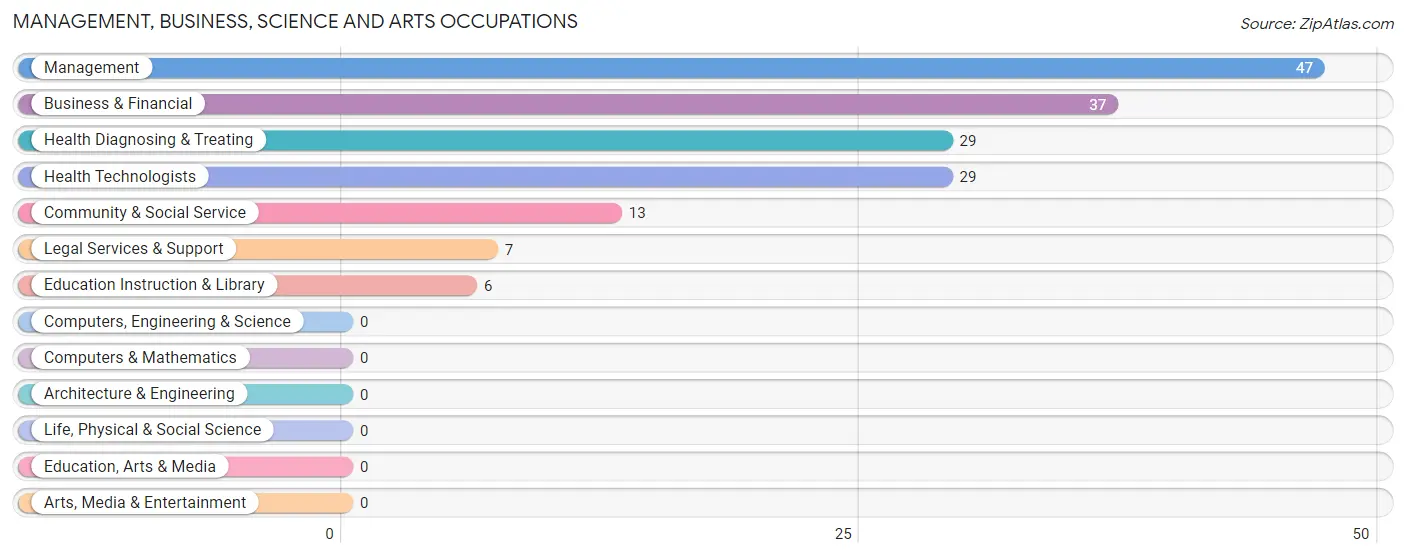
Management, Business, Science and Arts Occupations by Sex
Within the Management, Business, Science and Arts occupations in Spokane, the most male-oriented occupations are Legal Services & Support (100.0%), Business & Financial (54.0%), and Community & Social Service (53.8%), while the most female-oriented occupations are Education Instruction & Library (100.0%), Health Diagnosing & Treating (100.0%), and Health Technologists (100.0%).
| Occupation | Male | Female |
| Management | 25 (53.2%) | 22 (46.8%) |
| Business & Financial | 20 (54.0%) | 17 (46.0%) |
| Computers, Engineering & Science | 0 (0.0%) | 0 (0.0%) |
| Computers & Mathematics | 0 (0.0%) | 0 (0.0%) |
| Architecture & Engineering | 0 (0.0%) | 0 (0.0%) |
| Life, Physical & Social Science | 0 (0.0%) | 0 (0.0%) |
| Community & Social Service | 7 (53.8%) | 6 (46.2%) |
| Education, Arts & Media | 0 (0.0%) | 0 (0.0%) |
| Legal Services & Support | 7 (100.0%) | 0 (0.0%) |
| Education Instruction & Library | 0 (0.0%) | 6 (100.0%) |
| Arts, Media & Entertainment | 0 (0.0%) | 0 (0.0%) |
| Health Diagnosing & Treating | 0 (0.0%) | 29 (100.0%) |
| Health Technologists | 0 (0.0%) | 29 (100.0%) |
| Total (Category) | 52 (41.3%) | 74 (58.7%) |
| Total (Overall) | 111 (48.0%) | 120 (51.9%) |
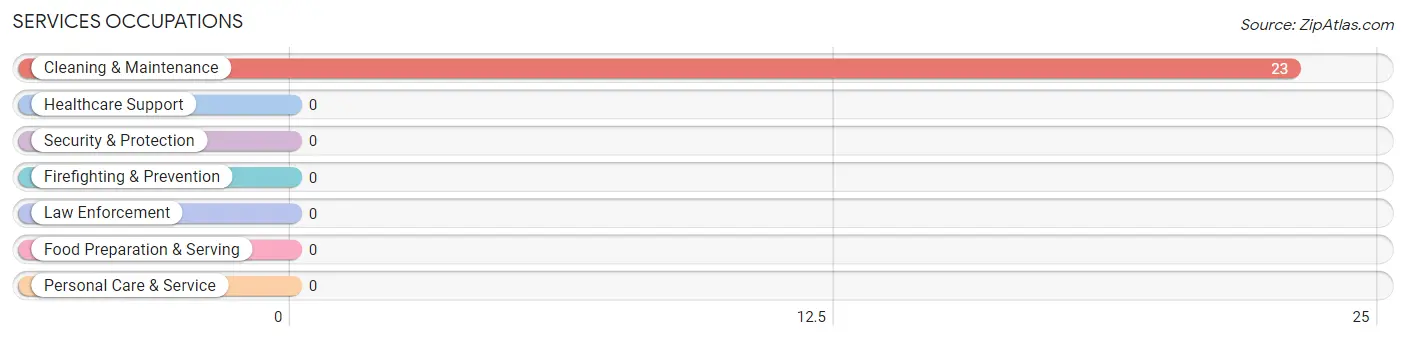
Services Occupations
The most common Services occupations in Spokane are , and Cleaning & Maintenance (23 | 10.0%).
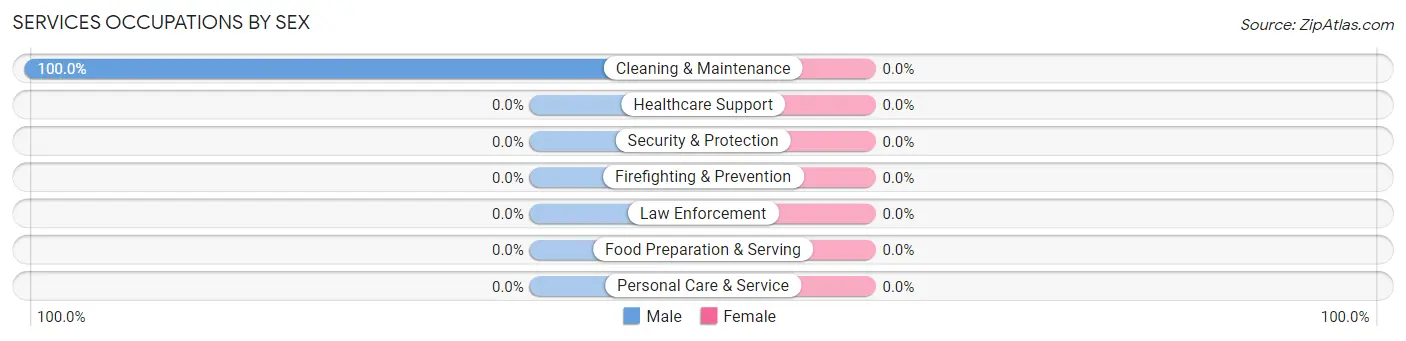
Services Occupations by Sex
| Occupation | Male | Female |
| Healthcare Support | 0 (0.0%) | 0 (0.0%) |
| Security & Protection | 0 (0.0%) | 0 (0.0%) |
| Firefighting & Prevention | 0 (0.0%) | 0 (0.0%) |
| Law Enforcement | 0 (0.0%) | 0 (0.0%) |
| Food Preparation & Serving | 0 (0.0%) | 0 (0.0%) |
| Cleaning & Maintenance | 23 (100.0%) | 0 (0.0%) |
| Personal Care & Service | 0 (0.0%) | 0 (0.0%) |
| Total (Category) | 23 (100.0%) | 0 (0.0%) |
| Total (Overall) | 111 (48.0%) | 120 (51.9%) |
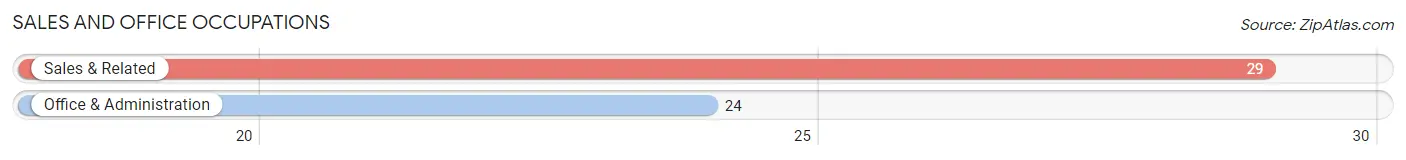
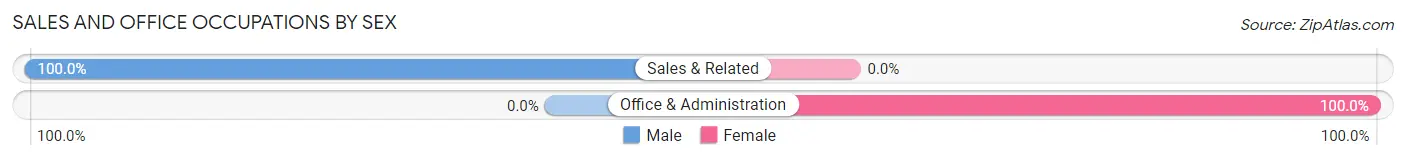
Sales and Office Occupations
The most common Sales and Office occupations in Spokane are Sales & Related (29 | 12.6%), and Office & Administration (24 | 10.4%).
Sales and Office Occupations by Sex
| Occupation | Male | Female |
| Sales & Related | 29 (100.0%) | 0 (0.0%) |
| Office & Administration | 0 (0.0%) | 24 (100.0%) |
| Total (Category) | 29 (54.7%) | 24 (45.3%) |
| Total (Overall) | 111 (48.0%) | 120 (51.9%) |
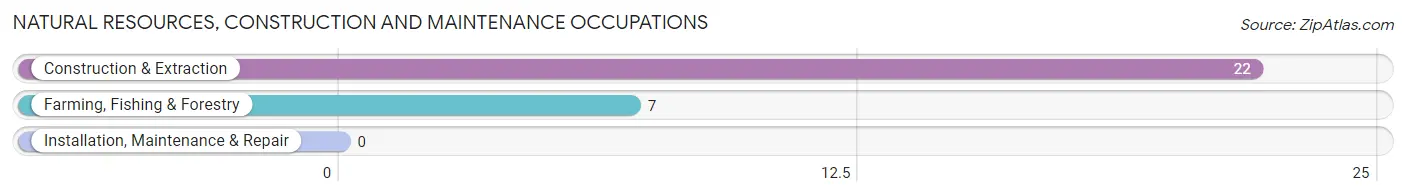
Natural Resources, Construction and Maintenance Occupations
The most common Natural Resources, Construction and Maintenance occupations in Spokane are Construction & Extraction (22 | 9.5%), and Farming, Fishing & Forestry (7 | 3.0%).
Natural Resources, Construction and Maintenance Occupations by Sex
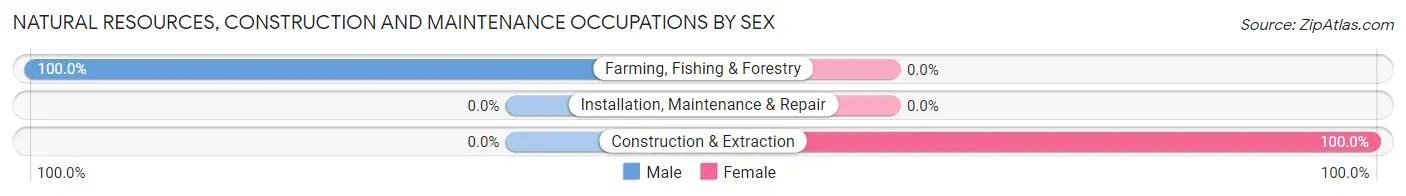
| Occupation | Male | Female |
| Farming, Fishing & Forestry | 7 (100.0%) | 0 (0.0%) |
| Construction & Extraction | 0 (0.0%) | 22 (100.0%) |
| Installation, Maintenance & Repair | 0 (0.0%) | 0 (0.0%) |
| Total (Category) | 7 (24.1%) | 22 (75.9%) |
| Total (Overall) | 111 (48.0%) | 120 (51.9%) |
Production, Transportation and Moving Occupations
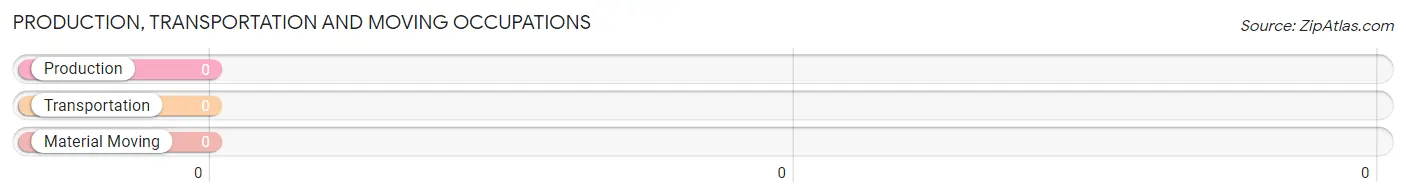
Production, Transportation and Moving Occupations by Sex
| Occupation | Male | Female |
| Production | 0 (0.0%) | 0 (0.0%) |
| Transportation | 0 (0.0%) | 0 (0.0%) |
| Material Moving | 0 (0.0%) | 0 (0.0%) |
| Total (Category) | 0 (0.0%) | 0 (0.0%) |
| Total (Overall) | 111 (48.0%) | 120 (51.9%) |
Employment Industries by Sex in Spokane
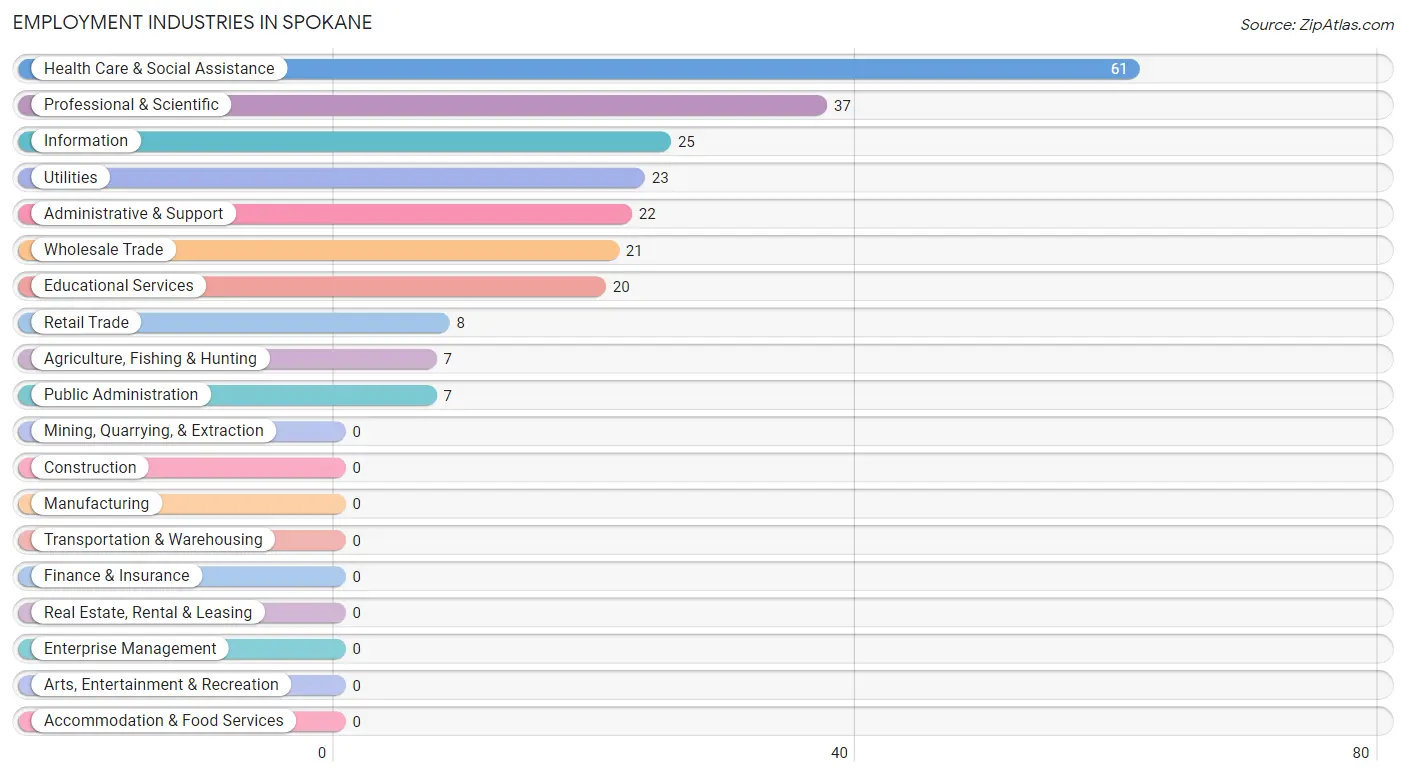
Employment Industries in Spokane
The major employment industries in Spokane include Health Care & Social Assistance (61 | 26.4%), Professional & Scientific (37 | 16.0%), Information (25 | 10.8%), Utilities (23 | 10.0%), and Administrative & Support (22 | 9.5%).
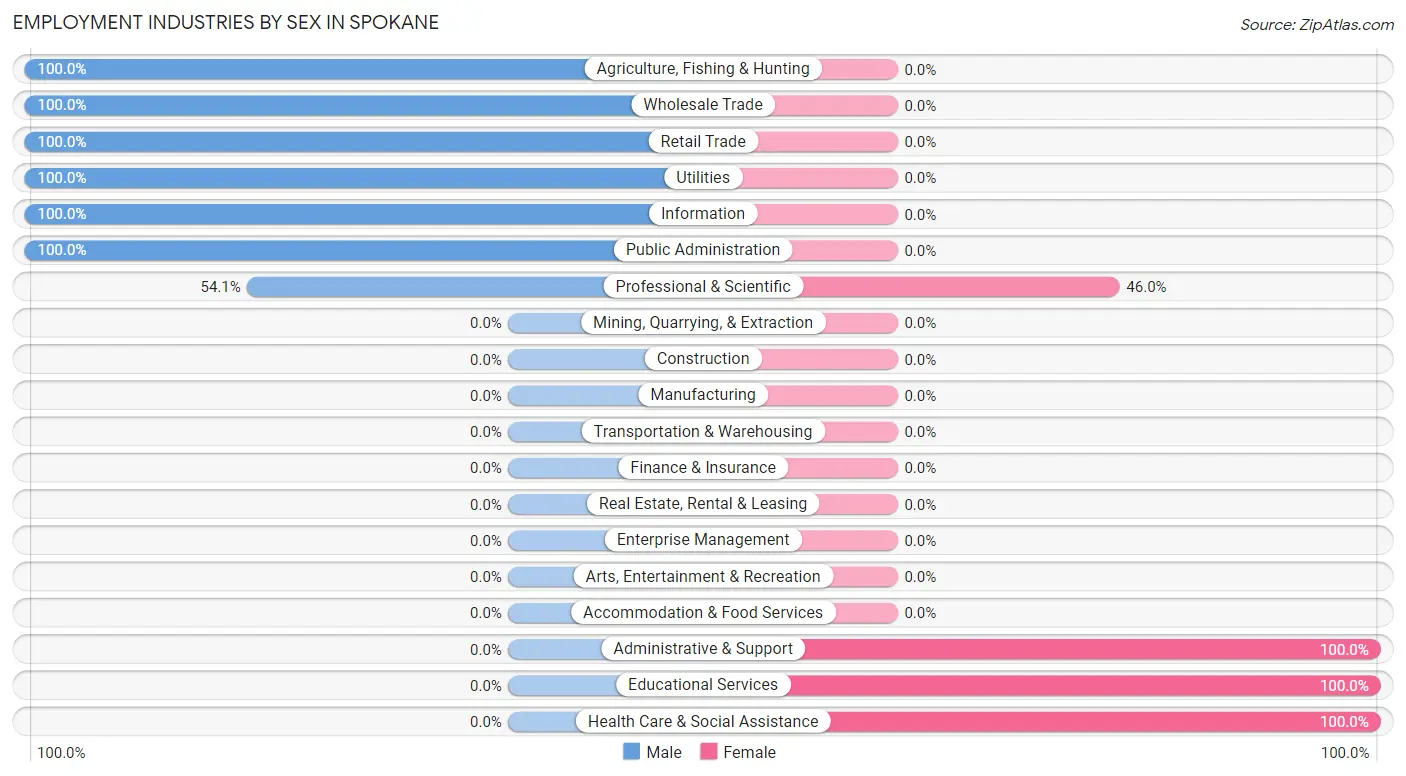
Employment Industries by Sex in Spokane
The Spokane industries that see more men than women are Agriculture, Fishing & Hunting (100.0%), Wholesale Trade (100.0%), and Retail Trade (100.0%), whereas the industries that tend to have a higher number of women are Administrative & Support (100.0%), Educational Services (100.0%), and Health Care & Social Assistance (100.0%).
| Industry | Male | Female |
| Agriculture, Fishing & Hunting | 7 (100.0%) | 0 (0.0%) |
| Mining, Quarrying, & Extraction | 0 (0.0%) | 0 (0.0%) |
| Construction | 0 (0.0%) | 0 (0.0%) |
| Manufacturing | 0 (0.0%) | 0 (0.0%) |
| Wholesale Trade | 21 (100.0%) | 0 (0.0%) |
| Retail Trade | 8 (100.0%) | 0 (0.0%) |
| Transportation & Warehousing | 0 (0.0%) | 0 (0.0%) |
| Utilities | 23 (100.0%) | 0 (0.0%) |
| Information | 25 (100.0%) | 0 (0.0%) |
| Finance & Insurance | 0 (0.0%) | 0 (0.0%) |
| Real Estate, Rental & Leasing | 0 (0.0%) | 0 (0.0%) |
| Professional & Scientific | 20 (54.0%) | 17 (46.0%) |
| Enterprise Management | 0 (0.0%) | 0 (0.0%) |
| Administrative & Support | 0 (0.0%) | 22 (100.0%) |
| Educational Services | 0 (0.0%) | 20 (100.0%) |
| Health Care & Social Assistance | 0 (0.0%) | 61 (100.0%) |
| Arts, Entertainment & Recreation | 0 (0.0%) | 0 (0.0%) |
| Accommodation & Food Services | 0 (0.0%) | 0 (0.0%) |
| Public Administration | 7 (100.0%) | 0 (0.0%) |
| Total | 111 (48.0%) | 120 (51.9%) |
Education in Spokane
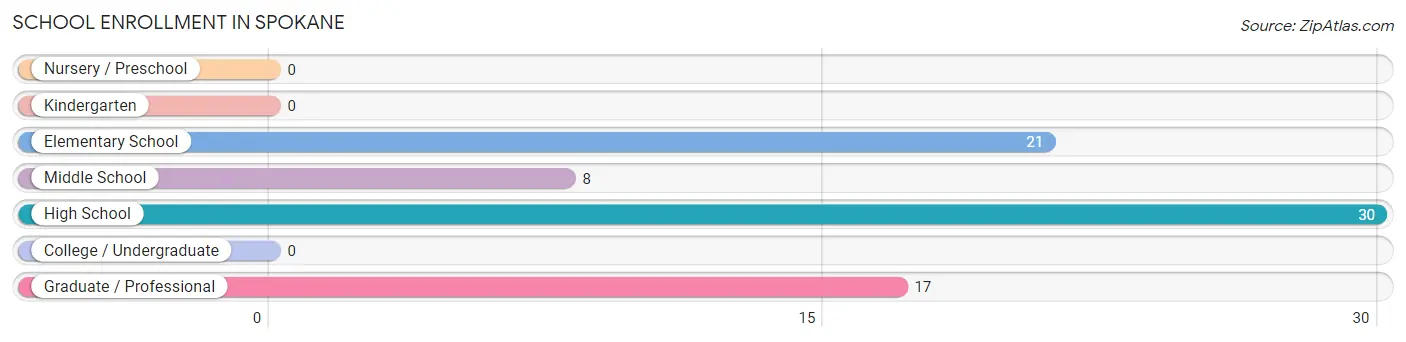
School Enrollment in Spokane
The most common levels of schooling among the 76 students in Spokane are high school (30 | 39.5%), elementary school (21 | 27.6%), and graduate / professional (17 | 22.4%).
| School Level | # Students | % Students |
| Nursery / Preschool | 0 | 0.0% |
| Kindergarten | 0 | 0.0% |
| Elementary School | 21 | 27.6% |
| Middle School | 8 | 10.5% |
| High School | 30 | 39.5% |
| College / Undergraduate | 0 | 0.0% |
| Graduate / Professional | 17 | 22.4% |
| Total | 76 | 100.0% |
School Enrollment by Age by Funding Source in Spokane
Out of a total of 76 students who are enrolled in schools in Spokane, 12 (15.8%) attend a private institution, while the remaining 64 (84.2%) are enrolled in public schools. The age group of 10 to 14 year olds has the highest likelihood of being enrolled in private schools, with 8 (100.0% in the age bracket) enrolled. Conversely, the age group of 18 to 19 year olds has the lowest likelihood of being enrolled in a private school, with 30 (100.0% in the age bracket) attending a public institution.
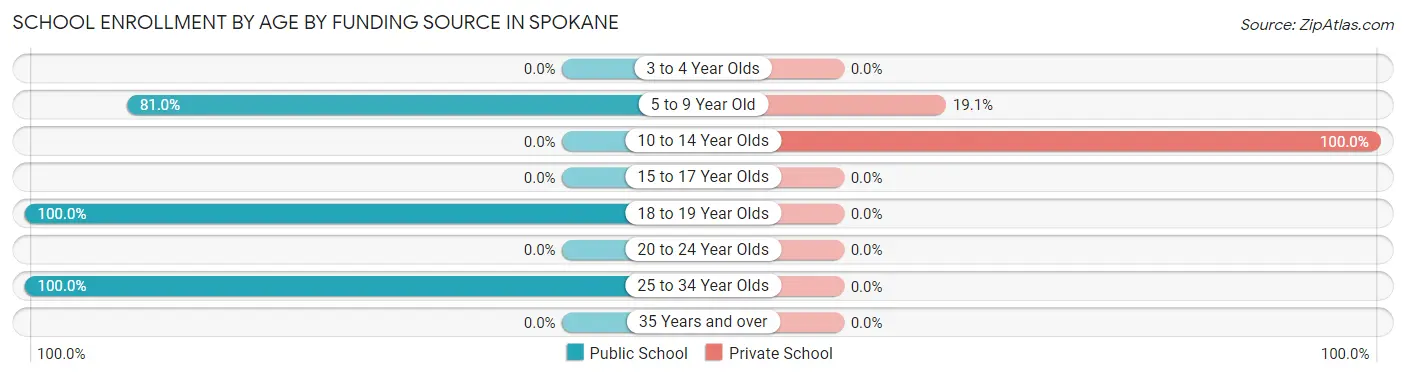
| Age Bracket | Public School | Private School |
| 3 to 4 Year Olds | 0 (0.0%) | 0 (0.0%) |
| 5 to 9 Year Old | 17 (80.9%) | 4 (19.1%) |
| 10 to 14 Year Olds | 0 (0.0%) | 8 (100.0%) |
| 15 to 17 Year Olds | 0 (0.0%) | 0 (0.0%) |
| 18 to 19 Year Olds | 30 (100.0%) | 0 (0.0%) |
| 20 to 24 Year Olds | 0 (0.0%) | 0 (0.0%) |
| 25 to 34 Year Olds | 17 (100.0%) | 0 (0.0%) |
| 35 Years and over | 0 (0.0%) | 0 (0.0%) |
| Total | 64 (84.2%) | 12 (15.8%) |
Educational Attainment by Field of Study in Spokane
Business (67 | 62.6%), education (16 | 14.9%), science & technology (15 | 14.0%), and arts & humanities (9 | 8.4%) are the most common fields of study among 107 individuals in Spokane who have obtained a bachelor's degree or higher.
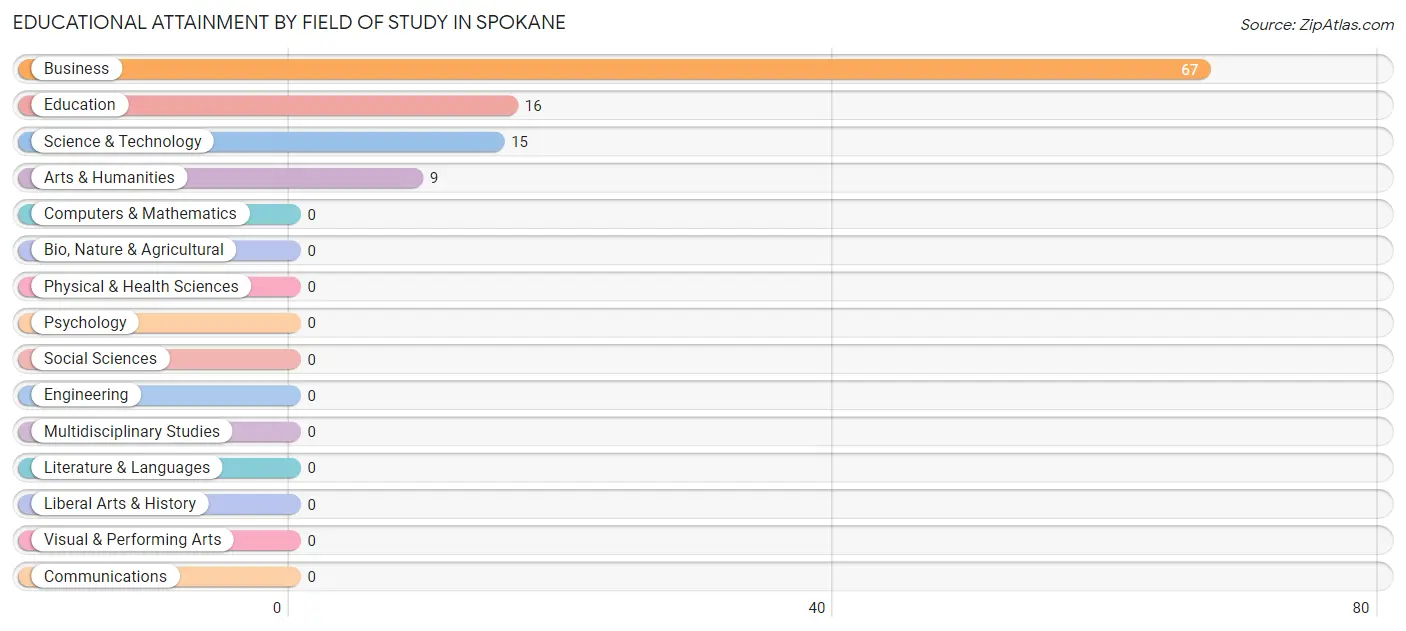
| Field of Study | # Graduates | % Graduates |
| Computers & Mathematics | 0 | 0.0% |
| Bio, Nature & Agricultural | 0 | 0.0% |
| Physical & Health Sciences | 0 | 0.0% |
| Psychology | 0 | 0.0% |
| Social Sciences | 0 | 0.0% |
| Engineering | 0 | 0.0% |
| Multidisciplinary Studies | 0 | 0.0% |
| Science & Technology | 15 | 14.0% |
| Business | 67 | 62.6% |
| Education | 16 | 14.9% |
| Literature & Languages | 0 | 0.0% |
| Liberal Arts & History | 0 | 0.0% |
| Visual & Performing Arts | 0 | 0.0% |
| Communications | 0 | 0.0% |
| Arts & Humanities | 9 | 8.4% |
| Total | 107 | 100.0% |
Transportation & Commute in Spokane
Vehicle Availability by Sex in Spokane
The most prevalent vehicle ownership categories in Spokane are males with 3 vehicles (55, accounting for 49.5%) and females with 3 vehicles (52, making up 45.8%).
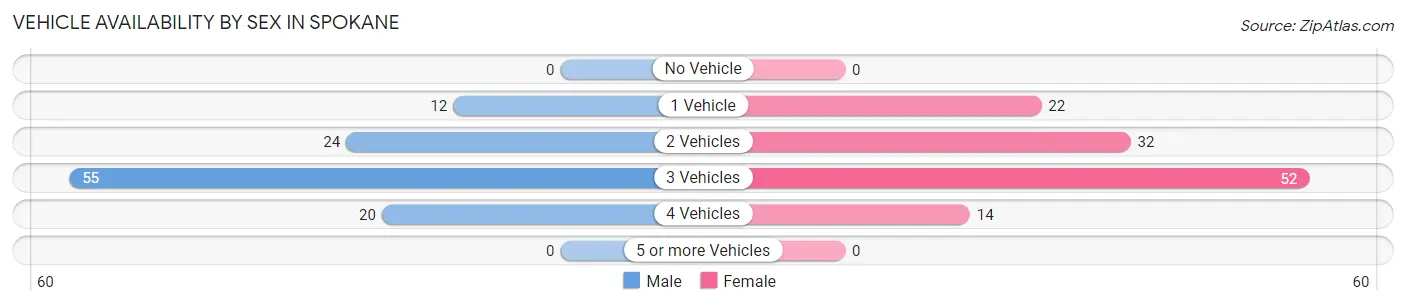
| Vehicles Available | Male | Female |
| No Vehicle | 0 (0.0%) | 0 (0.0%) |
| 1 Vehicle | 12 (10.8%) | 22 (18.3%) |
| 2 Vehicles | 24 (21.6%) | 32 (26.7%) |
| 3 Vehicles | 55 (49.5%) | 52 (43.3%) |
| 4 Vehicles | 20 (18.0%) | 14 (11.7%) |
| 5 or more Vehicles | 0 (0.0%) | 0 (0.0%) |
| Total | 111 (100.0%) | 120 (100.0%) |
Commute Time in Spokane
The most frequently occuring commute durations in Spokane are 40 to 44 minutes (78 commuters, 37.7%), 35 to 39 minutes (46 commuters, 22.2%), and 20 to 24 minutes (29 commuters, 14.0%).
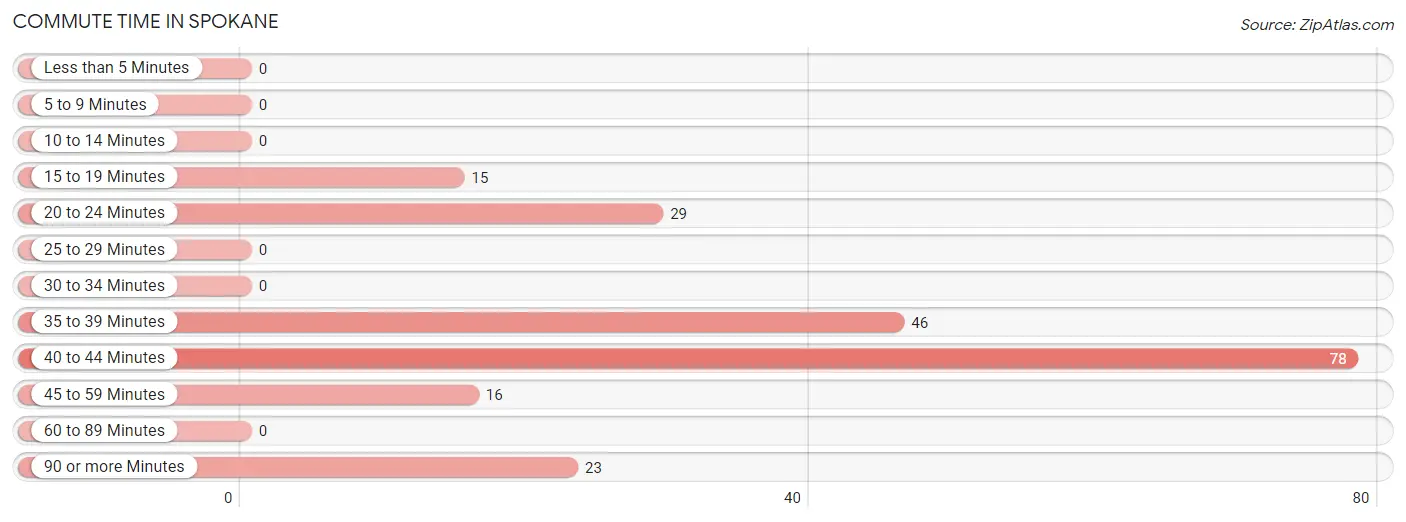
| Commute Time | # Commuters | % Commuters |
| Less than 5 Minutes | 0 | 0.0% |
| 5 to 9 Minutes | 0 | 0.0% |
| 10 to 14 Minutes | 0 | 0.0% |
| 15 to 19 Minutes | 15 | 7.2% |
| 20 to 24 Minutes | 29 | 14.0% |
| 25 to 29 Minutes | 0 | 0.0% |
| 30 to 34 Minutes | 0 | 0.0% |
| 35 to 39 Minutes | 46 | 22.2% |
| 40 to 44 Minutes | 78 | 37.7% |
| 45 to 59 Minutes | 16 | 7.7% |
| 60 to 89 Minutes | 0 | 0.0% |
| 90 or more Minutes | 23 | 11.1% |
Commute Time by Sex in Spokane
The most common commute times in Spokane are 35 to 39 minutes (25 commuters, 22.5%) for males and 40 to 44 minutes (53 commuters, 55.2%) for females.
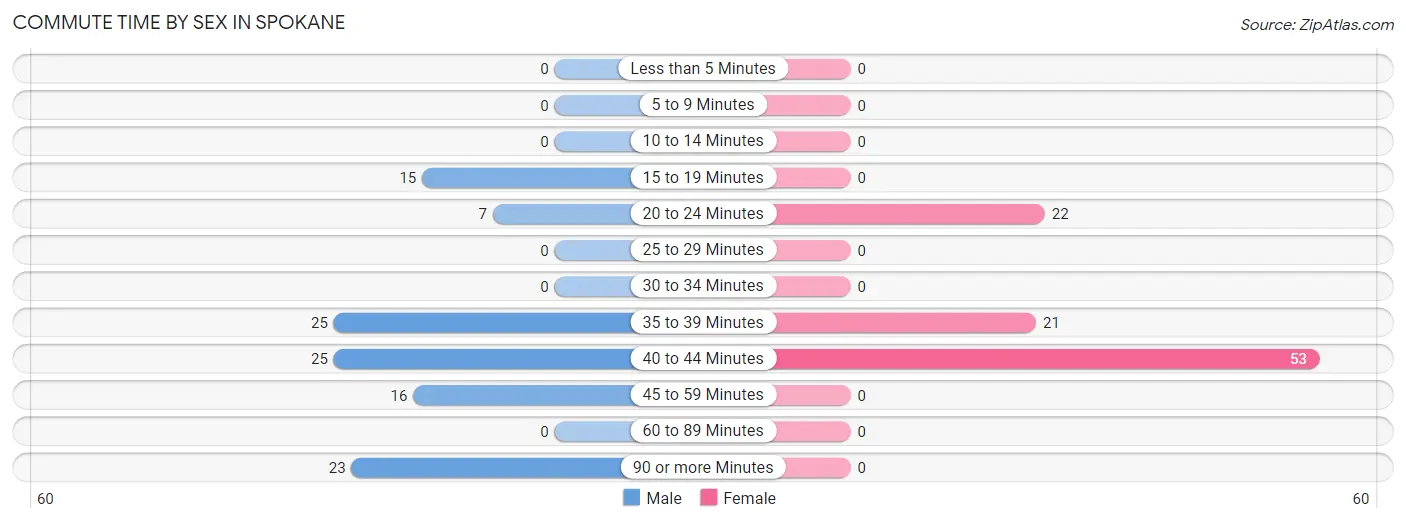
| Commute Time | Male | Female |
| Less than 5 Minutes | 0 (0.0%) | 0 (0.0%) |
| 5 to 9 Minutes | 0 (0.0%) | 0 (0.0%) |
| 10 to 14 Minutes | 0 (0.0%) | 0 (0.0%) |
| 15 to 19 Minutes | 15 (13.5%) | 0 (0.0%) |
| 20 to 24 Minutes | 7 (6.3%) | 22 (22.9%) |
| 25 to 29 Minutes | 0 (0.0%) | 0 (0.0%) |
| 30 to 34 Minutes | 0 (0.0%) | 0 (0.0%) |
| 35 to 39 Minutes | 25 (22.5%) | 21 (21.9%) |
| 40 to 44 Minutes | 25 (22.5%) | 53 (55.2%) |
| 45 to 59 Minutes | 16 (14.4%) | 0 (0.0%) |
| 60 to 89 Minutes | 0 (0.0%) | 0 (0.0%) |
| 90 or more Minutes | 23 (20.7%) | 0 (0.0%) |
Time of Departure to Work by Sex in Spokane
The most frequent times of departure to work in Spokane are 7:00 AM to 7:29 AM (41, 36.9%) for males and 8:00 AM to 8:29 AM (31, 32.3%) for females.
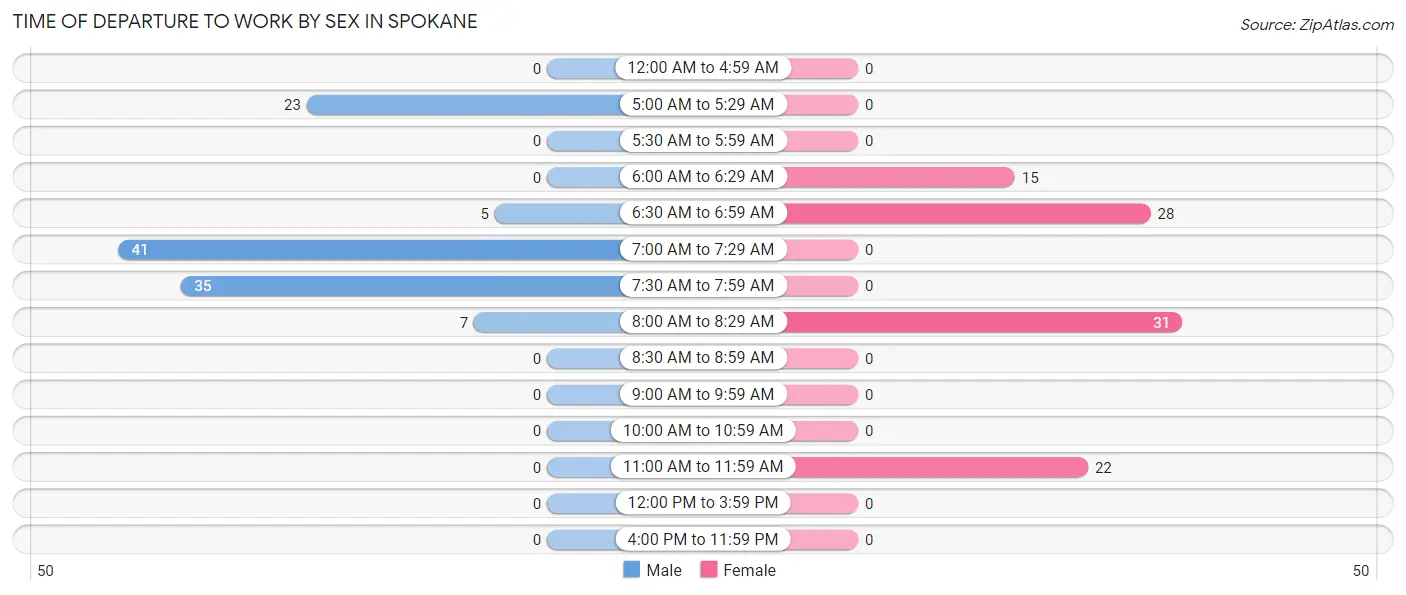
| Time of Departure | Male | Female |
| 12:00 AM to 4:59 AM | 0 (0.0%) | 0 (0.0%) |
| 5:00 AM to 5:29 AM | 23 (20.7%) | 0 (0.0%) |
| 5:30 AM to 5:59 AM | 0 (0.0%) | 0 (0.0%) |
| 6:00 AM to 6:29 AM | 0 (0.0%) | 15 (15.6%) |
| 6:30 AM to 6:59 AM | 5 (4.5%) | 28 (29.2%) |
| 7:00 AM to 7:29 AM | 41 (36.9%) | 0 (0.0%) |
| 7:30 AM to 7:59 AM | 35 (31.5%) | 0 (0.0%) |
| 8:00 AM to 8:29 AM | 7 (6.3%) | 31 (32.3%) |
| 8:30 AM to 8:59 AM | 0 (0.0%) | 0 (0.0%) |
| 9:00 AM to 9:59 AM | 0 (0.0%) | 0 (0.0%) |
| 10:00 AM to 10:59 AM | 0 (0.0%) | 0 (0.0%) |
| 11:00 AM to 11:59 AM | 0 (0.0%) | 22 (22.9%) |
| 12:00 PM to 3:59 PM | 0 (0.0%) | 0 (0.0%) |
| 4:00 PM to 11:59 PM | 0 (0.0%) | 0 (0.0%) |
| Total | 111 (100.0%) | 96 (100.0%) |
Housing Occupancy in Spokane
Occupancy by Ownership in Spokane
Of the total 187 dwellings in Spokane, owner-occupied units account for 175 (93.6%), while renter-occupied units make up 12 (6.4%).
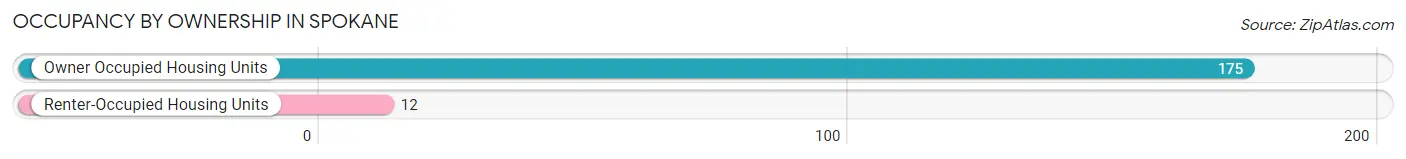
| Occupancy | # Housing Units | % Housing Units |
| Owner Occupied Housing Units | 175 | 93.6% |
| Renter-Occupied Housing Units | 12 | 6.4% |
| Total Occupied Housing Units | 187 | 100.0% |
Occupancy by Household Size in Spokane
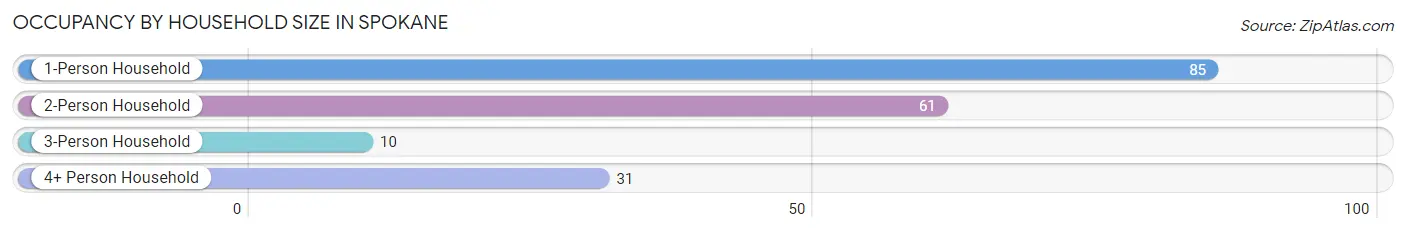
| Household Size | # Housing Units | % Housing Units |
| 1-Person Household | 85 | 45.5% |
| 2-Person Household | 61 | 32.6% |
| 3-Person Household | 10 | 5.3% |
| 4+ Person Household | 31 | 16.6% |
| Total Housing Units | 187 | 100.0% |
Occupancy by Ownership by Household Size in Spokane
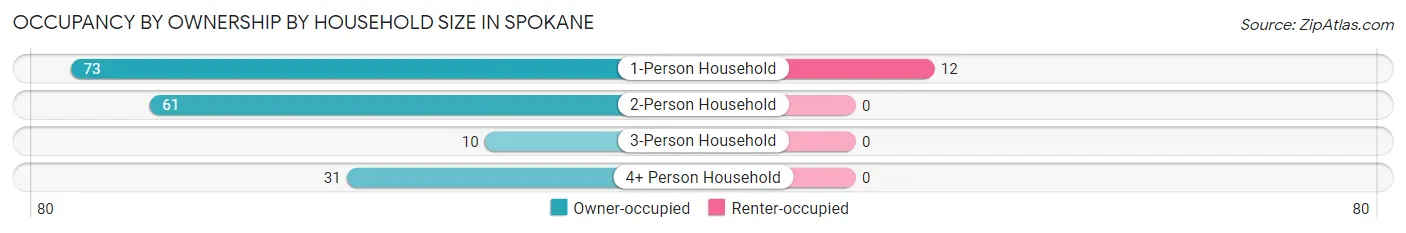
| Household Size | Owner-occupied | Renter-occupied |
| 1-Person Household | 73 (85.9%) | 12 (14.1%) |
| 2-Person Household | 61 (100.0%) | 0 (0.0%) |
| 3-Person Household | 10 (100.0%) | 0 (0.0%) |
| 4+ Person Household | 31 (100.0%) | 0 (0.0%) |
| Total Housing Units | 175 (93.6%) | 12 (6.4%) |
Occupancy by Educational Attainment in Spokane
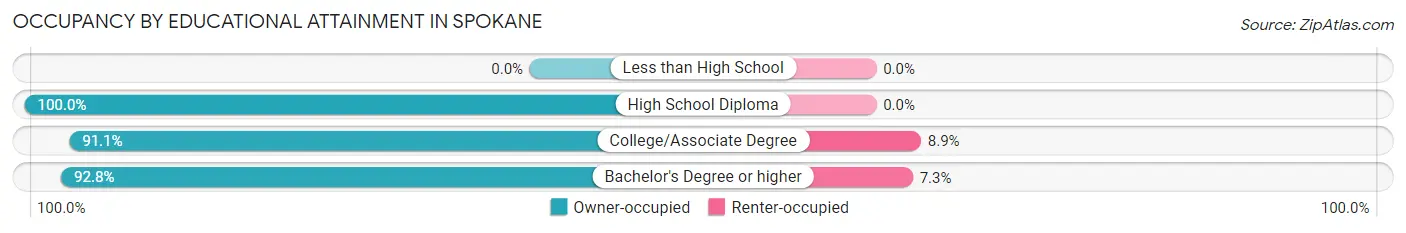
| Household Size | Owner-occupied | Renter-occupied |
| Less than High School | 0 (0.0%) | 0 (0.0%) |
| High School Diploma | 39 (100.0%) | 0 (0.0%) |
| College/Associate Degree | 72 (91.1%) | 7 (8.9%) |
| Bachelor's Degree or higher | 64 (92.7%) | 5 (7.2%) |
Occupancy by Age of Householder in Spokane
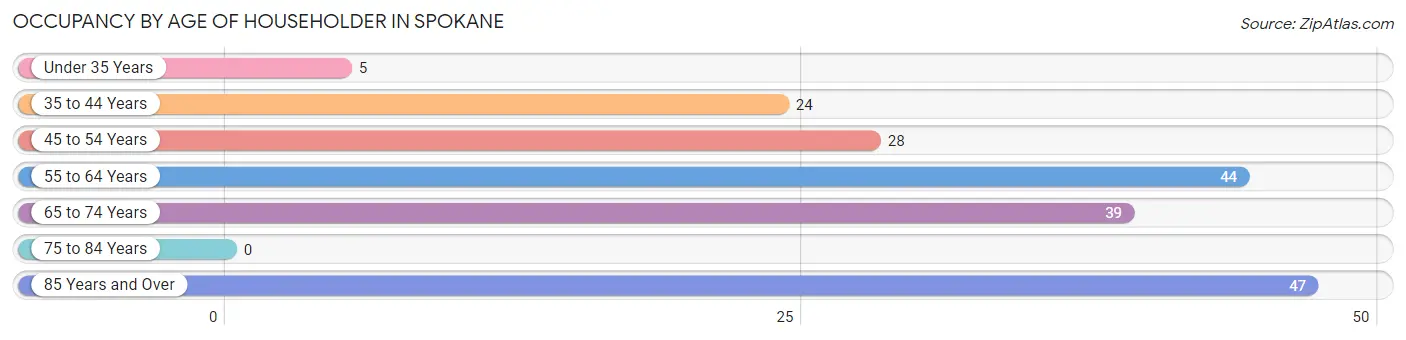
| Age Bracket | # Households | % Households |
| Under 35 Years | 5 | 2.7% |
| 35 to 44 Years | 24 | 12.8% |
| 45 to 54 Years | 28 | 15.0% |
| 55 to 64 Years | 44 | 23.5% |
| 65 to 74 Years | 39 | 20.9% |
| 75 to 84 Years | 0 | 0.0% |
| 85 Years and Over | 47 | 25.1% |
| Total | 187 | 100.0% |
Housing Finances in Spokane
Median Income by Occupancy in Spokane
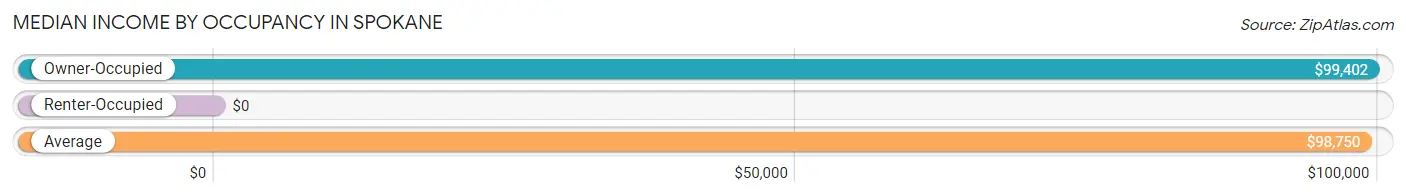
| Occupancy Type | # Households | Median Income |
| Owner-Occupied | 175 (93.6%) | $99,402 |
| Renter-Occupied | 12 (6.4%) | $0 |
| Average | 187 (100.0%) | $98,750 |
Occupancy by Householder Income Bracket in Spokane
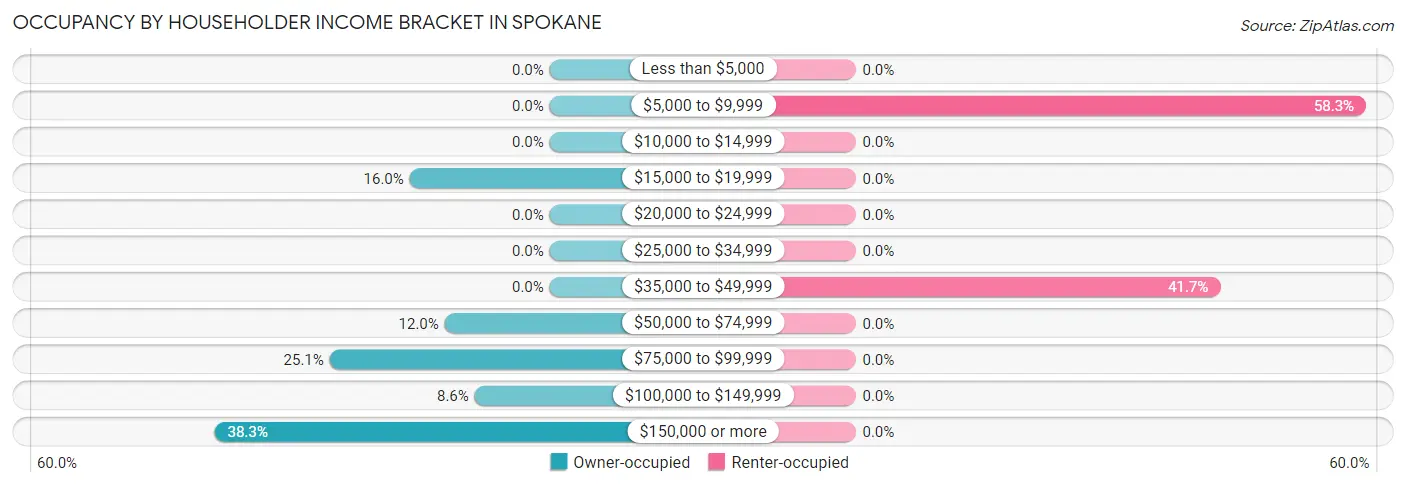
| Income Bracket | Owner-occupied | Renter-occupied |
| Less than $5,000 | 0 (0.0%) | 0 (0.0%) |
| $5,000 to $9,999 | 0 (0.0%) | 7 (58.3%) |
| $10,000 to $14,999 | 0 (0.0%) | 0 (0.0%) |
| $15,000 to $19,999 | 28 (16.0%) | 0 (0.0%) |
| $20,000 to $24,999 | 0 (0.0%) | 0 (0.0%) |
| $25,000 to $34,999 | 0 (0.0%) | 0 (0.0%) |
| $35,000 to $49,999 | 0 (0.0%) | 5 (41.7%) |
| $50,000 to $74,999 | 21 (12.0%) | 0 (0.0%) |
| $75,000 to $99,999 | 44 (25.1%) | 0 (0.0%) |
| $100,000 to $149,999 | 15 (8.6%) | 0 (0.0%) |
| $150,000 or more | 67 (38.3%) | 0 (0.0%) |
| Total | 175 (100.0%) | 12 (100.0%) |
Monthly Housing Cost Tiers in Spokane
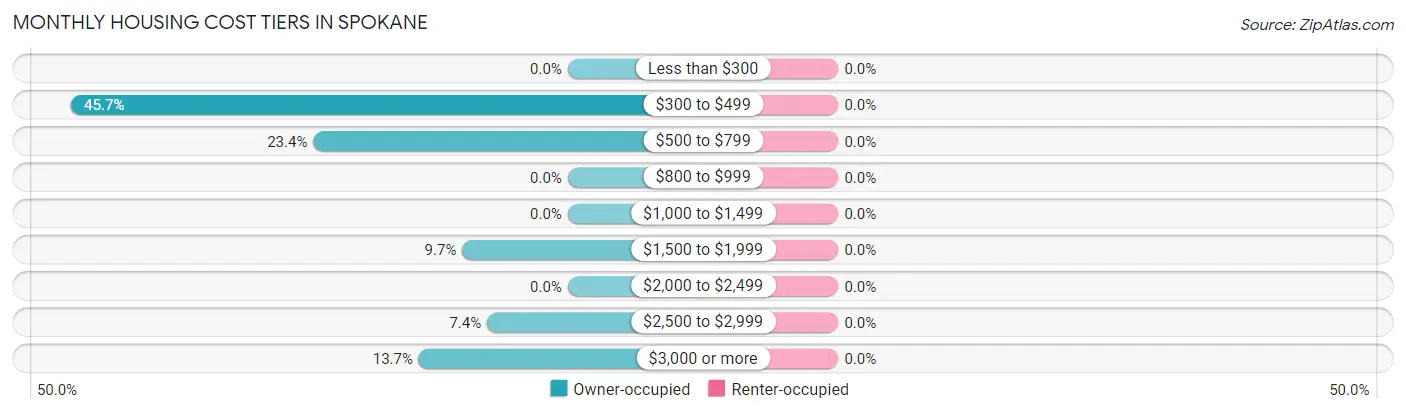
| Monthly Cost | Owner-occupied | Renter-occupied |
| Less than $300 | 0 (0.0%) | 0 (0.0%) |
| $300 to $499 | 80 (45.7%) | 0 (0.0%) |
| $500 to $799 | 41 (23.4%) | 0 (0.0%) |
| $800 to $999 | 0 (0.0%) | 0 (0.0%) |
| $1,000 to $1,499 | 0 (0.0%) | 0 (0.0%) |
| $1,500 to $1,999 | 17 (9.7%) | 0 (0.0%) |
| $2,000 to $2,499 | 0 (0.0%) | 0 (0.0%) |
| $2,500 to $2,999 | 13 (7.4%) | 0 (0.0%) |
| $3,000 or more | 24 (13.7%) | 0 (0.0%) |
| Total | 175 (100.0%) | 12 (100.0%) |
Physical Housing Characteristics in Spokane
Housing Structures in Spokane
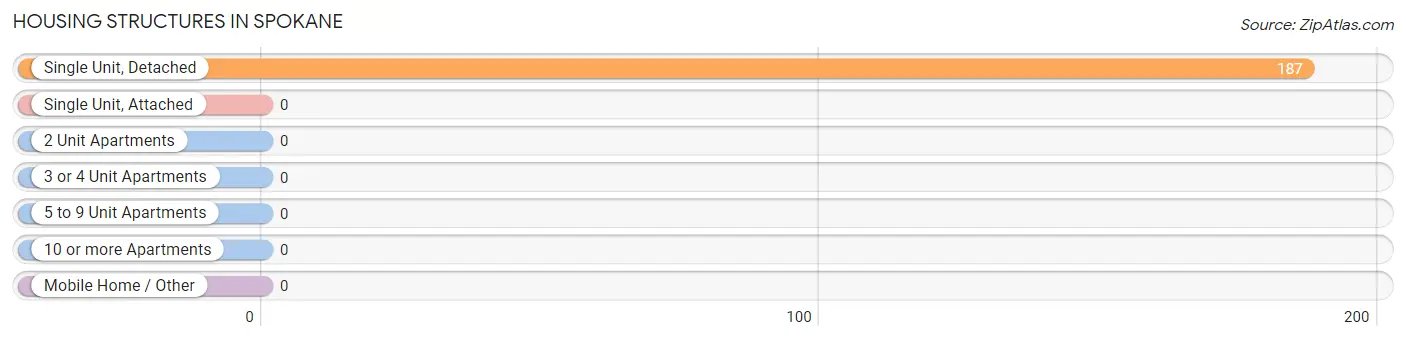
| Structure Type | # Housing Units | % Housing Units |
| Single Unit, Detached | 187 | 100.0% |
| Single Unit, Attached | 0 | 0.0% |
| 2 Unit Apartments | 0 | 0.0% |
| 3 or 4 Unit Apartments | 0 | 0.0% |
| 5 to 9 Unit Apartments | 0 | 0.0% |
| 10 or more Apartments | 0 | 0.0% |
| Mobile Home / Other | 0 | 0.0% |
| Total | 187 | 100.0% |
Housing Structures by Occupancy in Spokane
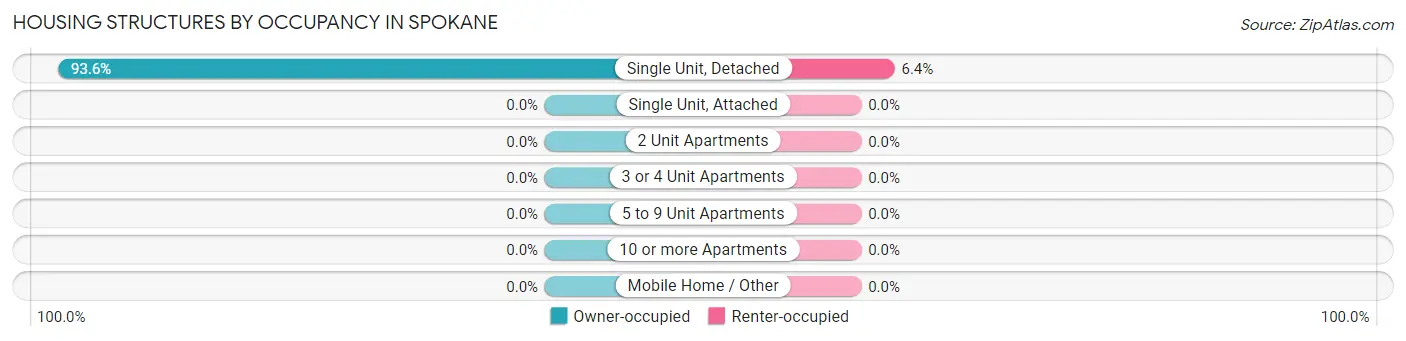
| Structure Type | Owner-occupied | Renter-occupied |
| Single Unit, Detached | 175 (93.6%) | 12 (6.4%) |
| Single Unit, Attached | 0 (0.0%) | 0 (0.0%) |
| 2 Unit Apartments | 0 (0.0%) | 0 (0.0%) |
| 3 or 4 Unit Apartments | 0 (0.0%) | 0 (0.0%) |
| 5 to 9 Unit Apartments | 0 (0.0%) | 0 (0.0%) |
| 10 or more Apartments | 0 (0.0%) | 0 (0.0%) |
| Mobile Home / Other | 0 (0.0%) | 0 (0.0%) |
| Total | 175 (93.6%) | 12 (6.4%) |
Housing Structures by Number of Rooms in Spokane
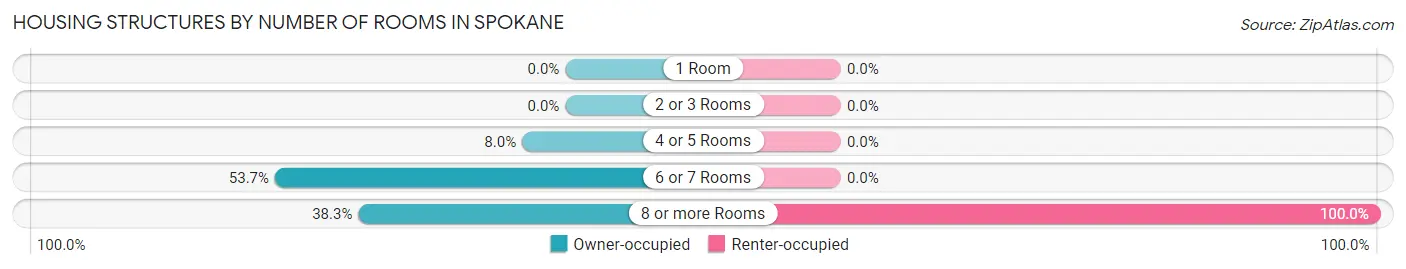
| Number of Rooms | Owner-occupied | Renter-occupied |
| 1 Room | 0 (0.0%) | 0 (0.0%) |
| 2 or 3 Rooms | 0 (0.0%) | 0 (0.0%) |
| 4 or 5 Rooms | 14 (8.0%) | 0 (0.0%) |
| 6 or 7 Rooms | 94 (53.7%) | 0 (0.0%) |
| 8 or more Rooms | 67 (38.3%) | 12 (100.0%) |
| Total | 175 (100.0%) | 12 (100.0%) |
Housing Structure by Heating Type in Spokane
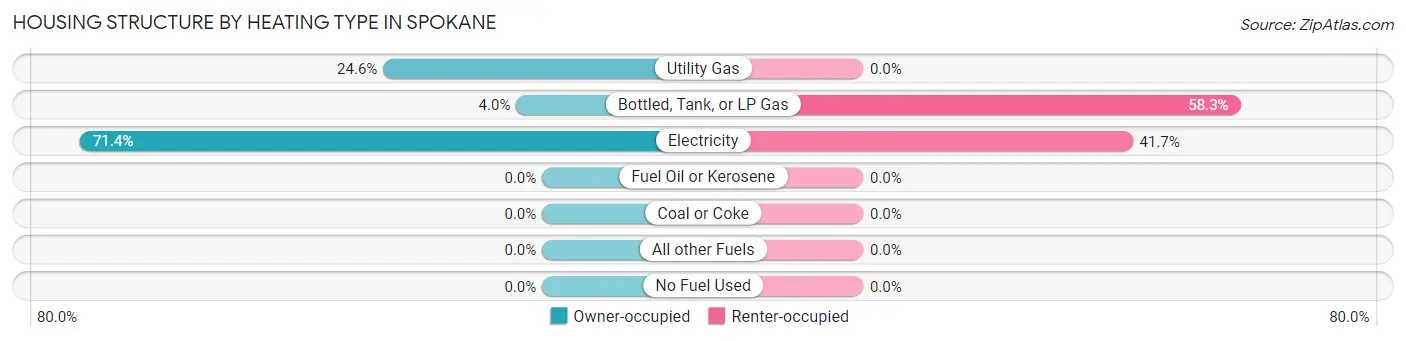
| Heating Type | Owner-occupied | Renter-occupied |
| Utility Gas | 43 (24.6%) | 0 (0.0%) |
| Bottled, Tank, or LP Gas | 7 (4.0%) | 7 (58.3%) |
| Electricity | 125 (71.4%) | 5 (41.7%) |
| Fuel Oil or Kerosene | 0 (0.0%) | 0 (0.0%) |
| Coal or Coke | 0 (0.0%) | 0 (0.0%) |
| All other Fuels | 0 (0.0%) | 0 (0.0%) |
| No Fuel Used | 0 (0.0%) | 0 (0.0%) |
| Total | 175 (100.0%) | 12 (100.0%) |
Household Vehicle Usage in Spokane
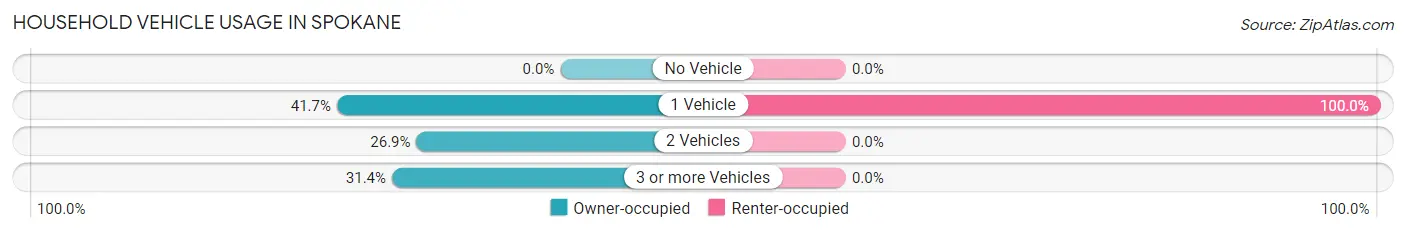
| Vehicles per Household | Owner-occupied | Renter-occupied |
| No Vehicle | 0 (0.0%) | 0 (0.0%) |
| 1 Vehicle | 73 (41.7%) | 12 (100.0%) |
| 2 Vehicles | 47 (26.9%) | 0 (0.0%) |
| 3 or more Vehicles | 55 (31.4%) | 0 (0.0%) |
| Total | 175 (100.0%) | 12 (100.0%) |
Real Estate & Mortgages in Spokane
Real Estate and Mortgage Overview in Spokane
| Characteristic | Without Mortgage | With Mortgage |
| Housing Units | 121 | 54 |
| Median Property Value | $296,600 | $525,000 |
| Median Household Income | $79,896 | $31 |
| Monthly Housing Costs | $463 | $24 |
| Real Estate Taxes | - | - |
Property Value by Mortgage Status in Spokane
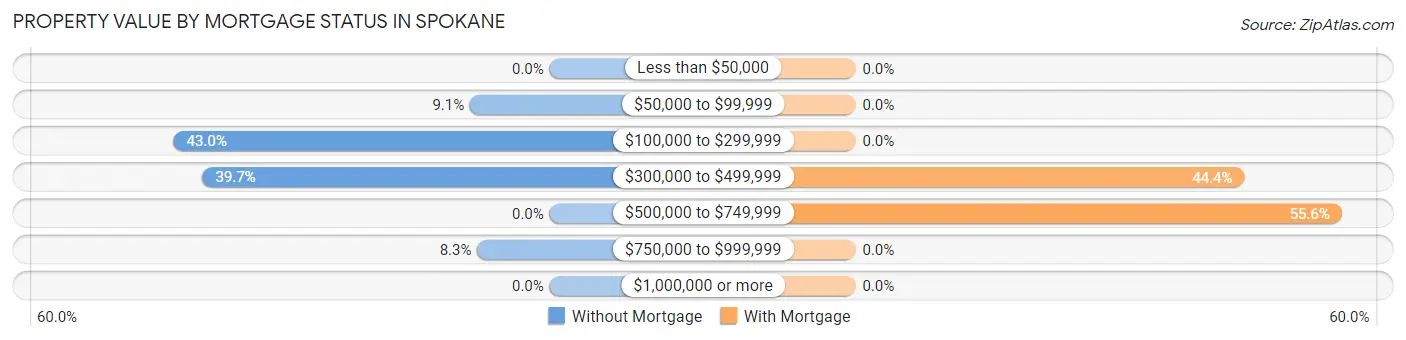
| Property Value | Without Mortgage | With Mortgage |
| Less than $50,000 | 0 (0.0%) | 0 (0.0%) |
| $50,000 to $99,999 | 11 (9.1%) | 0 (0.0%) |
| $100,000 to $299,999 | 52 (43.0%) | 0 (0.0%) |
| $300,000 to $499,999 | 48 (39.7%) | 24 (44.4%) |
| $500,000 to $749,999 | 0 (0.0%) | 30 (55.6%) |
| $750,000 to $999,999 | 10 (8.3%) | 0 (0.0%) |
| $1,000,000 or more | 0 (0.0%) | 0 (0.0%) |
| Total | 121 (100.0%) | 54 (100.0%) |
Household Income by Mortgage Status in Spokane
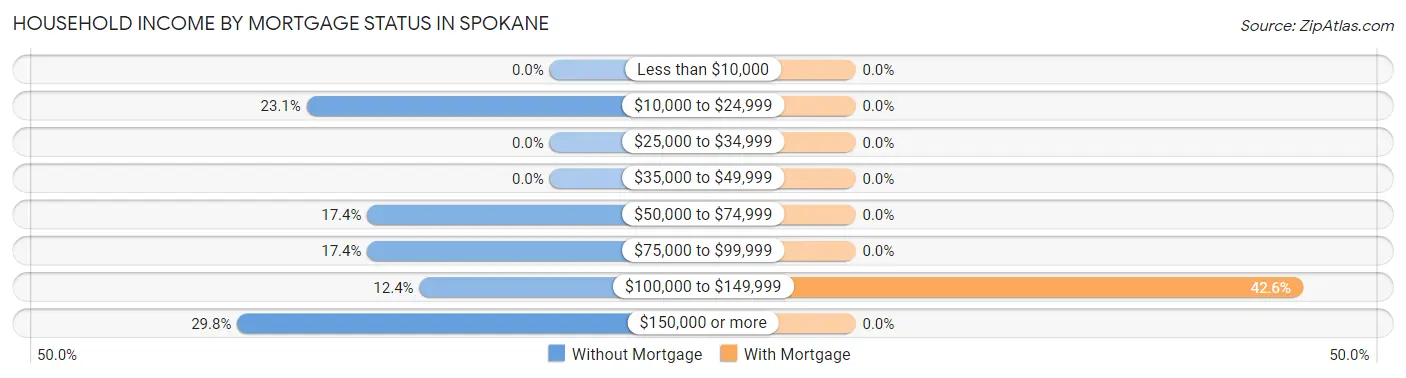
| Household Income | Without Mortgage | With Mortgage |
| Less than $10,000 | 0 (0.0%) | 0 (0.0%) |
| $10,000 to $24,999 | 28 (23.1%) | 0 (0.0%) |
| $25,000 to $34,999 | 0 (0.0%) | 0 (0.0%) |
| $35,000 to $49,999 | 0 (0.0%) | 0 (0.0%) |
| $50,000 to $74,999 | 21 (17.4%) | 0 (0.0%) |
| $75,000 to $99,999 | 21 (17.4%) | 0 (0.0%) |
| $100,000 to $149,999 | 15 (12.4%) | 23 (42.6%) |
| $150,000 or more | 36 (29.7%) | 0 (0.0%) |
| Total | 121 (100.0%) | 54 (100.0%) |
Property Value to Household Income Ratio in Spokane
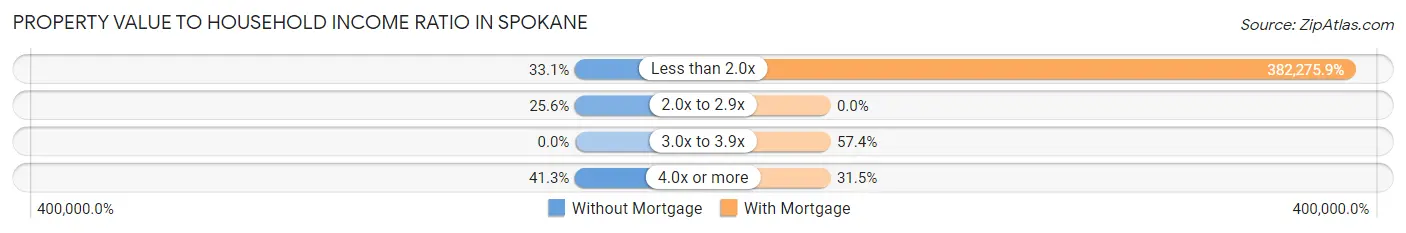
| Value-to-Income Ratio | Without Mortgage | With Mortgage |
| Less than 2.0x | 40 (33.1%) | 206,429 (382,275.9%) |
| 2.0x to 2.9x | 31 (25.6%) | 0 (0.0%) |
| 3.0x to 3.9x | 0 (0.0%) | 31 (57.4%) |
| 4.0x or more | 50 (41.3%) | 17 (31.5%) |
| Total | 121 (100.0%) | 54 (100.0%) |
Real Estate Taxes by Mortgage Status in Spokane
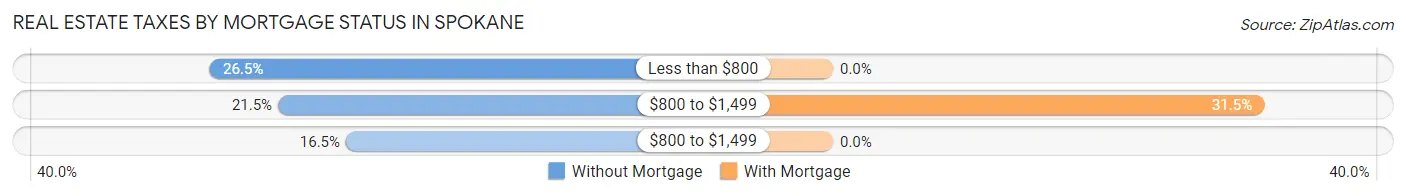
| Property Taxes | Without Mortgage | With Mortgage |
| Less than $800 | 32 (26.5%) | 0 (0.0%) |
| $800 to $1,499 | 26 (21.5%) | 17 (31.5%) |
| $800 to $1,499 | 20 (16.5%) | 0 (0.0%) |
| Total | 121 (100.0%) | 54 (100.0%) |
Health & Disability in Spokane
Health Insurance Coverage by Age in Spokane
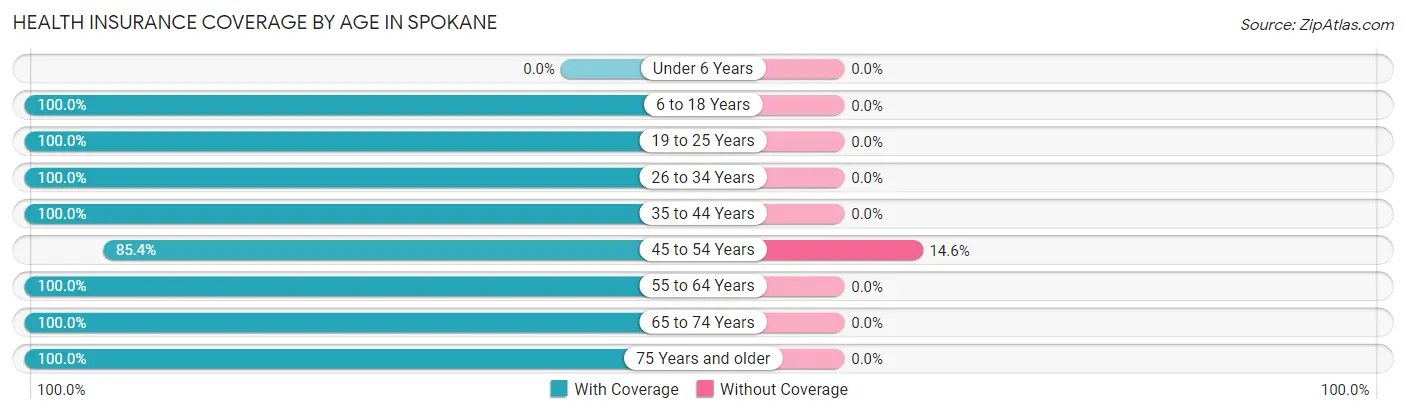
| Age Bracket | With Coverage | Without Coverage |
| Under 6 Years | 0 (0.0%) | 0 (0.0%) |
| 6 to 18 Years | 59 (100.0%) | 0 (0.0%) |
| 19 to 25 Years | 5 (100.0%) | 0 (0.0%) |
| 26 to 34 Years | 42 (100.0%) | 0 (0.0%) |
| 35 to 44 Years | 53 (100.0%) | 0 (0.0%) |
| 45 to 54 Years | 41 (85.4%) | 7 (14.6%) |
| 55 to 64 Years | 82 (100.0%) | 0 (0.0%) |
| 65 to 74 Years | 128 (100.0%) | 0 (0.0%) |
| 75 Years and older | 54 (100.0%) | 0 (0.0%) |
| Total | 464 (98.5%) | 7 (1.5%) |
Health Insurance Coverage by Citizenship Status in Spokane
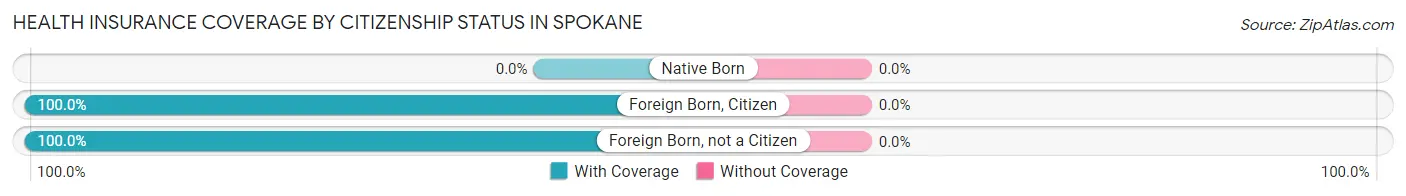
| Citizenship Status | With Coverage | Without Coverage |
| Native Born | 0 (0.0%) | 0 (0.0%) |
| Foreign Born, Citizen | 59 (100.0%) | 0 (0.0%) |
| Foreign Born, not a Citizen | 5 (100.0%) | 0 (0.0%) |
Health Insurance Coverage by Household Income in Spokane
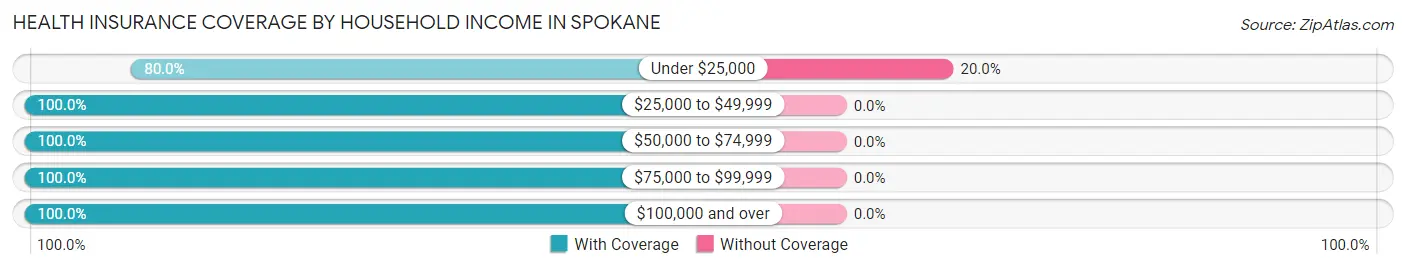
| Household Income | With Coverage | Without Coverage |
| Under $25,000 | 28 (80.0%) | 7 (20.0%) |
| $25,000 to $49,999 | 5 (100.0%) | 0 (0.0%) |
| $50,000 to $74,999 | 68 (100.0%) | 0 (0.0%) |
| $75,000 to $99,999 | 75 (100.0%) | 0 (0.0%) |
| $100,000 and over | 288 (100.0%) | 0 (0.0%) |
Public vs Private Health Insurance Coverage by Age in Spokane
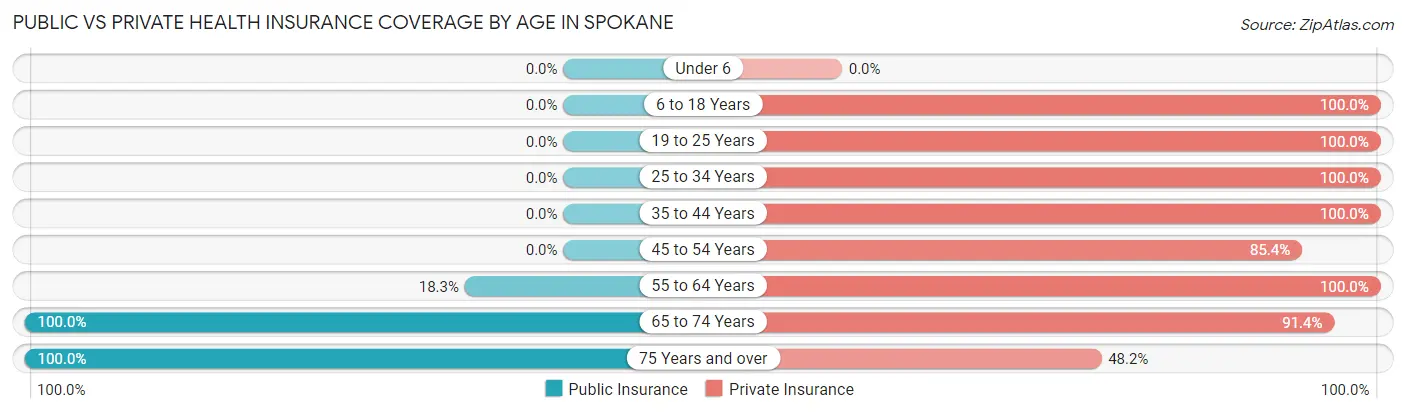
| Age Bracket | Public Insurance | Private Insurance |
| Under 6 | 0 (0.0%) | 0 (0.0%) |
| 6 to 18 Years | 0 (0.0%) | 59 (100.0%) |
| 19 to 25 Years | 0 (0.0%) | 5 (100.0%) |
| 25 to 34 Years | 0 (0.0%) | 42 (100.0%) |
| 35 to 44 Years | 0 (0.0%) | 53 (100.0%) |
| 45 to 54 Years | 0 (0.0%) | 41 (85.4%) |
| 55 to 64 Years | 15 (18.3%) | 82 (100.0%) |
| 65 to 74 Years | 128 (100.0%) | 117 (91.4%) |
| 75 Years and over | 54 (100.0%) | 26 (48.1%) |
| Total | 197 (41.8%) | 425 (90.2%) |
Disability Status by Sex by Age in Spokane
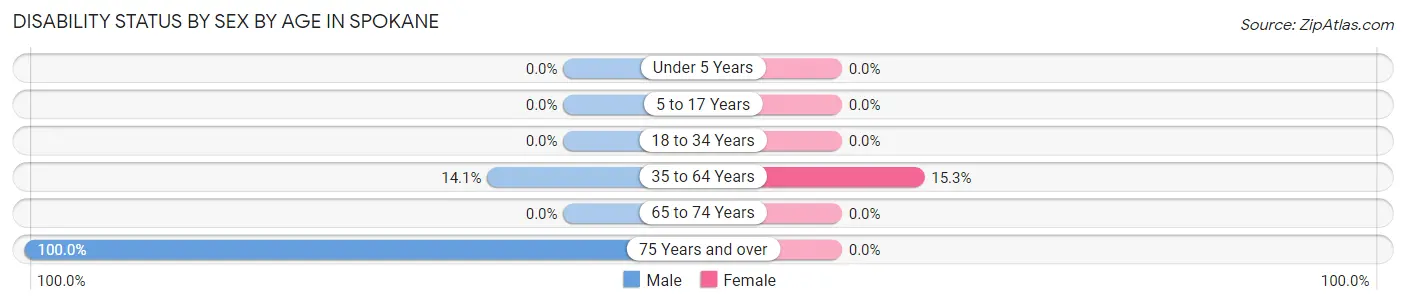
| Age Bracket | Male | Female |
| Under 5 Years | 0 (0.0%) | 0 (0.0%) |
| 5 to 17 Years | 0 (0.0%) | 0 (0.0%) |
| 18 to 34 Years | 0 (0.0%) | 0 (0.0%) |
| 35 to 64 Years | 12 (14.1%) | 15 (15.3%) |
| 65 to 74 Years | 0 (0.0%) | 0 (0.0%) |
| 75 Years and over | 9 (100.0%) | 0 (0.0%) |
Disability Class by Sex by Age in Spokane
Disability Class: Hearing Difficulty
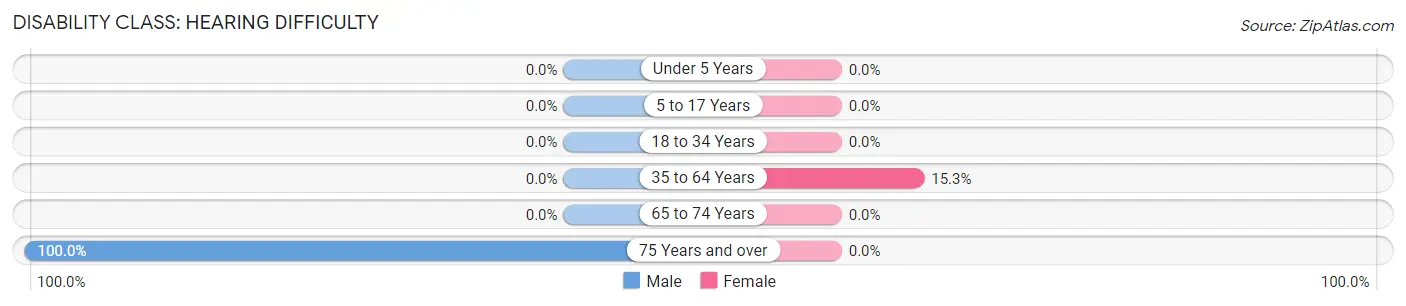
| Age Bracket | Male | Female |
| Under 5 Years | 0 (0.0%) | 0 (0.0%) |
| 5 to 17 Years | 0 (0.0%) | 0 (0.0%) |
| 18 to 34 Years | 0 (0.0%) | 0 (0.0%) |
| 35 to 64 Years | 0 (0.0%) | 15 (15.3%) |
| 65 to 74 Years | 0 (0.0%) | 0 (0.0%) |
| 75 Years and over | 9 (100.0%) | 0 (0.0%) |
Disability Class: Vision Difficulty
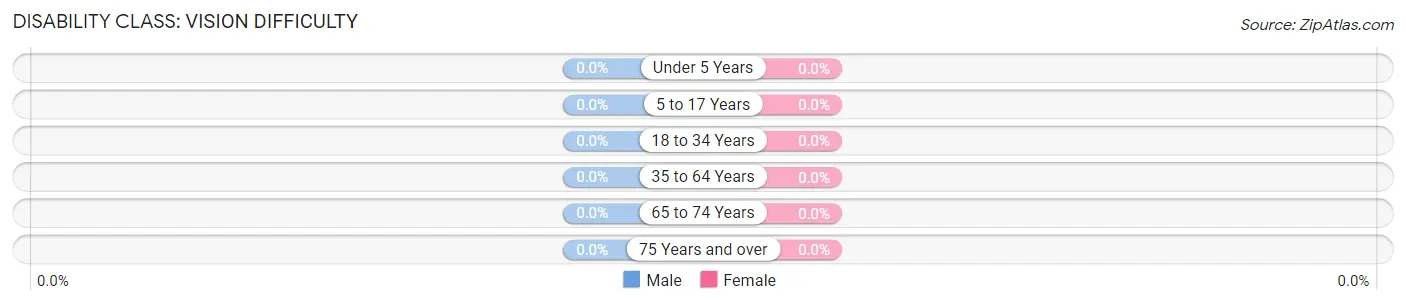
| Age Bracket | Male | Female |
| Under 5 Years | 0 (0.0%) | 0 (0.0%) |
| 5 to 17 Years | 0 (0.0%) | 0 (0.0%) |
| 18 to 34 Years | 0 (0.0%) | 0 (0.0%) |
| 35 to 64 Years | 0 (0.0%) | 0 (0.0%) |
| 65 to 74 Years | 0 (0.0%) | 0 (0.0%) |
| 75 Years and over | 0 (0.0%) | 0 (0.0%) |
Disability Class: Cognitive Difficulty
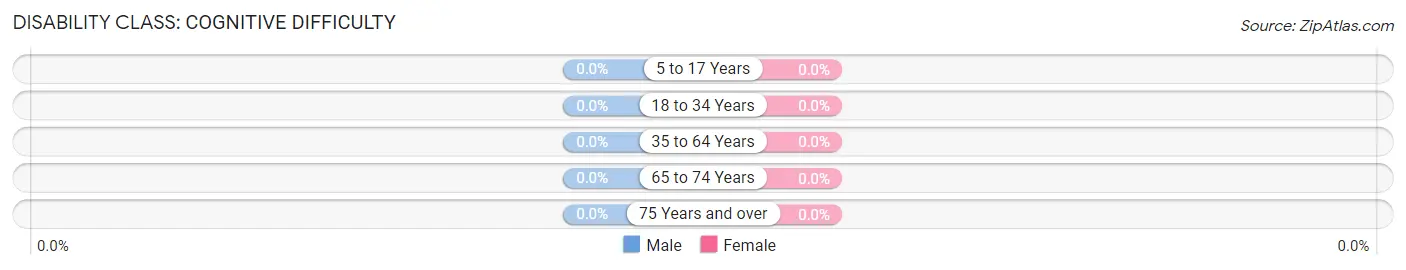
| Age Bracket | Male | Female |
| 5 to 17 Years | 0 (0.0%) | 0 (0.0%) |
| 18 to 34 Years | 0 (0.0%) | 0 (0.0%) |
| 35 to 64 Years | 0 (0.0%) | 0 (0.0%) |
| 65 to 74 Years | 0 (0.0%) | 0 (0.0%) |
| 75 Years and over | 0 (0.0%) | 0 (0.0%) |
Disability Class: Ambulatory Difficulty
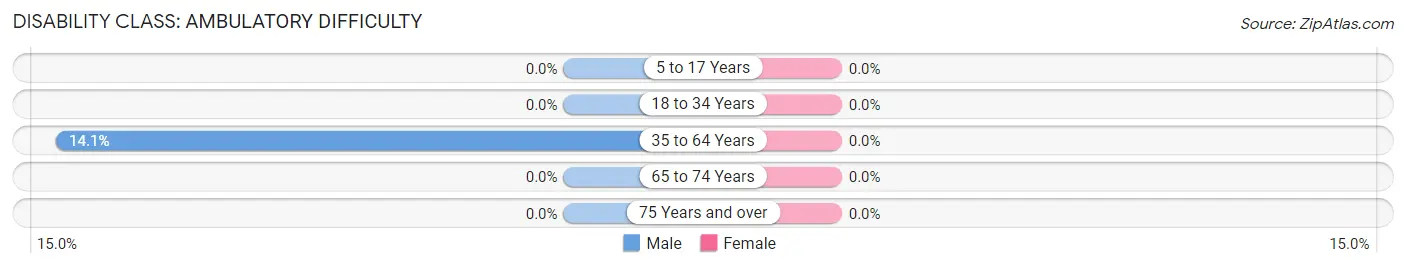
| Age Bracket | Male | Female |
| 5 to 17 Years | 0 (0.0%) | 0 (0.0%) |
| 18 to 34 Years | 0 (0.0%) | 0 (0.0%) |
| 35 to 64 Years | 12 (14.1%) | 0 (0.0%) |
| 65 to 74 Years | 0 (0.0%) | 0 (0.0%) |
| 75 Years and over | 0 (0.0%) | 0 (0.0%) |
Disability Class: Self-Care Difficulty
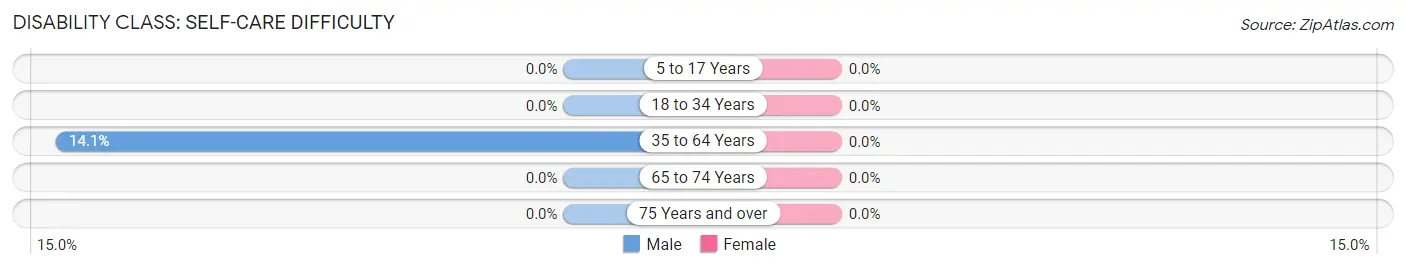
| Age Bracket | Male | Female |
| 5 to 17 Years | 0 (0.0%) | 0 (0.0%) |
| 18 to 34 Years | 0 (0.0%) | 0 (0.0%) |
| 35 to 64 Years | 12 (14.1%) | 0 (0.0%) |
| 65 to 74 Years | 0 (0.0%) | 0 (0.0%) |
| 75 Years and over | 0 (0.0%) | 0 (0.0%) |
Technology Access in Spokane
Computing Device Access in Spokane
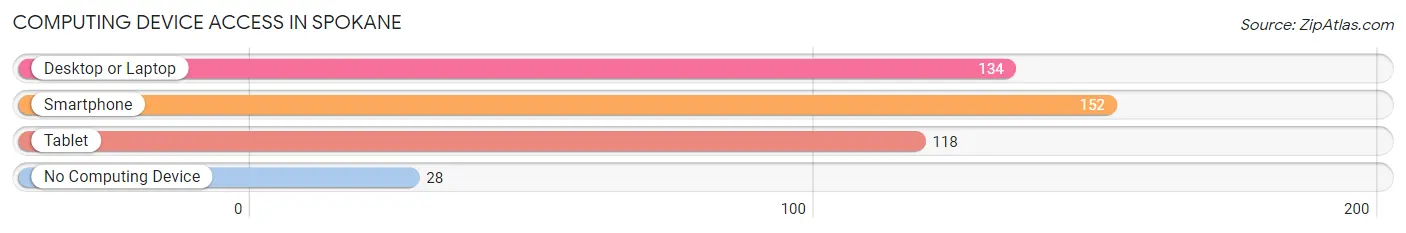
| Device Type | # Households | % Households |
| Desktop or Laptop | 134 | 71.7% |
| Smartphone | 152 | 81.3% |
| Tablet | 118 | 63.1% |
| No Computing Device | 28 | 15.0% |
| Total | 187 | 100.0% |
Internet Access in Spokane
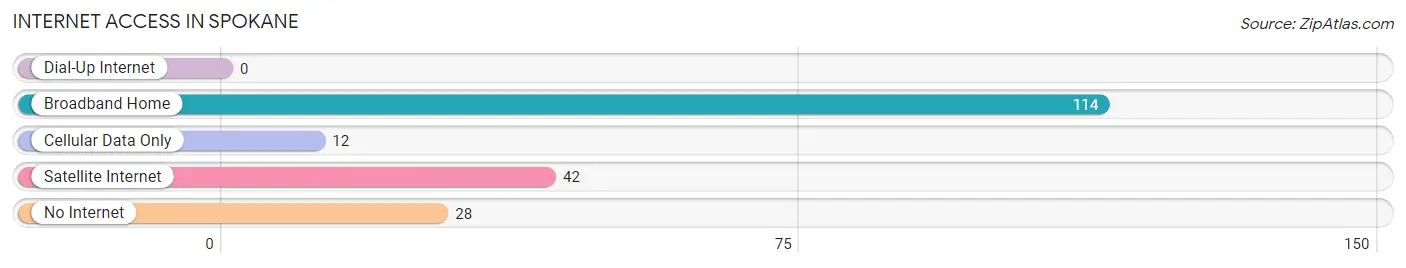
| Internet Type | # Households | % Households |
| Dial-Up Internet | 0 | 0.0% |
| Broadband Home | 114 | 61.0% |
| Cellular Data Only | 12 | 6.4% |
| Satellite Internet | 42 | 22.5% |
| No Internet | 28 | 15.0% |
| Total | 187 | 100.0% |
Spokane Summary
Spokane is a city located in the state of Washington in the United States. It is the second largest city in the state and the largest city in the Inland Northwest region. Spokane is situated on the Spokane River in the eastern part of the state, approximately 20 miles from the Idaho border. The city is located in the Spokane Valley, which is part of the larger Columbia River Plateau.
History
The Spokane area has been inhabited by Native Americans for thousands of years. The Spokane Tribe of Indians is the largest tribe in the area and has lived in the region since the late 1700s. The first European settlers arrived in the area in the late 1800s and the city of Spokane was officially incorporated in 1881. The city was named after the Spokane River, which was named by early explorers after the Native American tribe.
The city quickly grew in the late 1800s and early 1900s due to the mining and timber industries. The city was also a major hub for the Great Northern Railway, which connected the city to the rest of the country. The city experienced a major economic boom during the 1910s and 1920s, and the population grew rapidly.
The city was also the site of the 1974 World's Fair, which brought millions of visitors to the city and helped to revitalize the downtown area. The city has continued to grow and develop since then, and today it is a major economic and cultural center in the region.
Geography
Spokane is located in the eastern part of Washington, approximately 20 miles from the Idaho border. The city is situated on the Spokane River in the Spokane Valley, which is part of the larger Columbia River Plateau. The city is surrounded by mountains, including the Selkirk Mountains to the north and the Cascade Mountains to the west. The city is also located near several lakes, including Lake Coeur d'Alene and Lake Roosevelt.
The city has a total area of 58.7 square miles, of which 57.3 square miles is land and 1.4 square miles is water. The city has a humid continental climate, with cold winters and hot summers.
Economy
Spokane has a diverse economy that is driven by several industries, including healthcare, manufacturing, technology, and tourism. The city is home to several major employers, including Providence Health & Services, Kaiser Permanente, and Avista Corporation. The city is also home to several universities and colleges, including Gonzaga University, Whitworth University, and Spokane Community College.
The city is also a major tourist destination, with several attractions, including Riverfront Park, the Spokane Falls, and the Spokane Convention Center. The city also hosts several major events each year, including the Lilac Festival and Hoopfest.
Demographics
As of the 2010 census, the population of Spokane was 208,916. The city has a population density of 3,567 people per square mile. The racial makeup of the city is 79.2% White, 5.3% African American, 1.3% Native American, 4.2% Asian, 0.2% Pacific Islander, and 8.9% from other races. The median household income in the city is $41,845, and the median age is 36.7 years.
Common Questions
What is the Total Population of Spokane?
Total Population of Spokane is 471.
What is the Total Male Population of Spokane?
Total Male Population of Spokane is 262.
What is the Total Female Population of Spokane?
Total Female Population of Spokane is 209.
What is the Ratio of Males per 100 Females in Spokane?
There are 125.36 Males per 100 Females in Spokane.
What is the Ratio of Females per 100 Males in Spokane?
There are 79.77 Females per 100 Males in Spokane.
What is the Median Population Age in Spokane?
Median Population Age in Spokane is 59.0 Years.
What is the Average Family Size in Spokane
Average Family Size in Spokane is 3.8 People.
What is the Average Household Size in Spokane
Average Household Size in Spokane is 2.5 People.
What is Per Capita Income in Spokane?
Per Capita income in Spokane is $70,205.
What is the Median Household income in Spokane?
Median Household Income in Spokane is $98,750.
What is Inequality or Gini Index in Spokane?
Inequality or Gini Index in Spokane is 0.50.
How Large is the Labor Force in Spokane?
There are 231 People in the Labor Forcein in Spokane.
What is the Percentage of People in the Labor Force in Spokane?
52.3% of People are in the Labor Force in Spokane.