Point Place, LA
Point Place Map
Point Place Overview
613
TOTAL POPULATION
346
MALE POPULATION
267
FEMALE POPULATION
129.59
MALES / 100 FEMALES
77.17
FEMALES / 100 MALES
43.7
MEDIAN AGE
2.8
AVG FAMILY SIZE
2.2
AVG HOUSEHOLD SIZE
$27,528
PER CAPITA INCOME
$38,884
AVG HOUSEHOLD INCOME
40.4%
WAGE / INCOME GAP [ % ]
59.6¢/ $1
WAGE / INCOME GAP [ $ ]
0.42
INEQUALITY / GINI INDEX
189
LABOR FORCE [ PEOPLE ]
41.9%
PERCENT IN LABOR FORCE
8.5%
UNEMPLOYMENT RATE
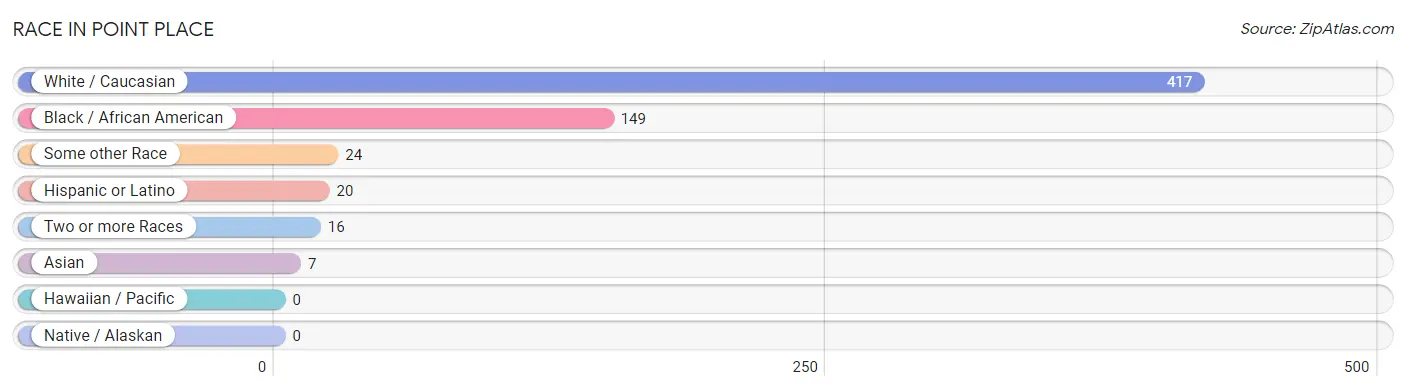
Race in Point Place
The most populous races in Point Place are White / Caucasian (417 | 68.0%), Black / African American (149 | 24.3%), and Some other Race (24 | 3.9%).
| Race | # Population | % Population |
| Asian | 7 | 1.1% |
| Black / African American | 149 | 24.3% |
| Hawaiian / Pacific | 0 | 0.0% |
| Hispanic or Latino | 20 | 3.3% |
| Native / Alaskan | 0 | 0.0% |
| White / Caucasian | 417 | 68.0% |
| Two or more Races | 16 | 2.6% |
| Some other Race | 24 | 3.9% |
| Total | 613 | 100.0% |
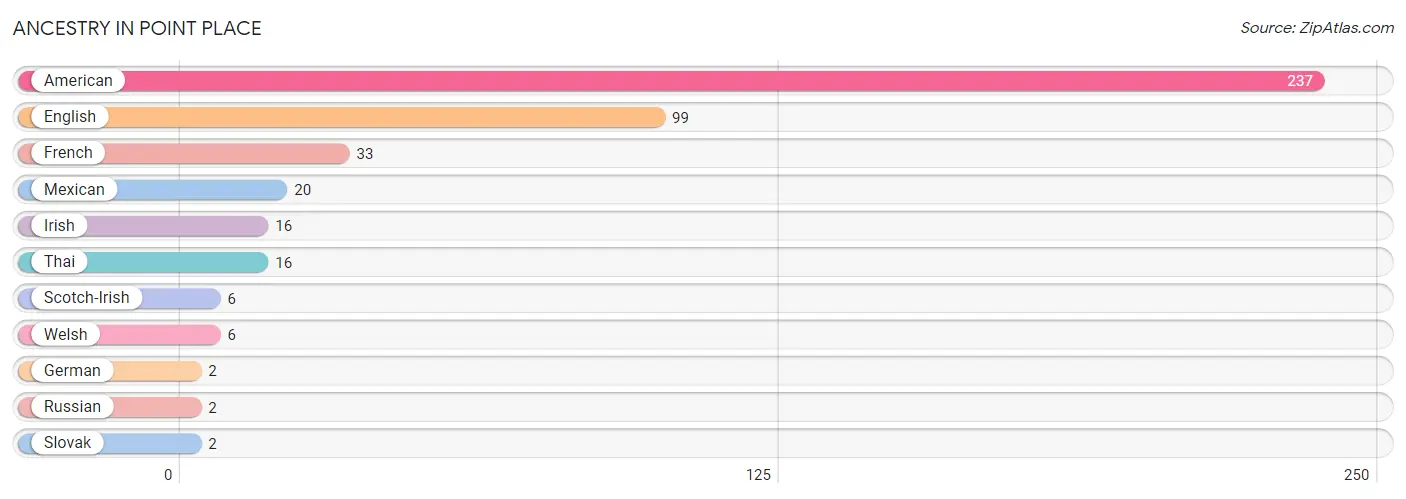
Ancestry in Point Place
The most populous ancestries reported in Point Place are American (237 | 38.7%), English (99 | 16.2%), French (33 | 5.4%), Mexican (20 | 3.3%), and Irish (16 | 2.6%), together accounting for 66.1% of all Point Place residents.
| Ancestry | # Population | % Population |
| American | 237 | 38.7% |
| English | 99 | 16.2% |
| French | 33 | 5.4% |
| German | 2 | 0.3% |
| Irish | 16 | 2.6% |
| Mexican | 20 | 3.3% |
| Russian | 2 | 0.3% |
| Scotch-Irish | 6 | 1.0% |
| Slovak | 2 | 0.3% |
| Thai | 16 | 2.6% |
| Welsh | 6 | 1.0% | View All 11 Rows |
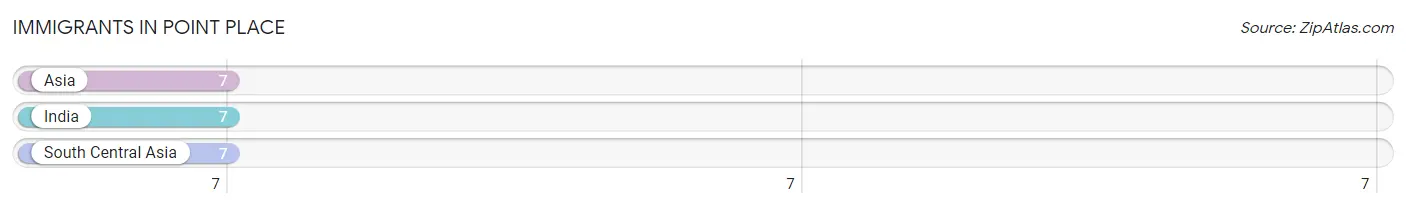
Immigrants in Point Place
The most numerous immigrant groups reported in Point Place came from Asia (7 | 1.1%), India (7 | 1.1%), and South Central Asia (7 | 1.1%), together accounting for 3.4% of all Point Place residents.
| Immigration Origin | # Population | % Population |
| Asia | 7 | 1.1% |
| India | 7 | 1.1% |
| South Central Asia | 7 | 1.1% | View All 3 Rows |
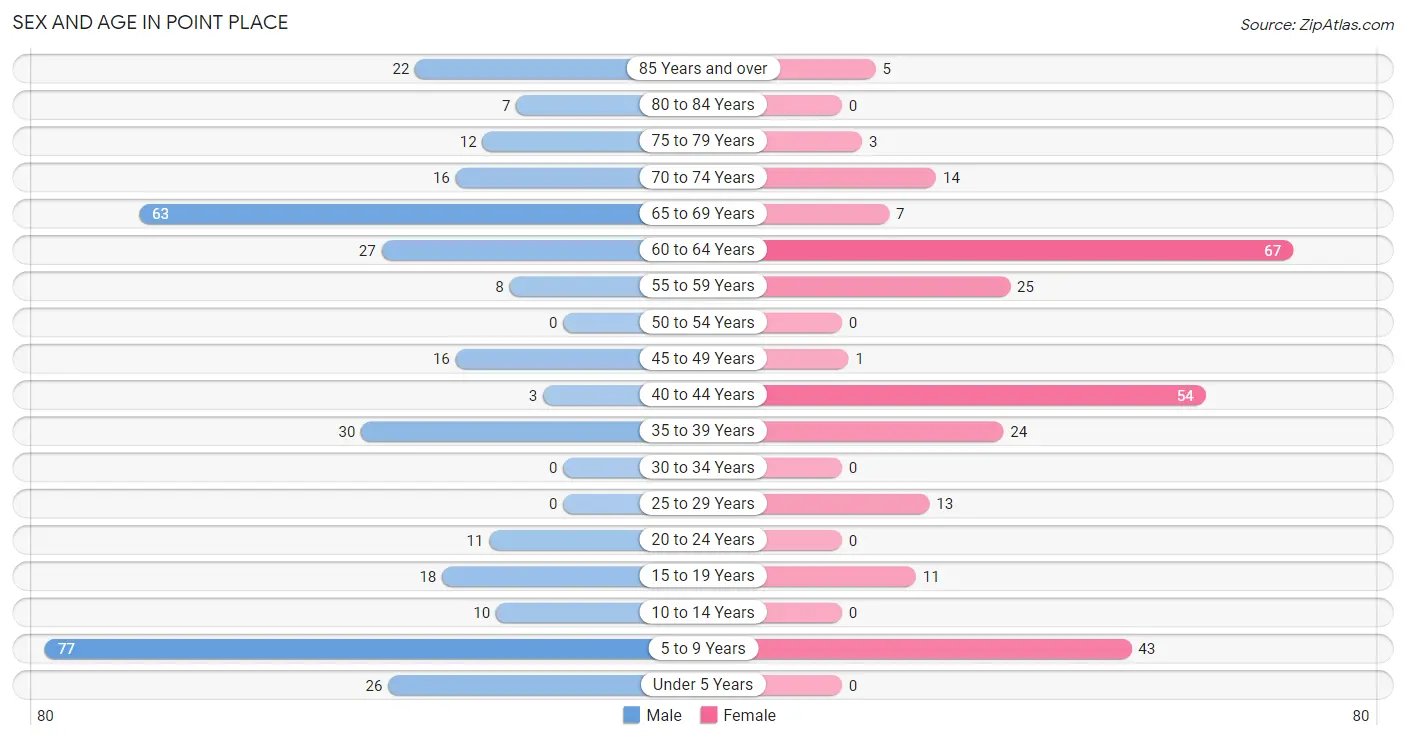
Sex and Age in Point Place
Sex and Age in Point Place
The most populous age groups in Point Place are 5 to 9 Years (77 | 22.3%) for men and 60 to 64 Years (67 | 25.1%) for women.
| Age Bracket | Male | Female |
| Under 5 Years | 26 (7.5%) | 0 (0.0%) |
| 5 to 9 Years | 77 (22.3%) | 43 (16.1%) |
| 10 to 14 Years | 10 (2.9%) | 0 (0.0%) |
| 15 to 19 Years | 18 (5.2%) | 11 (4.1%) |
| 20 to 24 Years | 11 (3.2%) | 0 (0.0%) |
| 25 to 29 Years | 0 (0.0%) | 13 (4.9%) |
| 30 to 34 Years | 0 (0.0%) | 0 (0.0%) |
| 35 to 39 Years | 30 (8.7%) | 24 (9.0%) |
| 40 to 44 Years | 3 (0.9%) | 54 (20.2%) |
| 45 to 49 Years | 16 (4.6%) | 1 (0.4%) |
| 50 to 54 Years | 0 (0.0%) | 0 (0.0%) |
| 55 to 59 Years | 8 (2.3%) | 25 (9.4%) |
| 60 to 64 Years | 27 (7.8%) | 67 (25.1%) |
| 65 to 69 Years | 63 (18.2%) | 7 (2.6%) |
| 70 to 74 Years | 16 (4.6%) | 14 (5.2%) |
| 75 to 79 Years | 12 (3.5%) | 3 (1.1%) |
| 80 to 84 Years | 7 (2.0%) | 0 (0.0%) |
| 85 Years and over | 22 (6.4%) | 5 (1.9%) |
| Total | 346 (100.0%) | 267 (100.0%) |
Families and Households in Point Place
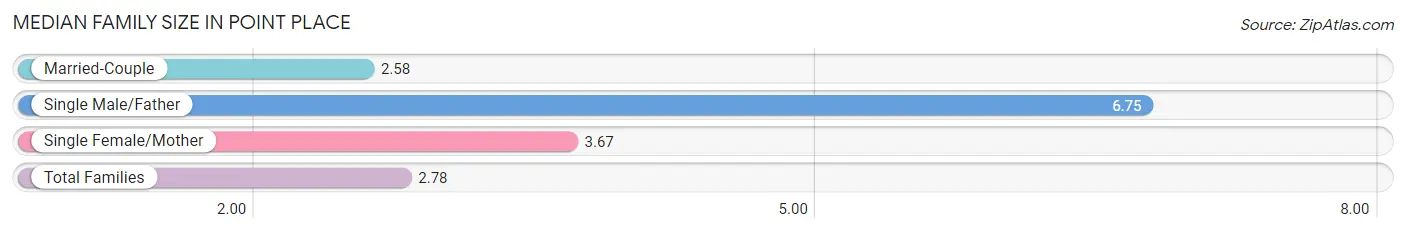
Median Family Size in Point Place
The median family size in Point Place is 2.78 persons per family, with single male/father families (4 | 2.3%) accounting for the largest median family size of 6.75 persons per family. On the other hand, married-couple families (154 | 87.5%) represent the smallest median family size with 2.58 persons per family.
| Family Type | # Families | Family Size |
| Married-Couple | 154 (87.5%) | 2.58 |
| Single Male/Father | 4 (2.3%) | 6.75 |
| Single Female/Mother | 18 (10.2%) | 3.67 |
| Total Families | 176 (100.0%) | 2.78 |
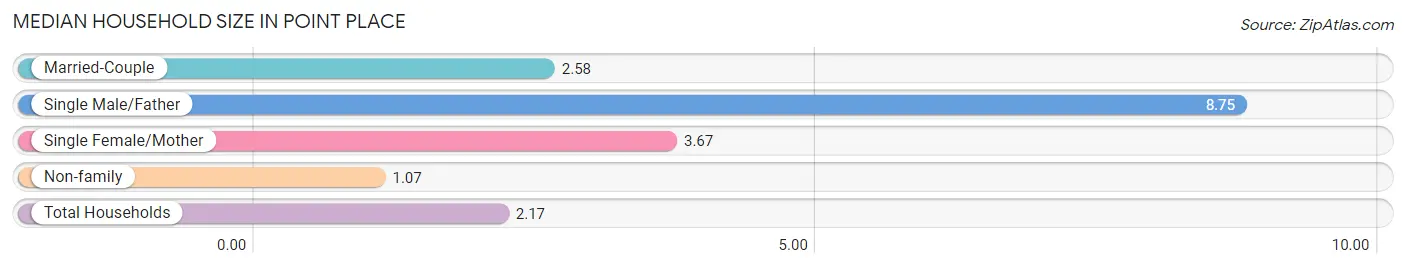
Median Household Size in Point Place
The median household size in Point Place is 2.17 persons per household, with single male/father households (4 | 1.4%) accounting for the largest median household size of 8.75 persons per household. non-family households (107 | 37.8%) represent the smallest median household size with 1.07 persons per household.
| Household Type | # Households | Household Size |
| Married-Couple | 154 (54.4%) | 2.58 |
| Single Male/Father | 4 (1.4%) | 8.75 |
| Single Female/Mother | 18 (6.4%) | 3.67 |
| Non-family | 107 (37.8%) | 1.07 |
| Total Households | 283 (100.0%) | 2.17 |
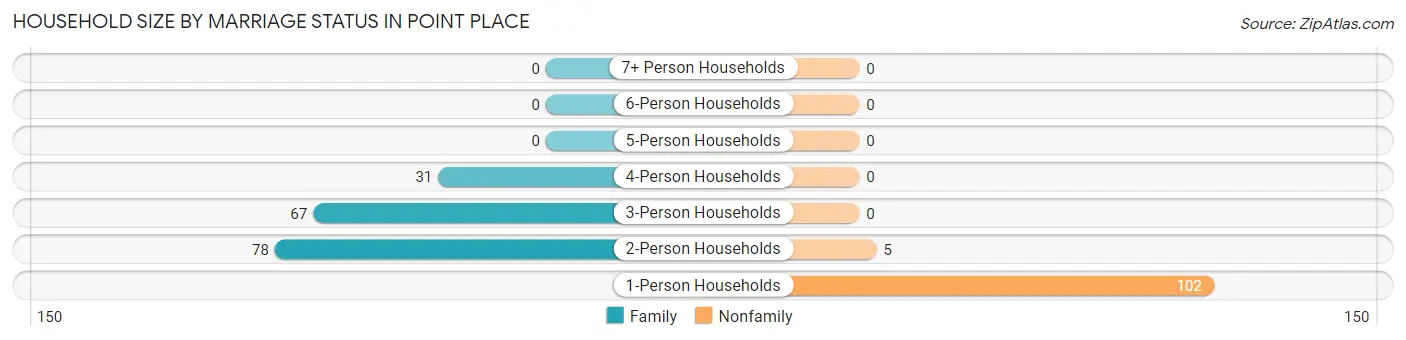
Household Size by Marriage Status in Point Place
Out of a total of 283 households in Point Place, 176 (62.2%) are family households, while 107 (37.8%) are nonfamily households. The most numerous type of family households are 2-person households, comprising 78, and the most common type of nonfamily households are 1-person households, comprising 102.
| Household Size | Family Households | Nonfamily Households |
| 1-Person Households | - | 102 (36.0%) |
| 2-Person Households | 78 (27.6%) | 5 (1.8%) |
| 3-Person Households | 67 (23.7%) | 0 (0.0%) |
| 4-Person Households | 31 (11.0%) | 0 (0.0%) |
| 5-Person Households | 0 (0.0%) | 0 (0.0%) |
| 6-Person Households | 0 (0.0%) | 0 (0.0%) |
| 7+ Person Households | 0 (0.0%) | 0 (0.0%) |
| Total | 176 (62.2%) | 107 (37.8%) |
Female Fertility in Point Place
Fertility by Age in Point Place
Average fertility rate in Point Place is 126.0 births per 1,000 women. Women in the age bracket of 20 to 34 years have the highest fertility rate with 1,000.0 births per 1,000 women. Women in the age bracket of 20 to 34 years acount for 100.0% of all women with births.
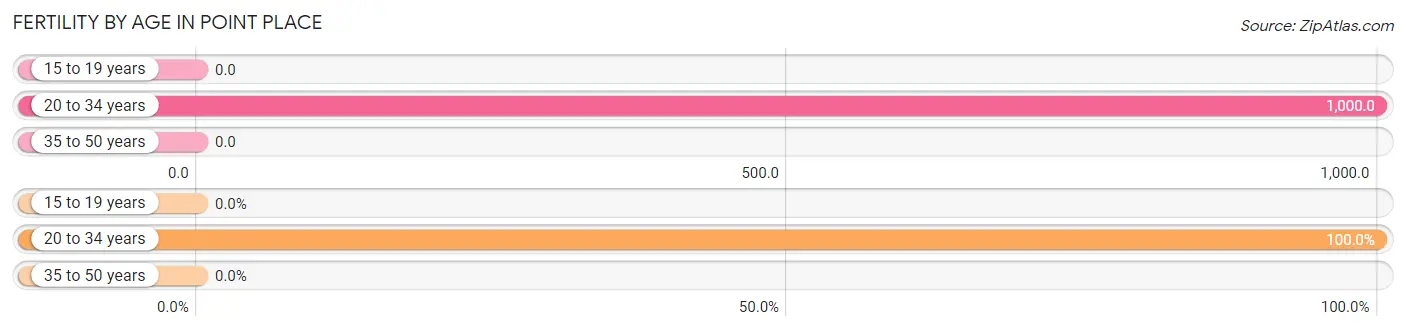
| Age Bracket | Women with Births | Births / 1,000 Women |
| 15 to 19 years | 0 (0.0%) | 0.0 |
| 20 to 34 years | 13 (100.0%) | 1,000.0 |
| 35 to 50 years | 0 (0.0%) | 0.0 |
| Total | 13 (100.0%) | 126.0 |
Fertility by Age by Marriage Status in Point Place
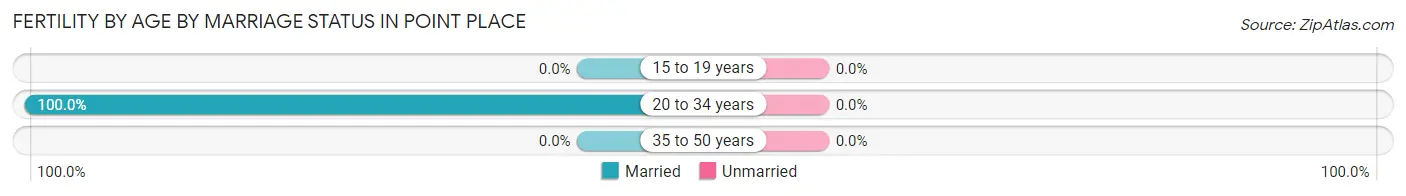
| Age Bracket | Married | Unmarried |
| 15 to 19 years | 0 (0.0%) | 0 (0.0%) |
| 20 to 34 years | 13 (100.0%) | 0 (0.0%) |
| 35 to 50 years | 0 (0.0%) | 0 (0.0%) |
| Total | 13 (100.0%) | 0 (0.0%) |
Fertility by Education in Point Place
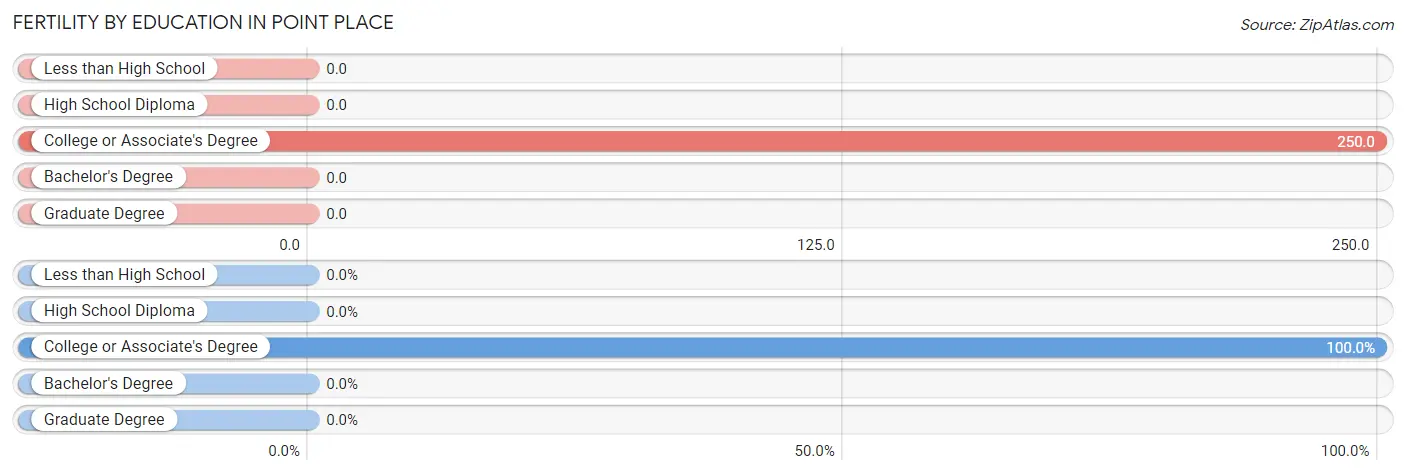
| Educational Attainment | Women with Births | Births / 1,000 Women |
| Less than High School | 0 (0.0%) | 0.0 |
| High School Diploma | 0 (0.0%) | 0.0 |
| College or Associate's Degree | 13 (100.0%) | 250.0 |
| Bachelor's Degree | 0 (0.0%) | 0.0 |
| Graduate Degree | 0 (0.0%) | 0.0 |
| Total | 13 (100.0%) | 126.0 |
Fertility by Education by Marriage Status in Point Place
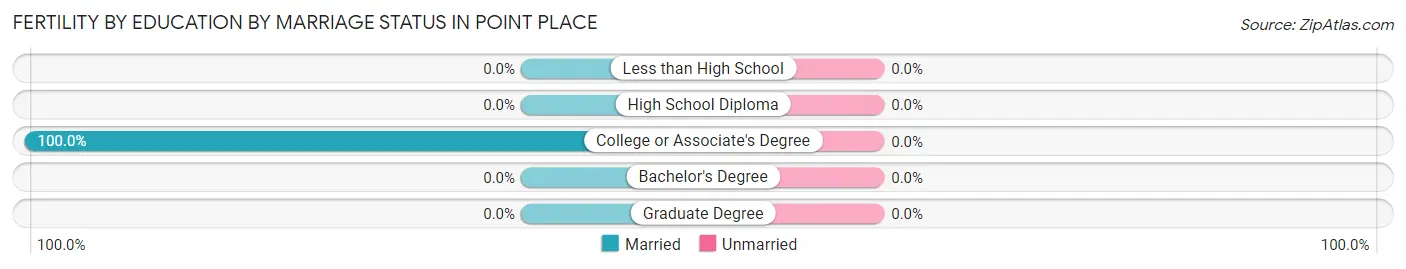
| Educational Attainment | Married | Unmarried |
| Less than High School | 0 (0.0%) | 0 (0.0%) |
| High School Diploma | 0 (0.0%) | 0 (0.0%) |
| College or Associate's Degree | 13 (100.0%) | 0 (0.0%) |
| Bachelor's Degree | 0 (0.0%) | 0 (0.0%) |
| Graduate Degree | 0 (0.0%) | 0 (0.0%) |
| Total | 13 (100.0%) | 0 (0.0%) |
Income in Point Place
Income Overview in Point Place
| Characteristic | Number | Measure |
| Per Capita Income | 613 | $27,528 |
| Median Family Income | 176 | $0 |
| Mean Family Income | 176 | $81,871 |
| Median Household Income | 283 | $38,884 |
| Mean Household Income | 283 | $65,626 |
| Income Deficit | 176 | $0 |
| Wage / Income Gap (%) | 613 | 40.41% |
| Wage / Income Gap ($) | 613 | 59.59¢ per $1 |
| Gini / Inequality Index | 613 | 0.42 |
Earnings by Sex in Point Place
Average Earnings in Point Place are $55,484, $66,591 for men and $39,679 for women, a difference of 40.4%.
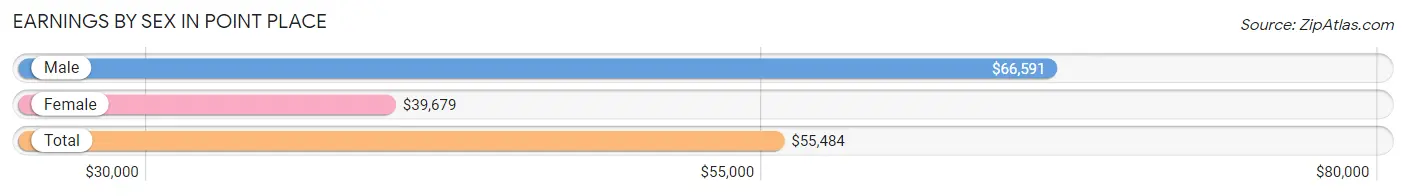
| Sex | Number | Average Earnings |
| Male | 88 (45.8%) | $66,591 |
| Female | 104 (54.2%) | $39,679 |
| Total | 192 (100.0%) | $55,484 |
Earnings by Sex by Income Bracket in Point Place
The most common earnings brackets in Point Place are $75,000 to $99,999 for men (27 | 30.7%) and $35,000 to $39,999 for women (39 | 37.5%).
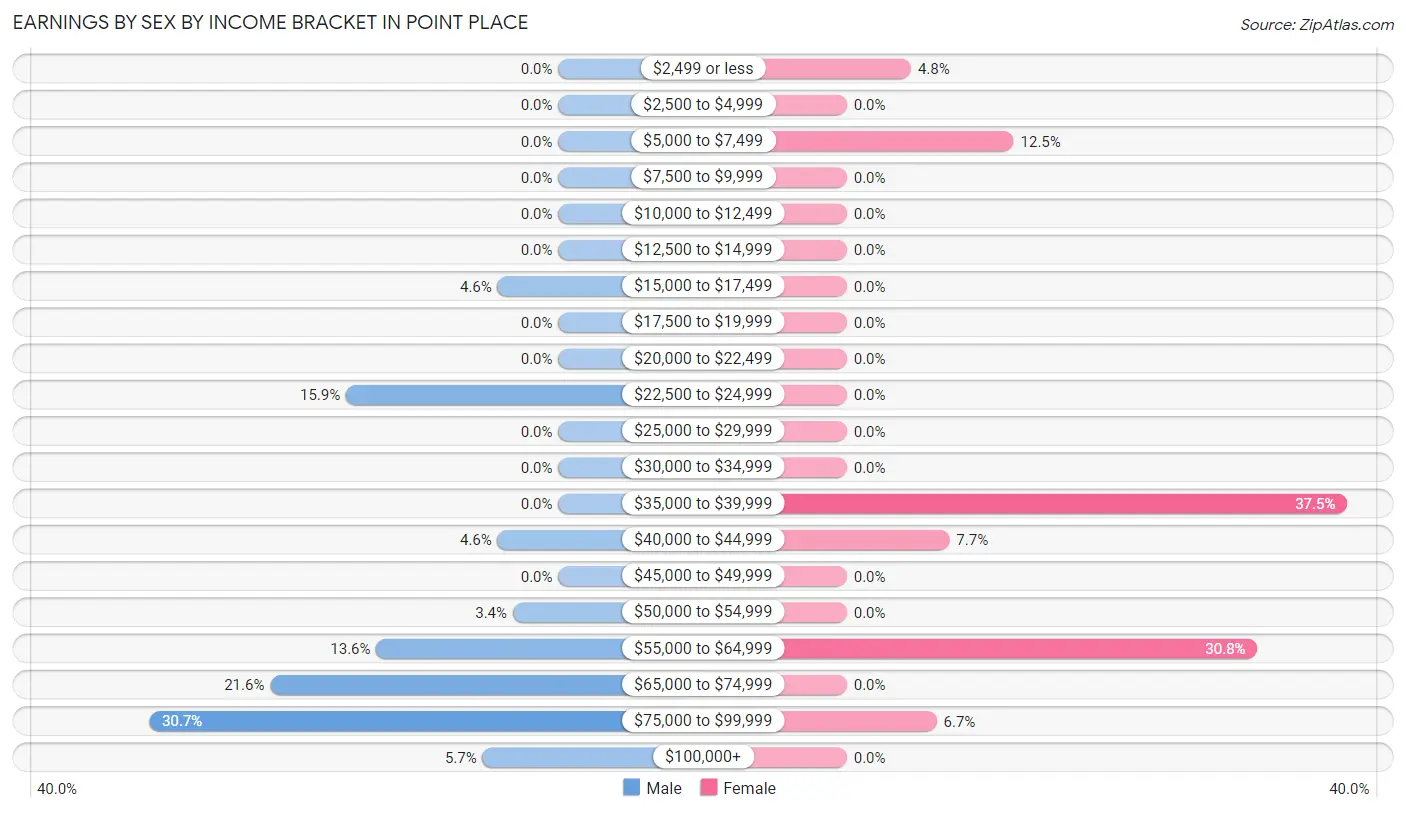
| Income | Male | Female |
| $2,499 or less | 0 (0.0%) | 5 (4.8%) |
| $2,500 to $4,999 | 0 (0.0%) | 0 (0.0%) |
| $5,000 to $7,499 | 0 (0.0%) | 13 (12.5%) |
| $7,500 to $9,999 | 0 (0.0%) | 0 (0.0%) |
| $10,000 to $12,499 | 0 (0.0%) | 0 (0.0%) |
| $12,500 to $14,999 | 0 (0.0%) | 0 (0.0%) |
| $15,000 to $17,499 | 4 (4.5%) | 0 (0.0%) |
| $17,500 to $19,999 | 0 (0.0%) | 0 (0.0%) |
| $20,000 to $22,499 | 0 (0.0%) | 0 (0.0%) |
| $22,500 to $24,999 | 14 (15.9%) | 0 (0.0%) |
| $25,000 to $29,999 | 0 (0.0%) | 0 (0.0%) |
| $30,000 to $34,999 | 0 (0.0%) | 0 (0.0%) |
| $35,000 to $39,999 | 0 (0.0%) | 39 (37.5%) |
| $40,000 to $44,999 | 4 (4.5%) | 8 (7.7%) |
| $45,000 to $49,999 | 0 (0.0%) | 0 (0.0%) |
| $50,000 to $54,999 | 3 (3.4%) | 0 (0.0%) |
| $55,000 to $64,999 | 12 (13.6%) | 32 (30.8%) |
| $65,000 to $74,999 | 19 (21.6%) | 0 (0.0%) |
| $75,000 to $99,999 | 27 (30.7%) | 7 (6.7%) |
| $100,000+ | 5 (5.7%) | 0 (0.0%) |
| Total | 88 (100.0%) | 104 (100.0%) |
Earnings by Sex by Educational Attainment in Point Place
Average earnings in Point Place are $67,969 for men and $39,840 for women, a difference of 41.4%. Men with an educational attainment of high school diploma enjoy the highest average annual earnings of $68,750, while those with high school diploma education earn the least with $68,750. Women with an educational attainment of college or associate's degree earn the most with the average annual earnings of $38,333, while those with college or associate's degree education have the smallest earnings of $38,333.
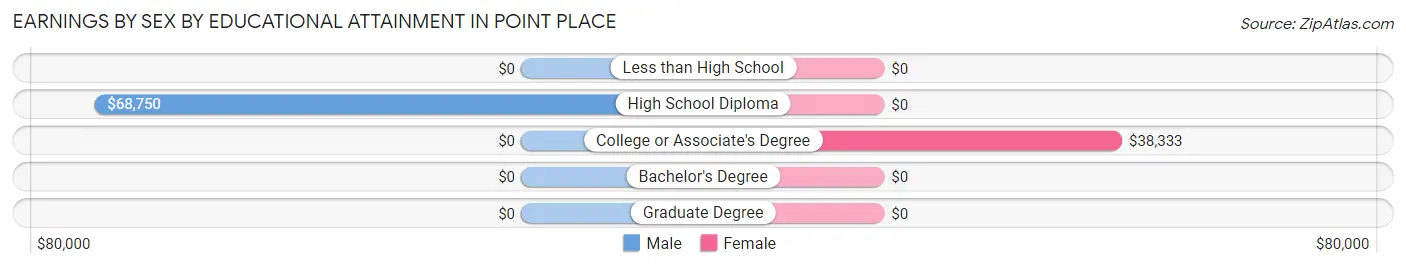
| Educational Attainment | Male Income | Female Income |
| Less than High School | - | - |
| High School Diploma | $68,750 | $0 |
| College or Associate's Degree | - | - |
| Bachelor's Degree | - | - |
| Graduate Degree | - | - |
| Total | $67,969 | $39,840 |
Family Income in Point Place
Family Income Brackets in Point Place
According to the Point Place family income data, there are 55 families falling into the $100,000 to $149,999 income range, which is the most common income bracket and makes up 31.2% of all families.
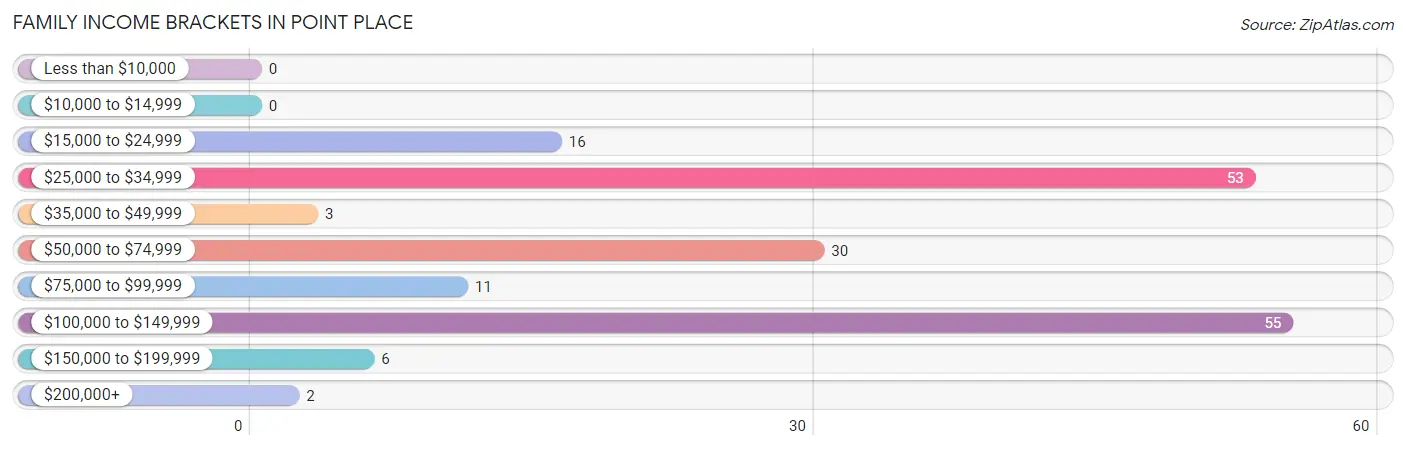
| Income Bracket | # Families | % Families |
| Less than $10,000 | 0 | 0.0% |
| $10,000 to $14,999 | 0 | 0.0% |
| $15,000 to $24,999 | 16 | 9.1% |
| $25,000 to $34,999 | 53 | 30.1% |
| $35,000 to $49,999 | 3 | 1.7% |
| $50,000 to $74,999 | 30 | 17.0% |
| $75,000 to $99,999 | 11 | 6.3% |
| $100,000 to $149,999 | 55 | 31.3% |
| $150,000 to $199,999 | 6 | 3.4% |
| $200,000+ | 2 | 1.1% |
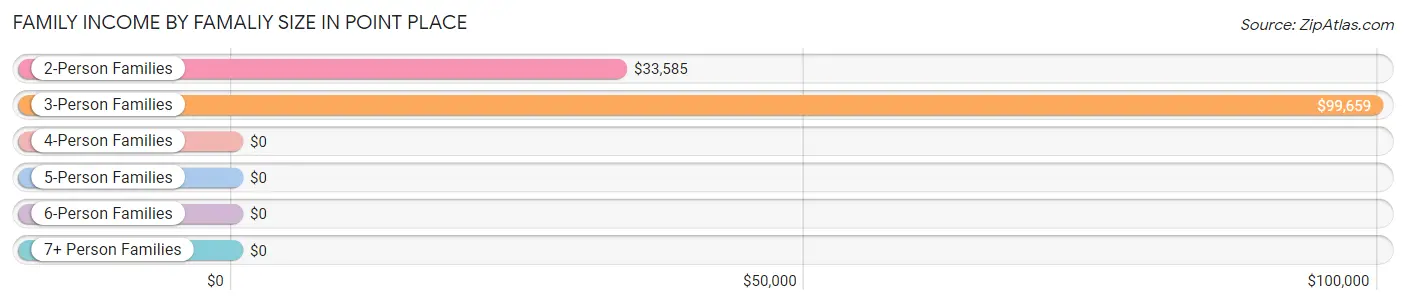
Family Income by Famaliy Size in Point Place
3-person families (71 | 40.3%) account for the highest median family income in Point Place with $99,659 per family, while 3-person families (71 | 40.3%) have the highest median income of $33,220 per family member.
| Income Bracket | # Families | Median Income |
| 2-Person Families | 78 (44.3%) | $33,585 |
| 3-Person Families | 71 (40.3%) | $99,659 |
| 4-Person Families | 27 (15.3%) | $0 |
| 5-Person Families | 0 (0.0%) | $0 |
| 6-Person Families | 0 (0.0%) | $0 |
| 7+ Person Families | 0 (0.0%) | $0 |
| Total | 176 (100.0%) | $0 |
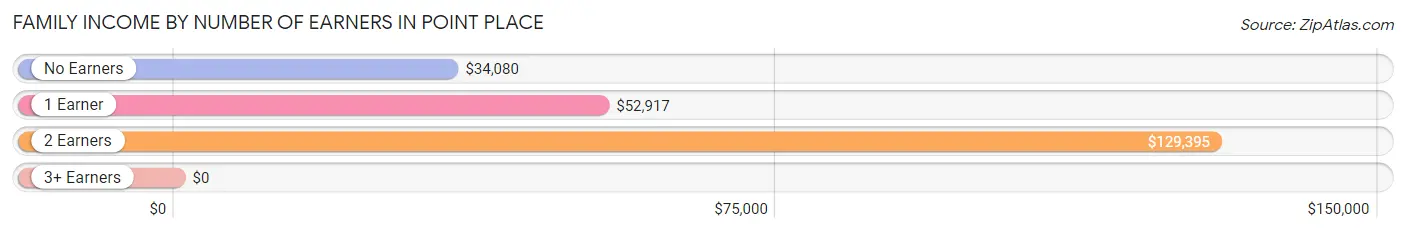
Family Income by Number of Earners in Point Place
| Number of Earners | # Families | Median Income |
| No Earners | 67 (38.1%) | $34,080 |
| 1 Earner | 37 (21.0%) | $52,917 |
| 2 Earners | 69 (39.2%) | $129,395 |
| 3+ Earners | 3 (1.7%) | $0 |
| Total | 176 (100.0%) | $0 |
Household Income in Point Place
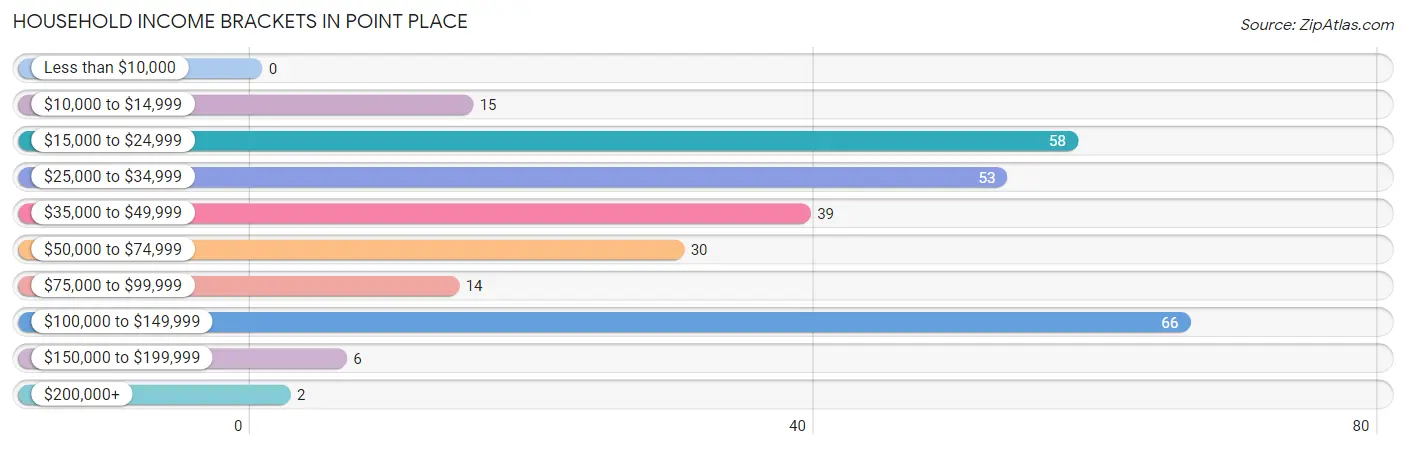
Household Income Brackets in Point Place
With 66 households falling in the category, the $100,000 to $149,999 income range is the most frequent in Point Place, accounting for 23.3% of all households.
| Income Bracket | # Households | % Households |
| Less than $10,000 | 0 | 0.0% |
| $10,000 to $14,999 | 15 | 5.3% |
| $15,000 to $24,999 | 58 | 20.5% |
| $25,000 to $34,999 | 53 | 18.7% |
| $35,000 to $49,999 | 39 | 13.8% |
| $50,000 to $74,999 | 30 | 10.6% |
| $75,000 to $99,999 | 14 | 4.9% |
| $100,000 to $149,999 | 66 | 23.3% |
| $150,000 to $199,999 | 6 | 2.1% |
| $200,000+ | 2 | 0.7% |
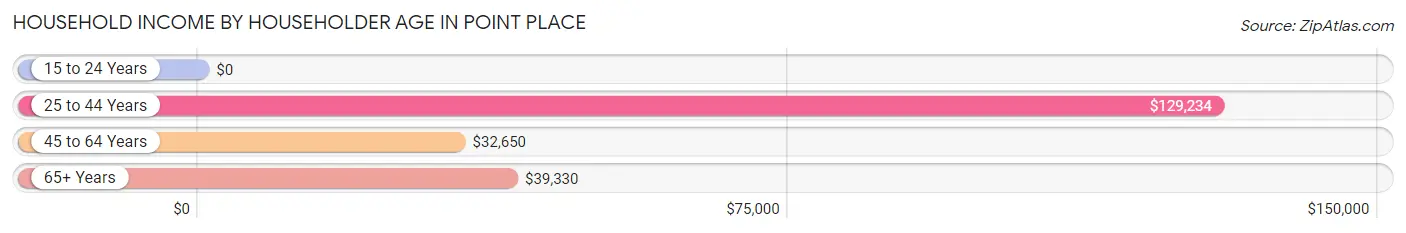
Household Income by Householder Age in Point Place
The median household income in Point Place is $38,884, with the highest median household income of $129,234 found in the 25 to 44 years age bracket for the primary householder. A total of 73 households (25.8%) fall into this category. Meanwhile, the 15 to 24 years age bracket for the primary householder has the lowest median household income of $0, with 11 households (3.9%) in this group.
| Income Bracket | # Households | Median Income |
| 15 to 24 Years | 11 (3.9%) | $0 |
| 25 to 44 Years | 73 (25.8%) | $129,234 |
| 45 to 64 Years | 102 (36.0%) | $32,650 |
| 65+ Years | 97 (34.3%) | $39,330 |
| Total | 283 (100.0%) | $38,884 |
Poverty in Point Place
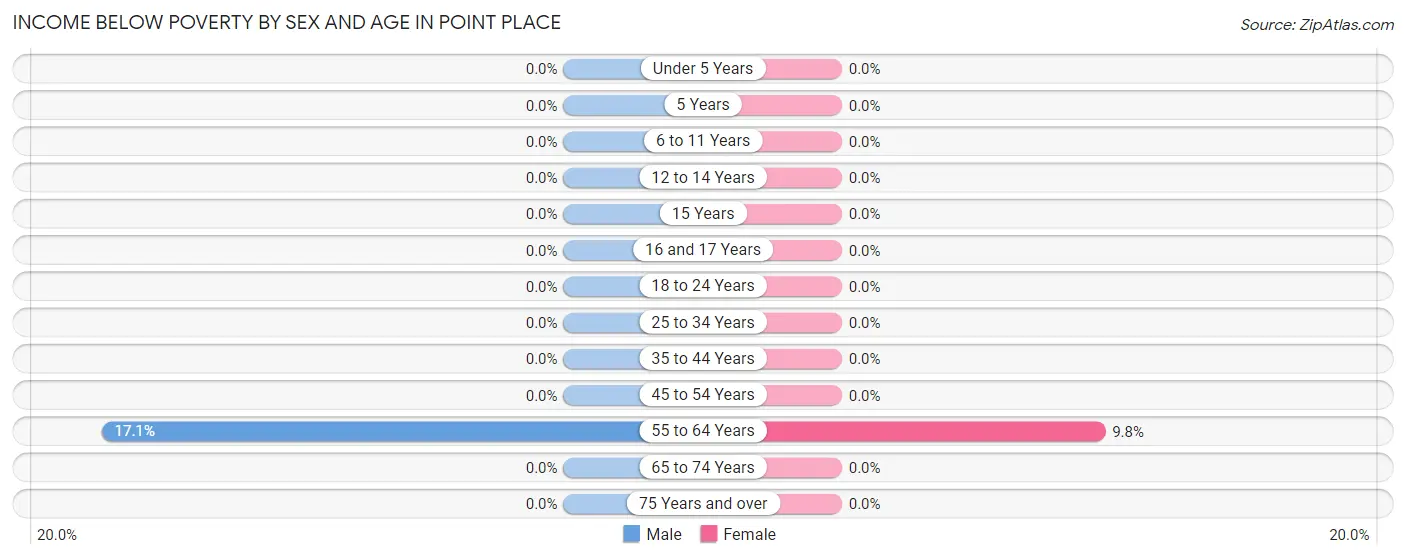
Income Below Poverty by Sex and Age in Point Place
With 1.7% poverty level for males and 3.4% for females among the residents of Point Place, 55 to 64 year old males and 55 to 64 year old females are the most vulnerable to poverty, with 6 males (17.1%) and 9 females (9.8%) in their respective age groups living below the poverty level.
| Age Bracket | Male | Female |
| Under 5 Years | 0 (0.0%) | 0 (0.0%) |
| 5 Years | 0 (0.0%) | 0 (0.0%) |
| 6 to 11 Years | 0 (0.0%) | 0 (0.0%) |
| 12 to 14 Years | 0 (0.0%) | 0 (0.0%) |
| 15 Years | 0 (0.0%) | 0 (0.0%) |
| 16 and 17 Years | 0 (0.0%) | 0 (0.0%) |
| 18 to 24 Years | 0 (0.0%) | 0 (0.0%) |
| 25 to 34 Years | 0 (0.0%) | 0 (0.0%) |
| 35 to 44 Years | 0 (0.0%) | 0 (0.0%) |
| 45 to 54 Years | 0 (0.0%) | 0 (0.0%) |
| 55 to 64 Years | 6 (17.1%) | 9 (9.8%) |
| 65 to 74 Years | 0 (0.0%) | 0 (0.0%) |
| 75 Years and over | 0 (0.0%) | 0 (0.0%) |
| Total | 6 (1.7%) | 9 (3.4%) |
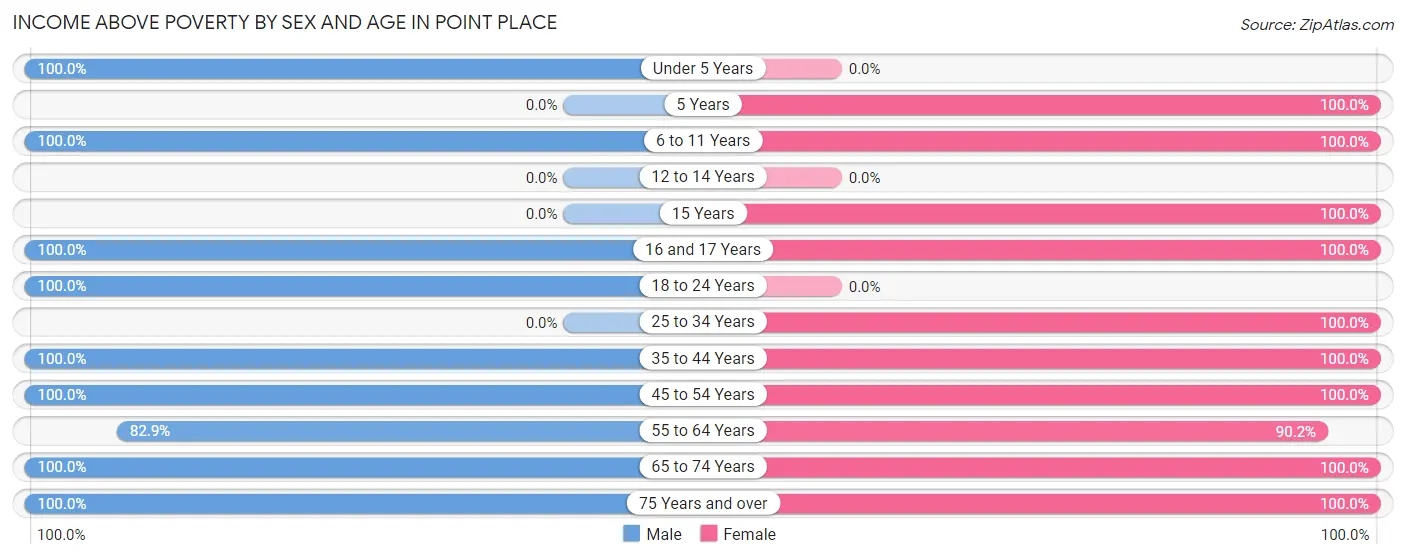
Income Above Poverty by Sex and Age in Point Place
According to the poverty statistics in Point Place, males aged under 5 years and females aged 5 years are the age groups that are most secure financially, with 100.0% of males and 100.0% of females in these age groups living above the poverty line.
| Age Bracket | Male | Female |
| Under 5 Years | 26 (100.0%) | 0 (0.0%) |
| 5 Years | 0 (0.0%) | 13 (100.0%) |
| 6 to 11 Years | 87 (100.0%) | 30 (100.0%) |
| 12 to 14 Years | 0 (0.0%) | 0 (0.0%) |
| 15 Years | 0 (0.0%) | 6 (100.0%) |
| 16 and 17 Years | 18 (100.0%) | 5 (100.0%) |
| 18 to 24 Years | 11 (100.0%) | 0 (0.0%) |
| 25 to 34 Years | 0 (0.0%) | 13 (100.0%) |
| 35 to 44 Years | 33 (100.0%) | 78 (100.0%) |
| 45 to 54 Years | 16 (100.0%) | 1 (100.0%) |
| 55 to 64 Years | 29 (82.9%) | 83 (90.2%) |
| 65 to 74 Years | 79 (100.0%) | 21 (100.0%) |
| 75 Years and over | 41 (100.0%) | 8 (100.0%) |
| Total | 340 (98.3%) | 258 (96.6%) |
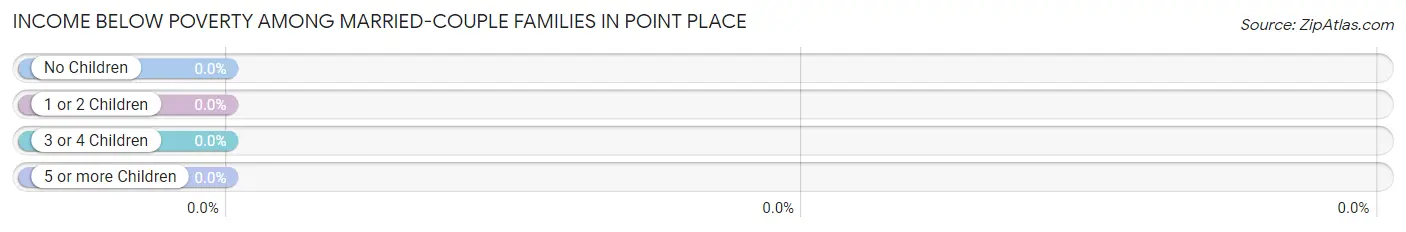
Income Below Poverty Among Married-Couple Families in Point Place
| Children | Above Poverty | Below Poverty |
| No Children | 85 (100.0%) | 0 (0.0%) |
| 1 or 2 Children | 69 (100.0%) | 0 (0.0%) |
| 3 or 4 Children | 0 (0.0%) | 0 (0.0%) |
| 5 or more Children | 0 (0.0%) | 0 (0.0%) |
| Total | 154 (100.0%) | 0 (0.0%) |
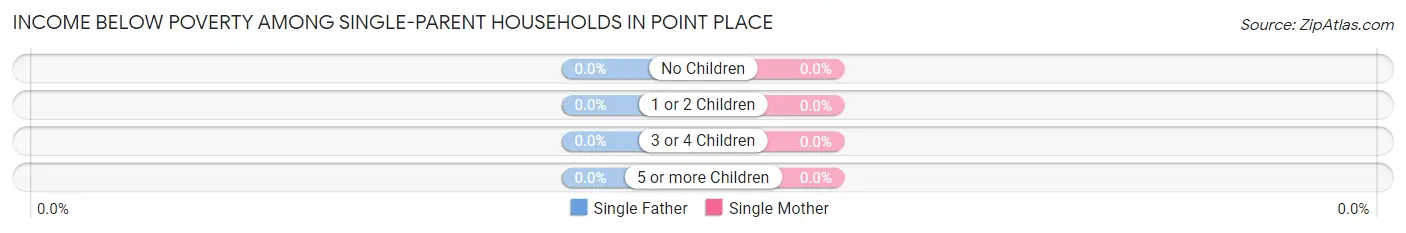
Income Below Poverty Among Single-Parent Households in Point Place
| Children | Single Father | Single Mother |
| No Children | 0 (0.0%) | 0 (0.0%) |
| 1 or 2 Children | 0 (0.0%) | 0 (0.0%) |
| 3 or 4 Children | 0 (0.0%) | 0 (0.0%) |
| 5 or more Children | 0 (0.0%) | 0 (0.0%) |
| Total | 0 (0.0%) | 0 (0.0%) |
Income Below Poverty Among Married-Couple vs Single-Parent Households in Point Place
| Children | Married-Couple Families | Single-Parent Households |
| No Children | 0 (0.0%) | 0 (0.0%) |
| 1 or 2 Children | 0 (0.0%) | 0 (0.0%) |
| 3 or 4 Children | 0 (0.0%) | 0 (0.0%) |
| 5 or more Children | 0 (0.0%) | 0 (0.0%) |
| Total | 0 (0.0%) | 0 (0.0%) |
Employment Characteristics in Point Place
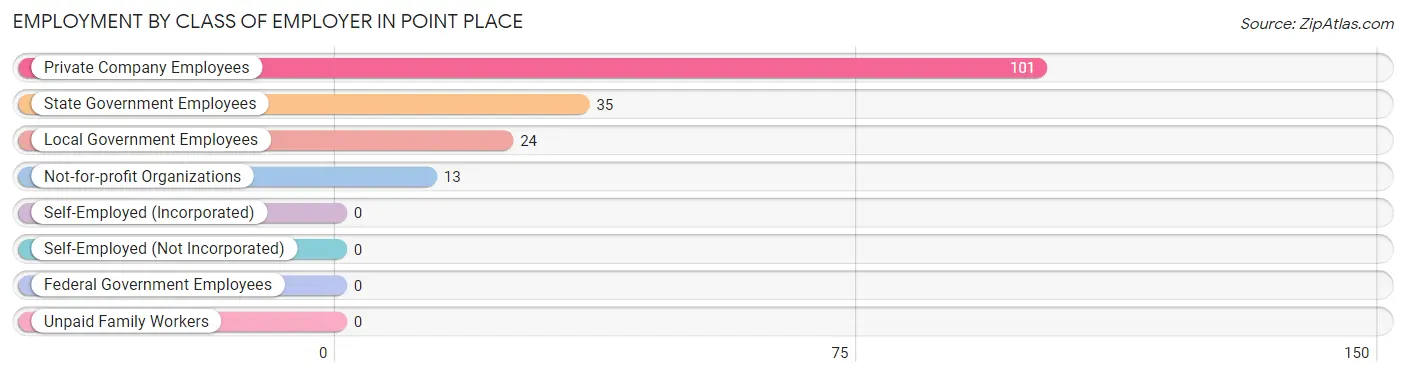
Employment by Class of Employer in Point Place
Among the 173 employed individuals in Point Place, private company employees (101 | 58.4%), state government employees (35 | 20.2%), and local government employees (24 | 13.9%) make up the most common classes of employment.
| Employer Class | # Employees | % Employees |
| Private Company Employees | 101 | 58.4% |
| Self-Employed (Incorporated) | 0 | 0.0% |
| Self-Employed (Not Incorporated) | 0 | 0.0% |
| Not-for-profit Organizations | 13 | 7.5% |
| Local Government Employees | 24 | 13.9% |
| State Government Employees | 35 | 20.2% |
| Federal Government Employees | 0 | 0.0% |
| Unpaid Family Workers | 0 | 0.0% |
| Total | 173 | 100.0% |
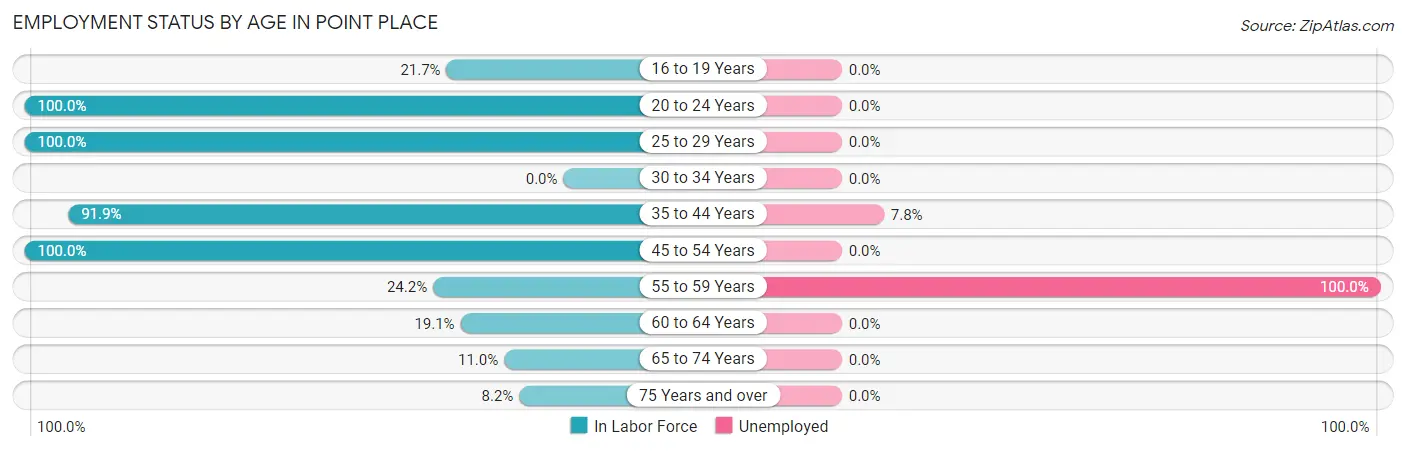
Employment Status by Age in Point Place
According to the labor force statistics for Point Place, out of the total population over 16 years of age (451), 41.9% or 189 individuals are in the labor force, with 8.5% or 16 of them unemployed. The age group with the highest labor force participation rate is 20 to 24 years, with 100.0% or 11 individuals in the labor force. Within the labor force, the 55 to 59 years age range has the highest percentage of unemployed individuals, with 100.0% or 8 of them being unemployed.
| Age Bracket | In Labor Force | Unemployed |
| 16 to 19 Years | 5 (21.7%) | 0 (0.0%) |
| 20 to 24 Years | 11 (100.0%) | 0 (0.0%) |
| 25 to 29 Years | 13 (100.0%) | 0 (0.0%) |
| 30 to 34 Years | 0 (0.0%) | 0 (0.0%) |
| 35 to 44 Years | 102 (91.9%) | 8 (7.8%) |
| 45 to 54 Years | 17 (100.0%) | 0 (0.0%) |
| 55 to 59 Years | 8 (24.2%) | 8 (100.0%) |
| 60 to 64 Years | 18 (19.1%) | 0 (0.0%) |
| 65 to 74 Years | 11 (11.0%) | 0 (0.0%) |
| 75 Years and over | 4 (8.2%) | 0 (0.0%) |
| Total | 189 (41.9%) | 16 (8.5%) |
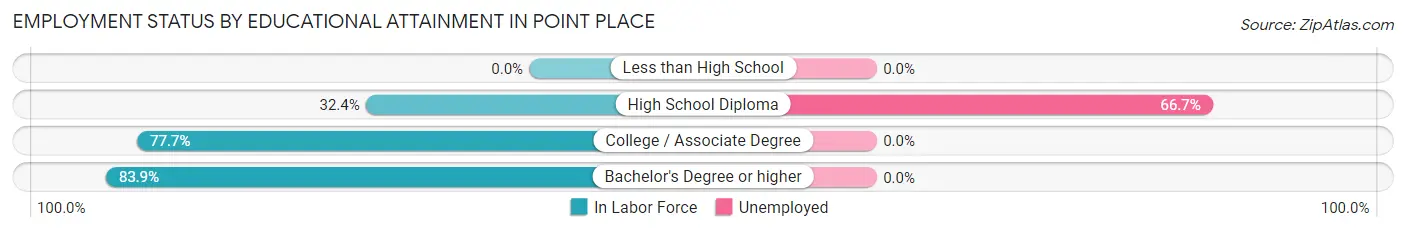
Employment Status by Educational Attainment in Point Place
According to labor force statistics for Point Place, 59.0% of individuals (158) out of the total population between 25 and 64 years of age (268) are in the labor force, with 10.1% or 16 of them being unemployed. The group with the highest labor force participation rate are those with the educational attainment of bachelor's degree or higher, with 83.9% or 47 individuals in the labor force. Within the labor force, individuals with high school diploma education have the highest percentage of unemployment, with 66.7% or 16 of them being unemployed.
| Educational Attainment | In Labor Force | Unemployed |
| Less than High School | 0 (0.0%) | 0 (0.0%) |
| High School Diploma | 24 (32.4%) | 49 (66.7%) |
| College / Associate Degree | 87 (77.7%) | 0 (0.0%) |
| Bachelor's Degree or higher | 47 (83.9%) | 0 (0.0%) |
| Total | 158 (59.0%) | 27 (10.1%) |
Employment Occupations by Sex in Point Place
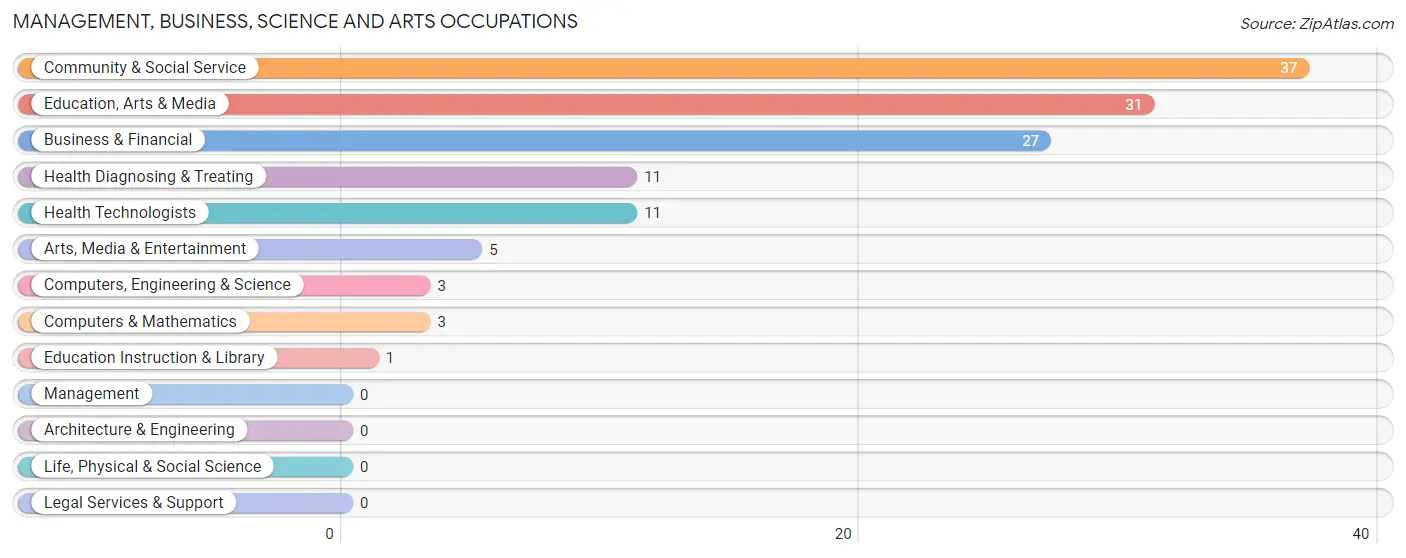
Management, Business, Science and Arts Occupations
The most common Management, Business, Science and Arts occupations in Point Place are Community & Social Service (37 | 21.4%), Education, Arts & Media (31 | 17.9%), Business & Financial (27 | 15.6%), Health Diagnosing & Treating (11 | 6.4%), and Health Technologists (11 | 6.4%).
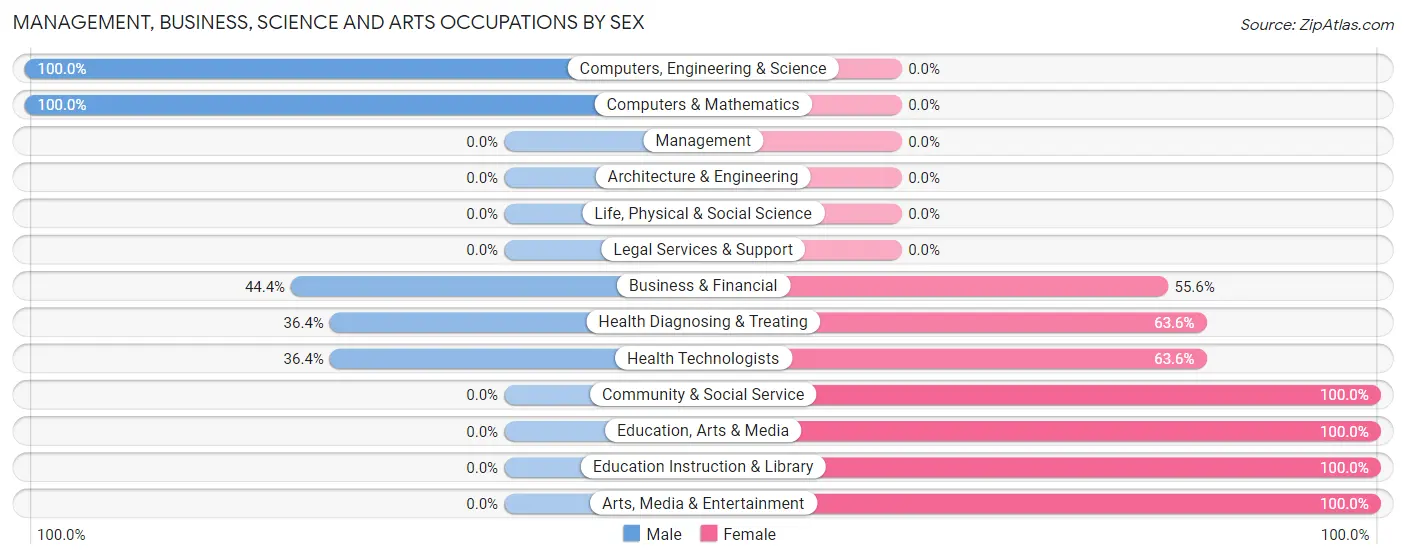
Management, Business, Science and Arts Occupations by Sex
Within the Management, Business, Science and Arts occupations in Point Place, the most male-oriented occupations are Computers, Engineering & Science (100.0%), Computers & Mathematics (100.0%), and Business & Financial (44.4%), while the most female-oriented occupations are Community & Social Service (100.0%), Education, Arts & Media (100.0%), and Education Instruction & Library (100.0%).
| Occupation | Male | Female |
| Management | 0 (0.0%) | 0 (0.0%) |
| Business & Financial | 12 (44.4%) | 15 (55.6%) |
| Computers, Engineering & Science | 3 (100.0%) | 0 (0.0%) |
| Computers & Mathematics | 3 (100.0%) | 0 (0.0%) |
| Architecture & Engineering | 0 (0.0%) | 0 (0.0%) |
| Life, Physical & Social Science | 0 (0.0%) | 0 (0.0%) |
| Community & Social Service | 0 (0.0%) | 37 (100.0%) |
| Education, Arts & Media | 0 (0.0%) | 31 (100.0%) |
| Legal Services & Support | 0 (0.0%) | 0 (0.0%) |
| Education Instruction & Library | 0 (0.0%) | 1 (100.0%) |
| Arts, Media & Entertainment | 0 (0.0%) | 5 (100.0%) |
| Health Diagnosing & Treating | 4 (36.4%) | 7 (63.6%) |
| Health Technologists | 4 (36.4%) | 7 (63.6%) |
| Total (Category) | 19 (24.4%) | 59 (75.6%) |
| Total (Overall) | 77 (44.5%) | 96 (55.5%) |
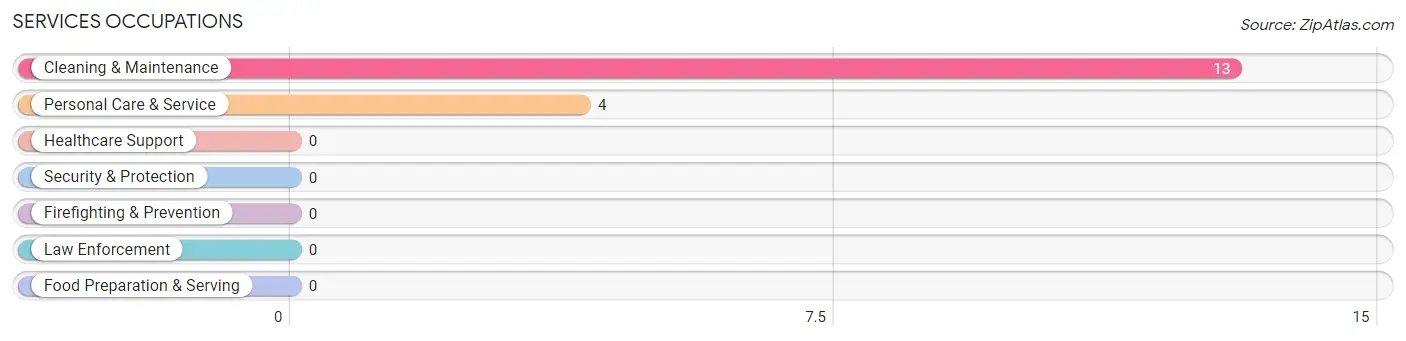
Services Occupations
The most common Services occupations in Point Place are Cleaning & Maintenance (13 | 7.5%), and Personal Care & Service (4 | 2.3%).
Services Occupations by Sex
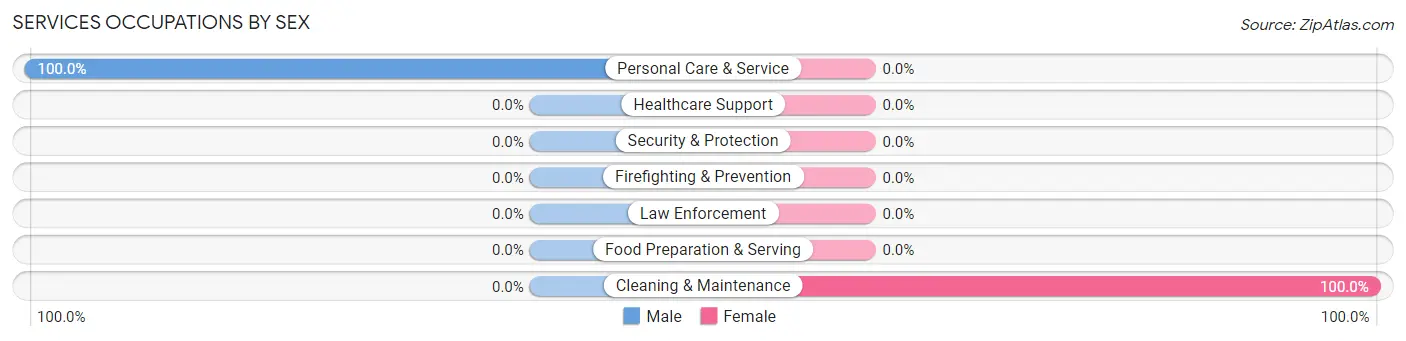
| Occupation | Male | Female |
| Healthcare Support | 0 (0.0%) | 0 (0.0%) |
| Security & Protection | 0 (0.0%) | 0 (0.0%) |
| Firefighting & Prevention | 0 (0.0%) | 0 (0.0%) |
| Law Enforcement | 0 (0.0%) | 0 (0.0%) |
| Food Preparation & Serving | 0 (0.0%) | 0 (0.0%) |
| Cleaning & Maintenance | 0 (0.0%) | 13 (100.0%) |
| Personal Care & Service | 4 (100.0%) | 0 (0.0%) |
| Total (Category) | 4 (23.5%) | 13 (76.5%) |
| Total (Overall) | 77 (44.5%) | 96 (55.5%) |
Sales and Office Occupations
The most common Sales and Office occupations in Point Place are Office & Administration (24 | 13.9%), and Sales & Related (4 | 2.3%).
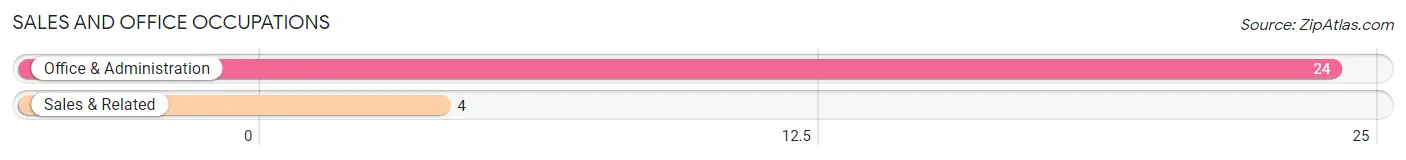
Sales and Office Occupations by Sex

| Occupation | Male | Female |
| Sales & Related | 4 (100.0%) | 0 (0.0%) |
| Office & Administration | 0 (0.0%) | 24 (100.0%) |
| Total (Category) | 4 (14.3%) | 24 (85.7%) |
| Total (Overall) | 77 (44.5%) | 96 (55.5%) |
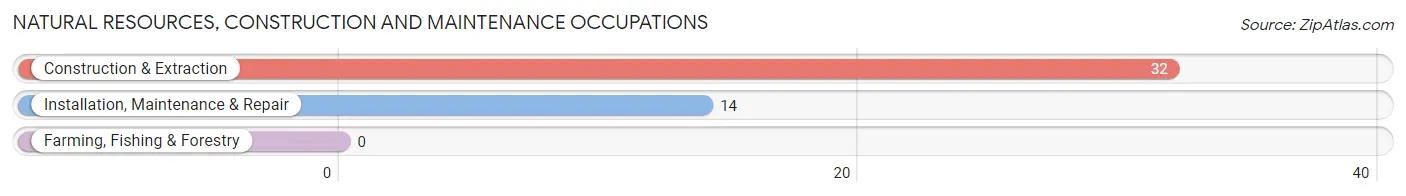
Natural Resources, Construction and Maintenance Occupations
The most common Natural Resources, Construction and Maintenance occupations in Point Place are Construction & Extraction (32 | 18.5%), and Installation, Maintenance & Repair (14 | 8.1%).
Natural Resources, Construction and Maintenance Occupations by Sex
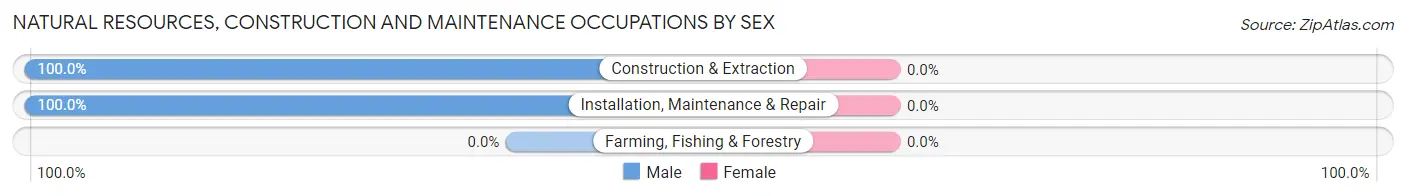
| Occupation | Male | Female |
| Farming, Fishing & Forestry | 0 (0.0%) | 0 (0.0%) |
| Construction & Extraction | 32 (100.0%) | 0 (0.0%) |
| Installation, Maintenance & Repair | 14 (100.0%) | 0 (0.0%) |
| Total (Category) | 46 (100.0%) | 0 (0.0%) |
| Total (Overall) | 77 (44.5%) | 96 (55.5%) |
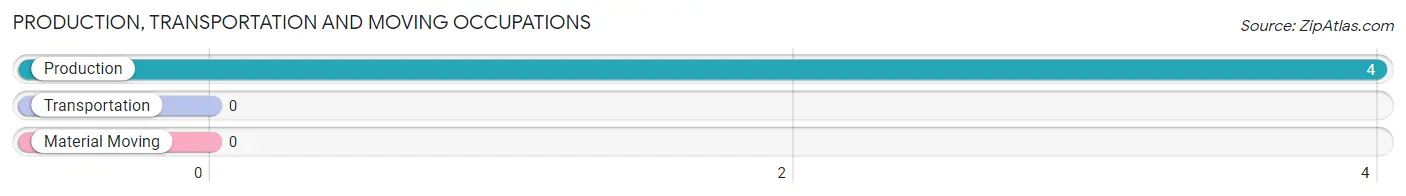
Production, Transportation and Moving Occupations
The most common Production, Transportation and Moving occupations in Point Place are , and Production (4 | 2.3%).
Production, Transportation and Moving Occupations by Sex
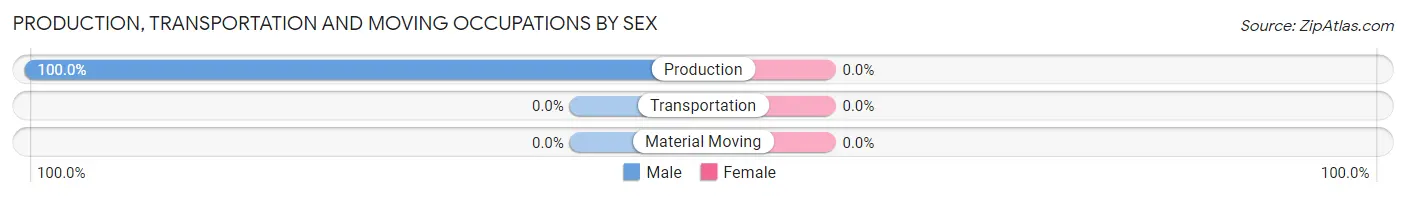
| Occupation | Male | Female |
| Production | 4 (100.0%) | 0 (0.0%) |
| Transportation | 0 (0.0%) | 0 (0.0%) |
| Material Moving | 0 (0.0%) | 0 (0.0%) |
| Total (Category) | 4 (100.0%) | 0 (0.0%) |
| Total (Overall) | 77 (44.5%) | 96 (55.5%) |
Employment Industries by Sex in Point Place
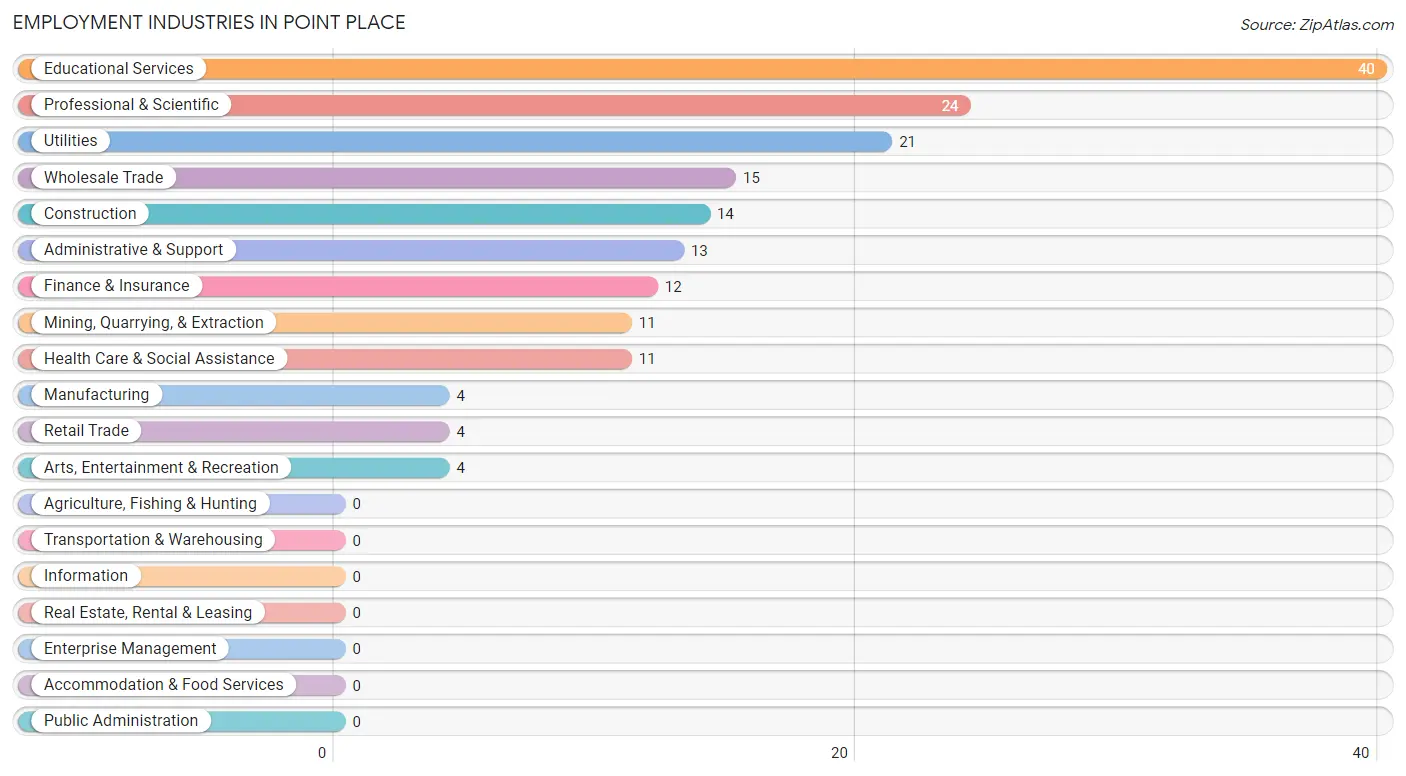
Employment Industries in Point Place
The major employment industries in Point Place include Educational Services (40 | 23.1%), Professional & Scientific (24 | 13.9%), Utilities (21 | 12.1%), Wholesale Trade (15 | 8.7%), and Construction (14 | 8.1%).
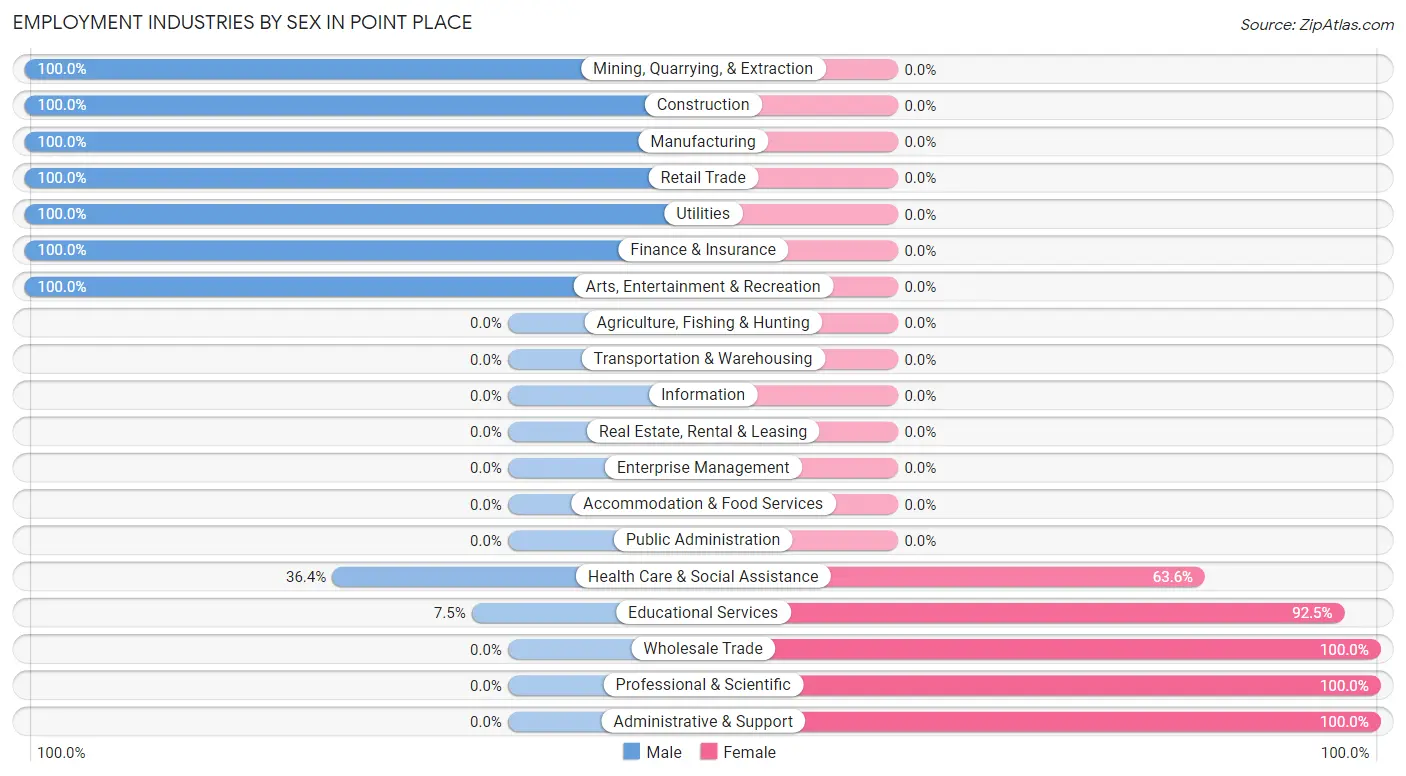
Employment Industries by Sex in Point Place
The Point Place industries that see more men than women are Mining, Quarrying, & Extraction (100.0%), Construction (100.0%), and Manufacturing (100.0%), whereas the industries that tend to have a higher number of women are Wholesale Trade (100.0%), Professional & Scientific (100.0%), and Administrative & Support (100.0%).
| Industry | Male | Female |
| Agriculture, Fishing & Hunting | 0 (0.0%) | 0 (0.0%) |
| Mining, Quarrying, & Extraction | 11 (100.0%) | 0 (0.0%) |
| Construction | 14 (100.0%) | 0 (0.0%) |
| Manufacturing | 4 (100.0%) | 0 (0.0%) |
| Wholesale Trade | 0 (0.0%) | 15 (100.0%) |
| Retail Trade | 4 (100.0%) | 0 (0.0%) |
| Transportation & Warehousing | 0 (0.0%) | 0 (0.0%) |
| Utilities | 21 (100.0%) | 0 (0.0%) |
| Information | 0 (0.0%) | 0 (0.0%) |
| Finance & Insurance | 12 (100.0%) | 0 (0.0%) |
| Real Estate, Rental & Leasing | 0 (0.0%) | 0 (0.0%) |
| Professional & Scientific | 0 (0.0%) | 24 (100.0%) |
| Enterprise Management | 0 (0.0%) | 0 (0.0%) |
| Administrative & Support | 0 (0.0%) | 13 (100.0%) |
| Educational Services | 3 (7.5%) | 37 (92.5%) |
| Health Care & Social Assistance | 4 (36.4%) | 7 (63.6%) |
| Arts, Entertainment & Recreation | 4 (100.0%) | 0 (0.0%) |
| Accommodation & Food Services | 0 (0.0%) | 0 (0.0%) |
| Public Administration | 0 (0.0%) | 0 (0.0%) |
| Total | 77 (44.5%) | 96 (55.5%) |
Education in Point Place
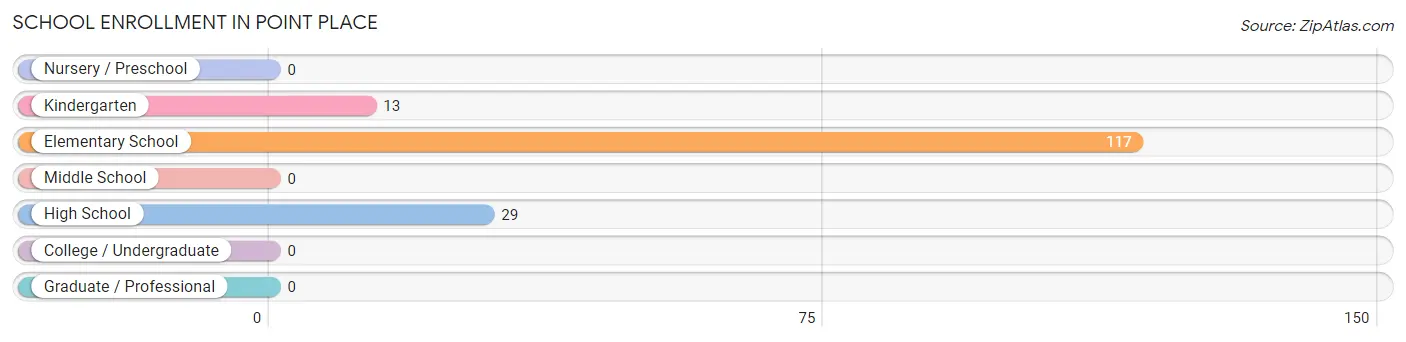
School Enrollment in Point Place
The most common levels of schooling among the 159 students in Point Place are elementary school (117 | 73.6%), high school (29 | 18.2%), and kindergarten (13 | 8.2%).
| School Level | # Students | % Students |
| Nursery / Preschool | 0 | 0.0% |
| Kindergarten | 13 | 8.2% |
| Elementary School | 117 | 73.6% |
| Middle School | 0 | 0.0% |
| High School | 29 | 18.2% |
| College / Undergraduate | 0 | 0.0% |
| Graduate / Professional | 0 | 0.0% |
| Total | 159 | 100.0% |
School Enrollment by Age by Funding Source in Point Place
Out of a total of 159 students who are enrolled in schools in Point Place, 89 (56.0%) attend a private institution, while the remaining 70 (44.0%) are enrolled in public schools. The age group of 15 to 17 year olds has the highest likelihood of being enrolled in private schools, with 18 (62.1% in the age bracket) enrolled. Conversely, the age group of 10 to 14 year olds has the lowest likelihood of being enrolled in a private school, with 10 (100.0% in the age bracket) attending a public institution.
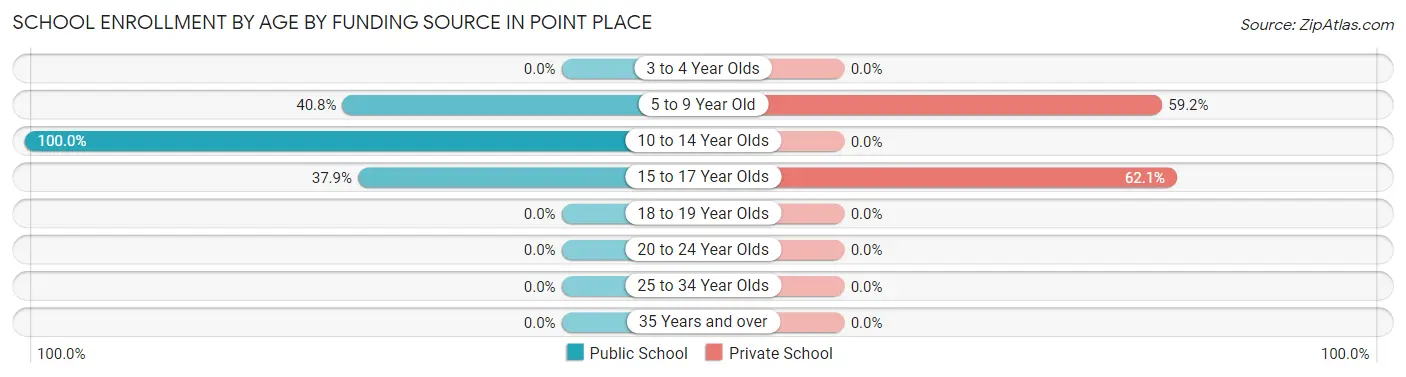
| Age Bracket | Public School | Private School |
| 3 to 4 Year Olds | 0 (0.0%) | 0 (0.0%) |
| 5 to 9 Year Old | 49 (40.8%) | 71 (59.2%) |
| 10 to 14 Year Olds | 10 (100.0%) | 0 (0.0%) |
| 15 to 17 Year Olds | 11 (37.9%) | 18 (62.1%) |
| 18 to 19 Year Olds | 0 (0.0%) | 0 (0.0%) |
| 20 to 24 Year Olds | 0 (0.0%) | 0 (0.0%) |
| 25 to 34 Year Olds | 0 (0.0%) | 0 (0.0%) |
| 35 Years and over | 0 (0.0%) | 0 (0.0%) |
| Total | 70 (44.0%) | 89 (56.0%) |
Educational Attainment by Field of Study in Point Place
Psychology (31 | 36.9%), business (17 | 20.2%), science & technology (9 | 10.7%), communications (9 | 10.7%), and engineering (7 | 8.3%) are the most common fields of study among 84 individuals in Point Place who have obtained a bachelor's degree or higher.
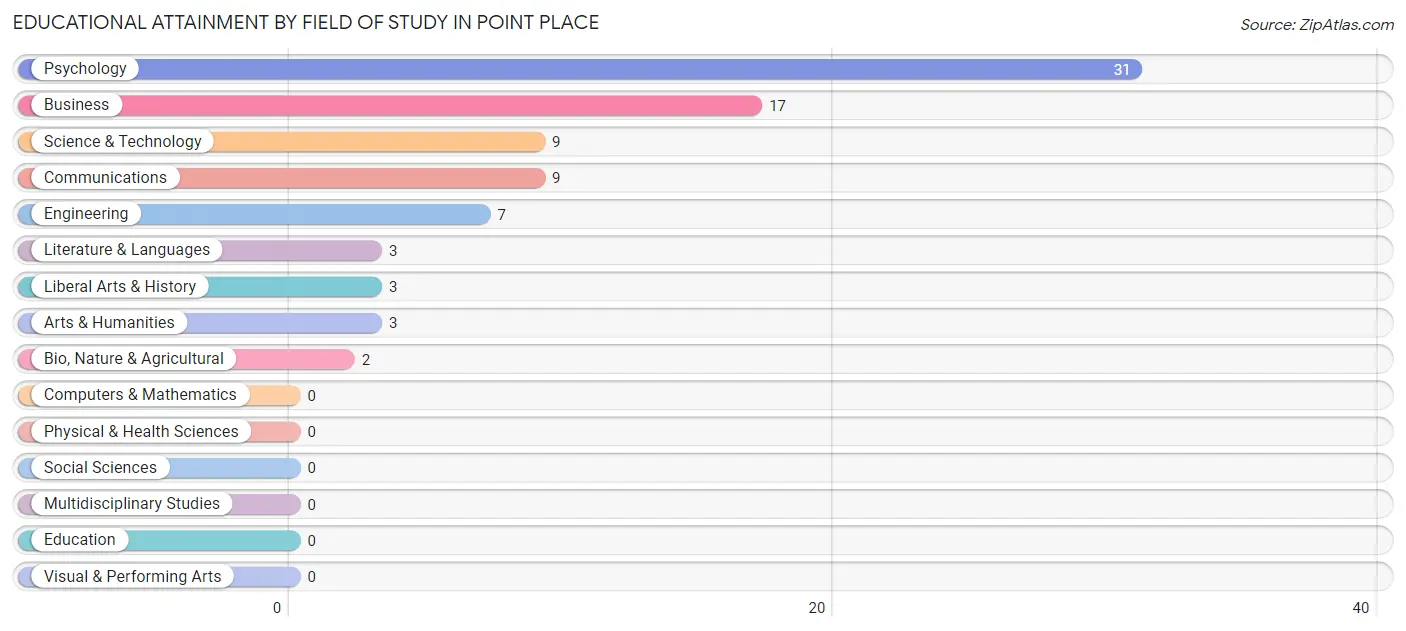
| Field of Study | # Graduates | % Graduates |
| Computers & Mathematics | 0 | 0.0% |
| Bio, Nature & Agricultural | 2 | 2.4% |
| Physical & Health Sciences | 0 | 0.0% |
| Psychology | 31 | 36.9% |
| Social Sciences | 0 | 0.0% |
| Engineering | 7 | 8.3% |
| Multidisciplinary Studies | 0 | 0.0% |
| Science & Technology | 9 | 10.7% |
| Business | 17 | 20.2% |
| Education | 0 | 0.0% |
| Literature & Languages | 3 | 3.6% |
| Liberal Arts & History | 3 | 3.6% |
| Visual & Performing Arts | 0 | 0.0% |
| Communications | 9 | 10.7% |
| Arts & Humanities | 3 | 3.6% |
| Total | 84 | 100.0% |
Transportation & Commute in Point Place
Vehicle Availability by Sex in Point Place
The most prevalent vehicle ownership categories in Point Place are males with 2 vehicles (64, accounting for 83.1%) and females with 2 vehicles (75, making up 66.7%).
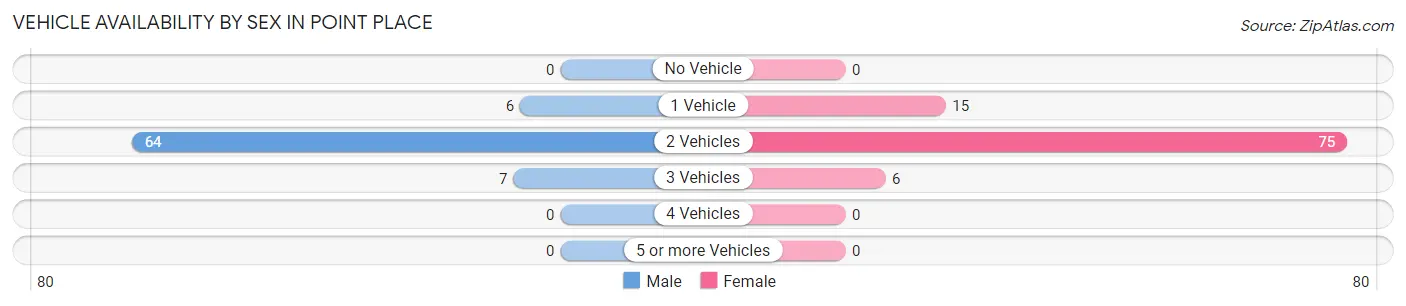
| Vehicles Available | Male | Female |
| No Vehicle | 0 (0.0%) | 0 (0.0%) |
| 1 Vehicle | 6 (7.8%) | 15 (15.6%) |
| 2 Vehicles | 64 (83.1%) | 75 (78.1%) |
| 3 Vehicles | 7 (9.1%) | 6 (6.2%) |
| 4 Vehicles | 0 (0.0%) | 0 (0.0%) |
| 5 or more Vehicles | 0 (0.0%) | 0 (0.0%) |
| Total | 77 (100.0%) | 96 (100.0%) |
Commute Time in Point Place
The most frequently occuring commute durations in Point Place are 20 to 24 minutes (52 commuters, 30.1%), 15 to 19 minutes (43 commuters, 24.9%), and 5 to 9 minutes (15 commuters, 8.7%).
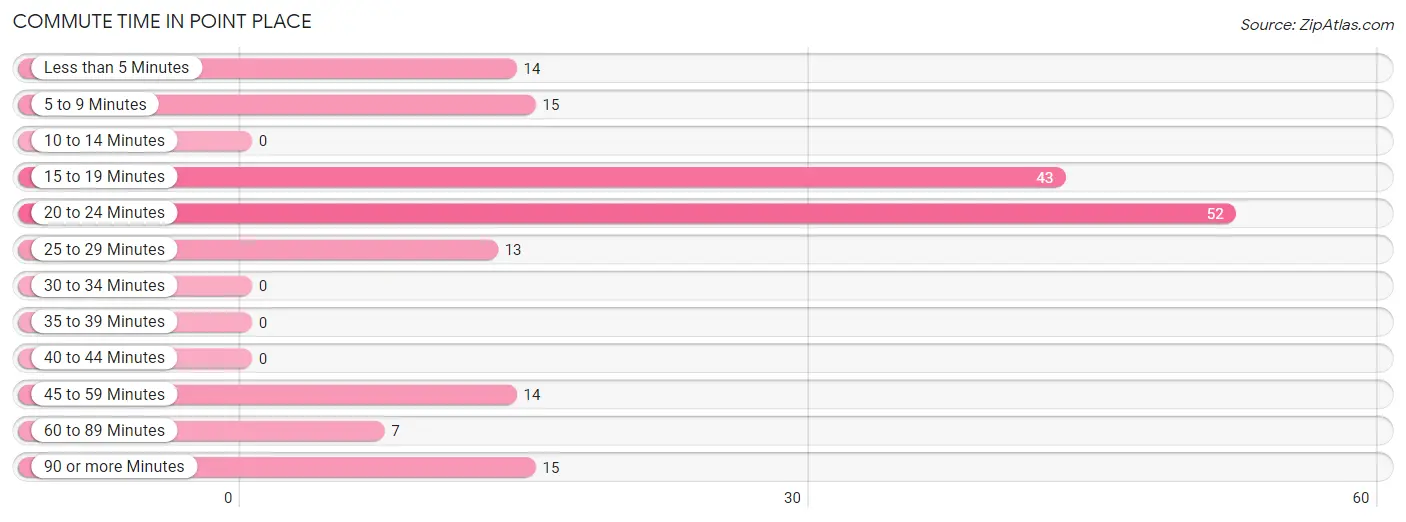
| Commute Time | # Commuters | % Commuters |
| Less than 5 Minutes | 14 | 8.1% |
| 5 to 9 Minutes | 15 | 8.7% |
| 10 to 14 Minutes | 0 | 0.0% |
| 15 to 19 Minutes | 43 | 24.9% |
| 20 to 24 Minutes | 52 | 30.1% |
| 25 to 29 Minutes | 13 | 7.5% |
| 30 to 34 Minutes | 0 | 0.0% |
| 35 to 39 Minutes | 0 | 0.0% |
| 40 to 44 Minutes | 0 | 0.0% |
| 45 to 59 Minutes | 14 | 8.1% |
| 60 to 89 Minutes | 7 | 4.1% |
| 90 or more Minutes | 15 | 8.7% |
Commute Time by Sex in Point Place
The most common commute times in Point Place are 20 to 24 minutes (21 commuters, 27.3%) for males and 20 to 24 minutes (31 commuters, 32.3%) for females.
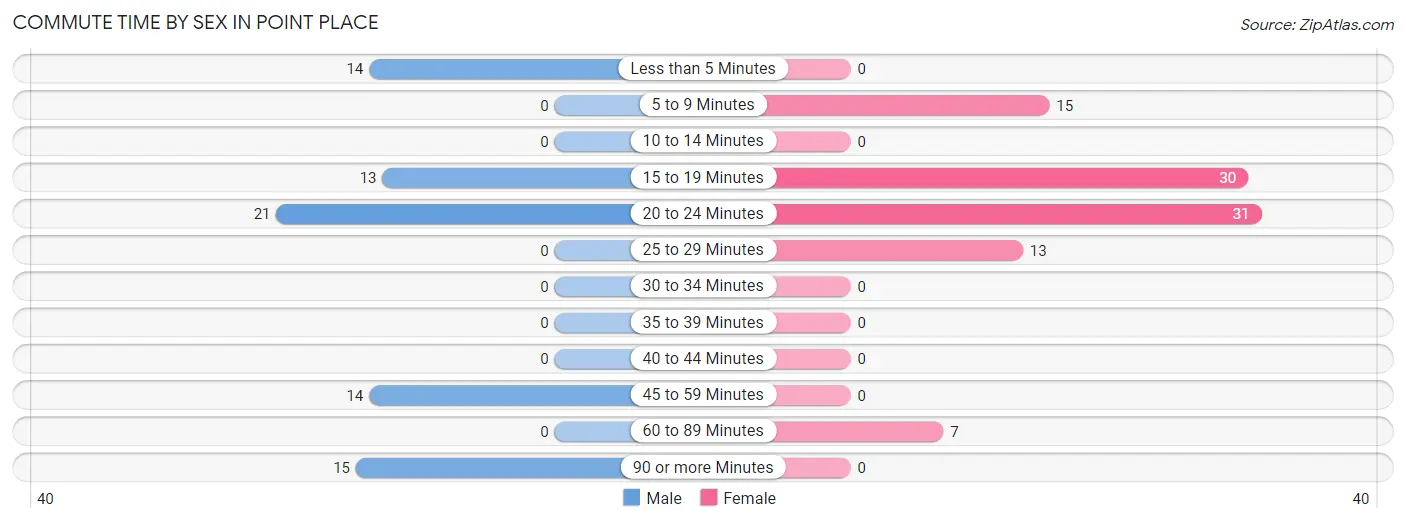
| Commute Time | Male | Female |
| Less than 5 Minutes | 14 (18.2%) | 0 (0.0%) |
| 5 to 9 Minutes | 0 (0.0%) | 15 (15.6%) |
| 10 to 14 Minutes | 0 (0.0%) | 0 (0.0%) |
| 15 to 19 Minutes | 13 (16.9%) | 30 (31.2%) |
| 20 to 24 Minutes | 21 (27.3%) | 31 (32.3%) |
| 25 to 29 Minutes | 0 (0.0%) | 13 (13.5%) |
| 30 to 34 Minutes | 0 (0.0%) | 0 (0.0%) |
| 35 to 39 Minutes | 0 (0.0%) | 0 (0.0%) |
| 40 to 44 Minutes | 0 (0.0%) | 0 (0.0%) |
| 45 to 59 Minutes | 14 (18.2%) | 0 (0.0%) |
| 60 to 89 Minutes | 0 (0.0%) | 7 (7.3%) |
| 90 or more Minutes | 15 (19.5%) | 0 (0.0%) |
Time of Departure to Work by Sex in Point Place
The most frequent times of departure to work in Point Place are 7:00 AM to 7:29 AM (44, 57.1%) for males and 7:00 AM to 7:29 AM (78, 81.2%) for females.
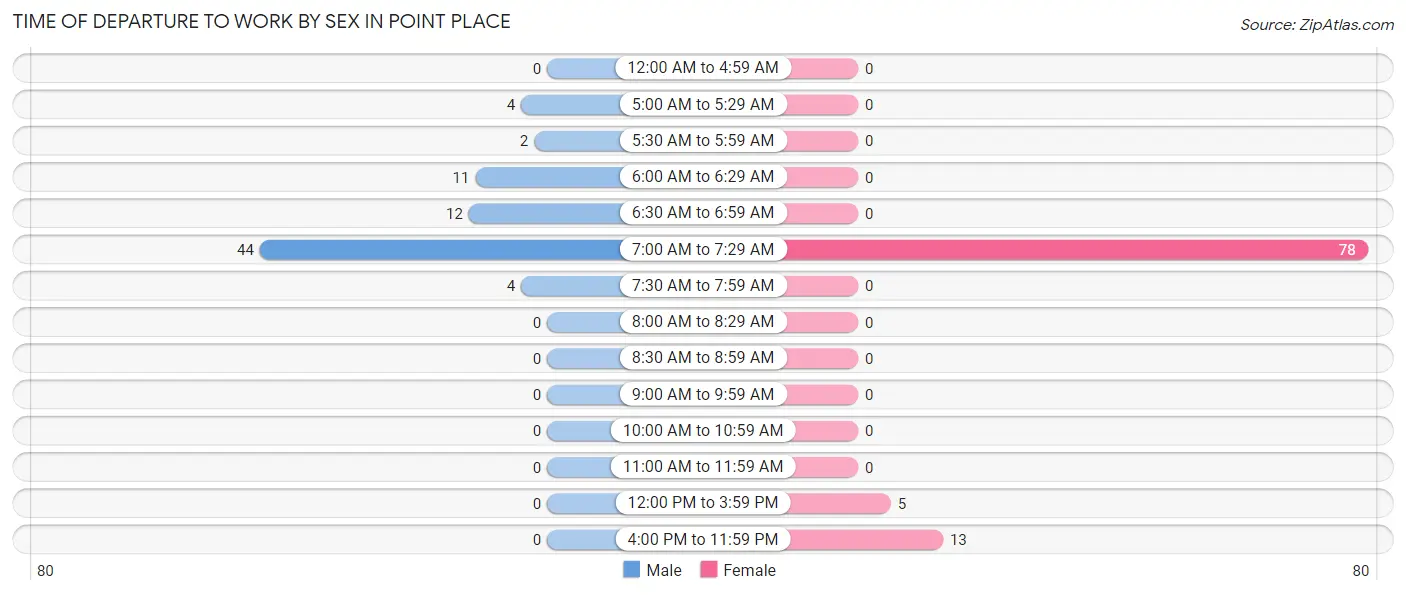
| Time of Departure | Male | Female |
| 12:00 AM to 4:59 AM | 0 (0.0%) | 0 (0.0%) |
| 5:00 AM to 5:29 AM | 4 (5.2%) | 0 (0.0%) |
| 5:30 AM to 5:59 AM | 2 (2.6%) | 0 (0.0%) |
| 6:00 AM to 6:29 AM | 11 (14.3%) | 0 (0.0%) |
| 6:30 AM to 6:59 AM | 12 (15.6%) | 0 (0.0%) |
| 7:00 AM to 7:29 AM | 44 (57.1%) | 78 (81.2%) |
| 7:30 AM to 7:59 AM | 4 (5.2%) | 0 (0.0%) |
| 8:00 AM to 8:29 AM | 0 (0.0%) | 0 (0.0%) |
| 8:30 AM to 8:59 AM | 0 (0.0%) | 0 (0.0%) |
| 9:00 AM to 9:59 AM | 0 (0.0%) | 0 (0.0%) |
| 10:00 AM to 10:59 AM | 0 (0.0%) | 0 (0.0%) |
| 11:00 AM to 11:59 AM | 0 (0.0%) | 0 (0.0%) |
| 12:00 PM to 3:59 PM | 0 (0.0%) | 5 (5.2%) |
| 4:00 PM to 11:59 PM | 0 (0.0%) | 13 (13.5%) |
| Total | 77 (100.0%) | 96 (100.0%) |
Housing Occupancy in Point Place
Occupancy by Ownership in Point Place
Of the total 283 dwellings in Point Place, owner-occupied units account for 254 (89.7%), while renter-occupied units make up 29 (10.2%).
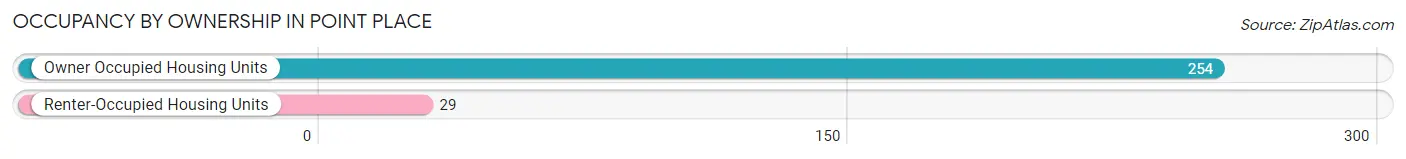
| Occupancy | # Housing Units | % Housing Units |
| Owner Occupied Housing Units | 254 | 89.7% |
| Renter-Occupied Housing Units | 29 | 10.2% |
| Total Occupied Housing Units | 283 | 100.0% |
Occupancy by Household Size in Point Place
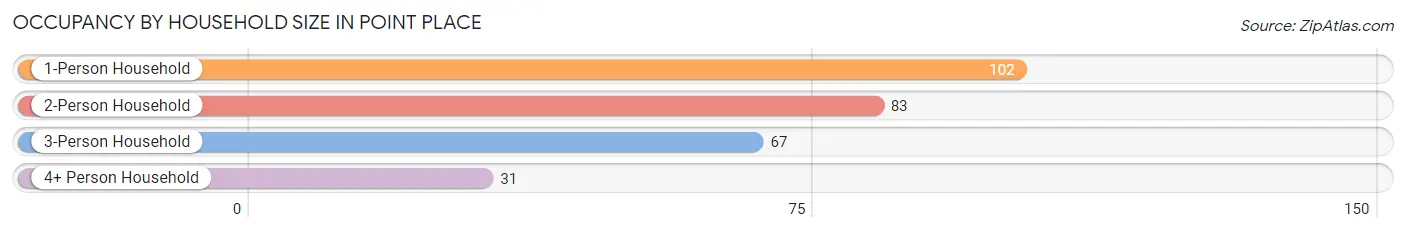
| Household Size | # Housing Units | % Housing Units |
| 1-Person Household | 102 | 36.0% |
| 2-Person Household | 83 | 29.3% |
| 3-Person Household | 67 | 23.7% |
| 4+ Person Household | 31 | 11.0% |
| Total Housing Units | 283 | 100.0% |
Occupancy by Ownership by Household Size in Point Place
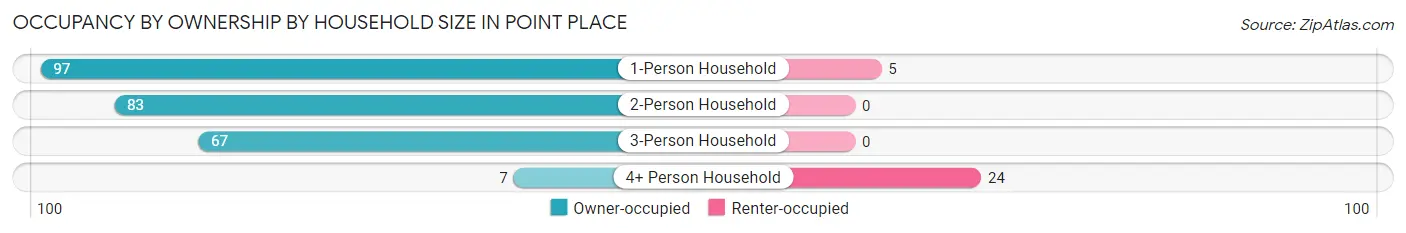
| Household Size | Owner-occupied | Renter-occupied |
| 1-Person Household | 97 (95.1%) | 5 (4.9%) |
| 2-Person Household | 83 (100.0%) | 0 (0.0%) |
| 3-Person Household | 67 (100.0%) | 0 (0.0%) |
| 4+ Person Household | 7 (22.6%) | 24 (77.4%) |
| Total Housing Units | 254 (89.7%) | 29 (10.2%) |
Occupancy by Educational Attainment in Point Place
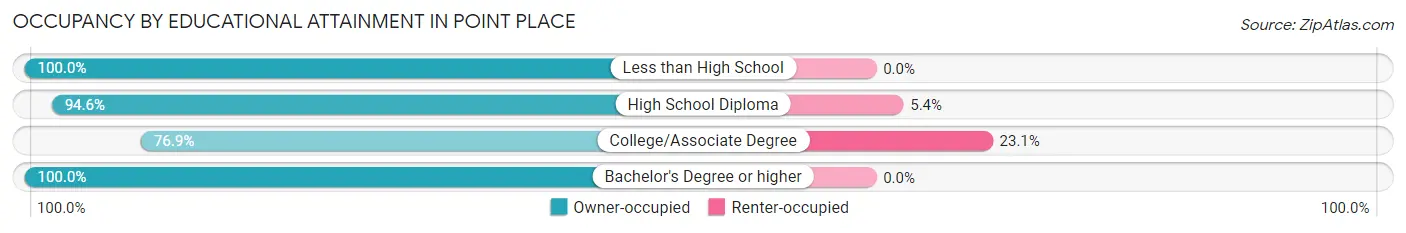
| Household Size | Owner-occupied | Renter-occupied |
| Less than High School | 29 (100.0%) | 0 (0.0%) |
| High School Diploma | 88 (94.6%) | 5 (5.4%) |
| College/Associate Degree | 80 (76.9%) | 24 (23.1%) |
| Bachelor's Degree or higher | 57 (100.0%) | 0 (0.0%) |
Occupancy by Age of Householder in Point Place
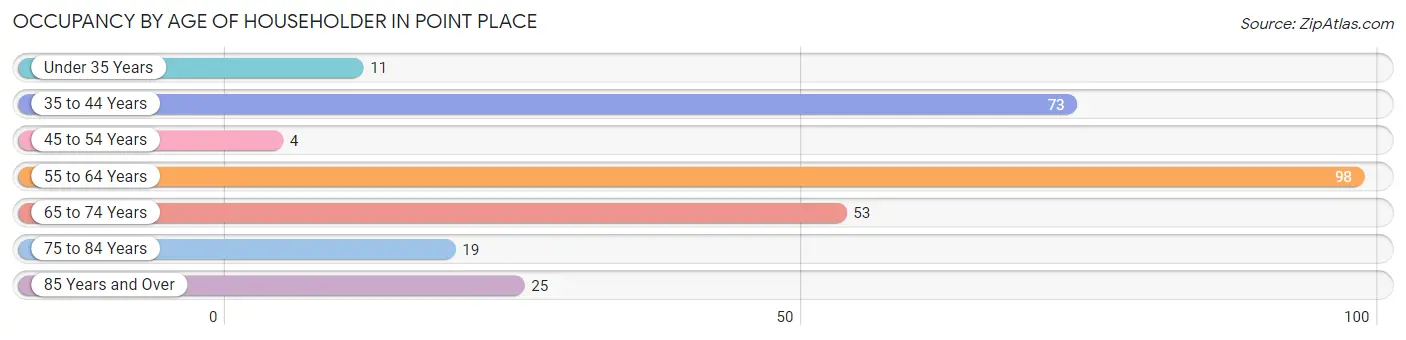
| Age Bracket | # Households | % Households |
| Under 35 Years | 11 | 3.9% |
| 35 to 44 Years | 73 | 25.8% |
| 45 to 54 Years | 4 | 1.4% |
| 55 to 64 Years | 98 | 34.6% |
| 65 to 74 Years | 53 | 18.7% |
| 75 to 84 Years | 19 | 6.7% |
| 85 Years and Over | 25 | 8.8% |
| Total | 283 | 100.0% |
Housing Finances in Point Place
Median Income by Occupancy in Point Place
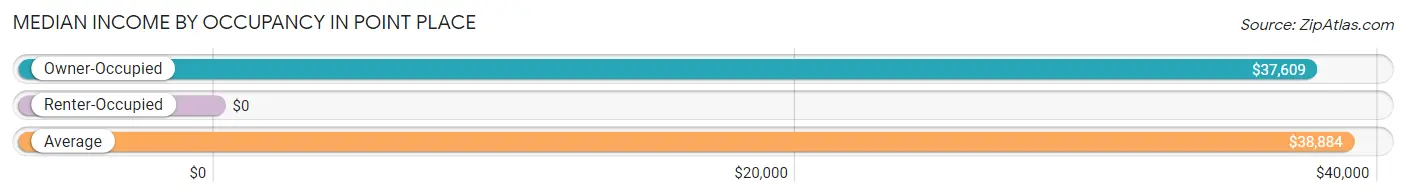
| Occupancy Type | # Households | Median Income |
| Owner-Occupied | 254 (89.7%) | $37,609 |
| Renter-Occupied | 29 (10.2%) | $0 |
| Average | 283 (100.0%) | $38,884 |
Occupancy by Householder Income Bracket in Point Place
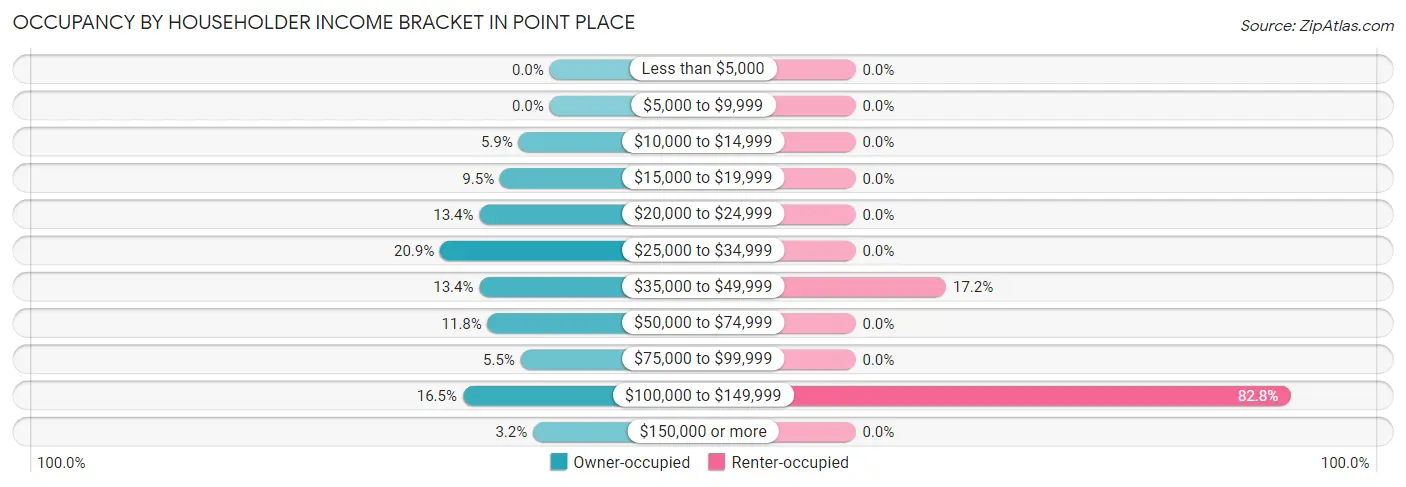
| Income Bracket | Owner-occupied | Renter-occupied |
| Less than $5,000 | 0 (0.0%) | 0 (0.0%) |
| $5,000 to $9,999 | 0 (0.0%) | 0 (0.0%) |
| $10,000 to $14,999 | 15 (5.9%) | 0 (0.0%) |
| $15,000 to $19,999 | 24 (9.5%) | 0 (0.0%) |
| $20,000 to $24,999 | 34 (13.4%) | 0 (0.0%) |
| $25,000 to $34,999 | 53 (20.9%) | 0 (0.0%) |
| $35,000 to $49,999 | 34 (13.4%) | 5 (17.2%) |
| $50,000 to $74,999 | 30 (11.8%) | 0 (0.0%) |
| $75,000 to $99,999 | 14 (5.5%) | 0 (0.0%) |
| $100,000 to $149,999 | 42 (16.5%) | 24 (82.8%) |
| $150,000 or more | 8 (3.2%) | 0 (0.0%) |
| Total | 254 (100.0%) | 29 (100.0%) |
Monthly Housing Cost Tiers in Point Place
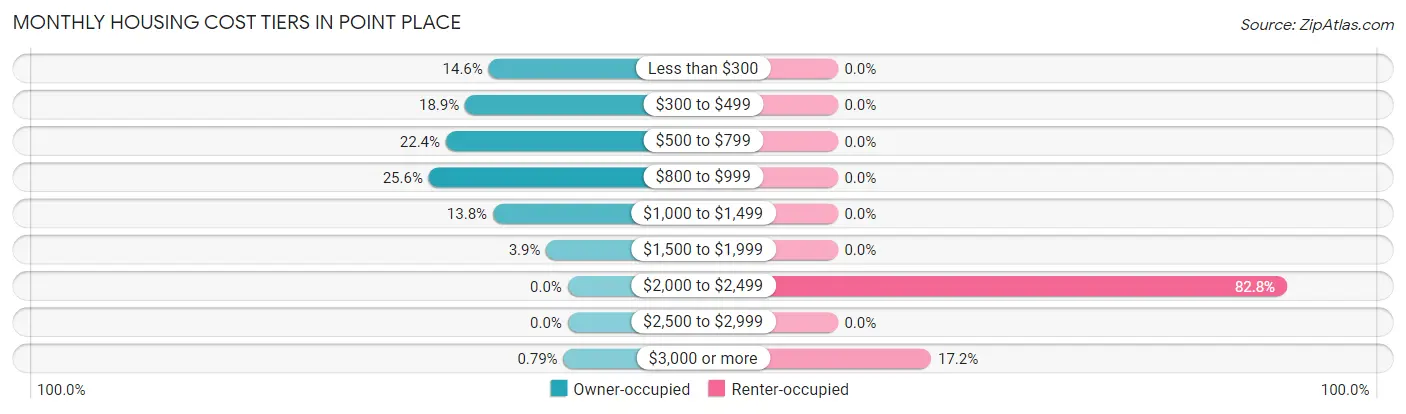
| Monthly Cost | Owner-occupied | Renter-occupied |
| Less than $300 | 37 (14.6%) | 0 (0.0%) |
| $300 to $499 | 48 (18.9%) | 0 (0.0%) |
| $500 to $799 | 57 (22.4%) | 0 (0.0%) |
| $800 to $999 | 65 (25.6%) | 0 (0.0%) |
| $1,000 to $1,499 | 35 (13.8%) | 0 (0.0%) |
| $1,500 to $1,999 | 10 (3.9%) | 0 (0.0%) |
| $2,000 to $2,499 | 0 (0.0%) | 24 (82.8%) |
| $2,500 to $2,999 | 0 (0.0%) | 0 (0.0%) |
| $3,000 or more | 2 (0.8%) | 5 (17.2%) |
| Total | 254 (100.0%) | 29 (100.0%) |
Physical Housing Characteristics in Point Place
Housing Structures in Point Place
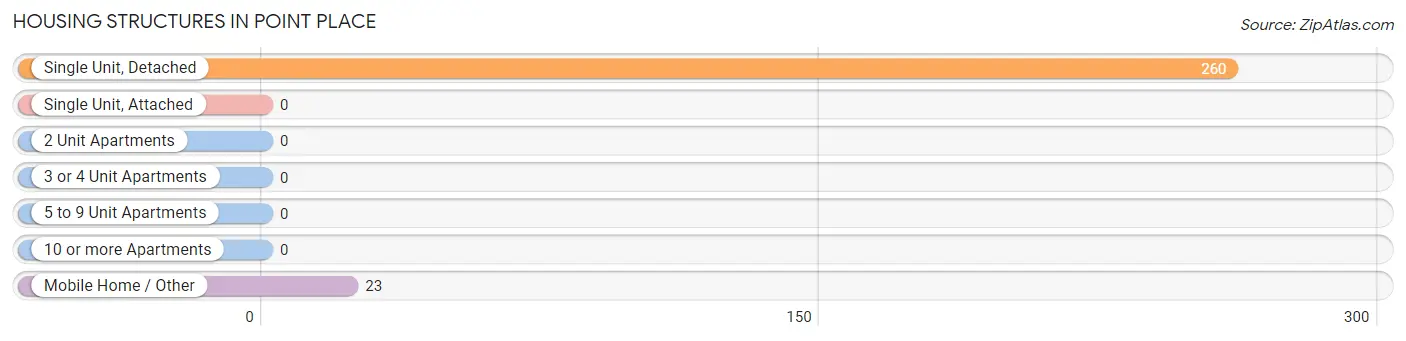
| Structure Type | # Housing Units | % Housing Units |
| Single Unit, Detached | 260 | 91.9% |
| Single Unit, Attached | 0 | 0.0% |
| 2 Unit Apartments | 0 | 0.0% |
| 3 or 4 Unit Apartments | 0 | 0.0% |
| 5 to 9 Unit Apartments | 0 | 0.0% |
| 10 or more Apartments | 0 | 0.0% |
| Mobile Home / Other | 23 | 8.1% |
| Total | 283 | 100.0% |
Housing Structures by Occupancy in Point Place
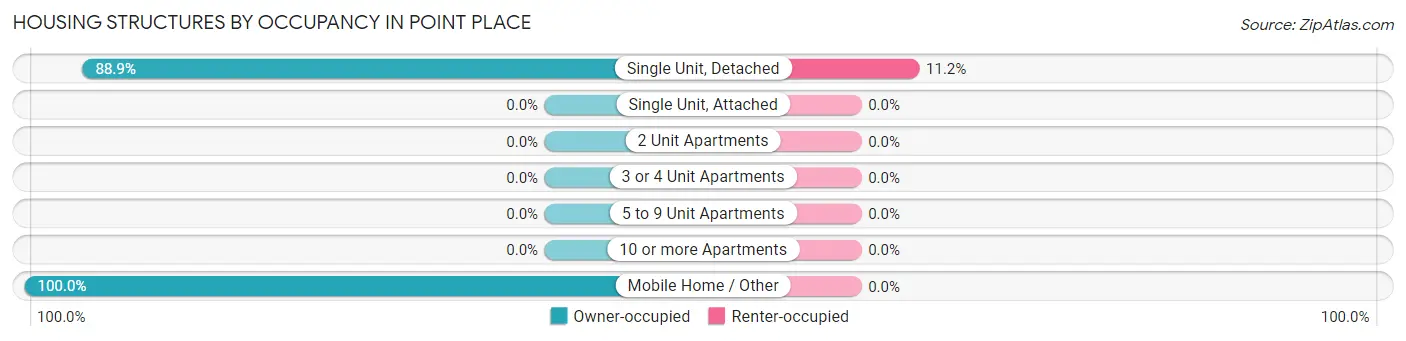
| Structure Type | Owner-occupied | Renter-occupied |
| Single Unit, Detached | 231 (88.8%) | 29 (11.2%) |
| Single Unit, Attached | 0 (0.0%) | 0 (0.0%) |
| 2 Unit Apartments | 0 (0.0%) | 0 (0.0%) |
| 3 or 4 Unit Apartments | 0 (0.0%) | 0 (0.0%) |
| 5 to 9 Unit Apartments | 0 (0.0%) | 0 (0.0%) |
| 10 or more Apartments | 0 (0.0%) | 0 (0.0%) |
| Mobile Home / Other | 23 (100.0%) | 0 (0.0%) |
| Total | 254 (89.7%) | 29 (10.2%) |
Housing Structures by Number of Rooms in Point Place
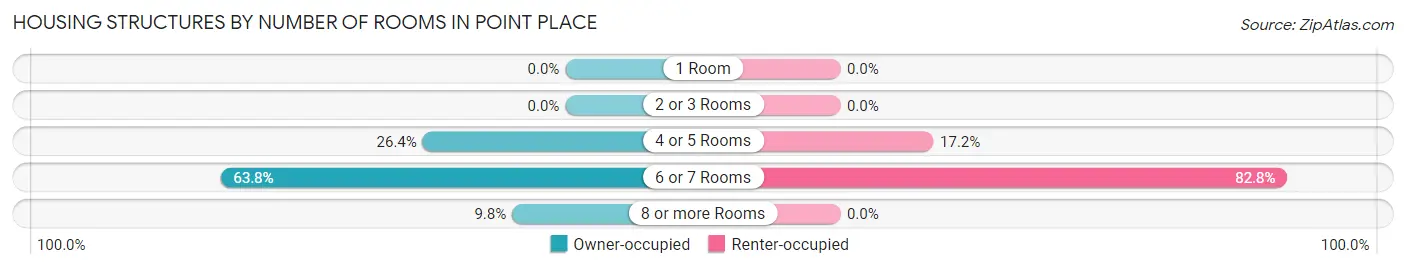
| Number of Rooms | Owner-occupied | Renter-occupied |
| 1 Room | 0 (0.0%) | 0 (0.0%) |
| 2 or 3 Rooms | 0 (0.0%) | 0 (0.0%) |
| 4 or 5 Rooms | 67 (26.4%) | 5 (17.2%) |
| 6 or 7 Rooms | 162 (63.8%) | 24 (82.8%) |
| 8 or more Rooms | 25 (9.8%) | 0 (0.0%) |
| Total | 254 (100.0%) | 29 (100.0%) |
Housing Structure by Heating Type in Point Place
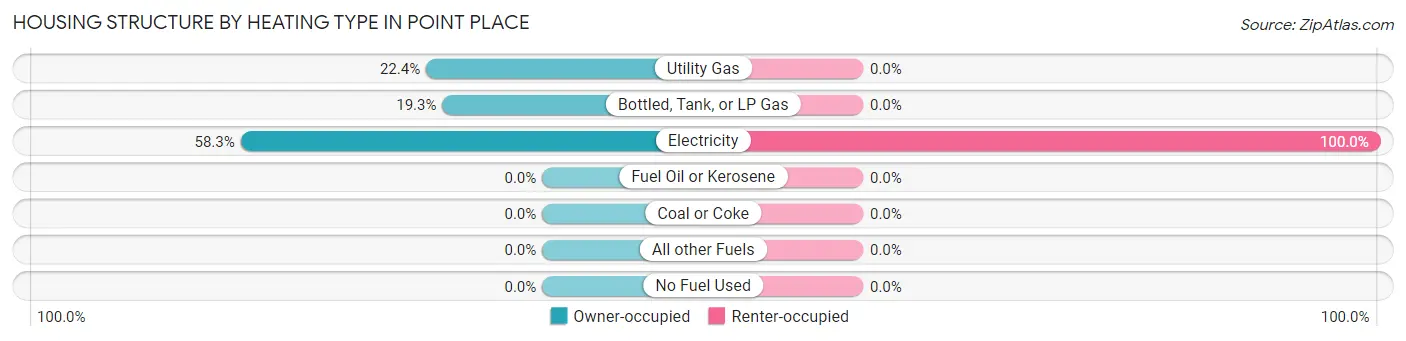
| Heating Type | Owner-occupied | Renter-occupied |
| Utility Gas | 57 (22.4%) | 0 (0.0%) |
| Bottled, Tank, or LP Gas | 49 (19.3%) | 0 (0.0%) |
| Electricity | 148 (58.3%) | 29 (100.0%) |
| Fuel Oil or Kerosene | 0 (0.0%) | 0 (0.0%) |
| Coal or Coke | 0 (0.0%) | 0 (0.0%) |
| All other Fuels | 0 (0.0%) | 0 (0.0%) |
| No Fuel Used | 0 (0.0%) | 0 (0.0%) |
| Total | 254 (100.0%) | 29 (100.0%) |
Household Vehicle Usage in Point Place
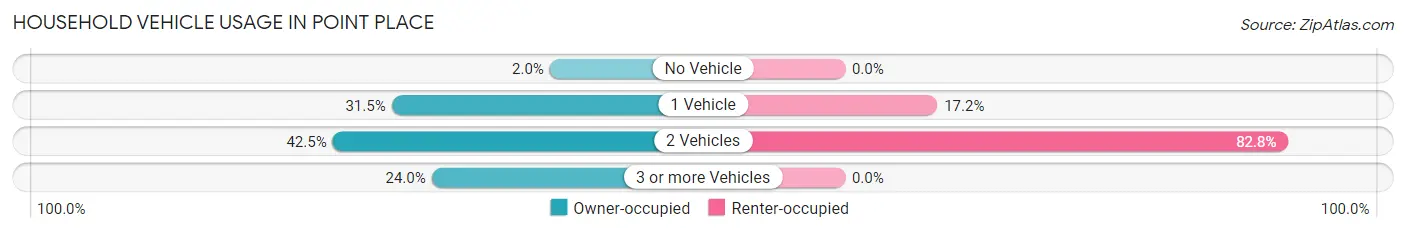
| Vehicles per Household | Owner-occupied | Renter-occupied |
| No Vehicle | 5 (2.0%) | 0 (0.0%) |
| 1 Vehicle | 80 (31.5%) | 5 (17.2%) |
| 2 Vehicles | 108 (42.5%) | 24 (82.8%) |
| 3 or more Vehicles | 61 (24.0%) | 0 (0.0%) |
| Total | 254 (100.0%) | 29 (100.0%) |
Real Estate & Mortgages in Point Place
Real Estate and Mortgage Overview in Point Place
| Characteristic | Without Mortgage | With Mortgage |
| Housing Units | 190 | 64 |
| Median Property Value | $191,700 | $218,200 |
| Median Household Income | $34,292 | $5 |
| Monthly Housing Costs | $520 | $2 |
| Real Estate Taxes | $1,047 | $18 |
Property Value by Mortgage Status in Point Place
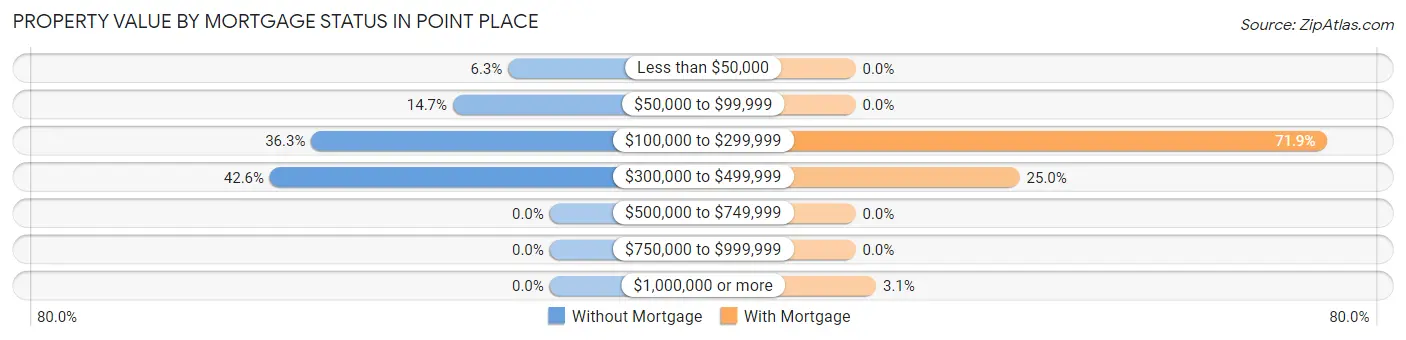
| Property Value | Without Mortgage | With Mortgage |
| Less than $50,000 | 12 (6.3%) | 0 (0.0%) |
| $50,000 to $99,999 | 28 (14.7%) | 0 (0.0%) |
| $100,000 to $299,999 | 69 (36.3%) | 46 (71.9%) |
| $300,000 to $499,999 | 81 (42.6%) | 16 (25.0%) |
| $500,000 to $749,999 | 0 (0.0%) | 0 (0.0%) |
| $750,000 to $999,999 | 0 (0.0%) | 0 (0.0%) |
| $1,000,000 or more | 0 (0.0%) | 2 (3.1%) |
| Total | 190 (100.0%) | 64 (100.0%) |
Household Income by Mortgage Status in Point Place
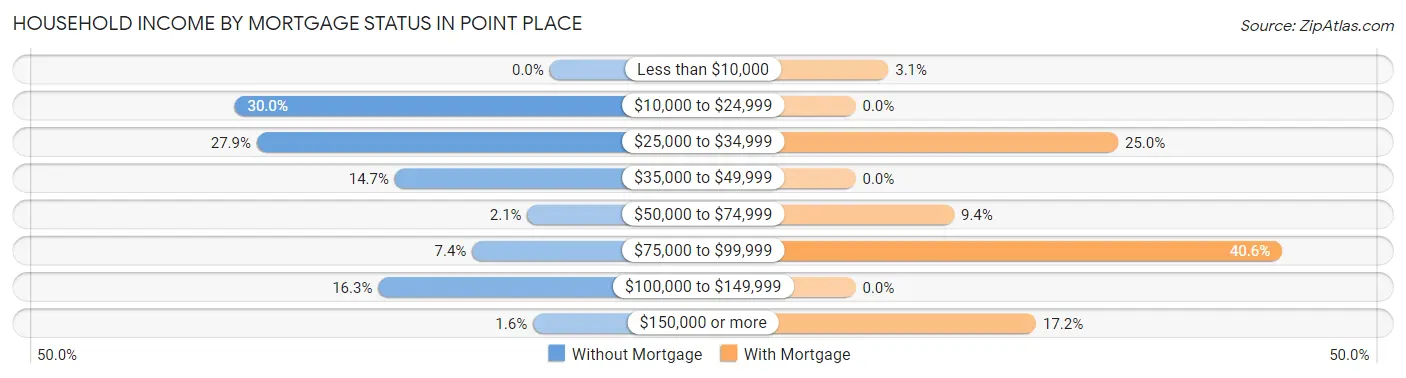
| Household Income | Without Mortgage | With Mortgage |
| Less than $10,000 | 0 (0.0%) | 2 (3.1%) |
| $10,000 to $24,999 | 57 (30.0%) | 0 (0.0%) |
| $25,000 to $34,999 | 53 (27.9%) | 16 (25.0%) |
| $35,000 to $49,999 | 28 (14.7%) | 0 (0.0%) |
| $50,000 to $74,999 | 4 (2.1%) | 6 (9.4%) |
| $75,000 to $99,999 | 14 (7.4%) | 26 (40.6%) |
| $100,000 to $149,999 | 31 (16.3%) | 0 (0.0%) |
| $150,000 or more | 3 (1.6%) | 11 (17.2%) |
| Total | 190 (100.0%) | 64 (100.0%) |
Property Value to Household Income Ratio in Point Place
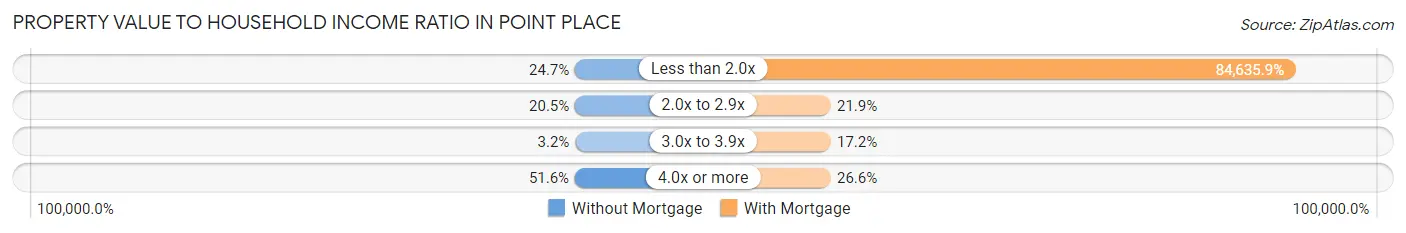
| Value-to-Income Ratio | Without Mortgage | With Mortgage |
| Less than 2.0x | 47 (24.7%) | 54,167 (84,635.9%) |
| 2.0x to 2.9x | 39 (20.5%) | 14 (21.9%) |
| 3.0x to 3.9x | 6 (3.2%) | 11 (17.2%) |
| 4.0x or more | 98 (51.6%) | 17 (26.6%) |
| Total | 190 (100.0%) | 64 (100.0%) |
Real Estate Taxes by Mortgage Status in Point Place
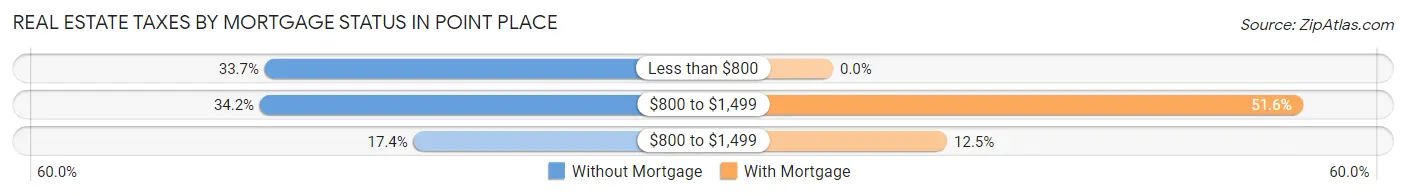
| Property Taxes | Without Mortgage | With Mortgage |
| Less than $800 | 64 (33.7%) | 0 (0.0%) |
| $800 to $1,499 | 65 (34.2%) | 33 (51.6%) |
| $800 to $1,499 | 33 (17.4%) | 8 (12.5%) |
| Total | 190 (100.0%) | 64 (100.0%) |
Health & Disability in Point Place
Health Insurance Coverage by Age in Point Place
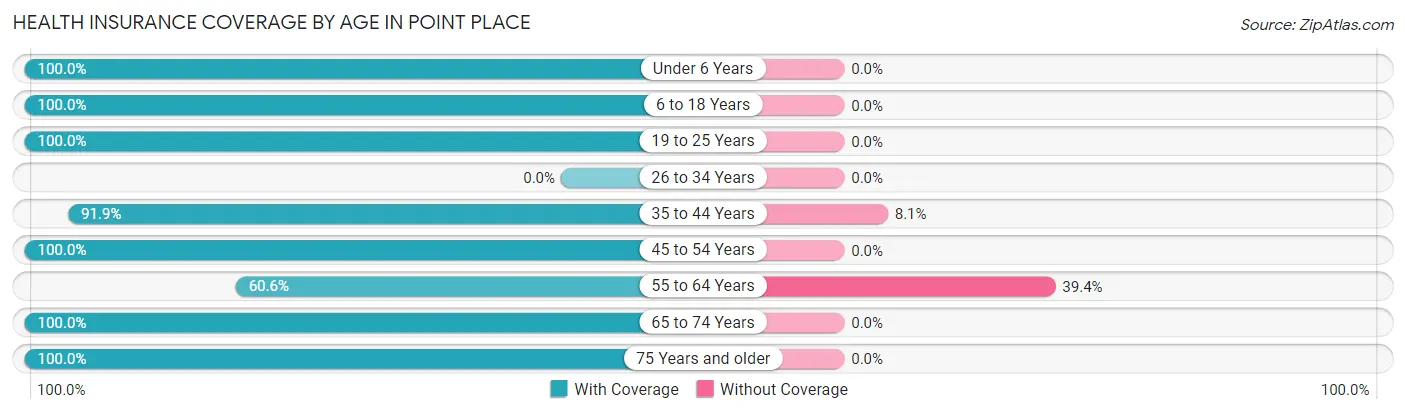
| Age Bracket | With Coverage | Without Coverage |
| Under 6 Years | 39 (100.0%) | 0 (0.0%) |
| 6 to 18 Years | 146 (100.0%) | 0 (0.0%) |
| 19 to 25 Years | 24 (100.0%) | 0 (0.0%) |
| 26 to 34 Years | 0 (0.0%) | 0 (0.0%) |
| 35 to 44 Years | 102 (91.9%) | 9 (8.1%) |
| 45 to 54 Years | 17 (100.0%) | 0 (0.0%) |
| 55 to 64 Years | 77 (60.6%) | 50 (39.4%) |
| 65 to 74 Years | 100 (100.0%) | 0 (0.0%) |
| 75 Years and older | 49 (100.0%) | 0 (0.0%) |
| Total | 554 (90.4%) | 59 (9.6%) |
Health Insurance Coverage by Citizenship Status in Point Place

| Citizenship Status | With Coverage | Without Coverage |
| Native Born | 39 (100.0%) | 0 (0.0%) |
| Foreign Born, Citizen | 146 (100.0%) | 0 (0.0%) |
| Foreign Born, not a Citizen | 24 (100.0%) | 0 (0.0%) |
Health Insurance Coverage by Household Income in Point Place
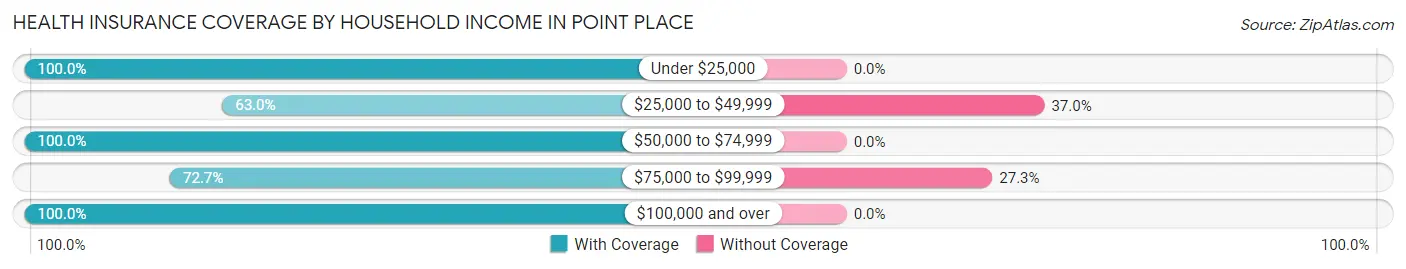
| Household Income | With Coverage | Without Coverage |
| Under $25,000 | 87 (100.0%) | 0 (0.0%) |
| $25,000 to $49,999 | 85 (63.0%) | 50 (37.0%) |
| $50,000 to $74,999 | 114 (100.0%) | 0 (0.0%) |
| $75,000 to $99,999 | 24 (72.7%) | 9 (27.3%) |
| $100,000 and over | 244 (100.0%) | 0 (0.0%) |
Public vs Private Health Insurance Coverage by Age in Point Place
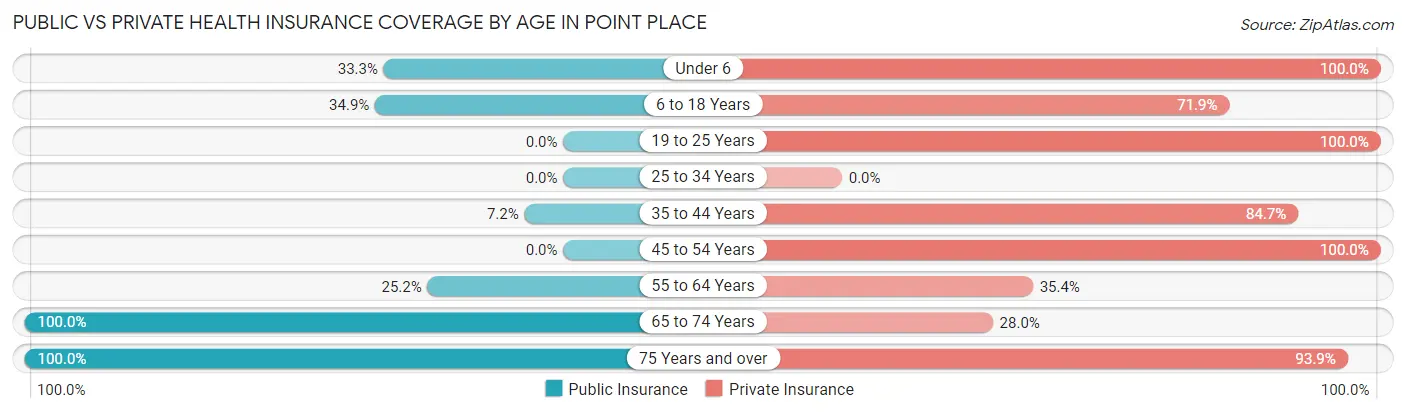
| Age Bracket | Public Insurance | Private Insurance |
| Under 6 | 13 (33.3%) | 39 (100.0%) |
| 6 to 18 Years | 51 (34.9%) | 105 (71.9%) |
| 19 to 25 Years | 0 (0.0%) | 24 (100.0%) |
| 25 to 34 Years | 0 (0.0%) | 0 (0.0%) |
| 35 to 44 Years | 8 (7.2%) | 94 (84.7%) |
| 45 to 54 Years | 0 (0.0%) | 17 (100.0%) |
| 55 to 64 Years | 32 (25.2%) | 45 (35.4%) |
| 65 to 74 Years | 100 (100.0%) | 28 (28.0%) |
| 75 Years and over | 49 (100.0%) | 46 (93.9%) |
| Total | 253 (41.3%) | 398 (64.9%) |
Disability Status by Sex by Age in Point Place
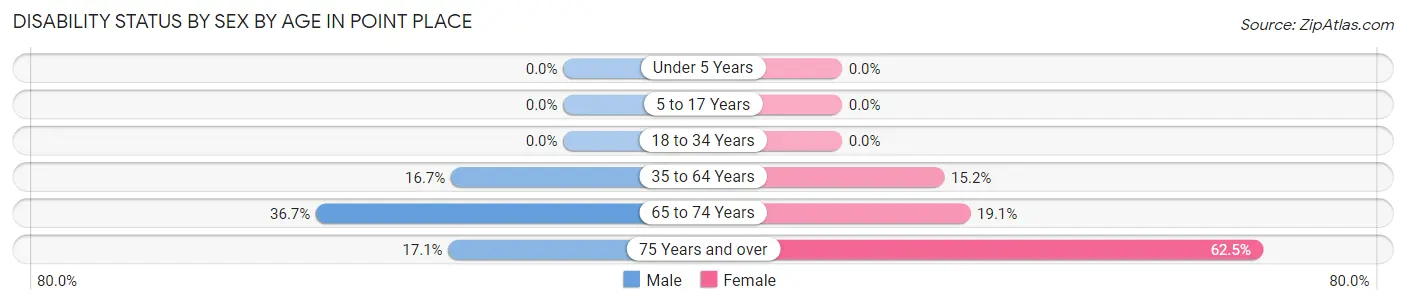
| Age Bracket | Male | Female |
| Under 5 Years | 0 (0.0%) | 0 (0.0%) |
| 5 to 17 Years | 0 (0.0%) | 0 (0.0%) |
| 18 to 34 Years | 0 (0.0%) | 0 (0.0%) |
| 35 to 64 Years | 14 (16.7%) | 26 (15.2%) |
| 65 to 74 Years | 29 (36.7%) | 4 (19.1%) |
| 75 Years and over | 7 (17.1%) | 5 (62.5%) |
Disability Class by Sex by Age in Point Place
Disability Class: Hearing Difficulty
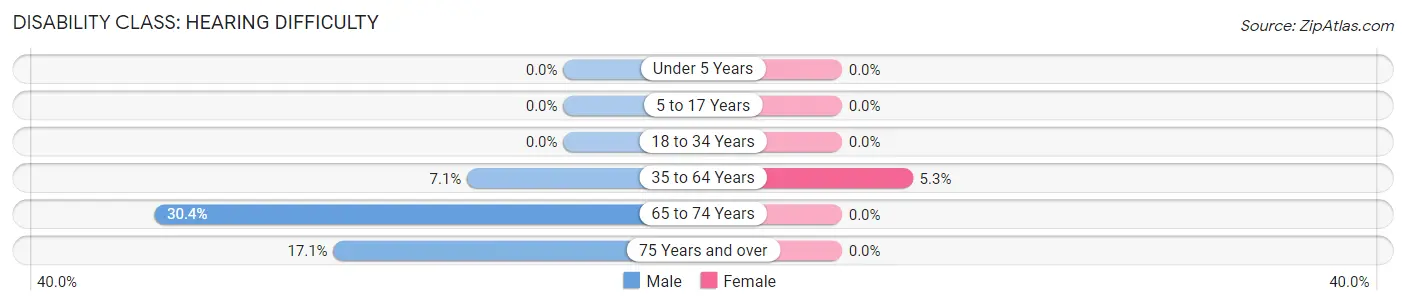
| Age Bracket | Male | Female |
| Under 5 Years | 0 (0.0%) | 0 (0.0%) |
| 5 to 17 Years | 0 (0.0%) | 0 (0.0%) |
| 18 to 34 Years | 0 (0.0%) | 0 (0.0%) |
| 35 to 64 Years | 6 (7.1%) | 9 (5.3%) |
| 65 to 74 Years | 24 (30.4%) | 0 (0.0%) |
| 75 Years and over | 7 (17.1%) | 0 (0.0%) |
Disability Class: Vision Difficulty
| Age Bracket | Male | Female |
| Under 5 Years | 0 (0.0%) | 0 (0.0%) |
| 5 to 17 Years | 0 (0.0%) | 0 (0.0%) |
| 18 to 34 Years | 0 (0.0%) | 0 (0.0%) |
| 35 to 64 Years | 0 (0.0%) | 0 (0.0%) |
| 65 to 74 Years | 0 (0.0%) | 0 (0.0%) |
| 75 Years and over | 0 (0.0%) | 0 (0.0%) |
Disability Class: Cognitive Difficulty
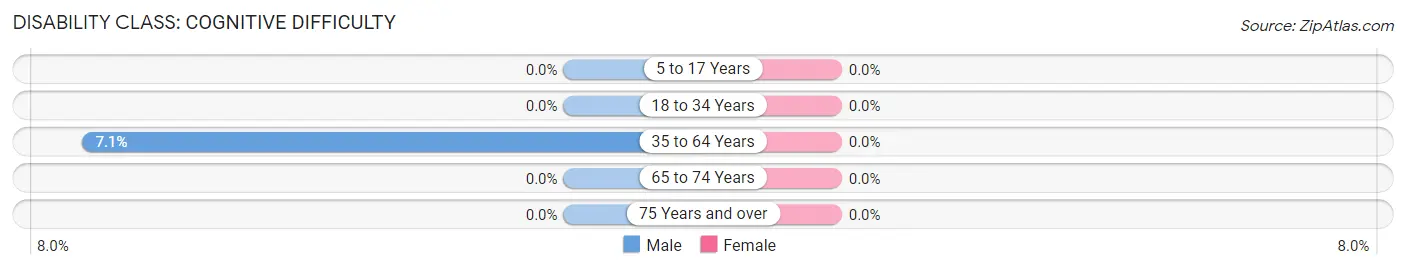
| Age Bracket | Male | Female |
| 5 to 17 Years | 0 (0.0%) | 0 (0.0%) |
| 18 to 34 Years | 0 (0.0%) | 0 (0.0%) |
| 35 to 64 Years | 6 (7.1%) | 0 (0.0%) |
| 65 to 74 Years | 0 (0.0%) | 0 (0.0%) |
| 75 Years and over | 0 (0.0%) | 0 (0.0%) |
Disability Class: Ambulatory Difficulty
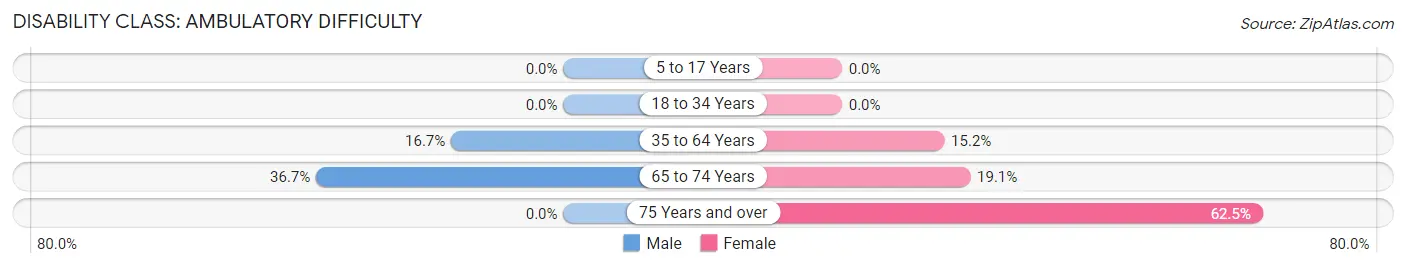
| Age Bracket | Male | Female |
| 5 to 17 Years | 0 (0.0%) | 0 (0.0%) |
| 18 to 34 Years | 0 (0.0%) | 0 (0.0%) |
| 35 to 64 Years | 14 (16.7%) | 26 (15.2%) |
| 65 to 74 Years | 29 (36.7%) | 4 (19.1%) |
| 75 Years and over | 0 (0.0%) | 5 (62.5%) |
Disability Class: Self-Care Difficulty
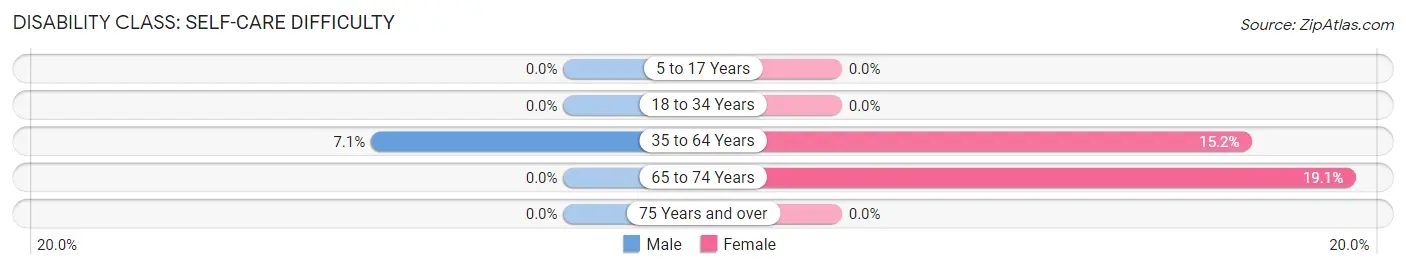
| Age Bracket | Male | Female |
| 5 to 17 Years | 0 (0.0%) | 0 (0.0%) |
| 18 to 34 Years | 0 (0.0%) | 0 (0.0%) |
| 35 to 64 Years | 6 (7.1%) | 26 (15.2%) |
| 65 to 74 Years | 0 (0.0%) | 4 (19.1%) |
| 75 Years and over | 0 (0.0%) | 0 (0.0%) |
Technology Access in Point Place
Computing Device Access in Point Place
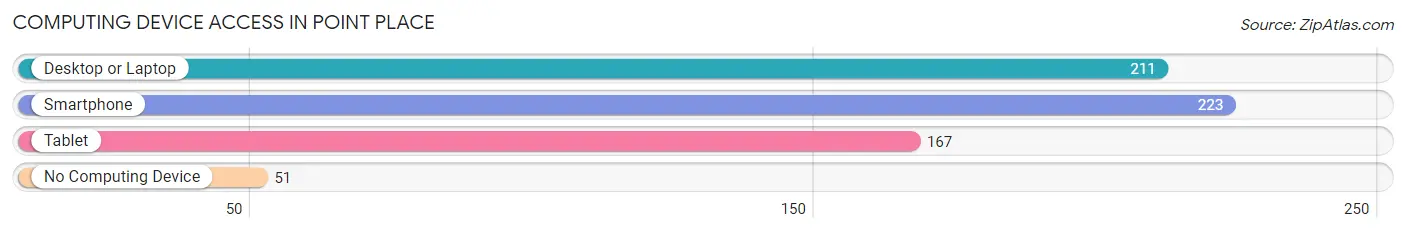
| Device Type | # Households | % Households |
| Desktop or Laptop | 211 | 74.6% |
| Smartphone | 223 | 78.8% |
| Tablet | 167 | 59.0% |
| No Computing Device | 51 | 18.0% |
| Total | 283 | 100.0% |
Internet Access in Point Place
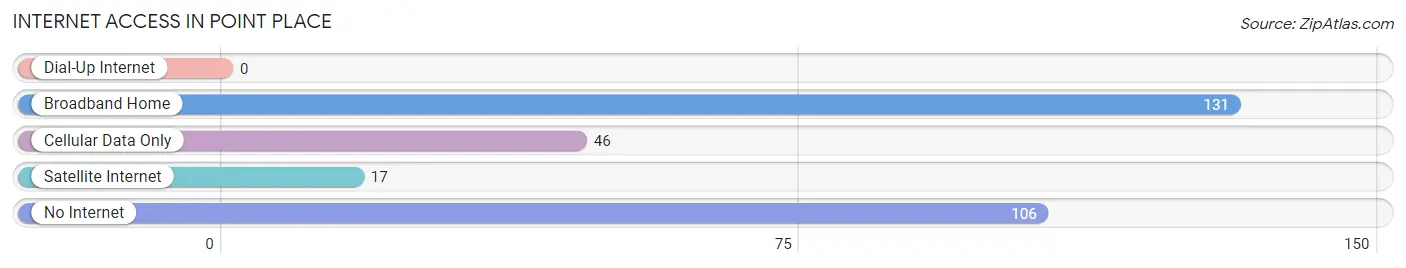
| Internet Type | # Households | % Households |
| Dial-Up Internet | 0 | 0.0% |
| Broadband Home | 131 | 46.3% |
| Cellular Data Only | 46 | 16.3% |
| Satellite Internet | 17 | 6.0% |
| No Internet | 106 | 37.5% |
| Total | 283 | 100.0% |
Point Place Summary
Point Place is a small community located in the state of Louisiana, United States. It is situated in the parish of Pointe Coupee, which is part of the Baton Rouge Metropolitan Statistical Area. The population of Point Place was estimated to be 1,845 in the year 2000.
Geography
Point Place is located in the southeastern part of Louisiana, in the parish of Pointe Coupee. It is situated on the banks of the Mississippi River, about 25 miles northwest of Baton Rouge. The town is surrounded by a number of small towns and villages, including Livonia, New Roads, and Ventress. The terrain of the area is mostly flat, with some rolling hills. The climate is humid subtropical, with hot summers and mild winters.
History
Point Place was founded in the early 1800s by French settlers. The town was originally known as “Pointe Coupee”, and was a major trading post for the area. In the mid-1800s, the town was renamed “Point Place”, and it became a popular destination for steamboat travelers. The town was also home to a number of plantations, and the economy was largely based on the production of cotton and sugar.
In the late 1800s, the town began to decline due to the decline of the steamboat industry. However, the town was revitalized in the early 1900s with the construction of the Point Place Bridge, which connected the town to the nearby city of Baton Rouge. The bridge was a major factor in the growth of the town, and it allowed for the development of new businesses and industries.
Economy
The economy of Point Place is largely based on agriculture and tourism. The town is home to a number of farms, which produce a variety of crops, including cotton, corn, soybeans, and sugar cane. The town is also home to a number of tourist attractions, including the Point Place Bridge, the Point Place Museum, and the Point Place Marina.
Demographics
As of the 2000 census, the population of Point Place was 1,845. The racial makeup of the town was 79.2% White, 19.2% African American, 0.3% Native American, 0.2% Asian, and 0.9% from other races. The median household income was $30,938, and the median family income was $37,813. The per capita income was $15,945.
Conclusion
Point Place is a small community located in the state of Louisiana, United States. It is situated in the parish of Pointe Coupee, which is part of the Baton Rouge Metropolitan Statistical Area. The population of Point Place was estimated to be 1,845 in the year 2000. The economy of Point Place is largely based on agriculture and tourism, and the town is home to a number of tourist attractions. The racial makeup of the town was 79.2% White, 19.2% African American, 0.3% Native American, 0.2% Asian, and 0.9% from other races. The median household income was $30,938, and the median family income was $37,813.
Common Questions
What is the Total Population of Point Place?
Total Population of Point Place is 613.
What is the Total Male Population of Point Place?
Total Male Population of Point Place is 346.
What is the Total Female Population of Point Place?
Total Female Population of Point Place is 267.
What is the Ratio of Males per 100 Females in Point Place?
There are 129.59 Males per 100 Females in Point Place.
What is the Ratio of Females per 100 Males in Point Place?
There are 77.17 Females per 100 Males in Point Place.
What is the Median Population Age in Point Place?
Median Population Age in Point Place is 43.7 Years.
What is the Average Family Size in Point Place
Average Family Size in Point Place is 2.8 People.
What is the Average Household Size in Point Place
Average Household Size in Point Place is 2.2 People.
What is Per Capita Income in Point Place?
Per Capita income in Point Place is $27,528.
What is the Median Household income in Point Place?
Median Household Income in Point Place is $38,884.
What is Income or Wage Gap in Point Place?
Income or Wage Gap in Point Place is 40.4%.
Women in Point Place earn 59.6 cents for every dollar earned by a man.
What is Inequality or Gini Index in Point Place?
Inequality or Gini Index in Point Place is 0.42.
How Large is the Labor Force in Point Place?
There are 189 People in the Labor Forcein in Point Place.
What is the Percentage of People in the Labor Force in Point Place?
41.9% of People are in the Labor Force in Point Place.
What is the Unemployment Rate in Point Place?
Unemployment Rate in Point Place is 8.5%.