West Baton Rouge Parish, LA
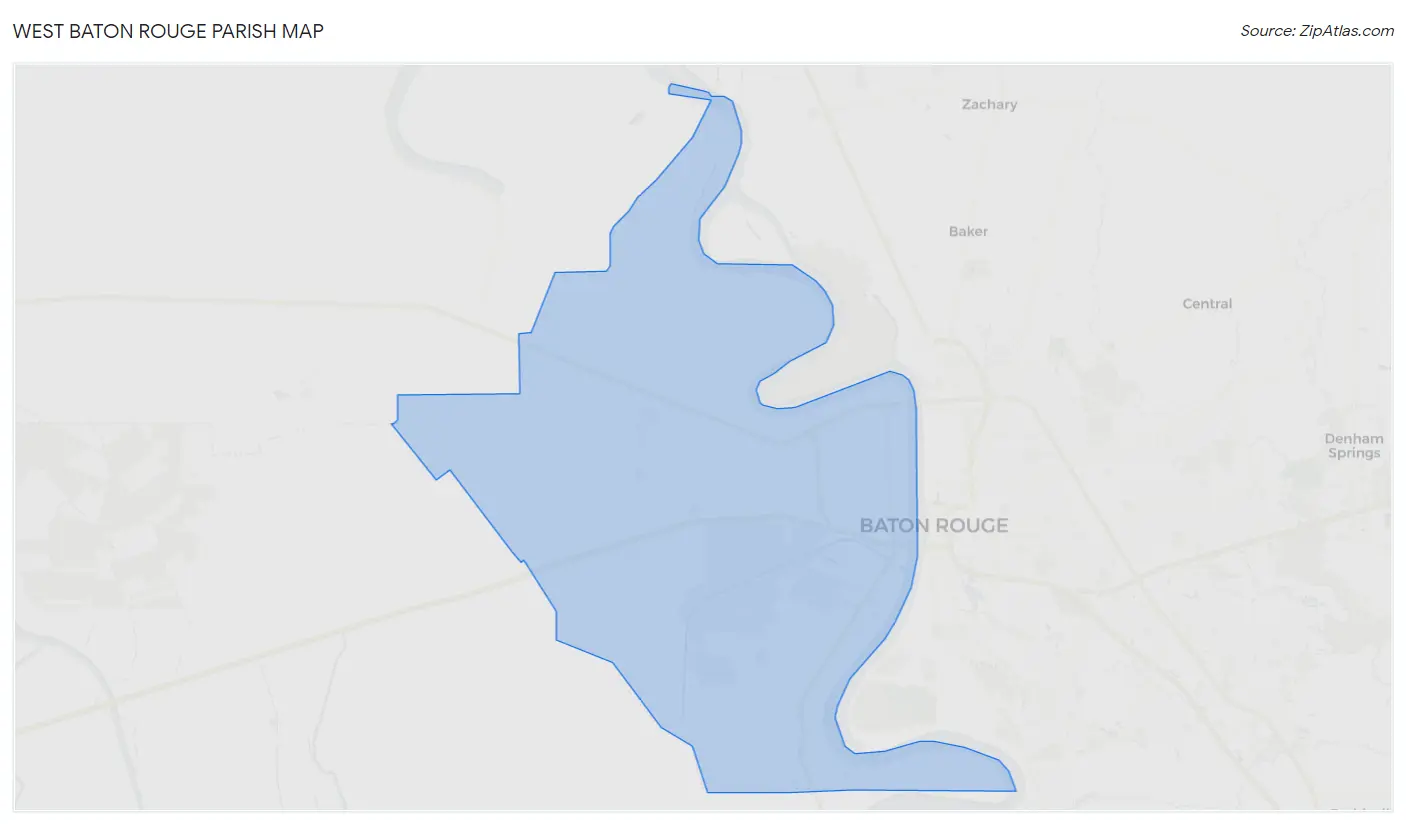
West Baton Rouge Parish Map
West Baton Rouge Parish Overview
27,377
TOTAL POPULATION
13,586
MALE POPULATION
13,791
FEMALE POPULATION
98.51
MALES / 100 FEMALES
101.51
FEMALES / 100 MALES
36.4
MEDIAN AGE
3.1
AVG FAMILY SIZE
2.6
AVG HOUSEHOLD SIZE
$33,445
PER CAPITA INCOME
$95,918
AVG FAMILY INCOME
$80,510
AVG HOUSEHOLD INCOME
15.9%
WAGE / INCOME GAP [ % ]
84.1¢/ $1
WAGE / INCOME GAP [ $ ]
0.39
INEQUALITY / GINI INDEX
13,656
LABOR FORCE [ PEOPLE ]
63.0%
PERCENT IN LABOR FORCE
7.6%
UNEMPLOYMENT RATE
West Baton Rouge Parish Area Codes
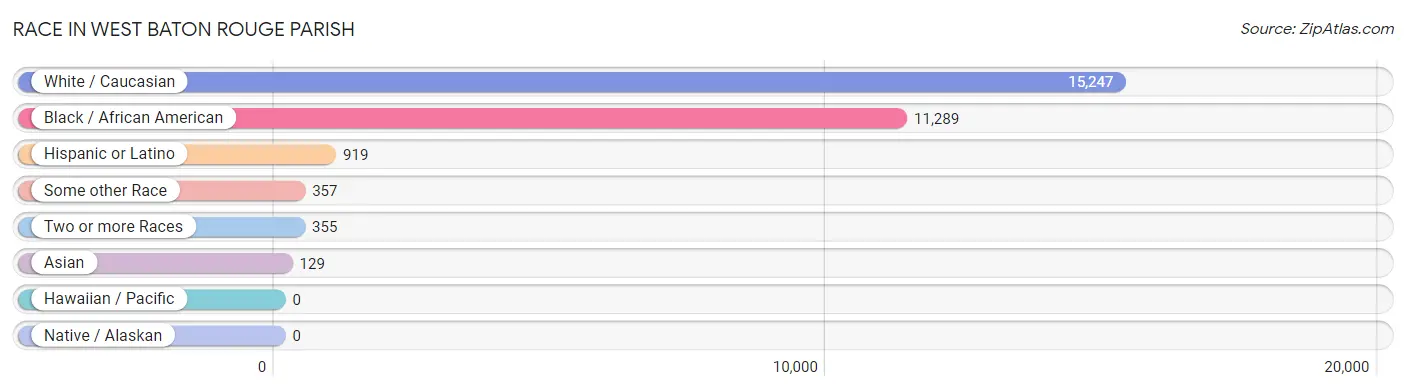
Race in West Baton Rouge Parish
The most populous races in West Baton Rouge Parish are White / Caucasian (15,247 | 55.7%), Black / African American (11,289 | 41.2%), and Hispanic or Latino (919 | 3.4%).
| Race | # Population | % Population |
| Asian | 129 | 0.5% |
| Black / African American | 11,289 | 41.2% |
| Hawaiian / Pacific | 0 | 0.0% |
| Hispanic or Latino | 919 | 3.4% |
| Native / Alaskan | 0 | 0.0% |
| White / Caucasian | 15,247 | 55.7% |
| Two or more Races | 355 | 1.3% |
| Some other Race | 357 | 1.3% |
| Total | 27,377 | 100.0% |
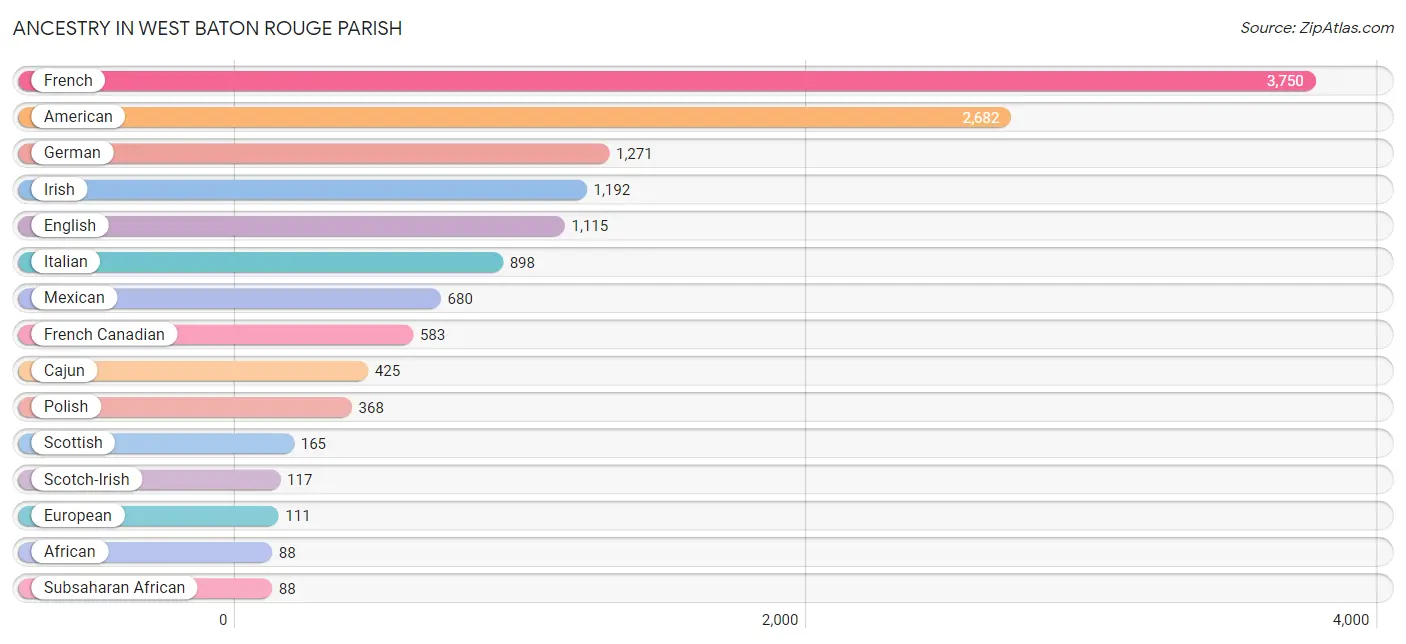
Ancestry in West Baton Rouge Parish
The most populous ancestries reported in West Baton Rouge Parish are French (3,750 | 13.7%), American (2,682 | 9.8%), German (1,271 | 4.6%), Irish (1,192 | 4.3%), and English (1,115 | 4.1%), together accounting for 36.6% of all West Baton Rouge Parish residents.
| Ancestry | # Population | % Population |
| African | 88 | 0.3% |
| American | 2,682 | 9.8% |
| Arab | 44 | 0.2% |
| Armenian | 27 | 0.1% |
| Austrian | 32 | 0.1% |
| Belgian | 23 | 0.1% |
| British | 4 | 0.0% |
| Cajun | 425 | 1.5% |
| Canadian | 11 | 0.0% |
| Central American | 7 | 0.0% |
| Cherokee | 30 | 0.1% |
| Choctaw | 18 | 0.1% |
| Cuban | 34 | 0.1% |
| Czech | 27 | 0.1% |
| Danish | 20 | 0.1% |
| Dominican | 14 | 0.1% |
| Dutch | 20 | 0.1% |
| Ecuadorian | 8 | 0.0% |
| English | 1,115 | 4.1% |
| European | 111 | 0.4% |
| Filipino | 24 | 0.1% |
| French | 3,750 | 13.7% |
| French Canadian | 583 | 2.1% |
| German | 1,271 | 4.6% |
| Greek | 8 | 0.0% |
| Guatemalan | 7 | 0.0% |
| Hungarian | 12 | 0.0% |
| Irish | 1,192 | 4.3% |
| Italian | 898 | 3.3% |
| Korean | 23 | 0.1% |
| Lebanese | 44 | 0.2% |
| Lithuanian | 21 | 0.1% |
| Mexican | 680 | 2.5% |
| Navajo | 22 | 0.1% |
| Polish | 368 | 1.3% |
| Puerto Rican | 27 | 0.1% |
| Scandinavian | 21 | 0.1% |
| Scotch-Irish | 117 | 0.4% |
| Scottish | 165 | 0.6% |
| South American | 8 | 0.0% |
| Spaniard | 53 | 0.2% |
| Spanish | 46 | 0.2% |
| Subsaharan African | 88 | 0.3% |
| Swedish | 1 | 0.0% |
| Swiss | 19 | 0.1% |
| Thai | 82 | 0.3% |
| Welsh | 11 | 0.0% | View All 47 Rows |
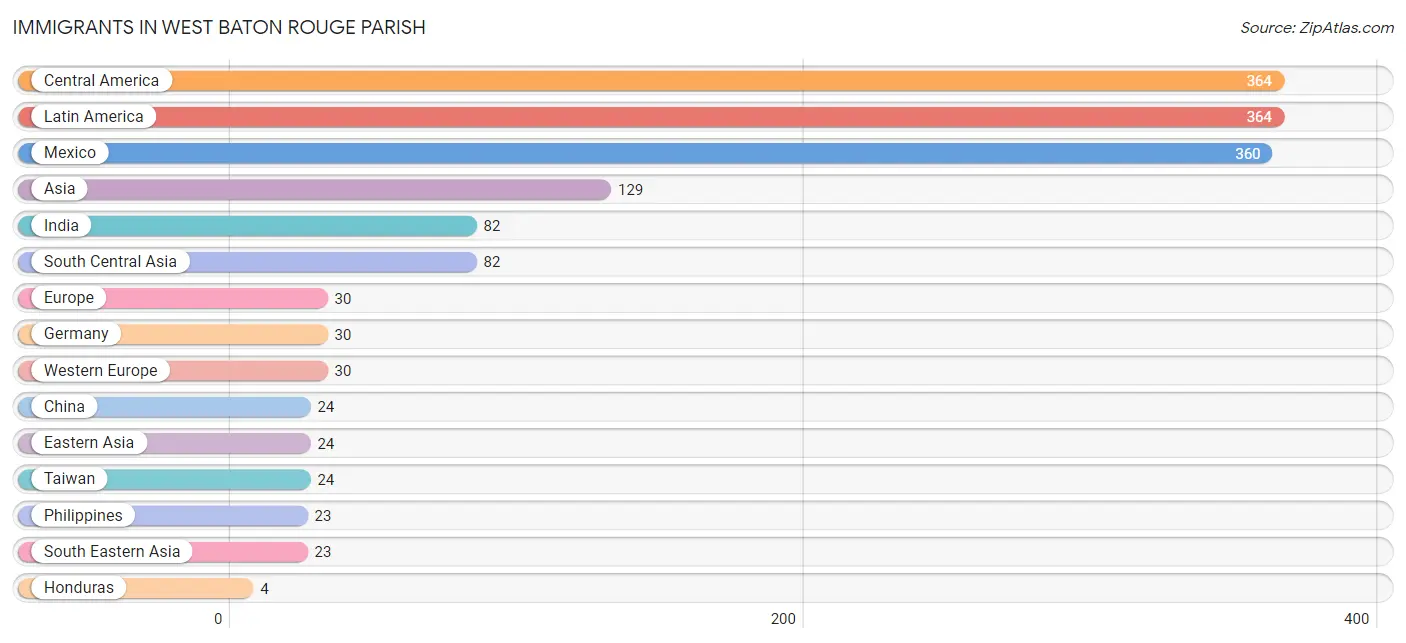
Immigrants in West Baton Rouge Parish
The most numerous immigrant groups reported in West Baton Rouge Parish came from Central America (364 | 1.3%), Latin America (364 | 1.3%), Mexico (360 | 1.3%), Asia (129 | 0.5%), and India (82 | 0.3%), together accounting for 4.7% of all West Baton Rouge Parish residents.
| Immigration Origin | # Population | % Population |
| Asia | 129 | 0.5% |
| Central America | 364 | 1.3% |
| China | 24 | 0.1% |
| Eastern Asia | 24 | 0.1% |
| Europe | 30 | 0.1% |
| Germany | 30 | 0.1% |
| Honduras | 4 | 0.0% |
| India | 82 | 0.3% |
| Latin America | 364 | 1.3% |
| Mexico | 360 | 1.3% |
| Philippines | 23 | 0.1% |
| South Central Asia | 82 | 0.3% |
| South Eastern Asia | 23 | 0.1% |
| Taiwan | 24 | 0.1% |
| Western Europe | 30 | 0.1% | View All 15 Rows |
Sex and Age in West Baton Rouge Parish
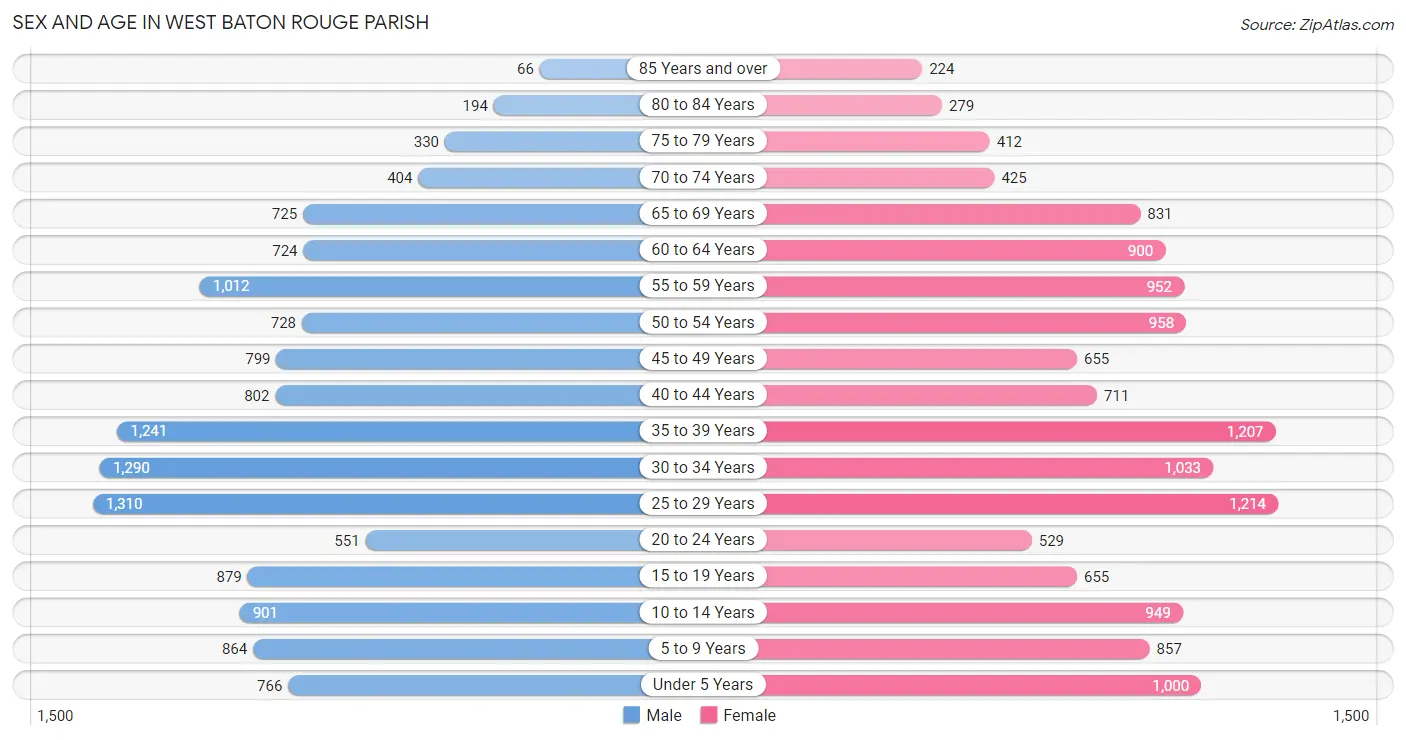
Sex and Age in West Baton Rouge Parish
The most populous age groups in West Baton Rouge Parish are 25 to 29 Years (1,310 | 9.6%) for men and 25 to 29 Years (1,214 | 8.8%) for women.
| Age Bracket | Male | Female |
| Under 5 Years | 766 (5.6%) | 1,000 (7.2%) |
| 5 to 9 Years | 864 (6.4%) | 857 (6.2%) |
| 10 to 14 Years | 901 (6.6%) | 949 (6.9%) |
| 15 to 19 Years | 879 (6.5%) | 655 (4.8%) |
| 20 to 24 Years | 551 (4.1%) | 529 (3.8%) |
| 25 to 29 Years | 1,310 (9.6%) | 1,214 (8.8%) |
| 30 to 34 Years | 1,290 (9.5%) | 1,033 (7.5%) |
| 35 to 39 Years | 1,241 (9.1%) | 1,207 (8.7%) |
| 40 to 44 Years | 802 (5.9%) | 711 (5.2%) |
| 45 to 49 Years | 799 (5.9%) | 655 (4.8%) |
| 50 to 54 Years | 728 (5.4%) | 958 (7.0%) |
| 55 to 59 Years | 1,012 (7.4%) | 952 (6.9%) |
| 60 to 64 Years | 724 (5.3%) | 900 (6.5%) |
| 65 to 69 Years | 725 (5.3%) | 831 (6.0%) |
| 70 to 74 Years | 404 (3.0%) | 425 (3.1%) |
| 75 to 79 Years | 330 (2.4%) | 412 (3.0%) |
| 80 to 84 Years | 194 (1.4%) | 279 (2.0%) |
| 85 Years and over | 66 (0.5%) | 224 (1.6%) |
| Total | 13,586 (100.0%) | 13,791 (100.0%) |
Families and Households in West Baton Rouge Parish
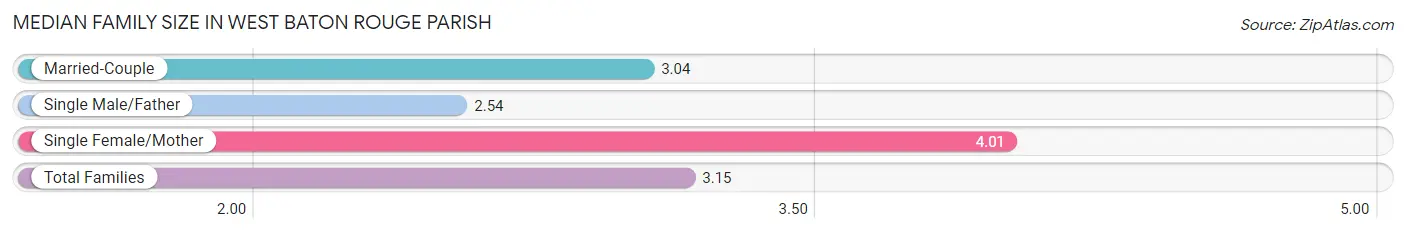
Median Family Size in West Baton Rouge Parish
The median family size in West Baton Rouge Parish is 3.15 persons per family, with single female/mother families (1,217 | 17.1%) accounting for the largest median family size of 4.01 persons per family. On the other hand, single male/father families (724 | 10.2%) represent the smallest median family size with 2.54 persons per family.
| Family Type | # Families | Family Size |
| Married-Couple | 5,169 (72.7%) | 3.04 |
| Single Male/Father | 724 (10.2%) | 2.54 |
| Single Female/Mother | 1,217 (17.1%) | 4.01 |
| Total Families | 7,110 (100.0%) | 3.15 |
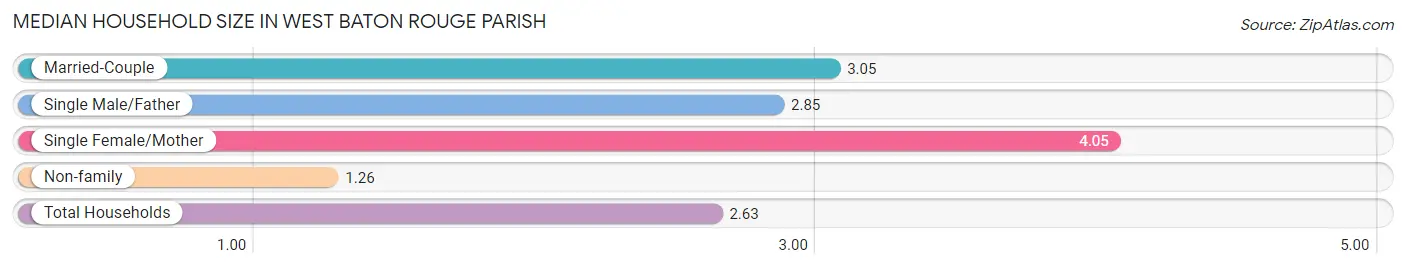
Median Household Size in West Baton Rouge Parish
The median household size in West Baton Rouge Parish is 2.63 persons per household, with single female/mother households (1,217 | 12.1%) accounting for the largest median household size of 4.05 persons per household. non-family households (2,970 | 29.5%) represent the smallest median household size with 1.26 persons per household.
| Household Type | # Households | Household Size |
| Married-Couple | 5,169 (51.3%) | 3.05 |
| Single Male/Father | 724 (7.2%) | 2.85 |
| Single Female/Mother | 1,217 (12.1%) | 4.05 |
| Non-family | 2,970 (29.5%) | 1.26 |
| Total Households | 10,080 (100.0%) | 2.63 |
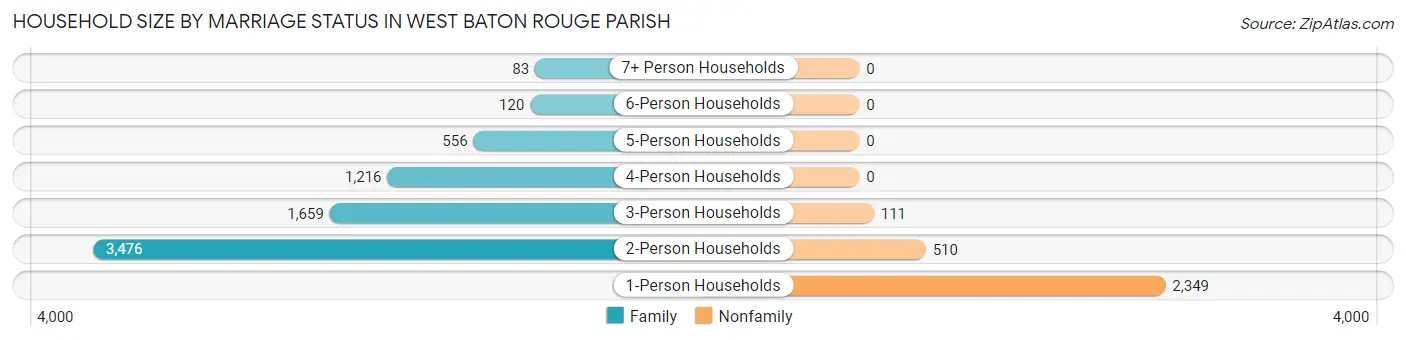
Household Size by Marriage Status in West Baton Rouge Parish
Out of a total of 10,080 households in West Baton Rouge Parish, 7,110 (70.5%) are family households, while 2,970 (29.5%) are nonfamily households. The most numerous type of family households are 2-person households, comprising 3,476, and the most common type of nonfamily households are 1-person households, comprising 2,349.
| Household Size | Family Households | Nonfamily Households |
| 1-Person Households | - | 2,349 (23.3%) |
| 2-Person Households | 3,476 (34.5%) | 510 (5.1%) |
| 3-Person Households | 1,659 (16.5%) | 111 (1.1%) |
| 4-Person Households | 1,216 (12.1%) | 0 (0.0%) |
| 5-Person Households | 556 (5.5%) | 0 (0.0%) |
| 6-Person Households | 120 (1.2%) | 0 (0.0%) |
| 7+ Person Households | 83 (0.8%) | 0 (0.0%) |
| Total | 7,110 (70.5%) | 2,970 (29.5%) |
Female Fertility in West Baton Rouge Parish
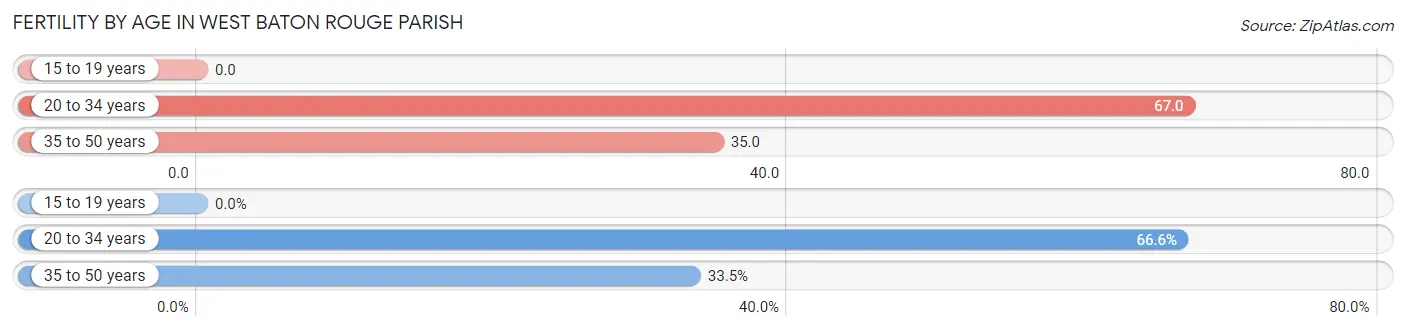
Fertility by Age in West Baton Rouge Parish
Average fertility rate in West Baton Rouge Parish is 46.0 births per 1,000 women. Women in the age bracket of 20 to 34 years have the highest fertility rate with 67.0 births per 1,000 women. Women in the age bracket of 20 to 34 years acount for 66.5% of all women with births.
| Age Bracket | Women with Births | Births / 1,000 Women |
| 15 to 19 years | 0 (0.0%) | 0.0 |
| 20 to 34 years | 187 (66.5%) | 67.0 |
| 35 to 50 years | 94 (33.5%) | 35.0 |
| Total | 281 (100.0%) | 46.0 |
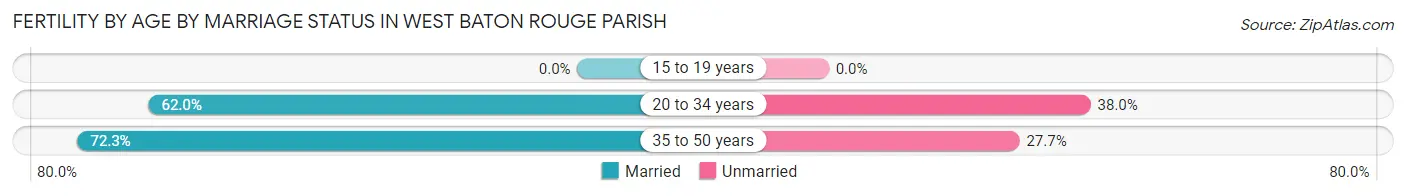
Fertility by Age by Marriage Status in West Baton Rouge Parish
65.5% of women with births (281) in West Baton Rouge Parish are married. The highest percentage of unmarried women with births falls into 20 to 34 years age bracket with 38.0% of them unmarried at the time of birth, while the lowest percentage of unmarried women with births belong to 35 to 50 years age bracket with 27.7% of them unmarried.
| Age Bracket | Married | Unmarried |
| 15 to 19 years | 0 (0.0%) | 0 (0.0%) |
| 20 to 34 years | 116 (62.0%) | 71 (38.0%) |
| 35 to 50 years | 68 (72.3%) | 26 (27.7%) |
| Total | 184 (65.5%) | 97 (34.5%) |
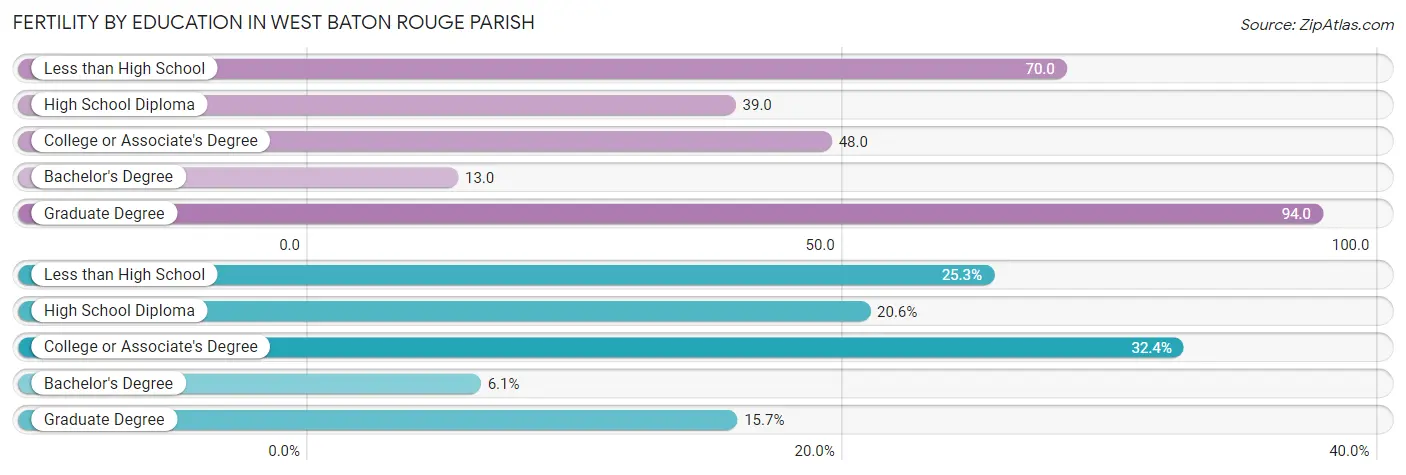
Fertility by Education in West Baton Rouge Parish
Average fertility rate in West Baton Rouge Parish is 46.0 births per 1,000 women. Women with the education attainment of graduate degree have the highest fertility rate of 94.0 births per 1,000 women, while women with the education attainment of bachelor's degree have the lowest fertility at 13.0 births per 1,000 women. Women with the education attainment of college or associate's degree represent 32.4% of all women with births.
| Educational Attainment | Women with Births | Births / 1,000 Women |
| Less than High School | 71 (25.3%) | 70.0 |
| High School Diploma | 58 (20.6%) | 39.0 |
| College or Associate's Degree | 91 (32.4%) | 48.0 |
| Bachelor's Degree | 17 (6.0%) | 13.0 |
| Graduate Degree | 44 (15.7%) | 94.0 |
| Total | 281 (100.0%) | 46.0 |
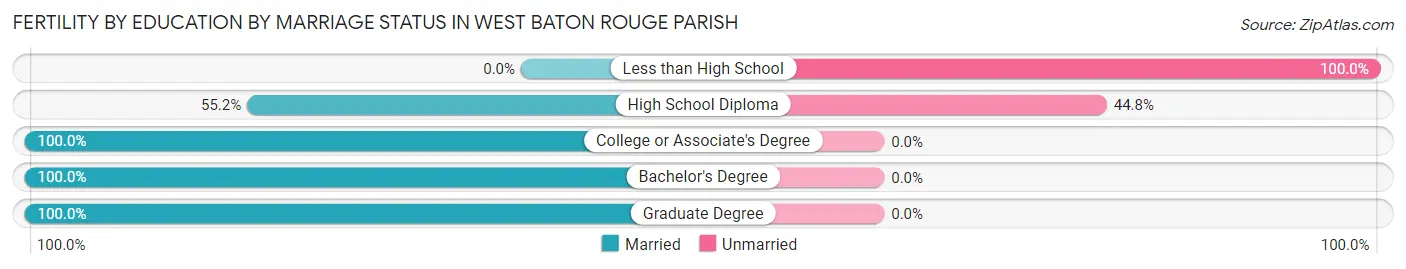
Fertility by Education by Marriage Status in West Baton Rouge Parish
34.5% of women with births in West Baton Rouge Parish are unmarried. Women with the educational attainment of college or associate's degree are most likely to be married with 100.0% of them married at childbirth, while women with the educational attainment of less than high school are least likely to be married with 100.0% of them unmarried at childbirth.
| Educational Attainment | Married | Unmarried |
| Less than High School | 0 (0.0%) | 71 (100.0%) |
| High School Diploma | 32 (55.2%) | 26 (44.8%) |
| College or Associate's Degree | 91 (100.0%) | 0 (0.0%) |
| Bachelor's Degree | 17 (100.0%) | 0 (0.0%) |
| Graduate Degree | 44 (100.0%) | 0 (0.0%) |
| Total | 184 (65.5%) | 97 (34.5%) |
Income in West Baton Rouge Parish
Income Overview in West Baton Rouge Parish
Per Capita Income in West Baton Rouge Parish is $33,445, while median incomes of families and households are $95,918 and $80,510 respectively.
| Characteristic | Number | Measure |
| Per Capita Income | 27,377 | $33,445 |
| Median Family Income | 7,110 | $95,918 |
| Mean Family Income | 7,110 | $101,594 |
| Median Household Income | 10,080 | $80,510 |
| Mean Household Income | 10,080 | $88,670 |
| Income Deficit | 7,110 | $0 |
| Wage / Income Gap (%) | 27,377 | 15.89% |
| Wage / Income Gap ($) | 27,377 | 84.11¢ per $1 |
| Gini / Inequality Index | 27,377 | 0.39 |
Earnings by Sex in West Baton Rouge Parish
Average Earnings in West Baton Rouge Parish are $45,704, $51,159 for men and $43,031 for women, a difference of 15.9%.
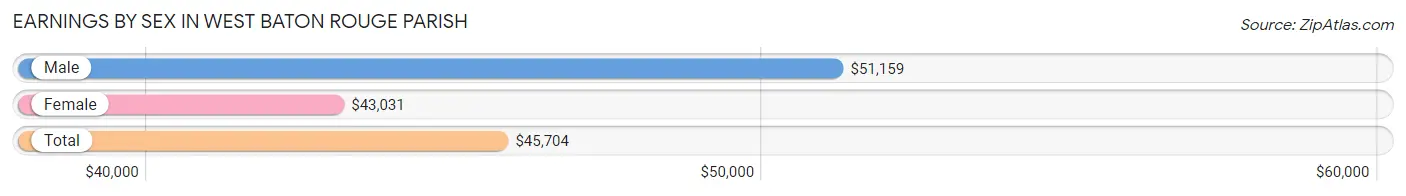
| Sex | Number | Average Earnings |
| Male | 7,694 (55.3%) | $51,159 |
| Female | 6,208 (44.7%) | $43,031 |
| Total | 13,902 (100.0%) | $45,704 |
Earnings by Sex by Income Bracket in West Baton Rouge Parish
The most common earnings brackets in West Baton Rouge Parish are $100,000+ for men (1,446 | 18.8%) and $55,000 to $64,999 for women (596 | 9.6%).
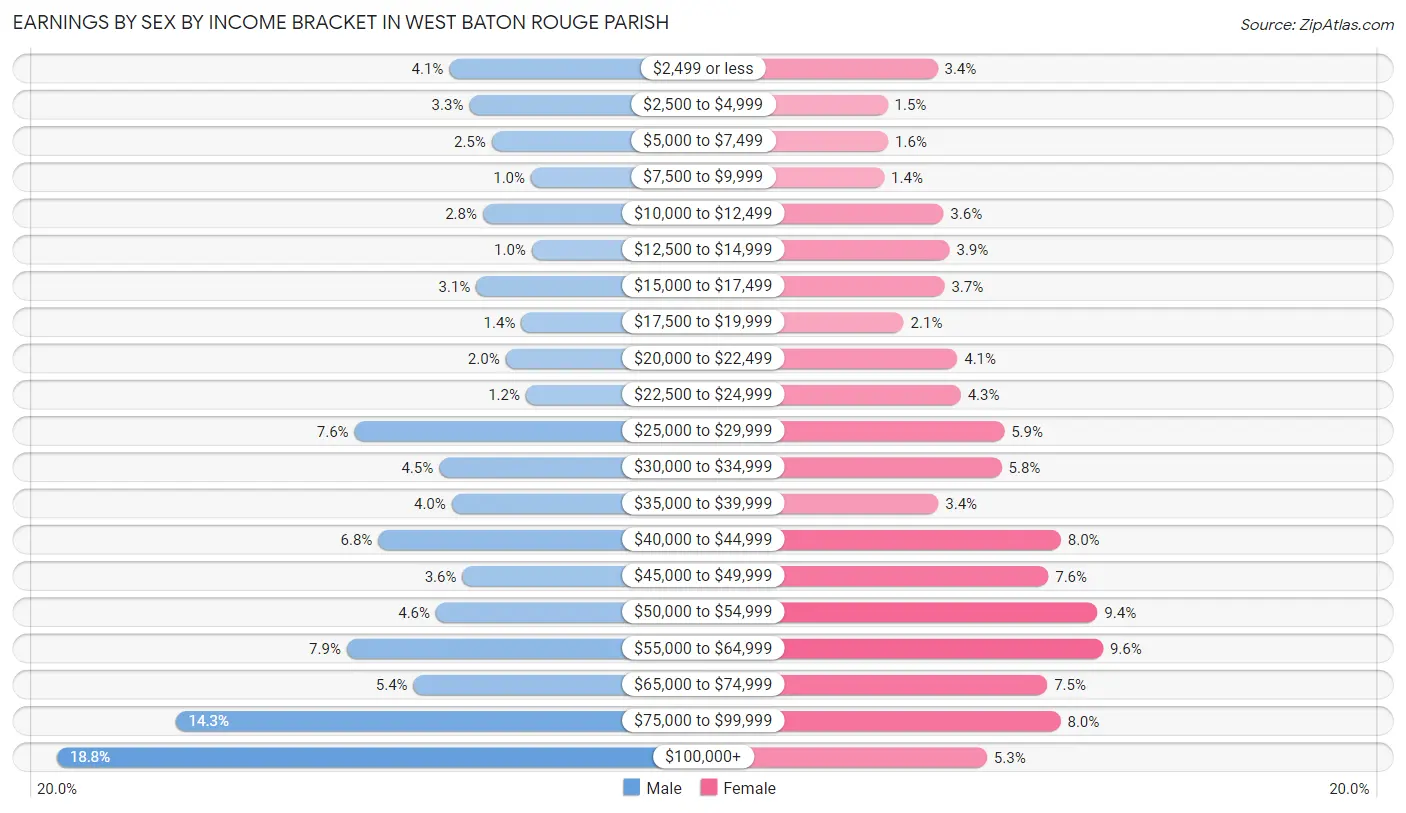
| Income | Male | Female |
| $2,499 or less | 315 (4.1%) | 211 (3.4%) |
| $2,500 to $4,999 | 257 (3.3%) | 95 (1.5%) |
| $5,000 to $7,499 | 192 (2.5%) | 96 (1.5%) |
| $7,500 to $9,999 | 79 (1.0%) | 87 (1.4%) |
| $10,000 to $12,499 | 218 (2.8%) | 225 (3.6%) |
| $12,500 to $14,999 | 77 (1.0%) | 239 (3.8%) |
| $15,000 to $17,499 | 237 (3.1%) | 227 (3.7%) |
| $17,500 to $19,999 | 107 (1.4%) | 132 (2.1%) |
| $20,000 to $22,499 | 152 (2.0%) | 257 (4.1%) |
| $22,500 to $24,999 | 94 (1.2%) | 265 (4.3%) |
| $25,000 to $29,999 | 588 (7.6%) | 366 (5.9%) |
| $30,000 to $34,999 | 344 (4.5%) | 360 (5.8%) |
| $35,000 to $39,999 | 308 (4.0%) | 213 (3.4%) |
| $40,000 to $44,999 | 519 (6.8%) | 498 (8.0%) |
| $45,000 to $49,999 | 277 (3.6%) | 469 (7.5%) |
| $50,000 to $54,999 | 353 (4.6%) | 583 (9.4%) |
| $55,000 to $64,999 | 610 (7.9%) | 596 (9.6%) |
| $65,000 to $74,999 | 418 (5.4%) | 466 (7.5%) |
| $75,000 to $99,999 | 1,103 (14.3%) | 497 (8.0%) |
| $100,000+ | 1,446 (18.8%) | 326 (5.2%) |
| Total | 7,694 (100.0%) | 6,208 (100.0%) |
Earnings by Sex by Educational Attainment in West Baton Rouge Parish
Average earnings in West Baton Rouge Parish are $55,860 for men and $45,657 for women, a difference of 18.3%. Men with an educational attainment of bachelor's degree enjoy the highest average annual earnings of $95,793, while those with high school diploma education earn the least with $44,008. Women with an educational attainment of graduate degree earn the most with the average annual earnings of $59,567, while those with less than high school education have the smallest earnings of $21,027.
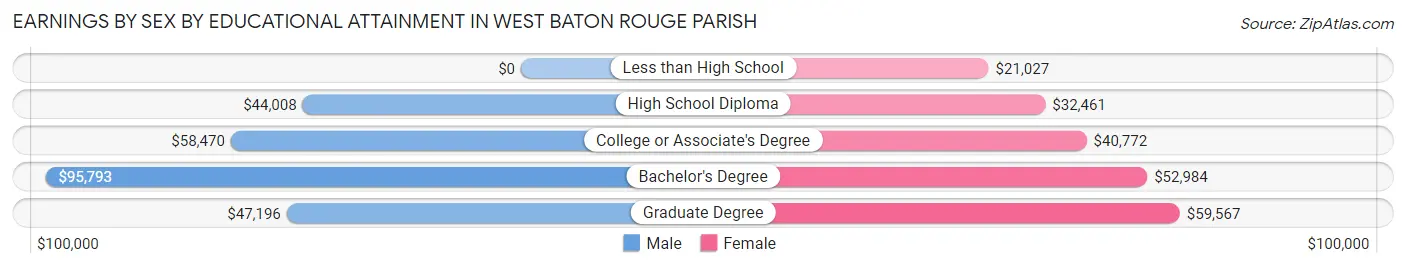
| Educational Attainment | Male Income | Female Income |
| Less than High School | - | - |
| High School Diploma | $44,008 | $32,461 |
| College or Associate's Degree | $58,470 | $40,772 |
| Bachelor's Degree | $95,793 | $52,984 |
| Graduate Degree | $47,196 | $59,567 |
| Total | $55,860 | $45,657 |
Family Income in West Baton Rouge Parish
Family Income Brackets in West Baton Rouge Parish
According to the West Baton Rouge Parish family income data, there are 1,984 families falling into the $100,000 to $149,999 income range, which is the most common income bracket and makes up 27.9% of all families. Conversely, the $10,000 to $14,999 income bracket is the least frequent group with only 71 families (1.0%) belonging to this category.
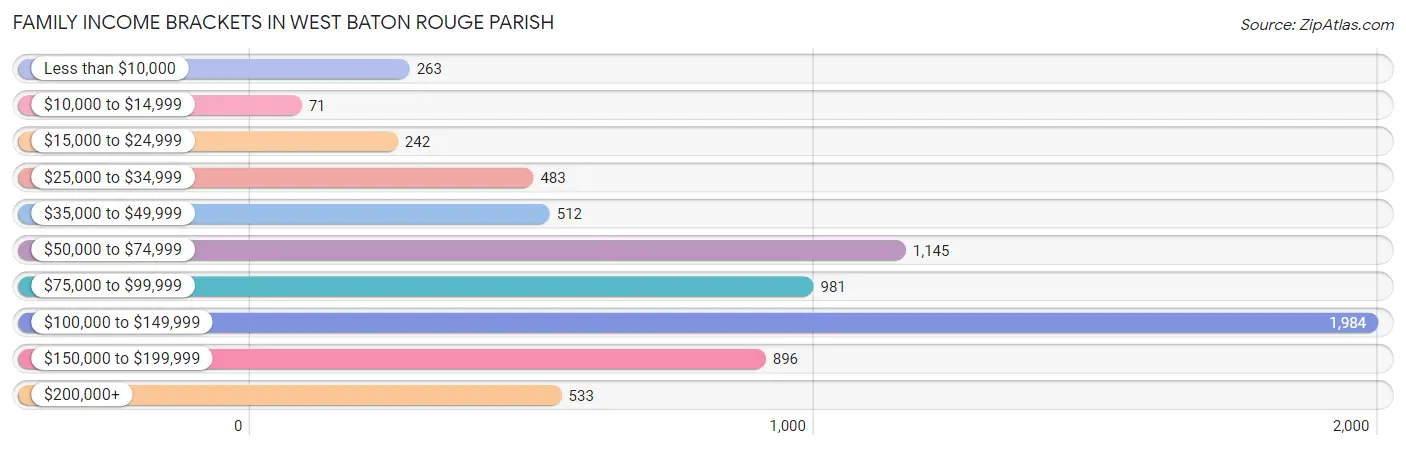
| Income Bracket | # Families | % Families |
| Less than $10,000 | 263 | 3.7% |
| $10,000 to $14,999 | 71 | 1.0% |
| $15,000 to $24,999 | 242 | 3.4% |
| $25,000 to $34,999 | 483 | 6.8% |
| $35,000 to $49,999 | 512 | 7.2% |
| $50,000 to $74,999 | 1,145 | 16.1% |
| $75,000 to $99,999 | 981 | 13.8% |
| $100,000 to $149,999 | 1,984 | 27.9% |
| $150,000 to $199,999 | 896 | 12.6% |
| $200,000+ | 533 | 7.5% |
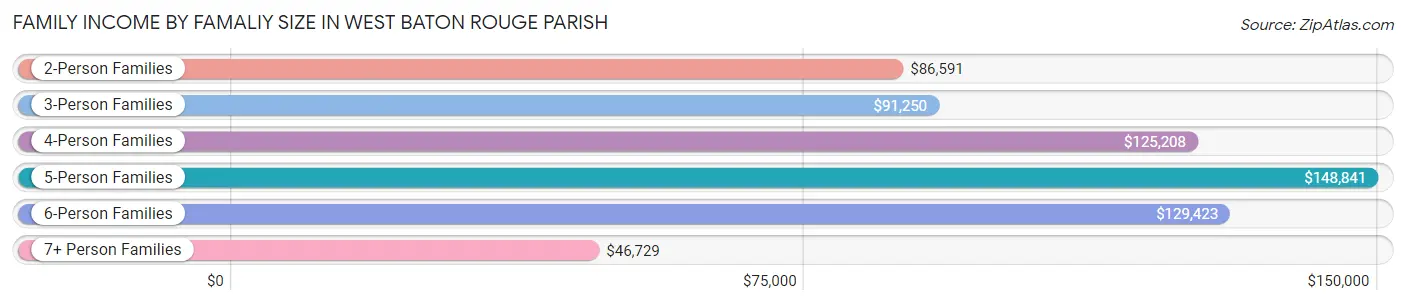
Family Income by Famaliy Size in West Baton Rouge Parish
5-person families (531 | 7.5%) account for the highest median family income in West Baton Rouge Parish with $148,841 per family, while 2-person families (3,558 | 50.0%) have the highest median income of $43,296 per family member.
| Income Bracket | # Families | Median Income |
| 2-Person Families | 3,558 (50.0%) | $86,591 |
| 3-Person Families | 1,843 (25.9%) | $91,250 |
| 4-Person Families | 975 (13.7%) | $125,208 |
| 5-Person Families | 531 (7.5%) | $148,841 |
| 6-Person Families | 120 (1.7%) | $129,423 |
| 7+ Person Families | 83 (1.2%) | $46,729 |
| Total | 7,110 (100.0%) | $95,918 |
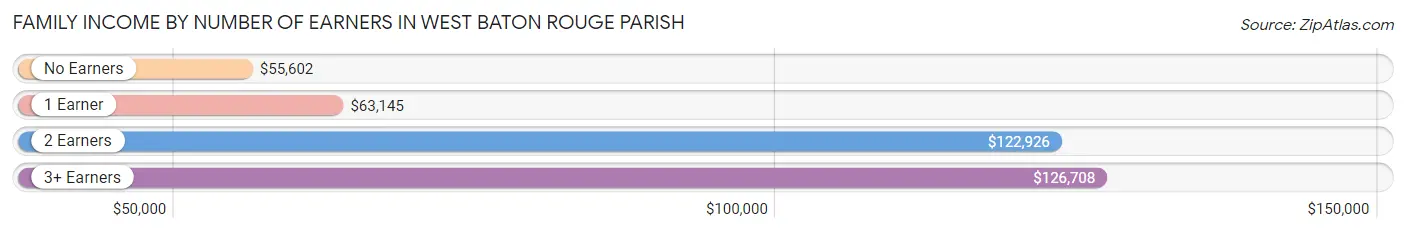
Family Income by Number of Earners in West Baton Rouge Parish
The median family income in West Baton Rouge Parish is $95,918, with families comprising 3+ earners (566) having the highest median family income of $126,708, while families with no earners (1,061) have the lowest median family income of $55,602, accounting for 8.0% and 14.9% of families, respectively.
| Number of Earners | # Families | Median Income |
| No Earners | 1,061 (14.9%) | $55,602 |
| 1 Earner | 2,405 (33.8%) | $63,145 |
| 2 Earners | 3,078 (43.3%) | $122,926 |
| 3+ Earners | 566 (8.0%) | $126,708 |
| Total | 7,110 (100.0%) | $95,918 |
Household Income in West Baton Rouge Parish
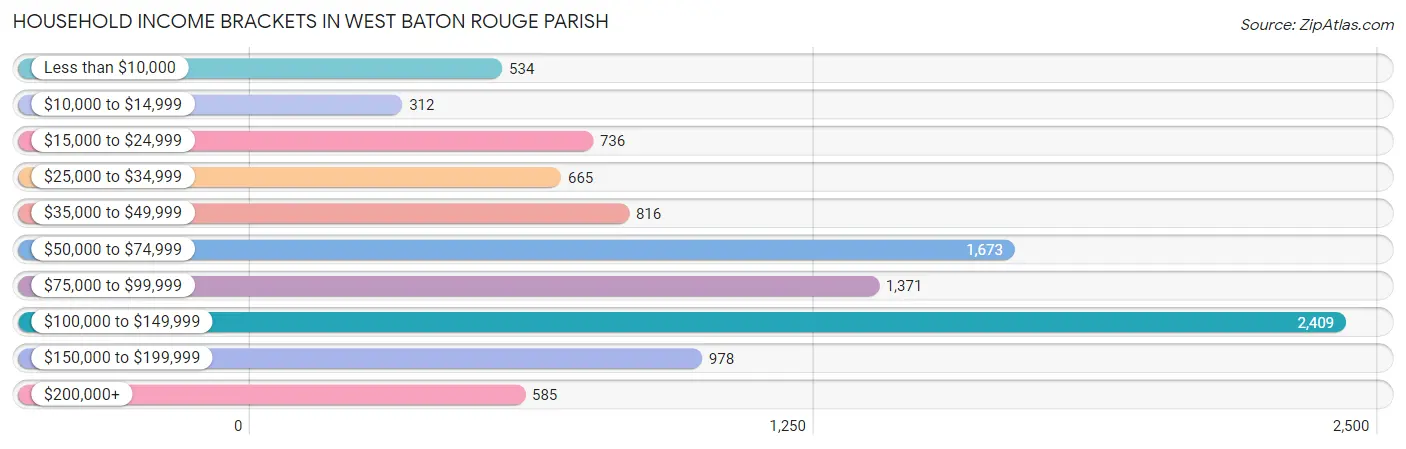
Household Income Brackets in West Baton Rouge Parish
With 2,409 households falling in the category, the $100,000 to $149,999 income range is the most frequent in West Baton Rouge Parish, accounting for 23.9% of all households. In contrast, only 312 households (3.1%) fall into the $10,000 to $14,999 income bracket, making it the least populous group.
| Income Bracket | # Households | % Households |
| Less than $10,000 | 534 | 5.3% |
| $10,000 to $14,999 | 312 | 3.1% |
| $15,000 to $24,999 | 736 | 7.3% |
| $25,000 to $34,999 | 665 | 6.6% |
| $35,000 to $49,999 | 816 | 8.1% |
| $50,000 to $74,999 | 1,673 | 16.6% |
| $75,000 to $99,999 | 1,371 | 13.6% |
| $100,000 to $149,999 | 2,409 | 23.9% |
| $150,000 to $199,999 | 978 | 9.7% |
| $200,000+ | 585 | 5.8% |
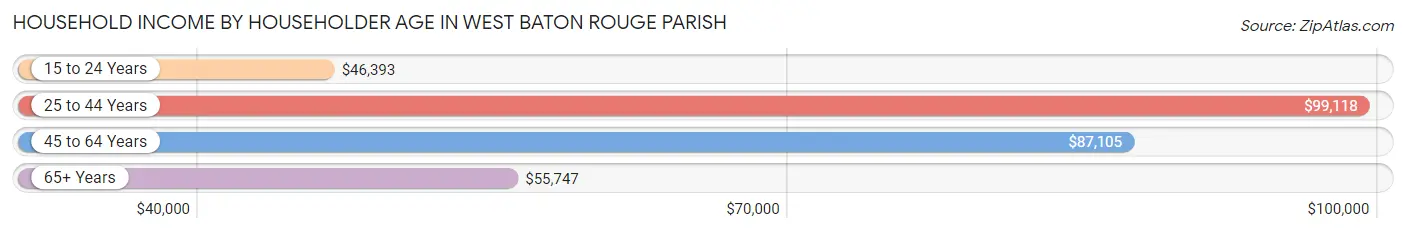
Household Income by Householder Age in West Baton Rouge Parish
The median household income in West Baton Rouge Parish is $80,510, with the highest median household income of $99,118 found in the 25 to 44 years age bracket for the primary householder. A total of 3,964 households (39.3%) fall into this category. Meanwhile, the 15 to 24 years age bracket for the primary householder has the lowest median household income of $46,393, with 75 households (0.7%) in this group.
| Income Bracket | # Households | Median Income |
| 15 to 24 Years | 75 (0.7%) | $46,393 |
| 25 to 44 Years | 3,964 (39.3%) | $99,118 |
| 45 to 64 Years | 3,664 (36.3%) | $87,105 |
| 65+ Years | 2,377 (23.6%) | $55,747 |
| Total | 10,080 (100.0%) | $80,510 |
Poverty in West Baton Rouge Parish
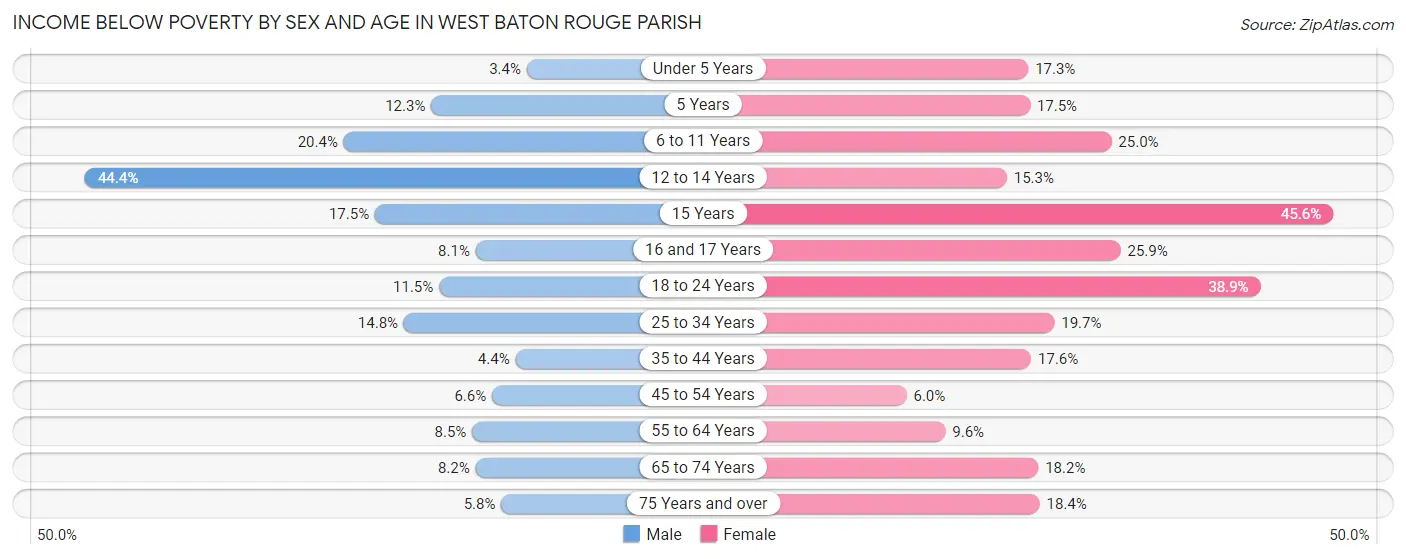
Income Below Poverty by Sex and Age in West Baton Rouge Parish
With 11.3% poverty level for males and 17.9% for females among the residents of West Baton Rouge Parish, 12 to 14 year old males and 15 year old females are the most vulnerable to poverty, with 269 males (44.4%) and 119 females (45.6%) in their respective age groups living below the poverty level.
| Age Bracket | Male | Female |
| Under 5 Years | 26 (3.4%) | 173 (17.3%) |
| 5 Years | 13 (12.3%) | 33 (17.5%) |
| 6 to 11 Years | 202 (20.4%) | 282 (25.0%) |
| 12 to 14 Years | 269 (44.4%) | 75 (15.3%) |
| 15 Years | 18 (17.5%) | 119 (45.6%) |
| 16 and 17 Years | 46 (8.1%) | 37 (25.9%) |
| 18 to 24 Years | 83 (11.5%) | 303 (38.9%) |
| 25 to 34 Years | 352 (14.8%) | 443 (19.7%) |
| 35 to 44 Years | 79 (4.4%) | 337 (17.6%) |
| 45 to 54 Years | 91 (6.6%) | 97 (6.0%) |
| 55 to 64 Years | 143 (8.5%) | 178 (9.6%) |
| 65 to 74 Years | 92 (8.2%) | 229 (18.2%) |
| 75 Years and over | 34 (5.8%) | 168 (18.4%) |
| Total | 1,448 (11.3%) | 2,474 (17.9%) |
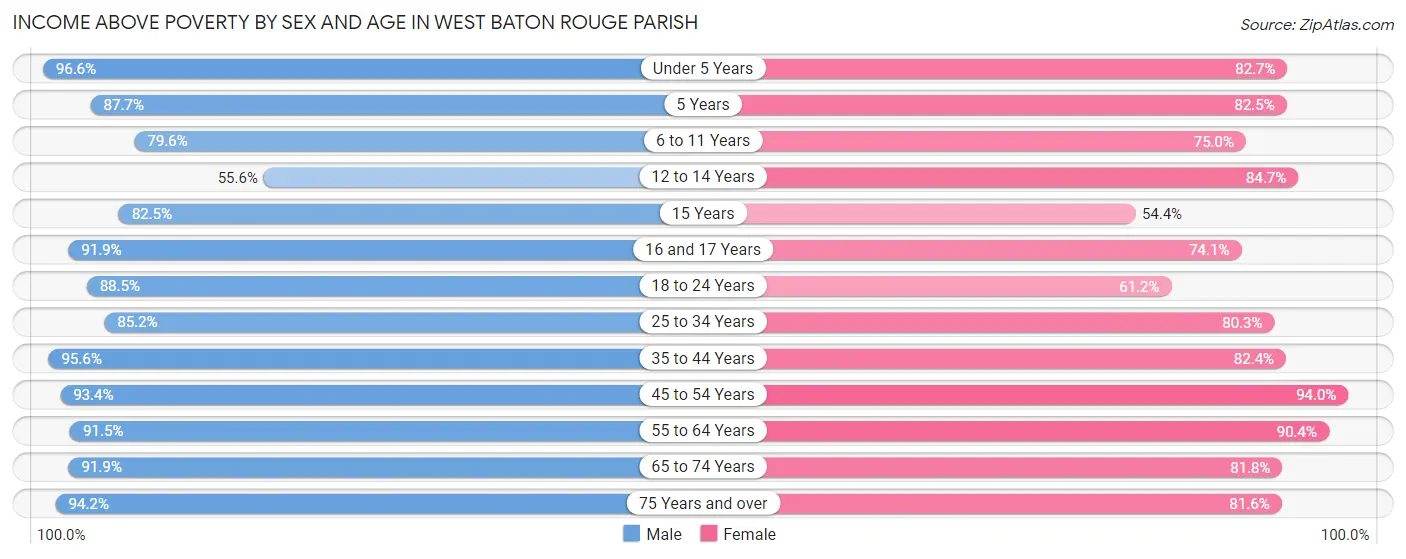
Income Above Poverty by Sex and Age in West Baton Rouge Parish
According to the poverty statistics in West Baton Rouge Parish, males aged under 5 years and females aged 45 to 54 years are the age groups that are most secure financially, with 96.6% of males and 94.0% of females in these age groups living above the poverty line.
| Age Bracket | Male | Female |
| Under 5 Years | 740 (96.6%) | 827 (82.7%) |
| 5 Years | 93 (87.7%) | 156 (82.5%) |
| 6 to 11 Years | 789 (79.6%) | 845 (75.0%) |
| 12 to 14 Years | 337 (55.6%) | 415 (84.7%) |
| 15 Years | 85 (82.5%) | 142 (54.4%) |
| 16 and 17 Years | 520 (91.9%) | 106 (74.1%) |
| 18 to 24 Years | 637 (88.5%) | 477 (61.2%) |
| 25 to 34 Years | 2,027 (85.2%) | 1,804 (80.3%) |
| 35 to 44 Years | 1,699 (95.6%) | 1,581 (82.4%) |
| 45 to 54 Years | 1,284 (93.4%) | 1,516 (94.0%) |
| 55 to 64 Years | 1,548 (91.5%) | 1,674 (90.4%) |
| 65 to 74 Years | 1,037 (91.8%) | 1,027 (81.8%) |
| 75 Years and over | 556 (94.2%) | 747 (81.6%) |
| Total | 11,352 (88.7%) | 11,317 (82.1%) |
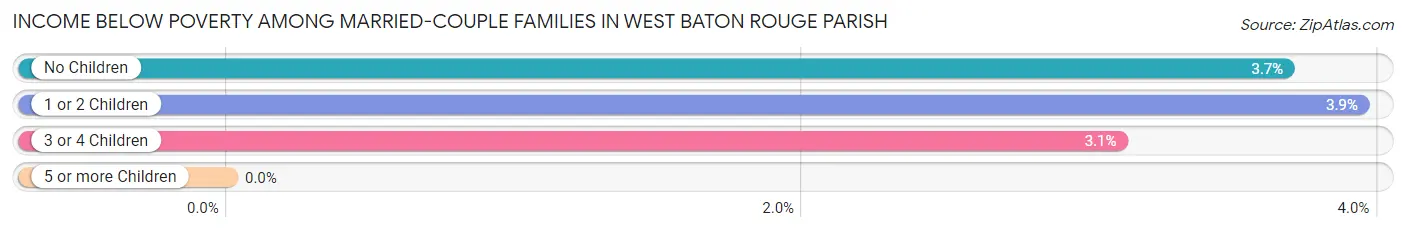
Income Below Poverty Among Married-Couple Families in West Baton Rouge Parish
The poverty statistics for married-couple families in West Baton Rouge Parish show that 3.7% or 192 of the total 5,169 families live below the poverty line. Families with 1 or 2 children have the highest poverty rate of 3.9%, comprising of 65 families. On the other hand, families with 5 or more children have the lowest poverty rate of 0.0%, which includes 0 families.
| Children | Above Poverty | Below Poverty |
| No Children | 3,012 (96.3%) | 115 (3.7%) |
| 1 or 2 Children | 1,583 (96.1%) | 65 (3.9%) |
| 3 or 4 Children | 375 (96.9%) | 12 (3.1%) |
| 5 or more Children | 7 (100.0%) | 0 (0.0%) |
| Total | 4,977 (96.3%) | 192 (3.7%) |
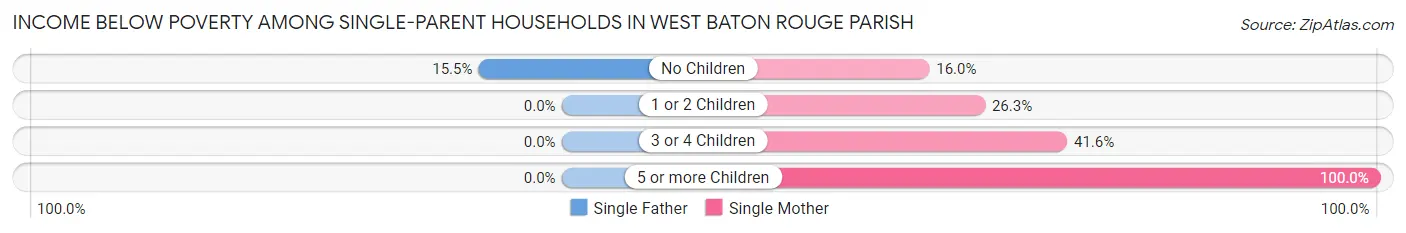
Income Below Poverty Among Single-Parent Households in West Baton Rouge Parish
According to the poverty data in West Baton Rouge Parish, 9.1% or 66 single-father households and 27.4% or 334 single-mother households are living below the poverty line. Among single-father households, those with no children have the highest poverty rate, with 66 households (15.5%) experiencing poverty. Likewise, among single-mother households, those with 5 or more children have the highest poverty rate, with 60 households (100.0%) falling below the poverty line.
| Children | Single Father | Single Mother |
| No Children | 66 (15.5%) | 82 (16.0%) |
| 1 or 2 Children | 0 (0.0%) | 130 (26.3%) |
| 3 or 4 Children | 0 (0.0%) | 62 (41.6%) |
| 5 or more Children | 0 (0.0%) | 60 (100.0%) |
| Total | 66 (9.1%) | 334 (27.4%) |
Income Below Poverty Among Married-Couple vs Single-Parent Households in West Baton Rouge Parish
The poverty data for West Baton Rouge Parish shows that 192 of the married-couple family households (3.7%) and 400 of the single-parent households (20.6%) are living below the poverty level. Within the married-couple family households, those with 1 or 2 children have the highest poverty rate, with 65 households (3.9%) falling below the poverty line. Among the single-parent households, those with 5 or more children have the highest poverty rate, with 60 household (100.0%) living below poverty.
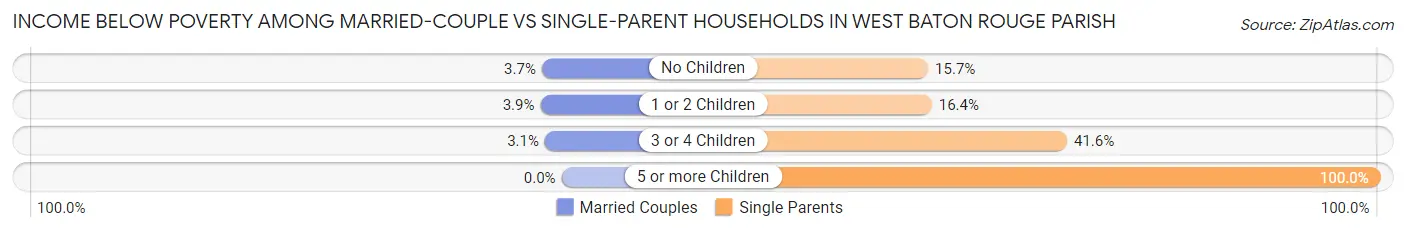
| Children | Married-Couple Families | Single-Parent Households |
| No Children | 115 (3.7%) | 148 (15.7%) |
| 1 or 2 Children | 65 (3.9%) | 130 (16.4%) |
| 3 or 4 Children | 12 (3.1%) | 62 (41.6%) |
| 5 or more Children | 0 (0.0%) | 60 (100.0%) |
| Total | 192 (3.7%) | 400 (20.6%) |
Employment Characteristics in West Baton Rouge Parish
Employment by Class of Employer in West Baton Rouge Parish
Among the 12,469 employed individuals in West Baton Rouge Parish, private company employees (8,434 | 67.6%), state government employees (1,414 | 11.3%), and local government employees (881 | 7.1%) make up the most common classes of employment.
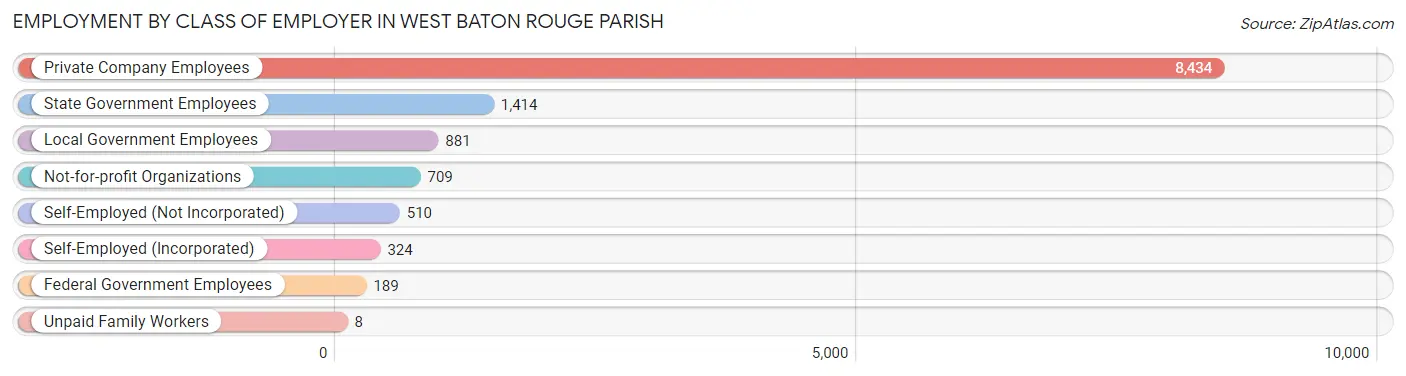
| Employer Class | # Employees | % Employees |
| Private Company Employees | 8,434 | 67.6% |
| Self-Employed (Incorporated) | 324 | 2.6% |
| Self-Employed (Not Incorporated) | 510 | 4.1% |
| Not-for-profit Organizations | 709 | 5.7% |
| Local Government Employees | 881 | 7.1% |
| State Government Employees | 1,414 | 11.3% |
| Federal Government Employees | 189 | 1.5% |
| Unpaid Family Workers | 8 | 0.1% |
| Total | 12,469 | 100.0% |
Employment Status by Age in West Baton Rouge Parish
According to the labor force statistics for West Baton Rouge Parish, out of the total population over 16 years of age (21,676), 63.0% or 13,656 individuals are in the labor force, with 7.6% or 1,038 of them unemployed. The age group with the highest labor force participation rate is 30 to 34 years, with 83.8% or 1,947 individuals in the labor force. Within the labor force, the 20 to 24 years age range has the highest percentage of unemployed individuals, with 17.0% or 153 of them being unemployed.
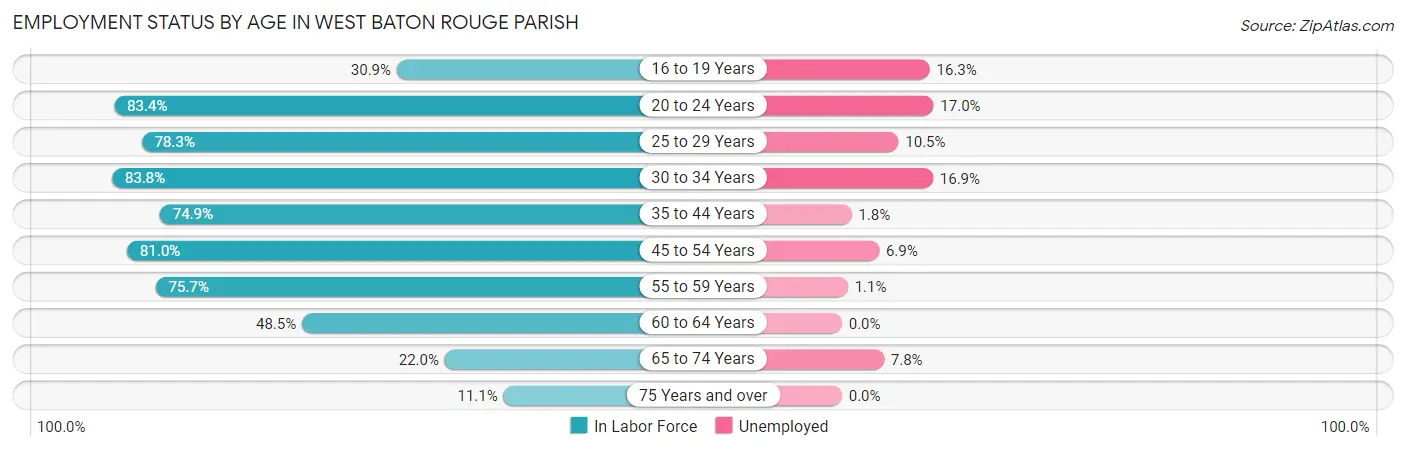
| Age Bracket | In Labor Force | Unemployed |
| 16 to 19 Years | 362 (30.9%) | 59 (16.3%) |
| 20 to 24 Years | 901 (83.4%) | 153 (17.0%) |
| 25 to 29 Years | 1,976 (78.3%) | 207 (10.5%) |
| 30 to 34 Years | 1,947 (83.8%) | 329 (16.9%) |
| 35 to 44 Years | 2,967 (74.9%) | 53 (1.8%) |
| 45 to 54 Years | 2,543 (81.0%) | 175 (6.9%) |
| 55 to 59 Years | 1,487 (75.7%) | 16 (1.1%) |
| 60 to 64 Years | 788 (48.5%) | 0 (0.0%) |
| 65 to 74 Years | 525 (22.0%) | 41 (7.8%) |
| 75 Years and over | 167 (11.1%) | 0 (0.0%) |
| Total | 13,656 (63.0%) | 1,038 (7.6%) |
Employment Status by Educational Attainment in West Baton Rouge Parish
According to labor force statistics for West Baton Rouge Parish, 75.3% of individuals (11,699) out of the total population between 25 and 64 years of age (15,536) are in the labor force, with 6.7% or 784 of them being unemployed. The group with the highest labor force participation rate are those with the educational attainment of bachelor's degree or higher, with 89.1% or 3,656 individuals in the labor force. Within the labor force, individuals with less than high school education have the highest percentage of unemployment, with 32.4% or 295 of them being unemployed.
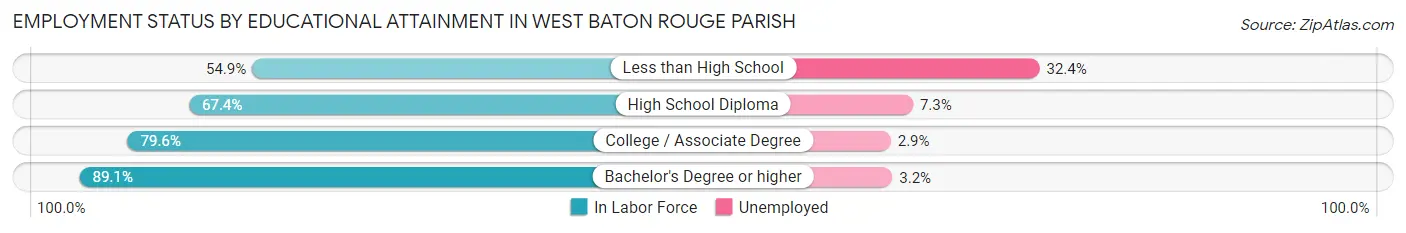
| Educational Attainment | In Labor Force | Unemployed |
| Less than High School | 912 (54.9%) | 538 (32.4%) |
| High School Diploma | 3,578 (67.4%) | 388 (7.3%) |
| College / Associate Degree | 3,552 (79.6%) | 129 (2.9%) |
| Bachelor's Degree or higher | 3,656 (89.1%) | 131 (3.2%) |
| Total | 11,699 (75.3%) | 1,041 (6.7%) |
Employment Occupations by Sex in West Baton Rouge Parish
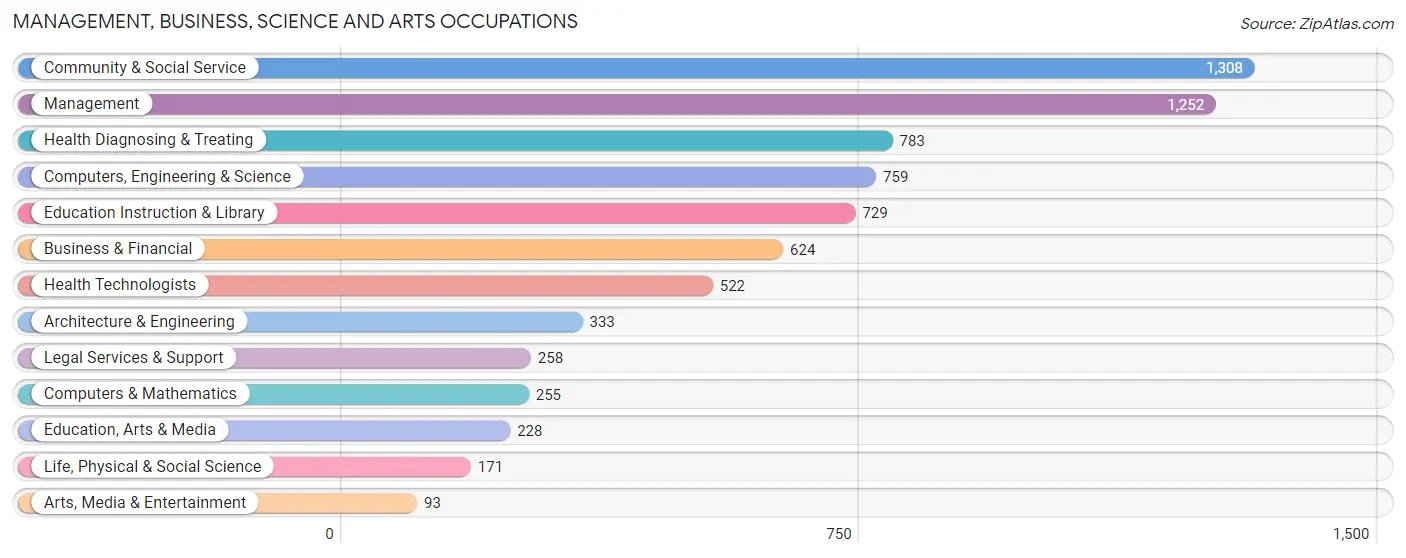
Management, Business, Science and Arts Occupations
The most common Management, Business, Science and Arts occupations in West Baton Rouge Parish are Community & Social Service (1,308 | 10.4%), Management (1,252 | 10.0%), Health Diagnosing & Treating (783 | 6.2%), Computers, Engineering & Science (759 | 6.0%), and Education Instruction & Library (729 | 5.8%).
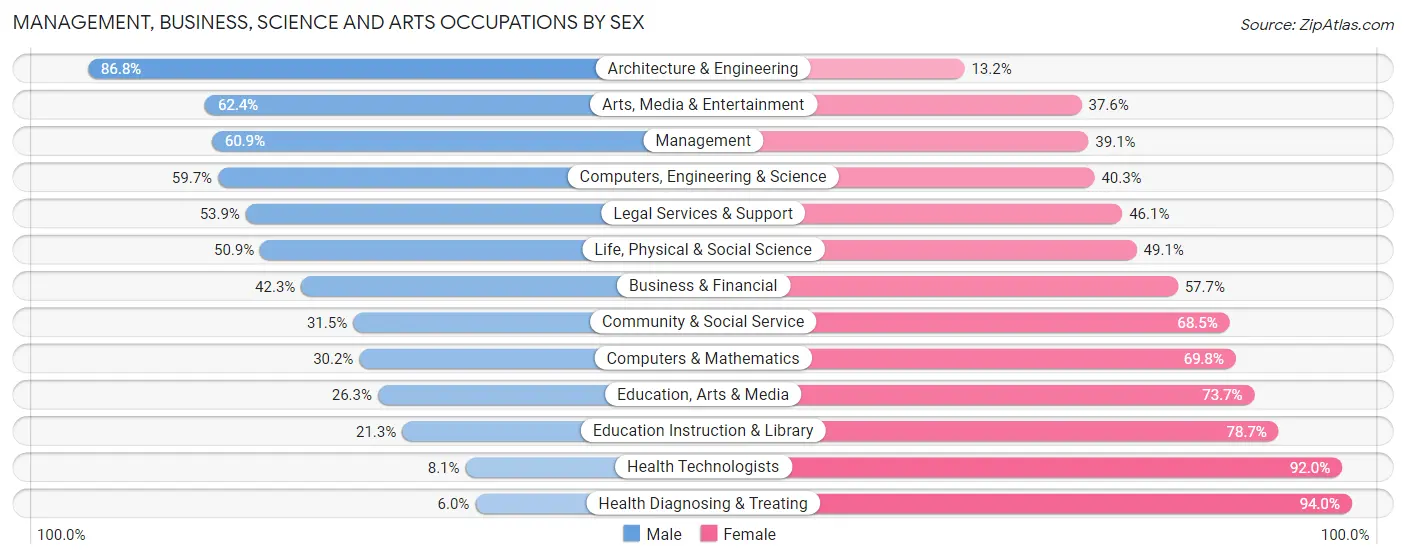
Management, Business, Science and Arts Occupations by Sex
Within the Management, Business, Science and Arts occupations in West Baton Rouge Parish, the most male-oriented occupations are Architecture & Engineering (86.8%), Arts, Media & Entertainment (62.4%), and Management (60.9%), while the most female-oriented occupations are Health Diagnosing & Treating (94.0%), Health Technologists (91.9%), and Education Instruction & Library (78.7%).
| Occupation | Male | Female |
| Management | 763 (60.9%) | 489 (39.1%) |
| Business & Financial | 264 (42.3%) | 360 (57.7%) |
| Computers, Engineering & Science | 453 (59.7%) | 306 (40.3%) |
| Computers & Mathematics | 77 (30.2%) | 178 (69.8%) |
| Architecture & Engineering | 289 (86.8%) | 44 (13.2%) |
| Life, Physical & Social Science | 87 (50.9%) | 84 (49.1%) |
| Community & Social Service | 412 (31.5%) | 896 (68.5%) |
| Education, Arts & Media | 60 (26.3%) | 168 (73.7%) |
| Legal Services & Support | 139 (53.9%) | 119 (46.1%) |
| Education Instruction & Library | 155 (21.3%) | 574 (78.7%) |
| Arts, Media & Entertainment | 58 (62.4%) | 35 (37.6%) |
| Health Diagnosing & Treating | 47 (6.0%) | 736 (94.0%) |
| Health Technologists | 42 (8.1%) | 480 (91.9%) |
| Total (Category) | 1,939 (41.0%) | 2,787 (59.0%) |
| Total (Overall) | 6,682 (53.2%) | 5,878 (46.8%) |
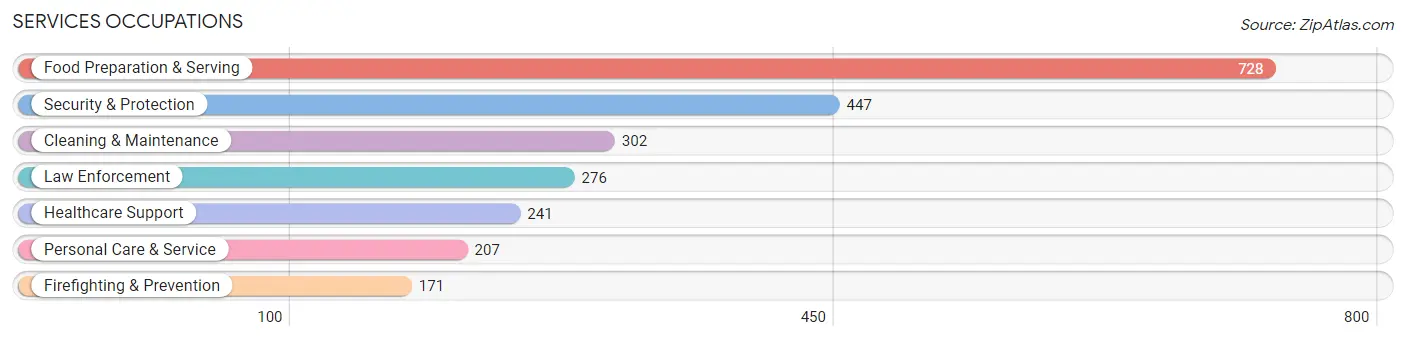
Services Occupations
The most common Services occupations in West Baton Rouge Parish are Food Preparation & Serving (728 | 5.8%), Security & Protection (447 | 3.6%), Cleaning & Maintenance (302 | 2.4%), Law Enforcement (276 | 2.2%), and Healthcare Support (241 | 1.9%).
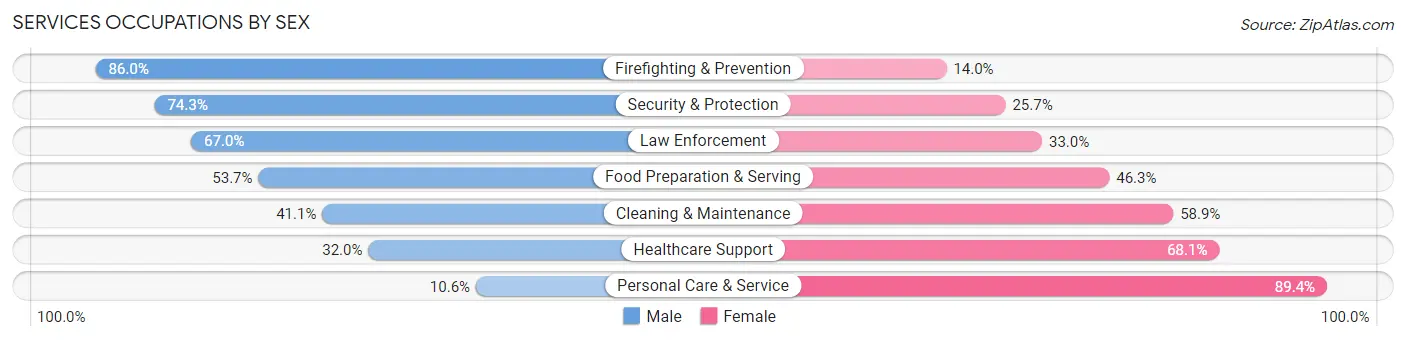
Services Occupations by Sex
Within the Services occupations in West Baton Rouge Parish, the most male-oriented occupations are Firefighting & Prevention (86.0%), Security & Protection (74.3%), and Law Enforcement (67.0%), while the most female-oriented occupations are Personal Care & Service (89.4%), Healthcare Support (68.0%), and Cleaning & Maintenance (58.9%).
| Occupation | Male | Female |
| Healthcare Support | 77 (32.0%) | 164 (68.0%) |
| Security & Protection | 332 (74.3%) | 115 (25.7%) |
| Firefighting & Prevention | 147 (86.0%) | 24 (14.0%) |
| Law Enforcement | 185 (67.0%) | 91 (33.0%) |
| Food Preparation & Serving | 391 (53.7%) | 337 (46.3%) |
| Cleaning & Maintenance | 124 (41.1%) | 178 (58.9%) |
| Personal Care & Service | 22 (10.6%) | 185 (89.4%) |
| Total (Category) | 946 (49.1%) | 979 (50.9%) |
| Total (Overall) | 6,682 (53.2%) | 5,878 (46.8%) |
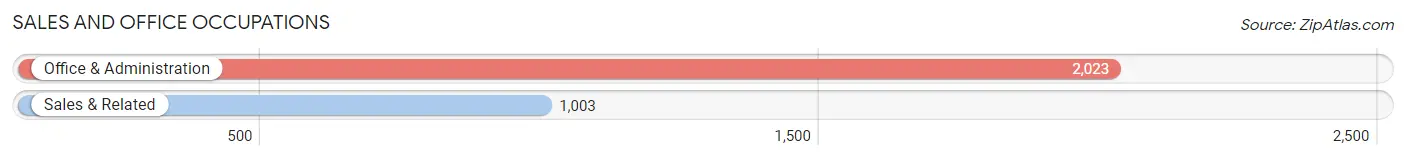
Sales and Office Occupations
The most common Sales and Office occupations in West Baton Rouge Parish are Office & Administration (2,023 | 16.1%), and Sales & Related (1,003 | 8.0%).
Sales and Office Occupations by Sex
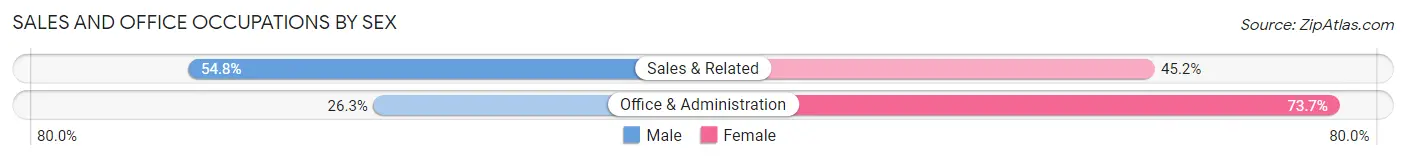
| Occupation | Male | Female |
| Sales & Related | 550 (54.8%) | 453 (45.2%) |
| Office & Administration | 532 (26.3%) | 1,491 (73.7%) |
| Total (Category) | 1,082 (35.8%) | 1,944 (64.2%) |
| Total (Overall) | 6,682 (53.2%) | 5,878 (46.8%) |
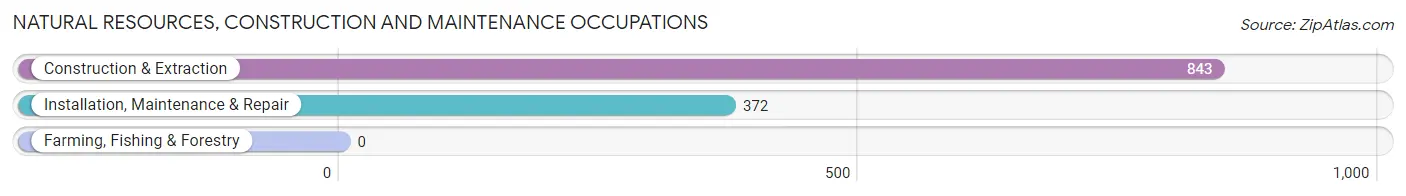
Natural Resources, Construction and Maintenance Occupations
The most common Natural Resources, Construction and Maintenance occupations in West Baton Rouge Parish are Construction & Extraction (843 | 6.7%), and Installation, Maintenance & Repair (372 | 3.0%).
Natural Resources, Construction and Maintenance Occupations by Sex
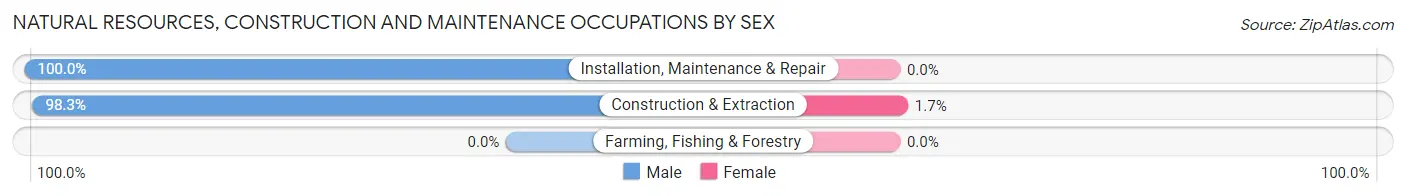
| Occupation | Male | Female |
| Farming, Fishing & Forestry | 0 (0.0%) | 0 (0.0%) |
| Construction & Extraction | 829 (98.3%) | 14 (1.7%) |
| Installation, Maintenance & Repair | 372 (100.0%) | 0 (0.0%) |
| Total (Category) | 1,201 (98.9%) | 14 (1.1%) |
| Total (Overall) | 6,682 (53.2%) | 5,878 (46.8%) |
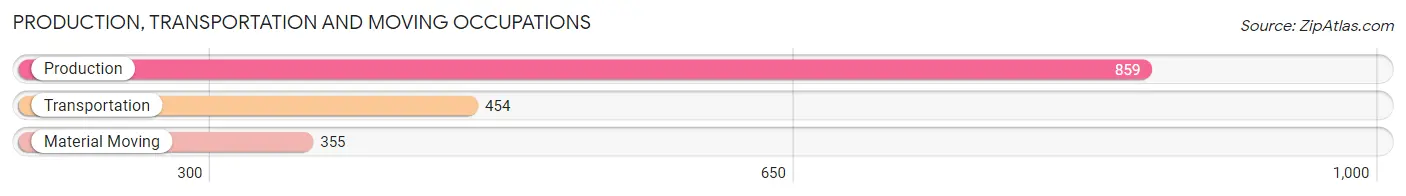
Production, Transportation and Moving Occupations
The most common Production, Transportation and Moving occupations in West Baton Rouge Parish are Production (859 | 6.8%), Transportation (454 | 3.6%), and Material Moving (355 | 2.8%).
Production, Transportation and Moving Occupations by Sex
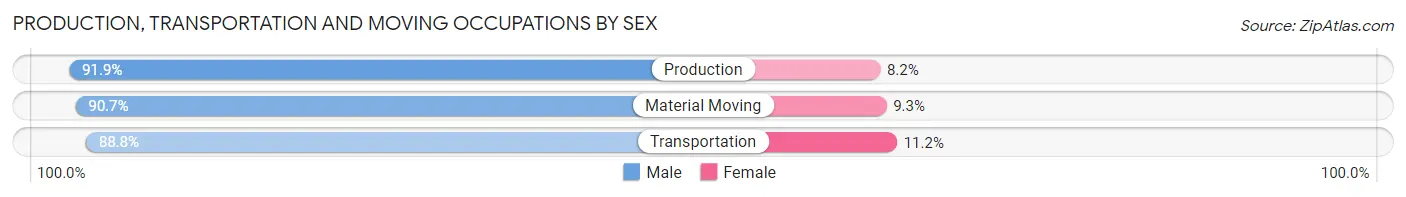
| Occupation | Male | Female |
| Production | 789 (91.8%) | 70 (8.2%) |
| Transportation | 403 (88.8%) | 51 (11.2%) |
| Material Moving | 322 (90.7%) | 33 (9.3%) |
| Total (Category) | 1,514 (90.8%) | 154 (9.2%) |
| Total (Overall) | 6,682 (53.2%) | 5,878 (46.8%) |
Employment Industries by Sex in West Baton Rouge Parish
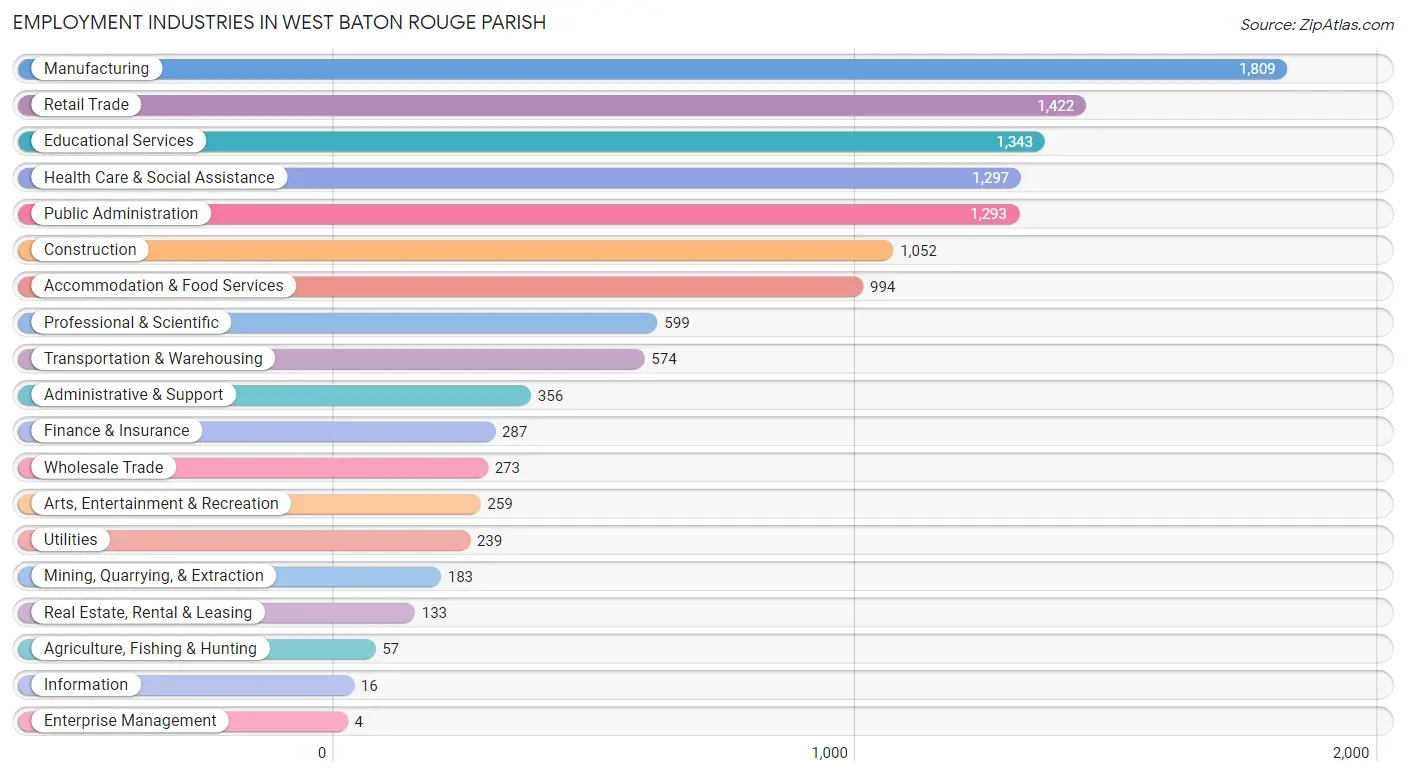
Employment Industries in West Baton Rouge Parish
The major employment industries in West Baton Rouge Parish include Manufacturing (1,809 | 14.4%), Retail Trade (1,422 | 11.3%), Educational Services (1,343 | 10.7%), Health Care & Social Assistance (1,297 | 10.3%), and Public Administration (1,293 | 10.3%).
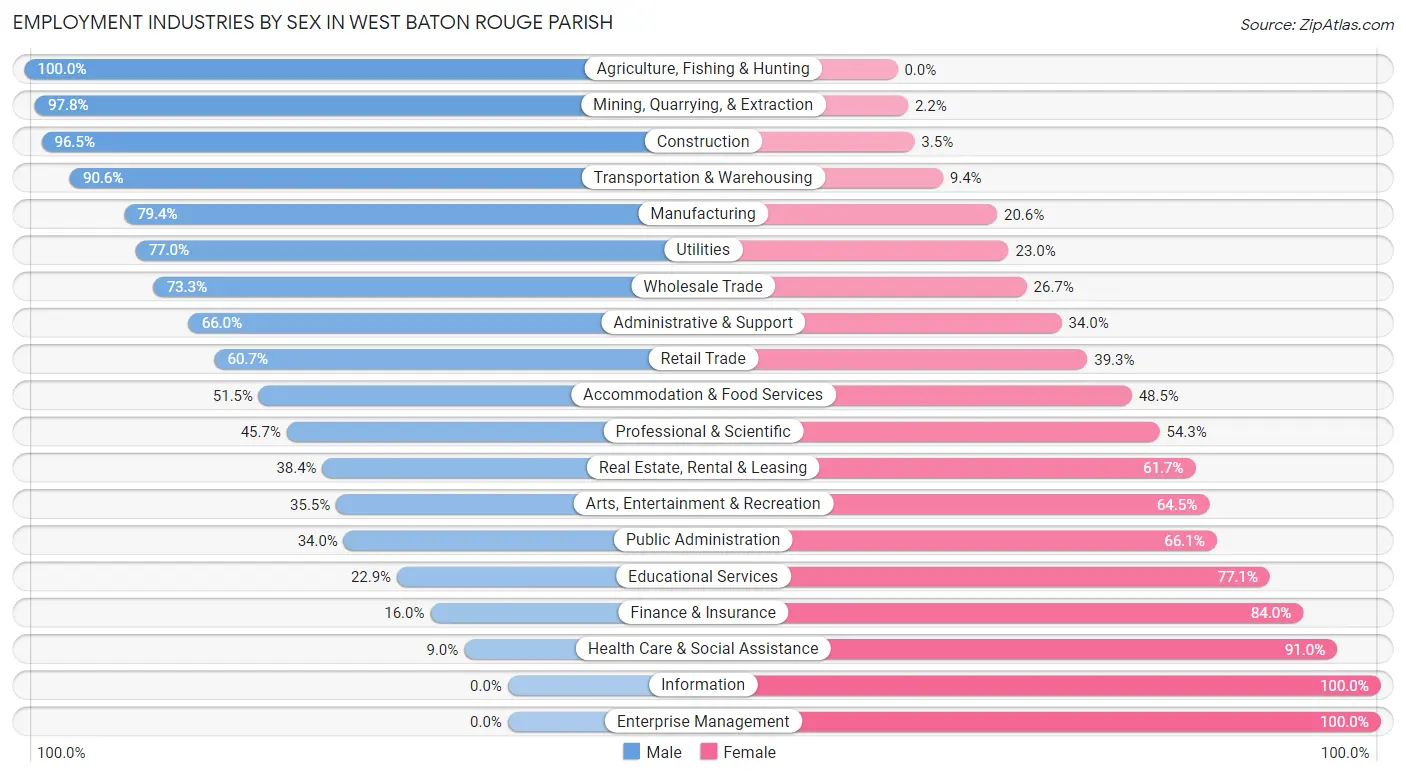
Employment Industries by Sex in West Baton Rouge Parish
The West Baton Rouge Parish industries that see more men than women are Agriculture, Fishing & Hunting (100.0%), Mining, Quarrying, & Extraction (97.8%), and Construction (96.5%), whereas the industries that tend to have a higher number of women are Information (100.0%), Enterprise Management (100.0%), and Health Care & Social Assistance (91.0%).
| Industry | Male | Female |
| Agriculture, Fishing & Hunting | 57 (100.0%) | 0 (0.0%) |
| Mining, Quarrying, & Extraction | 179 (97.8%) | 4 (2.2%) |
| Construction | 1,015 (96.5%) | 37 (3.5%) |
| Manufacturing | 1,436 (79.4%) | 373 (20.6%) |
| Wholesale Trade | 200 (73.3%) | 73 (26.7%) |
| Retail Trade | 863 (60.7%) | 559 (39.3%) |
| Transportation & Warehousing | 520 (90.6%) | 54 (9.4%) |
| Utilities | 184 (77.0%) | 55 (23.0%) |
| Information | 0 (0.0%) | 16 (100.0%) |
| Finance & Insurance | 46 (16.0%) | 241 (84.0%) |
| Real Estate, Rental & Leasing | 51 (38.4%) | 82 (61.7%) |
| Professional & Scientific | 274 (45.7%) | 325 (54.3%) |
| Enterprise Management | 0 (0.0%) | 4 (100.0%) |
| Administrative & Support | 235 (66.0%) | 121 (34.0%) |
| Educational Services | 308 (22.9%) | 1,035 (77.1%) |
| Health Care & Social Assistance | 117 (9.0%) | 1,180 (91.0%) |
| Arts, Entertainment & Recreation | 92 (35.5%) | 167 (64.5%) |
| Accommodation & Food Services | 512 (51.5%) | 482 (48.5%) |
| Public Administration | 439 (34.0%) | 854 (66.0%) |
| Total | 6,682 (53.2%) | 5,878 (46.8%) |
Education in West Baton Rouge Parish
School Enrollment in West Baton Rouge Parish
The most common levels of schooling among the 6,692 students in West Baton Rouge Parish are middle school (1,618 | 24.2%), elementary school (1,299 | 19.4%), and high school (1,136 | 17.0%).
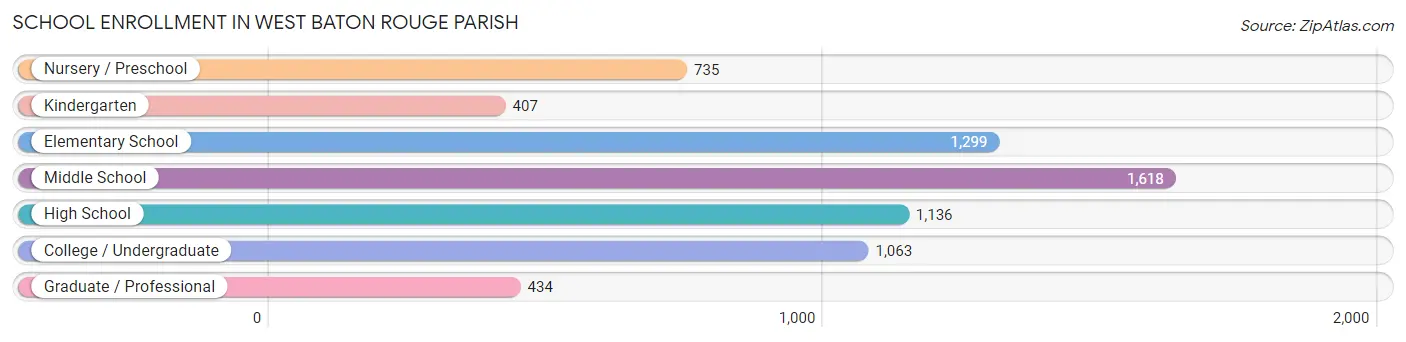
| School Level | # Students | % Students |
| Nursery / Preschool | 735 | 11.0% |
| Kindergarten | 407 | 6.1% |
| Elementary School | 1,299 | 19.4% |
| Middle School | 1,618 | 24.2% |
| High School | 1,136 | 17.0% |
| College / Undergraduate | 1,063 | 15.9% |
| Graduate / Professional | 434 | 6.5% |
| Total | 6,692 | 100.0% |
School Enrollment by Age by Funding Source in West Baton Rouge Parish
Out of a total of 6,692 students who are enrolled in schools in West Baton Rouge Parish, 1,492 (22.3%) attend a private institution, while the remaining 5,200 (77.7%) are enrolled in public schools. The age group of 25 to 34 year olds has the highest likelihood of being enrolled in private schools, with 252 (37.7% in the age bracket) enrolled. Conversely, the age group of 20 to 24 year olds has the lowest likelihood of being enrolled in a private school, with 295 (97.4% in the age bracket) attending a public institution.
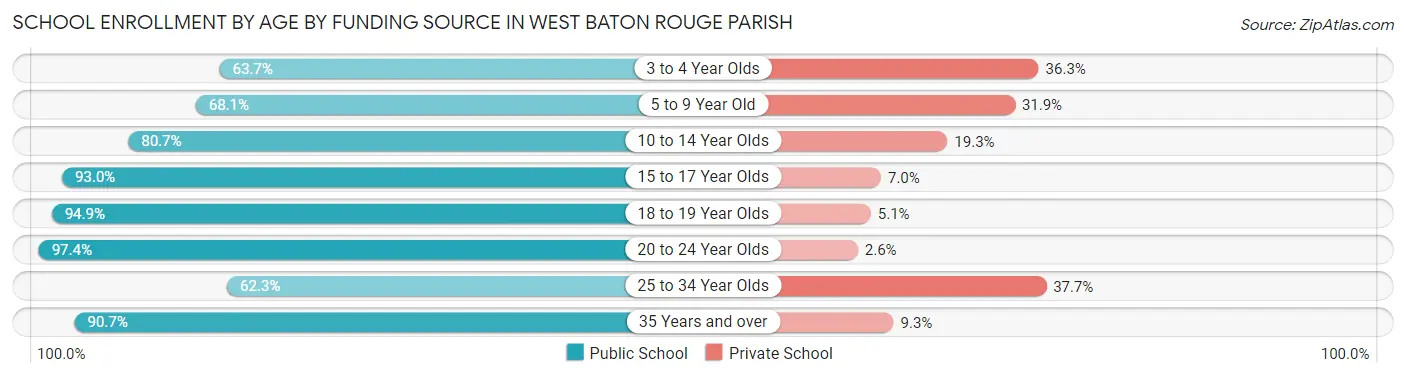
| Age Bracket | Public School | Private School |
| 3 to 4 Year Olds | 419 (63.7%) | 239 (36.3%) |
| 5 to 9 Year Old | 1,138 (68.1%) | 533 (31.9%) |
| 10 to 14 Year Olds | 1,474 (80.7%) | 353 (19.3%) |
| 15 to 17 Year Olds | 922 (93.0%) | 69 (7.0%) |
| 18 to 19 Year Olds | 300 (94.9%) | 16 (5.1%) |
| 20 to 24 Year Olds | 295 (97.4%) | 8 (2.6%) |
| 25 to 34 Year Olds | 416 (62.3%) | 252 (37.7%) |
| 35 Years and over | 234 (90.7%) | 24 (9.3%) |
| Total | 5,200 (77.7%) | 1,492 (22.3%) |
Educational Attainment by Field of Study in West Baton Rouge Parish
Business (853 | 18.4%), science & technology (603 | 13.0%), education (592 | 12.8%), engineering (509 | 11.0%), and liberal arts & history (400 | 8.6%) are the most common fields of study among 4,636 individuals in West Baton Rouge Parish who have obtained a bachelor's degree or higher.
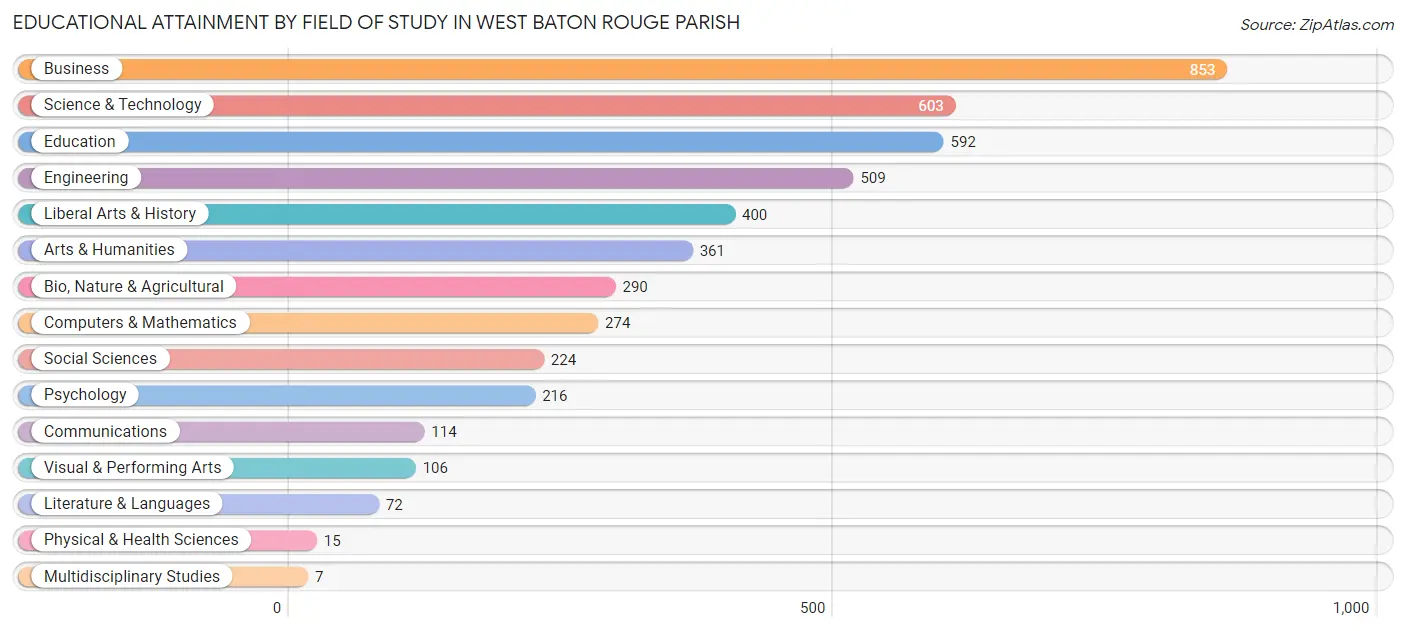
| Field of Study | # Graduates | % Graduates |
| Computers & Mathematics | 274 | 5.9% |
| Bio, Nature & Agricultural | 290 | 6.3% |
| Physical & Health Sciences | 15 | 0.3% |
| Psychology | 216 | 4.7% |
| Social Sciences | 224 | 4.8% |
| Engineering | 509 | 11.0% |
| Multidisciplinary Studies | 7 | 0.2% |
| Science & Technology | 603 | 13.0% |
| Business | 853 | 18.4% |
| Education | 592 | 12.8% |
| Literature & Languages | 72 | 1.5% |
| Liberal Arts & History | 400 | 8.6% |
| Visual & Performing Arts | 106 | 2.3% |
| Communications | 114 | 2.5% |
| Arts & Humanities | 361 | 7.8% |
| Total | 4,636 | 100.0% |
Transportation & Commute in West Baton Rouge Parish
Vehicle Availability by Sex in West Baton Rouge Parish
The most prevalent vehicle ownership categories in West Baton Rouge Parish are males with 2 vehicles (3,280, accounting for 49.2%) and females with 2 vehicles (2,794, making up 56.6%).
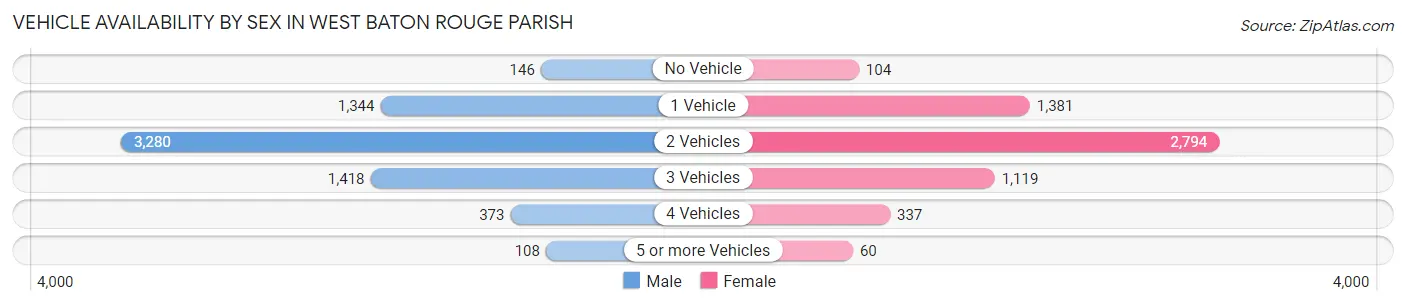
| Vehicles Available | Male | Female |
| No Vehicle | 146 (2.2%) | 104 (1.8%) |
| 1 Vehicle | 1,344 (20.2%) | 1,381 (23.8%) |
| 2 Vehicles | 3,280 (49.2%) | 2,794 (48.2%) |
| 3 Vehicles | 1,418 (21.3%) | 1,119 (19.3%) |
| 4 Vehicles | 373 (5.6%) | 337 (5.8%) |
| 5 or more Vehicles | 108 (1.6%) | 60 (1.0%) |
| Total | 6,669 (100.0%) | 5,795 (100.0%) |
Commute Time in West Baton Rouge Parish
The most frequently occuring commute durations in West Baton Rouge Parish are 20 to 24 minutes (2,004 commuters, 16.6%), 15 to 19 minutes (1,895 commuters, 15.7%), and 30 to 34 minutes (1,805 commuters, 14.9%).
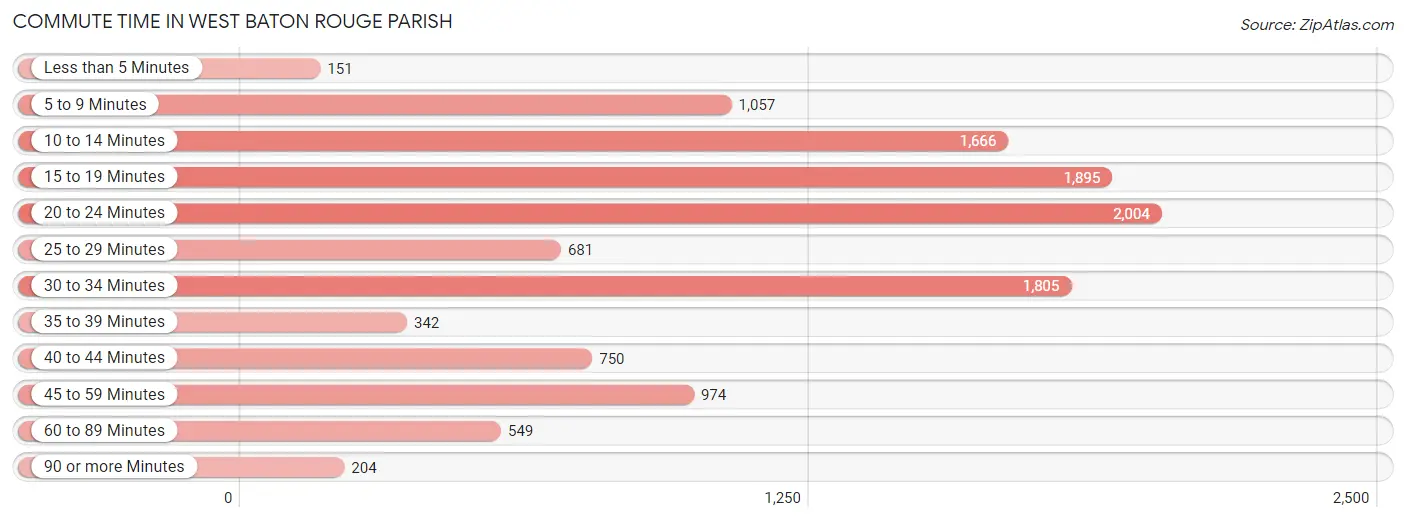
| Commute Time | # Commuters | % Commuters |
| Less than 5 Minutes | 151 | 1.3% |
| 5 to 9 Minutes | 1,057 | 8.7% |
| 10 to 14 Minutes | 1,666 | 13.8% |
| 15 to 19 Minutes | 1,895 | 15.7% |
| 20 to 24 Minutes | 2,004 | 16.6% |
| 25 to 29 Minutes | 681 | 5.6% |
| 30 to 34 Minutes | 1,805 | 14.9% |
| 35 to 39 Minutes | 342 | 2.8% |
| 40 to 44 Minutes | 750 | 6.2% |
| 45 to 59 Minutes | 974 | 8.1% |
| 60 to 89 Minutes | 549 | 4.5% |
| 90 or more Minutes | 204 | 1.7% |
Commute Time by Sex in West Baton Rouge Parish
The most common commute times in West Baton Rouge Parish are 20 to 24 minutes (1,163 commuters, 18.0%) for males and 15 to 19 minutes (1,180 commuters, 21.0%) for females.
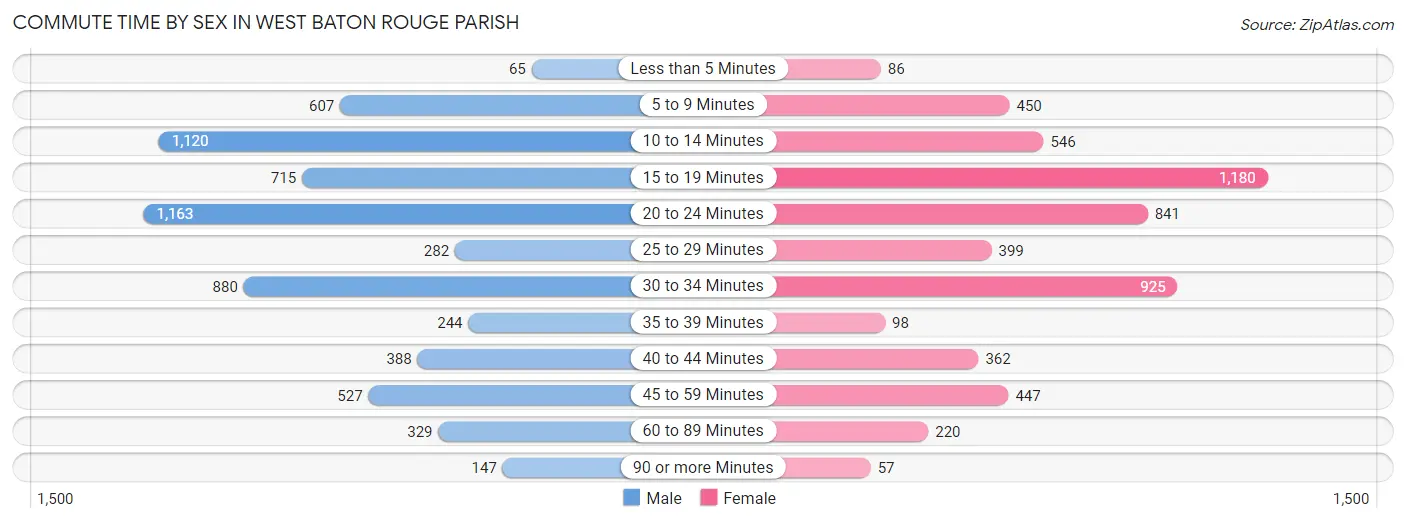
| Commute Time | Male | Female |
| Less than 5 Minutes | 65 (1.0%) | 86 (1.5%) |
| 5 to 9 Minutes | 607 (9.4%) | 450 (8.0%) |
| 10 to 14 Minutes | 1,120 (17.3%) | 546 (9.7%) |
| 15 to 19 Minutes | 715 (11.1%) | 1,180 (21.0%) |
| 20 to 24 Minutes | 1,163 (18.0%) | 841 (15.0%) |
| 25 to 29 Minutes | 282 (4.4%) | 399 (7.1%) |
| 30 to 34 Minutes | 880 (13.6%) | 925 (16.5%) |
| 35 to 39 Minutes | 244 (3.8%) | 98 (1.8%) |
| 40 to 44 Minutes | 388 (6.0%) | 362 (6.5%) |
| 45 to 59 Minutes | 527 (8.2%) | 447 (8.0%) |
| 60 to 89 Minutes | 329 (5.1%) | 220 (3.9%) |
| 90 or more Minutes | 147 (2.3%) | 57 (1.0%) |
Time of Departure to Work by Sex in West Baton Rouge Parish
The most frequent times of departure to work in West Baton Rouge Parish are 12:00 AM to 4:59 AM (1,185, 18.3%) for males and 7:00 AM to 7:29 AM (1,217, 21.7%) for females.
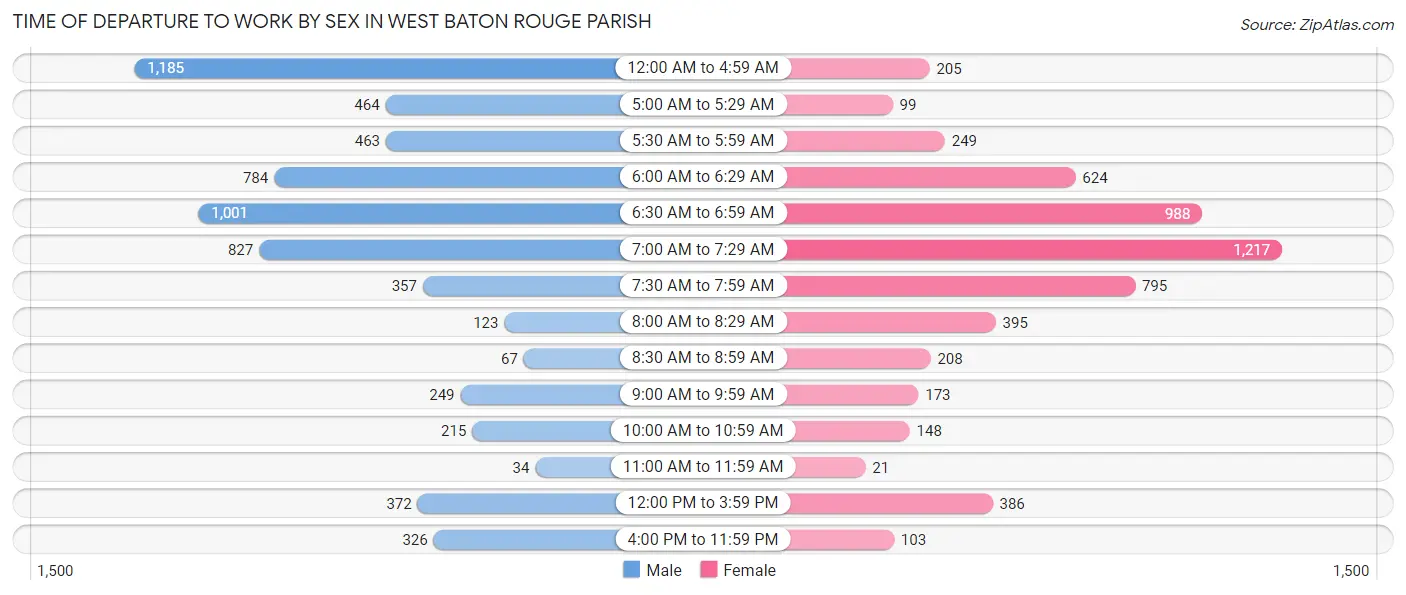
| Time of Departure | Male | Female |
| 12:00 AM to 4:59 AM | 1,185 (18.3%) | 205 (3.6%) |
| 5:00 AM to 5:29 AM | 464 (7.2%) | 99 (1.8%) |
| 5:30 AM to 5:59 AM | 463 (7.2%) | 249 (4.4%) |
| 6:00 AM to 6:29 AM | 784 (12.1%) | 624 (11.1%) |
| 6:30 AM to 6:59 AM | 1,001 (15.5%) | 988 (17.6%) |
| 7:00 AM to 7:29 AM | 827 (12.8%) | 1,217 (21.7%) |
| 7:30 AM to 7:59 AM | 357 (5.5%) | 795 (14.2%) |
| 8:00 AM to 8:29 AM | 123 (1.9%) | 395 (7.0%) |
| 8:30 AM to 8:59 AM | 67 (1.0%) | 208 (3.7%) |
| 9:00 AM to 9:59 AM | 249 (3.8%) | 173 (3.1%) |
| 10:00 AM to 10:59 AM | 215 (3.3%) | 148 (2.6%) |
| 11:00 AM to 11:59 AM | 34 (0.5%) | 21 (0.4%) |
| 12:00 PM to 3:59 PM | 372 (5.8%) | 386 (6.9%) |
| 4:00 PM to 11:59 PM | 326 (5.0%) | 103 (1.8%) |
| Total | 6,467 (100.0%) | 5,611 (100.0%) |
Housing Occupancy in West Baton Rouge Parish
Occupancy by Ownership in West Baton Rouge Parish
Of the total 10,080 dwellings in West Baton Rouge Parish, owner-occupied units account for 7,582 (75.2%), while renter-occupied units make up 2,498 (24.8%).
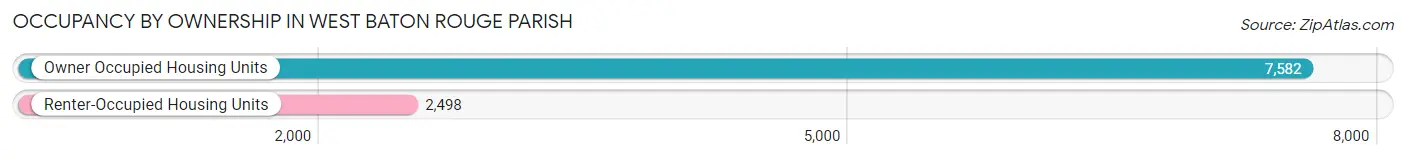
| Occupancy | # Housing Units | % Housing Units |
| Owner Occupied Housing Units | 7,582 | 75.2% |
| Renter-Occupied Housing Units | 2,498 | 24.8% |
| Total Occupied Housing Units | 10,080 | 100.0% |
Occupancy by Household Size in West Baton Rouge Parish
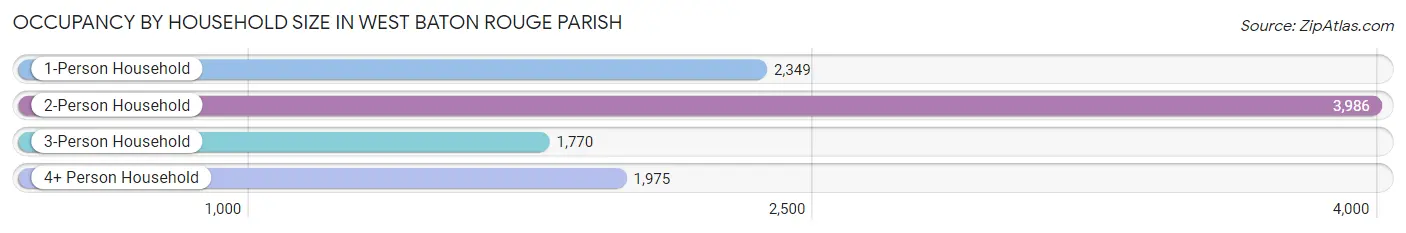
| Household Size | # Housing Units | % Housing Units |
| 1-Person Household | 2,349 | 23.3% |
| 2-Person Household | 3,986 | 39.5% |
| 3-Person Household | 1,770 | 17.6% |
| 4+ Person Household | 1,975 | 19.6% |
| Total Housing Units | 10,080 | 100.0% |
Occupancy by Ownership by Household Size in West Baton Rouge Parish
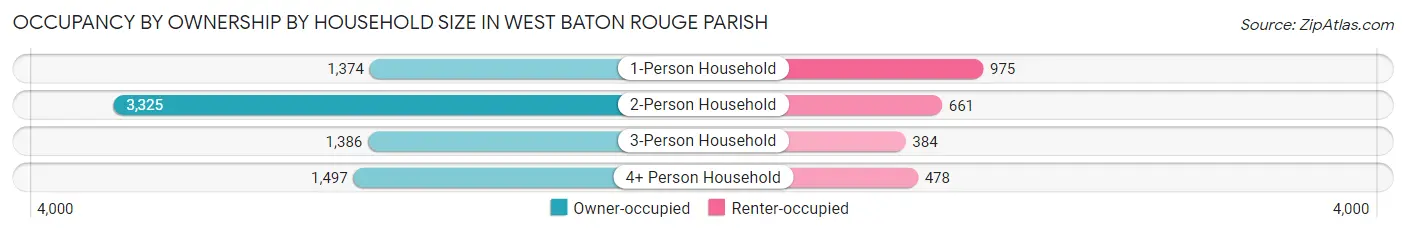
| Household Size | Owner-occupied | Renter-occupied |
| 1-Person Household | 1,374 (58.5%) | 975 (41.5%) |
| 2-Person Household | 3,325 (83.4%) | 661 (16.6%) |
| 3-Person Household | 1,386 (78.3%) | 384 (21.7%) |
| 4+ Person Household | 1,497 (75.8%) | 478 (24.2%) |
| Total Housing Units | 7,582 (75.2%) | 2,498 (24.8%) |
Occupancy by Educational Attainment in West Baton Rouge Parish
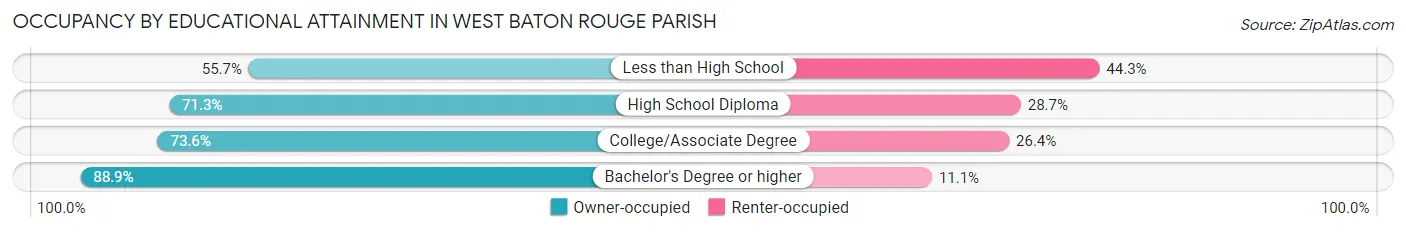
| Household Size | Owner-occupied | Renter-occupied |
| Less than High School | 481 (55.7%) | 382 (44.3%) |
| High School Diploma | 2,577 (71.3%) | 1,036 (28.7%) |
| College/Associate Degree | 2,215 (73.6%) | 793 (26.4%) |
| Bachelor's Degree or higher | 2,309 (88.9%) | 287 (11.1%) |
Occupancy by Age of Householder in West Baton Rouge Parish
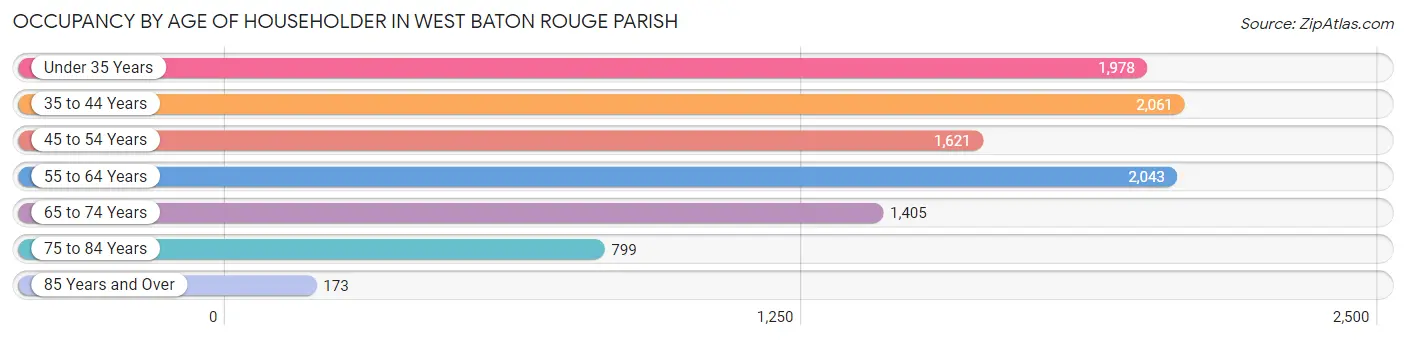
| Age Bracket | # Households | % Households |
| Under 35 Years | 1,978 | 19.6% |
| 35 to 44 Years | 2,061 | 20.4% |
| 45 to 54 Years | 1,621 | 16.1% |
| 55 to 64 Years | 2,043 | 20.3% |
| 65 to 74 Years | 1,405 | 13.9% |
| 75 to 84 Years | 799 | 7.9% |
| 85 Years and Over | 173 | 1.7% |
| Total | 10,080 | 100.0% |
Housing Finances in West Baton Rouge Parish
Median Income by Occupancy in West Baton Rouge Parish
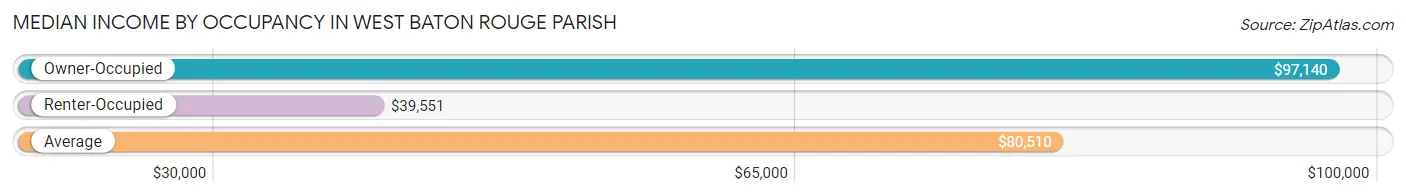
| Occupancy Type | # Households | Median Income |
| Owner-Occupied | 7,582 (75.2%) | $97,140 |
| Renter-Occupied | 2,498 (24.8%) | $39,551 |
| Average | 10,080 (100.0%) | $80,510 |
Occupancy by Householder Income Bracket in West Baton Rouge Parish
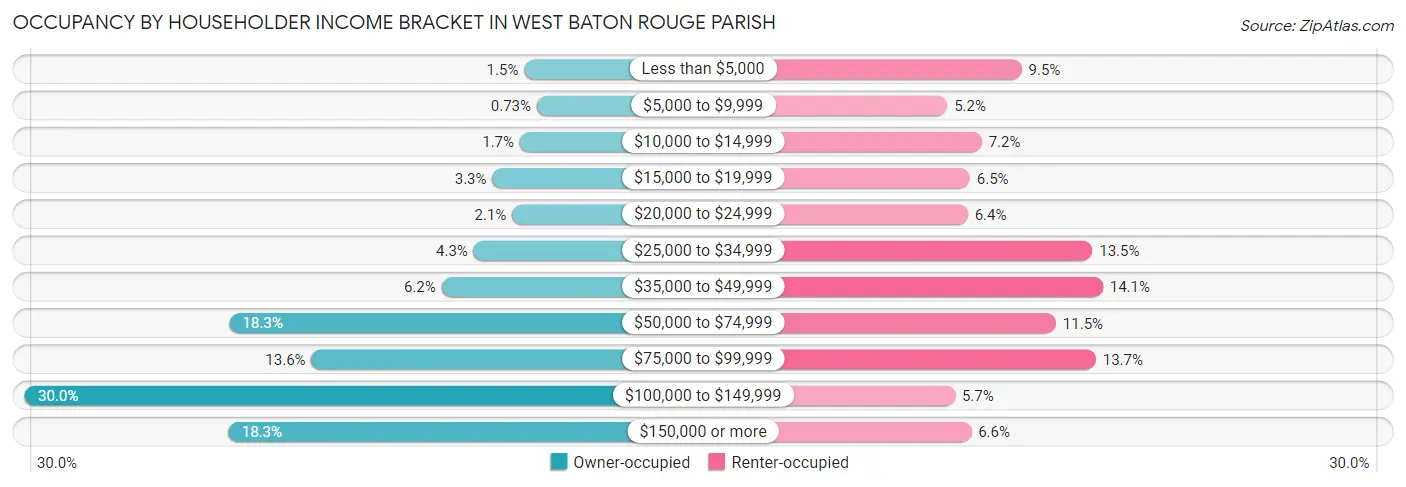
| Income Bracket | Owner-occupied | Renter-occupied |
| Less than $5,000 | 110 (1.5%) | 237 (9.5%) |
| $5,000 to $9,999 | 55 (0.7%) | 131 (5.2%) |
| $10,000 to $14,999 | 129 (1.7%) | 180 (7.2%) |
| $15,000 to $19,999 | 248 (3.3%) | 163 (6.5%) |
| $20,000 to $24,999 | 162 (2.1%) | 160 (6.4%) |
| $25,000 to $34,999 | 329 (4.3%) | 338 (13.5%) |
| $35,000 to $49,999 | 468 (6.2%) | 353 (14.1%) |
| $50,000 to $74,999 | 1,387 (18.3%) | 286 (11.5%) |
| $75,000 to $99,999 | 1,032 (13.6%) | 343 (13.7%) |
| $100,000 to $149,999 | 2,272 (30.0%) | 142 (5.7%) |
| $150,000 or more | 1,390 (18.3%) | 165 (6.6%) |
| Total | 7,582 (100.0%) | 2,498 (100.0%) |
Monthly Housing Cost Tiers in West Baton Rouge Parish
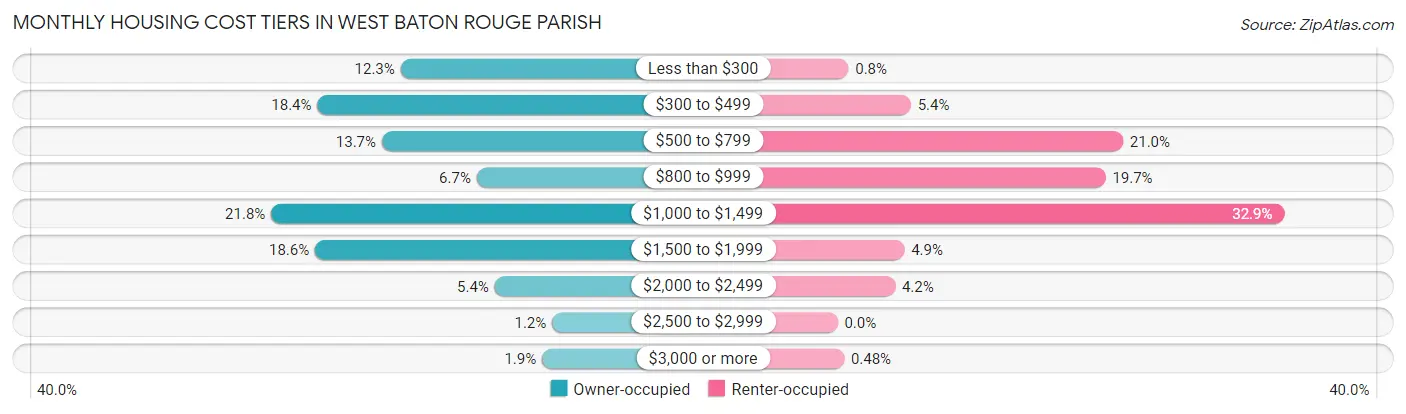
| Monthly Cost | Owner-occupied | Renter-occupied |
| Less than $300 | 933 (12.3%) | 20 (0.8%) |
| $300 to $499 | 1,398 (18.4%) | 135 (5.4%) |
| $500 to $799 | 1,038 (13.7%) | 525 (21.0%) |
| $800 to $999 | 508 (6.7%) | 493 (19.7%) |
| $1,000 to $1,499 | 1,656 (21.8%) | 822 (32.9%) |
| $1,500 to $1,999 | 1,411 (18.6%) | 123 (4.9%) |
| $2,000 to $2,499 | 408 (5.4%) | 106 (4.2%) |
| $2,500 to $2,999 | 87 (1.1%) | 0 (0.0%) |
| $3,000 or more | 143 (1.9%) | 12 (0.5%) |
| Total | 7,582 (100.0%) | 2,498 (100.0%) |
Physical Housing Characteristics in West Baton Rouge Parish
Housing Structures in West Baton Rouge Parish
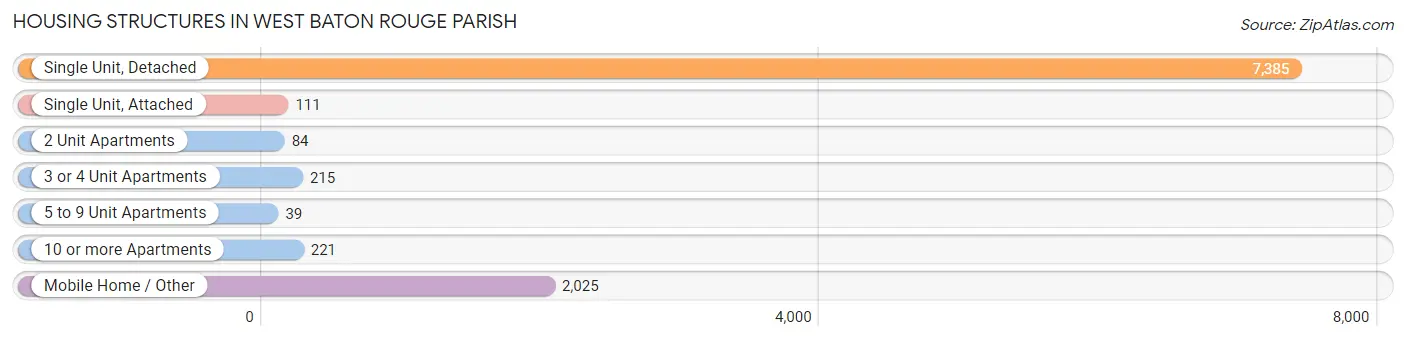
| Structure Type | # Housing Units | % Housing Units |
| Single Unit, Detached | 7,385 | 73.3% |
| Single Unit, Attached | 111 | 1.1% |
| 2 Unit Apartments | 84 | 0.8% |
| 3 or 4 Unit Apartments | 215 | 2.1% |
| 5 to 9 Unit Apartments | 39 | 0.4% |
| 10 or more Apartments | 221 | 2.2% |
| Mobile Home / Other | 2,025 | 20.1% |
| Total | 10,080 | 100.0% |
Housing Structures by Occupancy in West Baton Rouge Parish
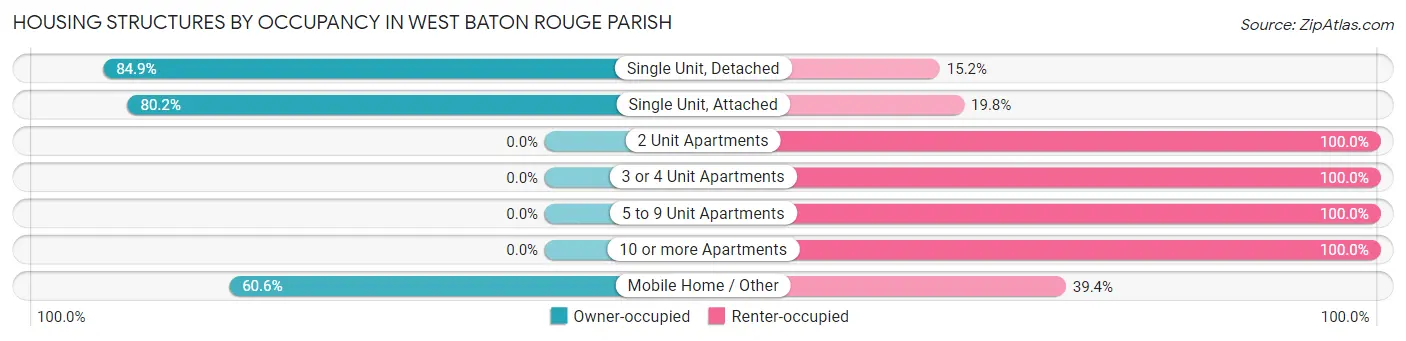
| Structure Type | Owner-occupied | Renter-occupied |
| Single Unit, Detached | 6,266 (84.9%) | 1,119 (15.1%) |
| Single Unit, Attached | 89 (80.2%) | 22 (19.8%) |
| 2 Unit Apartments | 0 (0.0%) | 84 (100.0%) |
| 3 or 4 Unit Apartments | 0 (0.0%) | 215 (100.0%) |
| 5 to 9 Unit Apartments | 0 (0.0%) | 39 (100.0%) |
| 10 or more Apartments | 0 (0.0%) | 221 (100.0%) |
| Mobile Home / Other | 1,227 (60.6%) | 798 (39.4%) |
| Total | 7,582 (75.2%) | 2,498 (24.8%) |
Housing Structures by Number of Rooms in West Baton Rouge Parish
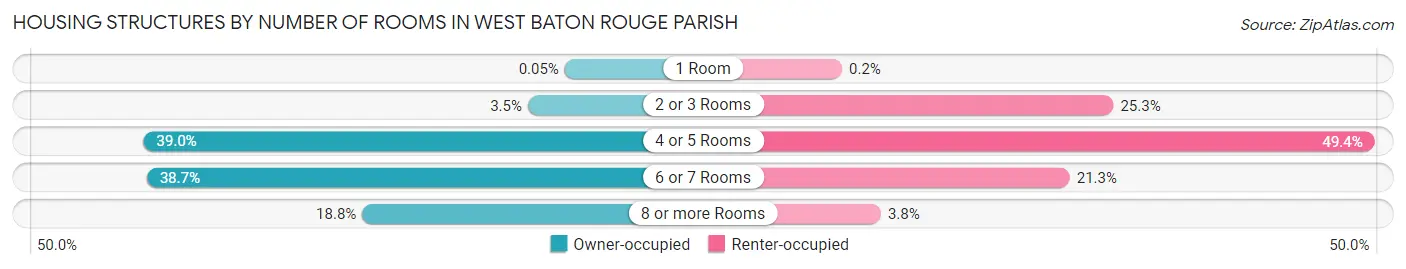
| Number of Rooms | Owner-occupied | Renter-occupied |
| 1 Room | 4 (0.1%) | 5 (0.2%) |
| 2 or 3 Rooms | 262 (3.5%) | 632 (25.3%) |
| 4 or 5 Rooms | 2,958 (39.0%) | 1,235 (49.4%) |
| 6 or 7 Rooms | 2,934 (38.7%) | 531 (21.3%) |
| 8 or more Rooms | 1,424 (18.8%) | 95 (3.8%) |
| Total | 7,582 (100.0%) | 2,498 (100.0%) |
Housing Structure by Heating Type in West Baton Rouge Parish
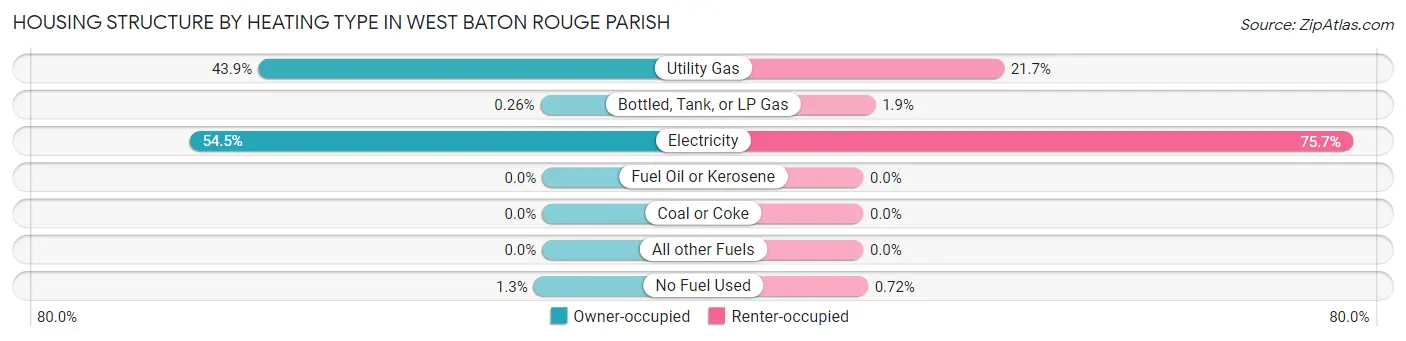
| Heating Type | Owner-occupied | Renter-occupied |
| Utility Gas | 3,330 (43.9%) | 543 (21.7%) |
| Bottled, Tank, or LP Gas | 20 (0.3%) | 47 (1.9%) |
| Electricity | 4,133 (54.5%) | 1,890 (75.7%) |
| Fuel Oil or Kerosene | 0 (0.0%) | 0 (0.0%) |
| Coal or Coke | 0 (0.0%) | 0 (0.0%) |
| All other Fuels | 0 (0.0%) | 0 (0.0%) |
| No Fuel Used | 99 (1.3%) | 18 (0.7%) |
| Total | 7,582 (100.0%) | 2,498 (100.0%) |
Household Vehicle Usage in West Baton Rouge Parish
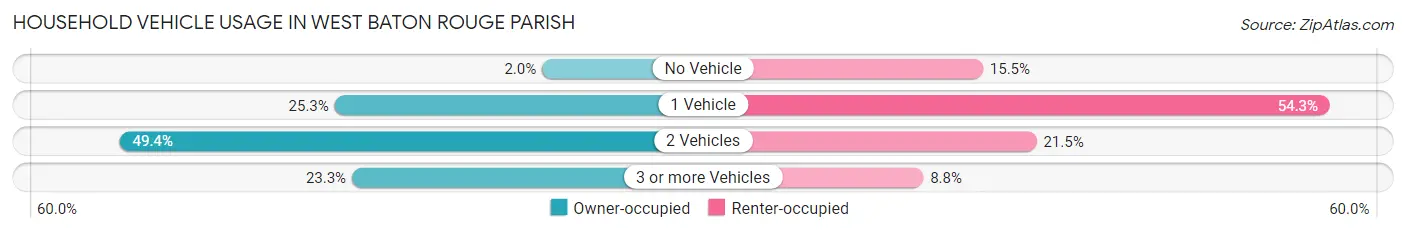
| Vehicles per Household | Owner-occupied | Renter-occupied |
| No Vehicle | 155 (2.0%) | 386 (15.4%) |
| 1 Vehicle | 1,916 (25.3%) | 1,357 (54.3%) |
| 2 Vehicles | 3,742 (49.3%) | 536 (21.5%) |
| 3 or more Vehicles | 1,769 (23.3%) | 219 (8.8%) |
| Total | 7,582 (100.0%) | 2,498 (100.0%) |
Real Estate & Mortgages in West Baton Rouge Parish
Real Estate and Mortgage Overview in West Baton Rouge Parish
| Characteristic | Without Mortgage | With Mortgage |
| Housing Units | 3,418 | 4,164 |
| Median Property Value | $192,100 | $238,900 |
| Median Household Income | $73,917 | $991 |
| Monthly Housing Costs | $399 | $143 |
| Real Estate Taxes | $987 | $662 |
Property Value by Mortgage Status in West Baton Rouge Parish
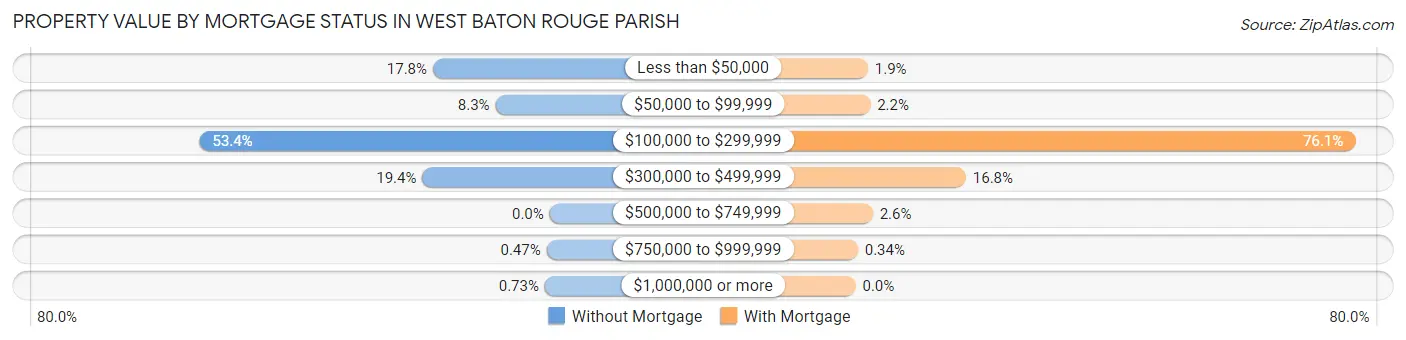
| Property Value | Without Mortgage | With Mortgage |
| Less than $50,000 | 608 (17.8%) | 78 (1.9%) |
| $50,000 to $99,999 | 282 (8.3%) | 93 (2.2%) |
| $100,000 to $299,999 | 1,824 (53.4%) | 3,170 (76.1%) |
| $300,000 to $499,999 | 663 (19.4%) | 700 (16.8%) |
| $500,000 to $749,999 | 0 (0.0%) | 109 (2.6%) |
| $750,000 to $999,999 | 16 (0.5%) | 14 (0.3%) |
| $1,000,000 or more | 25 (0.7%) | 0 (0.0%) |
| Total | 3,418 (100.0%) | 4,164 (100.0%) |
Household Income by Mortgage Status in West Baton Rouge Parish
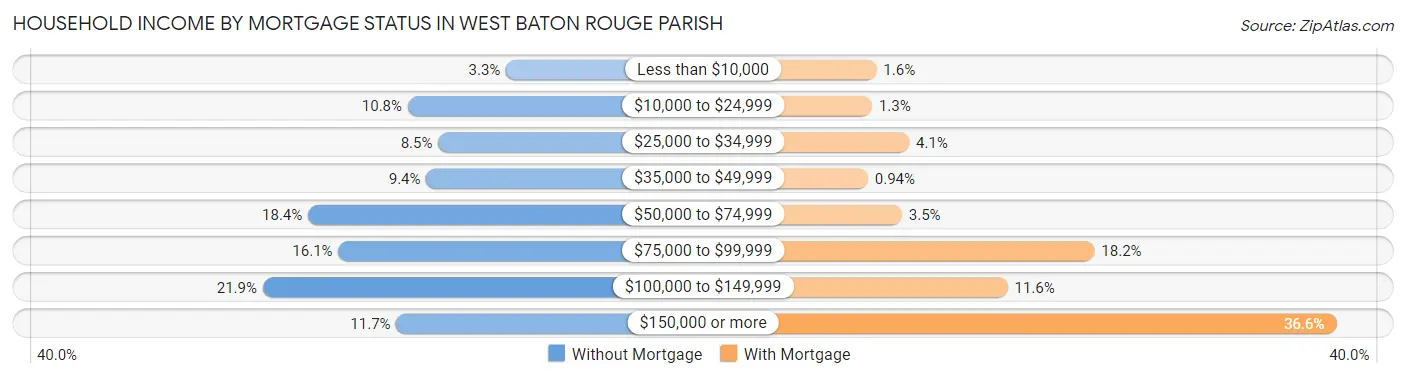
| Household Income | Without Mortgage | With Mortgage |
| Less than $10,000 | 113 (3.3%) | 66 (1.6%) |
| $10,000 to $24,999 | 369 (10.8%) | 52 (1.3%) |
| $25,000 to $34,999 | 290 (8.5%) | 170 (4.1%) |
| $35,000 to $49,999 | 321 (9.4%) | 39 (0.9%) |
| $50,000 to $74,999 | 629 (18.4%) | 147 (3.5%) |
| $75,000 to $99,999 | 550 (16.1%) | 758 (18.2%) |
| $100,000 to $149,999 | 747 (21.8%) | 482 (11.6%) |
| $150,000 or more | 399 (11.7%) | 1,525 (36.6%) |
| Total | 3,418 (100.0%) | 4,164 (100.0%) |
Property Value to Household Income Ratio in West Baton Rouge Parish
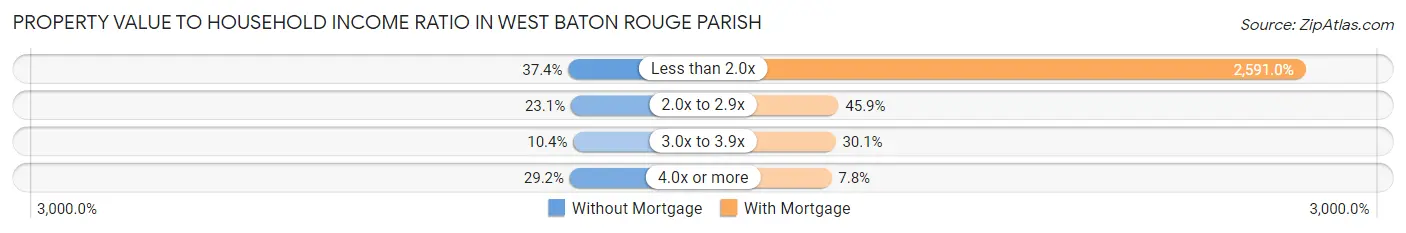
| Value-to-Income Ratio | Without Mortgage | With Mortgage |
| Less than 2.0x | 1,277 (37.4%) | 107,890 (2,591.0%) |
| 2.0x to 2.9x | 790 (23.1%) | 1,911 (45.9%) |
| 3.0x to 3.9x | 354 (10.4%) | 1,253 (30.1%) |
| 4.0x or more | 997 (29.2%) | 323 (7.8%) |
| Total | 3,418 (100.0%) | 4,164 (100.0%) |
Real Estate Taxes by Mortgage Status in West Baton Rouge Parish
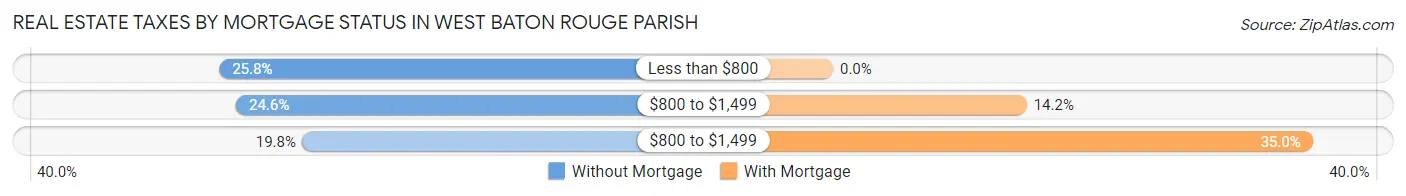
| Property Taxes | Without Mortgage | With Mortgage |
| Less than $800 | 881 (25.8%) | 0 (0.0%) |
| $800 to $1,499 | 839 (24.5%) | 589 (14.1%) |
| $800 to $1,499 | 675 (19.8%) | 1,459 (35.0%) |
| Total | 3,418 (100.0%) | 4,164 (100.0%) |
Health & Disability in West Baton Rouge Parish
Health Insurance Coverage by Age in West Baton Rouge Parish
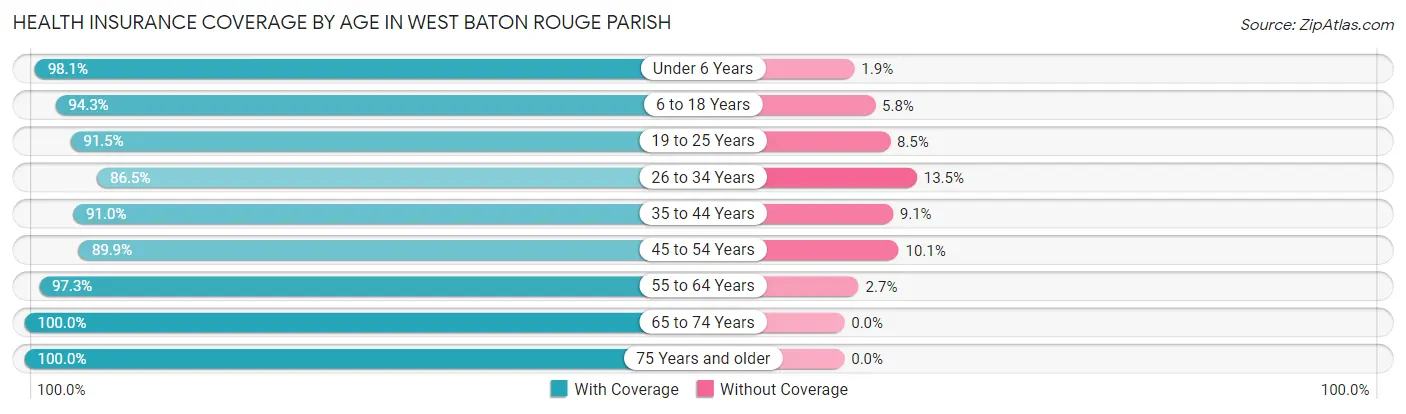
| Age Bracket | With Coverage | Without Coverage |
| Under 6 Years | 2,022 (98.1%) | 39 (1.9%) |
| 6 to 18 Years | 4,327 (94.3%) | 264 (5.8%) |
| 19 to 25 Years | 1,608 (91.5%) | 150 (8.5%) |
| 26 to 34 Years | 3,536 (86.5%) | 553 (13.5%) |
| 35 to 44 Years | 3,347 (90.9%) | 333 (9.0%) |
| 45 to 54 Years | 2,672 (89.9%) | 301 (10.1%) |
| 55 to 64 Years | 3,448 (97.3%) | 95 (2.7%) |
| 65 to 74 Years | 2,385 (100.0%) | 0 (0.0%) |
| 75 Years and older | 1,505 (100.0%) | 0 (0.0%) |
| Total | 24,850 (93.5%) | 1,735 (6.5%) |
Health Insurance Coverage by Citizenship Status in West Baton Rouge Parish
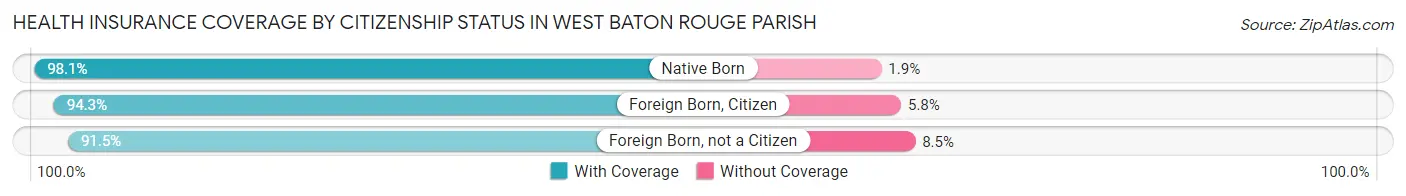
| Citizenship Status | With Coverage | Without Coverage |
| Native Born | 2,022 (98.1%) | 39 (1.9%) |
| Foreign Born, Citizen | 4,327 (94.3%) | 264 (5.8%) |
| Foreign Born, not a Citizen | 1,608 (91.5%) | 150 (8.5%) |
Health Insurance Coverage by Household Income in West Baton Rouge Parish
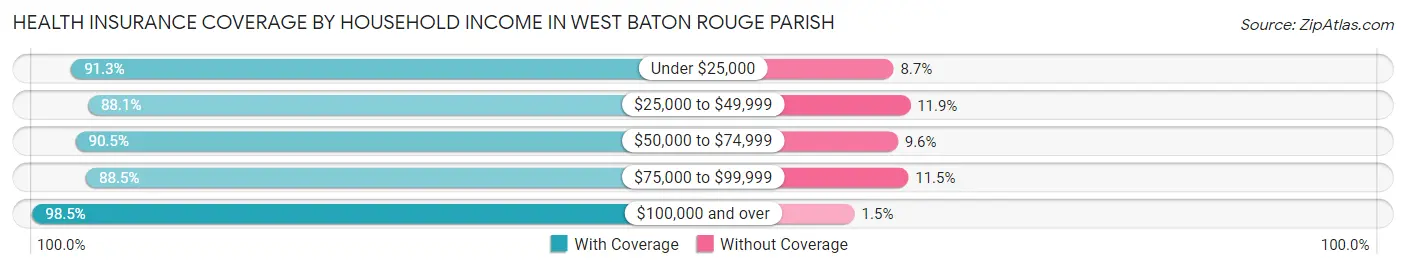
| Household Income | With Coverage | Without Coverage |
| Under $25,000 | 2,653 (91.3%) | 254 (8.7%) |
| $25,000 to $49,999 | 3,836 (88.1%) | 517 (11.9%) |
| $50,000 to $74,999 | 3,635 (90.4%) | 384 (9.6%) |
| $75,000 to $99,999 | 3,103 (88.5%) | 404 (11.5%) |
| $100,000 and over | 11,494 (98.5%) | 172 (1.5%) |
Public vs Private Health Insurance Coverage by Age in West Baton Rouge Parish
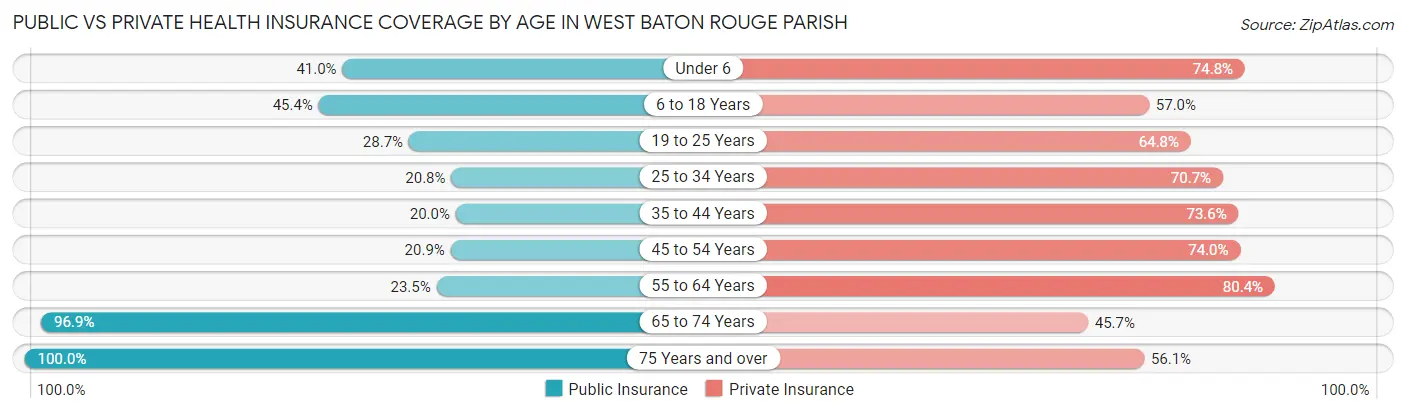
| Age Bracket | Public Insurance | Private Insurance |
| Under 6 | 845 (41.0%) | 1,542 (74.8%) |
| 6 to 18 Years | 2,085 (45.4%) | 2,617 (57.0%) |
| 19 to 25 Years | 504 (28.7%) | 1,139 (64.8%) |
| 25 to 34 Years | 850 (20.8%) | 2,892 (70.7%) |
| 35 to 44 Years | 735 (20.0%) | 2,710 (73.6%) |
| 45 to 54 Years | 622 (20.9%) | 2,199 (74.0%) |
| 55 to 64 Years | 834 (23.5%) | 2,848 (80.4%) |
| 65 to 74 Years | 2,312 (96.9%) | 1,089 (45.7%) |
| 75 Years and over | 1,505 (100.0%) | 844 (56.1%) |
| Total | 10,292 (38.7%) | 17,880 (67.3%) |
Disability Status by Sex by Age in West Baton Rouge Parish
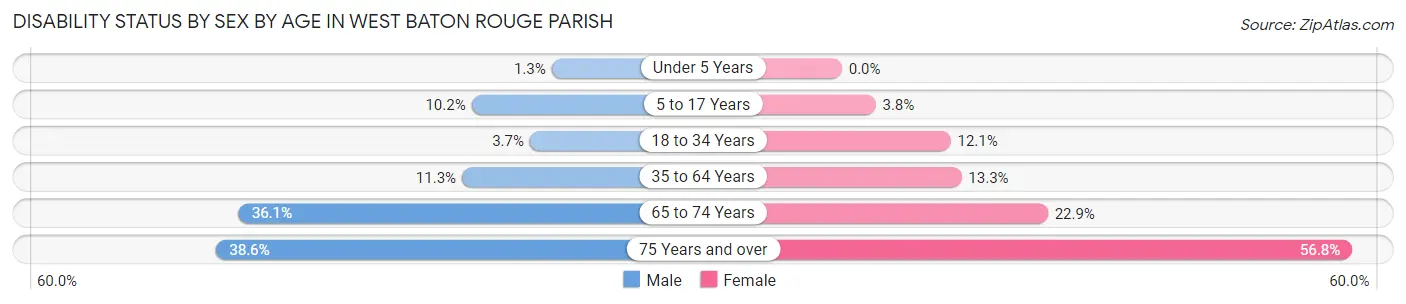
| Age Bracket | Male | Female |
| Under 5 Years | 10 (1.3%) | 0 (0.0%) |
| 5 to 17 Years | 249 (10.2%) | 83 (3.8%) |
| 18 to 34 Years | 116 (3.7%) | 362 (12.1%) |
| 35 to 64 Years | 544 (11.3%) | 717 (13.3%) |
| 65 to 74 Years | 408 (36.1%) | 288 (22.9%) |
| 75 Years and over | 228 (38.6%) | 520 (56.8%) |
Disability Class by Sex by Age in West Baton Rouge Parish
Disability Class: Hearing Difficulty
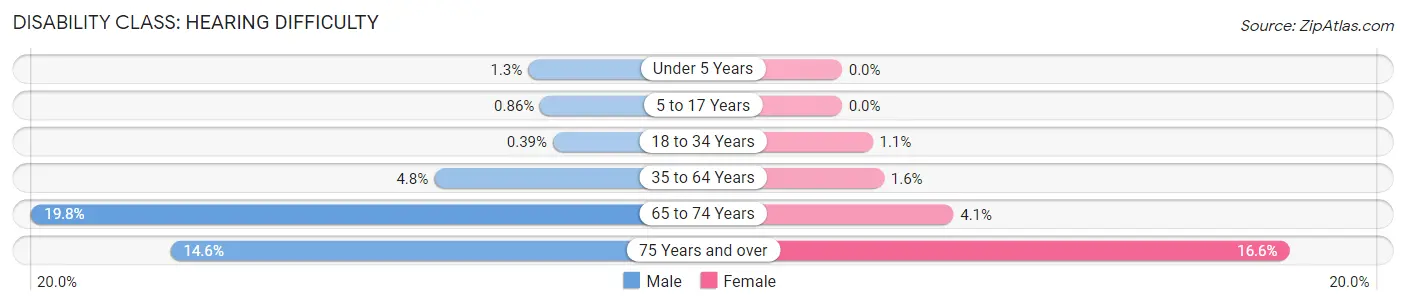
| Age Bracket | Male | Female |
| Under 5 Years | 10 (1.3%) | 0 (0.0%) |
| 5 to 17 Years | 21 (0.9%) | 0 (0.0%) |
| 18 to 34 Years | 12 (0.4%) | 34 (1.1%) |
| 35 to 64 Years | 231 (4.8%) | 84 (1.6%) |
| 65 to 74 Years | 223 (19.8%) | 52 (4.1%) |
| 75 Years and over | 86 (14.6%) | 152 (16.6%) |
Disability Class: Vision Difficulty
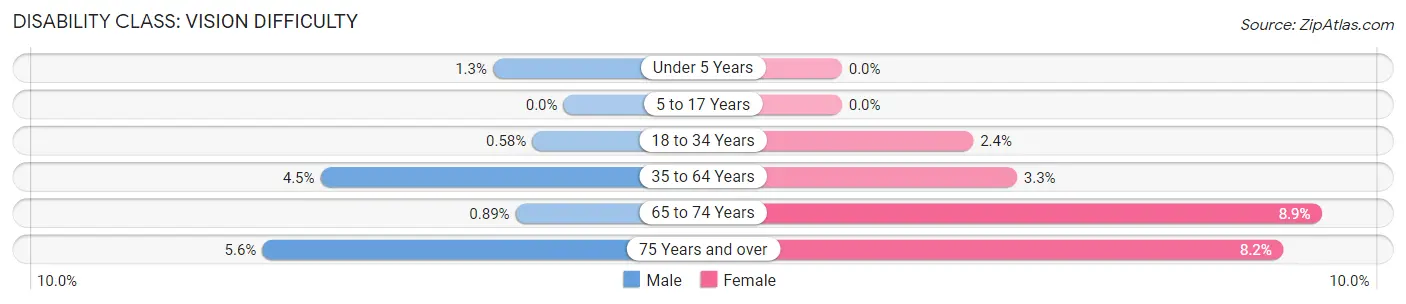
| Age Bracket | Male | Female |
| Under 5 Years | 10 (1.3%) | 0 (0.0%) |
| 5 to 17 Years | 0 (0.0%) | 0 (0.0%) |
| 18 to 34 Years | 18 (0.6%) | 73 (2.4%) |
| 35 to 64 Years | 217 (4.5%) | 175 (3.3%) |
| 65 to 74 Years | 10 (0.9%) | 112 (8.9%) |
| 75 Years and over | 33 (5.6%) | 75 (8.2%) |
Disability Class: Cognitive Difficulty
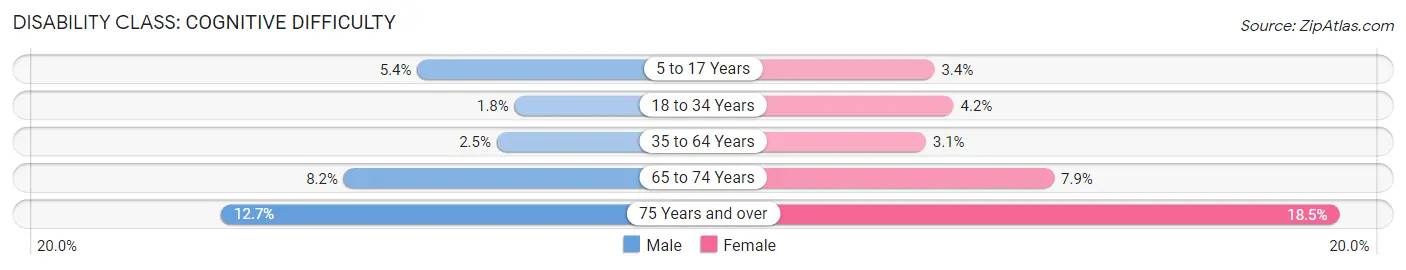
| Age Bracket | Male | Female |
| 5 to 17 Years | 132 (5.4%) | 76 (3.4%) |
| 18 to 34 Years | 56 (1.8%) | 124 (4.2%) |
| 35 to 64 Years | 119 (2.5%) | 168 (3.1%) |
| 65 to 74 Years | 92 (8.2%) | 99 (7.9%) |
| 75 Years and over | 75 (12.7%) | 169 (18.5%) |
Disability Class: Ambulatory Difficulty
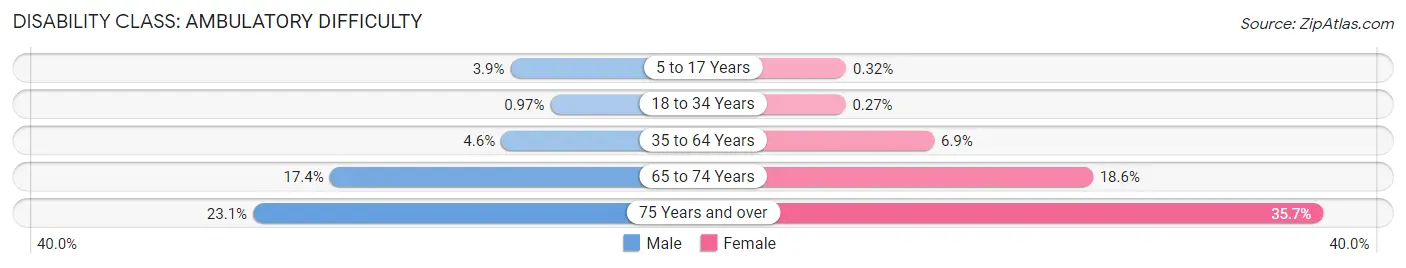
| Age Bracket | Male | Female |
| 5 to 17 Years | 96 (3.9%) | 7 (0.3%) |
| 18 to 34 Years | 30 (1.0%) | 8 (0.3%) |
| 35 to 64 Years | 223 (4.6%) | 369 (6.9%) |
| 65 to 74 Years | 196 (17.4%) | 234 (18.6%) |
| 75 Years and over | 136 (23.1%) | 327 (35.7%) |
Disability Class: Self-Care Difficulty
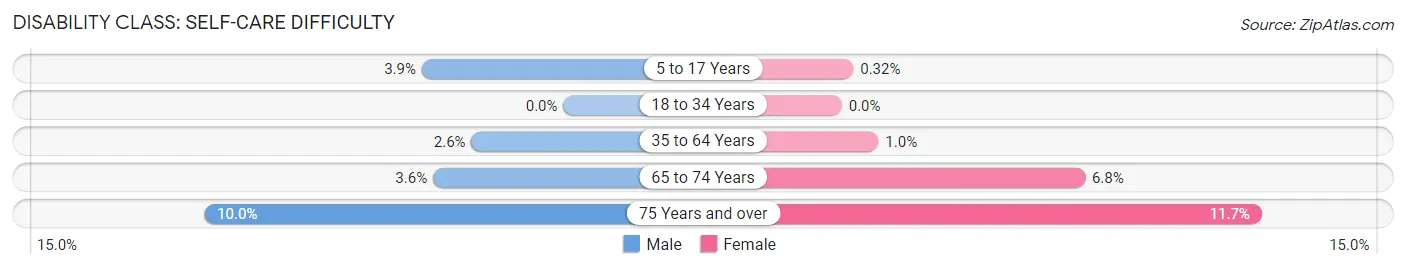
| Age Bracket | Male | Female |
| 5 to 17 Years | 96 (3.9%) | 7 (0.3%) |
| 18 to 34 Years | 0 (0.0%) | 0 (0.0%) |
| 35 to 64 Years | 123 (2.6%) | 55 (1.0%) |
| 65 to 74 Years | 41 (3.6%) | 85 (6.8%) |
| 75 Years and over | 59 (10.0%) | 107 (11.7%) |
Technology Access in West Baton Rouge Parish
Computing Device Access in West Baton Rouge Parish
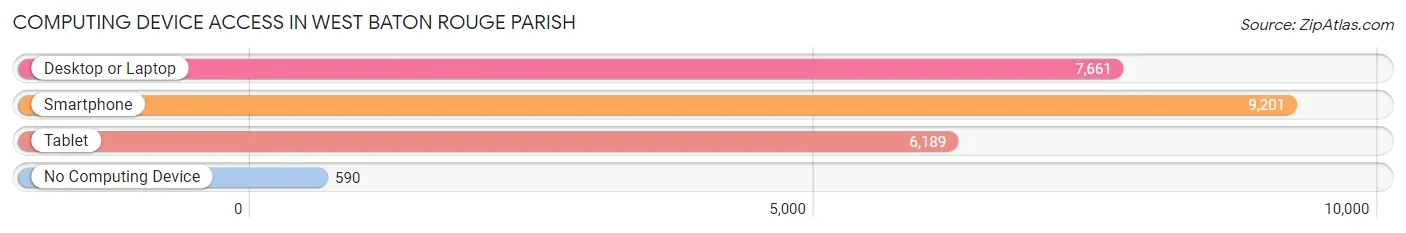
| Device Type | # Households | % Households |
| Desktop or Laptop | 7,661 | 76.0% |
| Smartphone | 9,201 | 91.3% |
| Tablet | 6,189 | 61.4% |
| No Computing Device | 590 | 5.9% |
| Total | 10,080 | 100.0% |
Internet Access in West Baton Rouge Parish
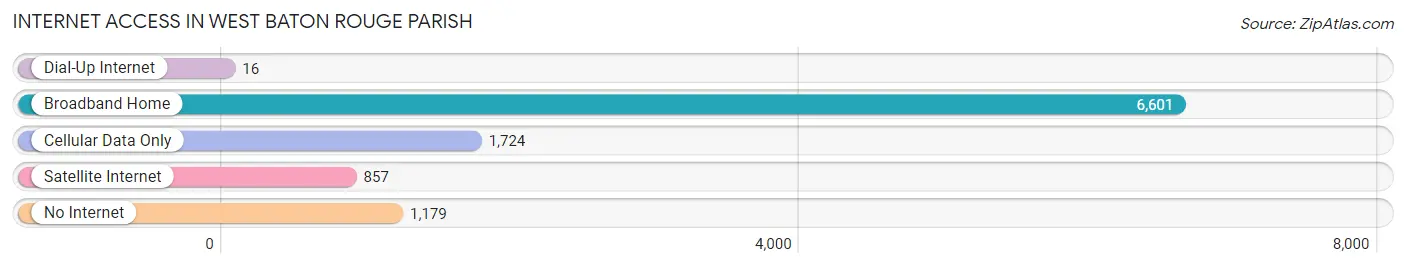
| Internet Type | # Households | % Households |
| Dial-Up Internet | 16 | 0.2% |
| Broadband Home | 6,601 | 65.5% |
| Cellular Data Only | 1,724 | 17.1% |
| Satellite Internet | 857 | 8.5% |
| No Internet | 1,179 | 11.7% |
| Total | 10,080 | 100.0% |
West Baton Rouge Parish Summary
Baton Rouge Parish, Louisiana is located in the southeastern part of the state and is part of the Greater Baton Rouge Metropolitan Statistical Area. The parish is bordered by East Baton Rouge Parish to the north, West Feliciana Parish to the west, Iberville Parish to the south, and the Mississippi River to the east. The parish seat is Port Allen, and the largest city is Baton Rouge.
Geography
Baton Rouge Parish is located in the southeastern part of Louisiana and is bordered by East Baton Rouge Parish to the north, West Feliciana Parish to the west, Iberville Parish to the south, and the Mississippi River to the east. The parish covers an area of 545 square miles and is located in the Coastal Plain region of the state. The terrain is mostly flat with some rolling hills and is mostly covered in pine and hardwood forests. The parish is home to several rivers and streams, including the Amite River, Bayou Manchac, and the Tickfaw River.
Demographics
As of the 2010 census, the population of Baton Rouge Parish was 440,179, making it the second most populous parish in the state. The population density was 809 people per square mile. The racial makeup of the parish was 57.3% White, 38.2% African American, 0.5% Native American, 1.7% Asian, 0.1% Pacific Islander, 0.7% from other races, and 1.6% from two or more races. Hispanic or Latino of any race were 2.9% of the population.
The median income for a household in the parish was $45,945 and the median income for a family was $54,828. The per capita income for the parish was $23,837. About 17.2% of families and 21.3% of the population were below the poverty line, including 30.2% of those under age 18 and 13.2% of those age 65 or over.
Economy
Baton Rouge Parish is home to a diverse economy that is driven by the oil and gas industry, manufacturing, and tourism. The parish is home to several major oil and gas companies, including ExxonMobil, Chevron, and Shell. The manufacturing sector is also a major contributor to the economy, with companies such as Dow Chemical, BASF, and Georgia-Pacific having major operations in the parish.
Tourism is also a major industry in the parish, with attractions such as the USS Kidd Veterans Memorial and Museum, the Louisiana State Capitol, and the Old State Capitol. The parish is also home to several universities and colleges, including Louisiana State University, Southern University, and Baton Rouge Community College.
History
Baton Rouge Parish was established in 1807 and was named after the French phrase for “red stick”, referring to a red pole that was used to mark the boundary between the French and Spanish territories. The parish was originally part of the West Florida Territory, which was annexed by the United States in 1810.
During the Civil War, the parish was the site of several battles, including the Battle of Baton Rouge in 1862. After the war, the parish experienced a period of economic growth, driven by the oil and gas industry. In the late 19th century, the parish was home to several major oil and gas companies, including Standard Oil and Gulf Oil.
In the 20th century, the parish experienced a period of population growth, driven by the growth of the oil and gas industry and the expansion of the city of Baton Rouge. The parish is now home to several major industries, including oil and gas, manufacturing, and tourism.
Common Questions
What is the Total Population of West Baton Rouge Parish?
Total Population of West Baton Rouge Parish is 27,377.
What is the Total Male Population of West Baton Rouge Parish?
Total Male Population of West Baton Rouge Parish is 13,586.
What is the Total Female Population of West Baton Rouge Parish?
Total Female Population of West Baton Rouge Parish is 13,791.
What is the Ratio of Males per 100 Females in West Baton Rouge Parish?
There are 98.51 Males per 100 Females in West Baton Rouge Parish.
What is the Ratio of Females per 100 Males in West Baton Rouge Parish?
There are 101.51 Females per 100 Males in West Baton Rouge Parish.
What is the Median Population Age in West Baton Rouge Parish?
Median Population Age in West Baton Rouge Parish is 36.4 Years.
What is the Average Family Size in West Baton Rouge Parish
Average Family Size in West Baton Rouge Parish is 3.1 People.
What is the Average Household Size in West Baton Rouge Parish
Average Household Size in West Baton Rouge Parish is 2.6 People.
What is Per Capita Income in West Baton Rouge Parish?
Per Capita income in West Baton Rouge Parish is $33,445.
What is the Median Family Income in West Baton Rouge Parish?
Median Family Income in West Baton Rouge Parish is $95,918.
What is the Median Household income in West Baton Rouge Parish?
Median Household Income in West Baton Rouge Parish is $80,510.
What is Income or Wage Gap in West Baton Rouge Parish?
Income or Wage Gap in West Baton Rouge Parish is 15.9%.
Women in West Baton Rouge Parish earn 84.1 cents for every dollar earned by a man.
What is Inequality or Gini Index in West Baton Rouge Parish?
Inequality or Gini Index in West Baton Rouge Parish is 0.39.
How Large is the Labor Force in West Baton Rouge Parish?
There are 13,656 People in the Labor Forcein in West Baton Rouge Parish.
What is the Percentage of People in the Labor Force in West Baton Rouge Parish?
63.0% of People are in the Labor Force in West Baton Rouge Parish.
What is the Unemployment Rate in West Baton Rouge Parish?
Unemployment Rate in West Baton Rouge Parish is 7.6%.