Webster Parish, LA
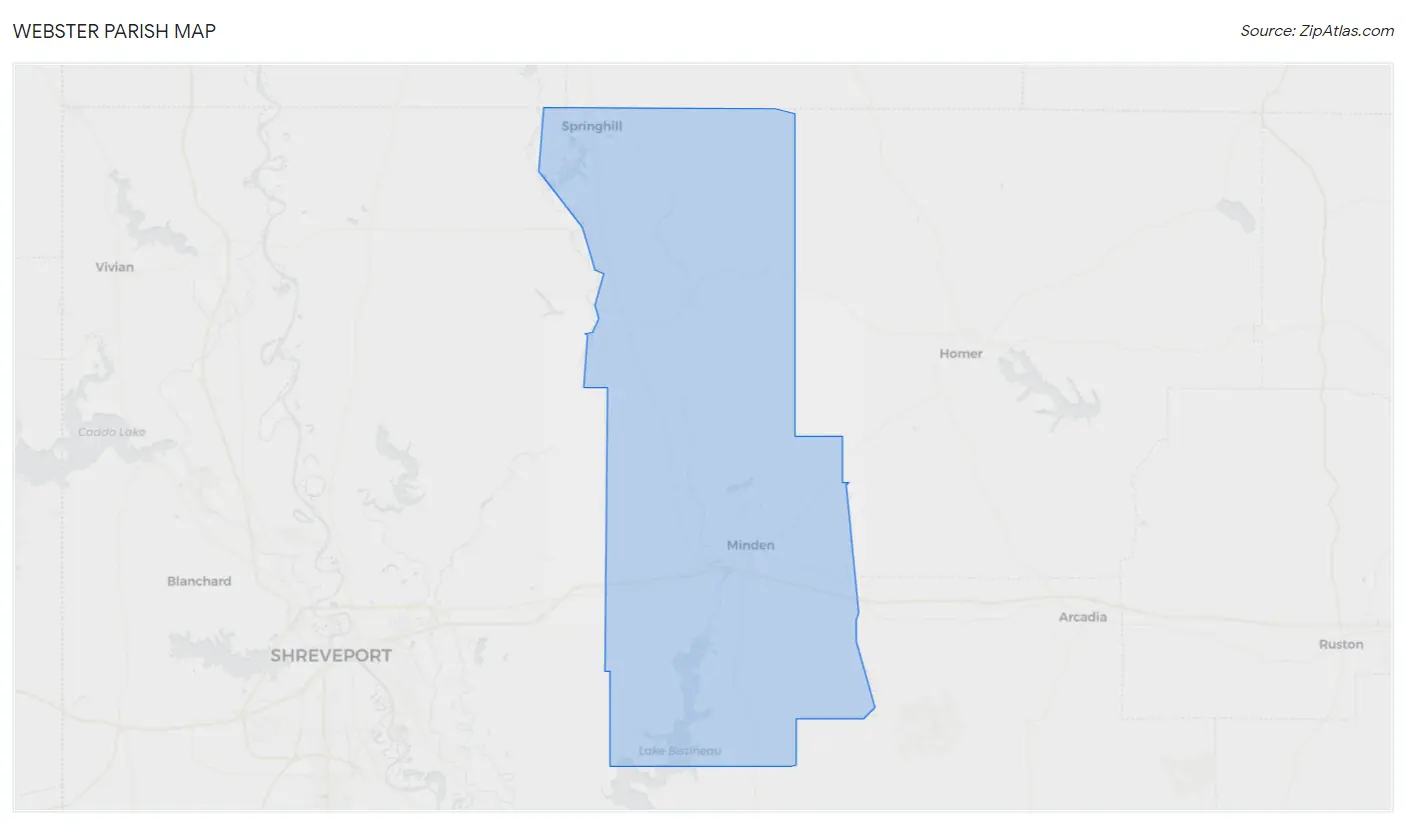
Webster Parish Map
Webster Parish Overview
36,761
TOTAL POPULATION
18,033
MALE POPULATION
18,728
FEMALE POPULATION
96.29
MALES / 100 FEMALES
103.85
FEMALES / 100 MALES
41.5
MEDIAN AGE
3.1
AVG FAMILY SIZE
2.4
AVG HOUSEHOLD SIZE
$22,706
PER CAPITA INCOME
$45,302
AVG FAMILY INCOME
$34,263
AVG HOUSEHOLD INCOME
22.8%
WAGE / INCOME GAP [ % ]
77.2¢/ $1
WAGE / INCOME GAP [ $ ]
$8,975
FAMILY INCOME DEFICIT
0.50
INEQUALITY / GINI INDEX
13,772
LABOR FORCE [ PEOPLE ]
46.7%
PERCENT IN LABOR FORCE
5.3%
UNEMPLOYMENT RATE
Webster Parish Area Codes
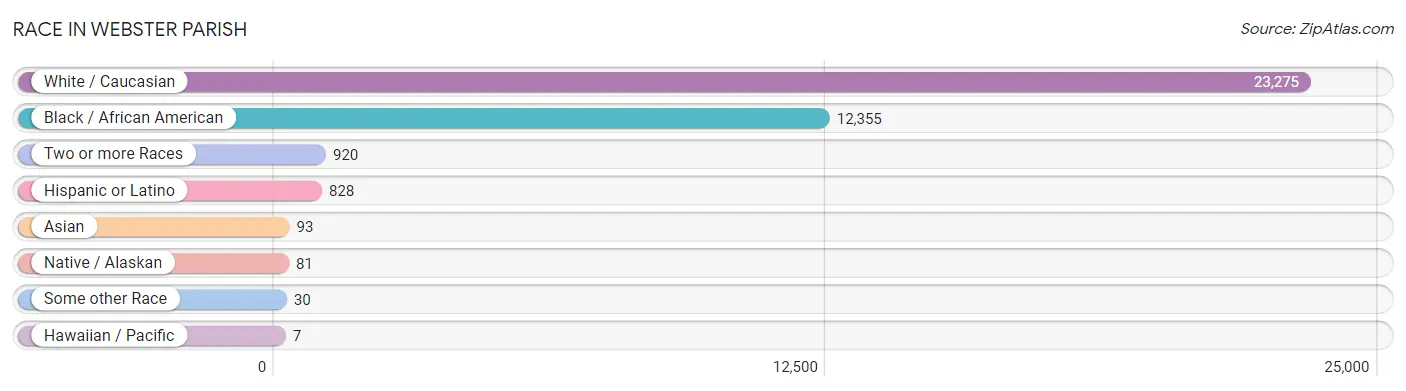
Race in Webster Parish
The most populous races in Webster Parish are White / Caucasian (23,275 | 63.3%), Black / African American (12,355 | 33.6%), and Two or more Races (920 | 2.5%).
| Race | # Population | % Population |
| Asian | 93 | 0.3% |
| Black / African American | 12,355 | 33.6% |
| Hawaiian / Pacific | 7 | 0.0% |
| Hispanic or Latino | 828 | 2.2% |
| Native / Alaskan | 81 | 0.2% |
| White / Caucasian | 23,275 | 63.3% |
| Two or more Races | 920 | 2.5% |
| Some other Race | 30 | 0.1% |
| Total | 36,761 | 100.0% |
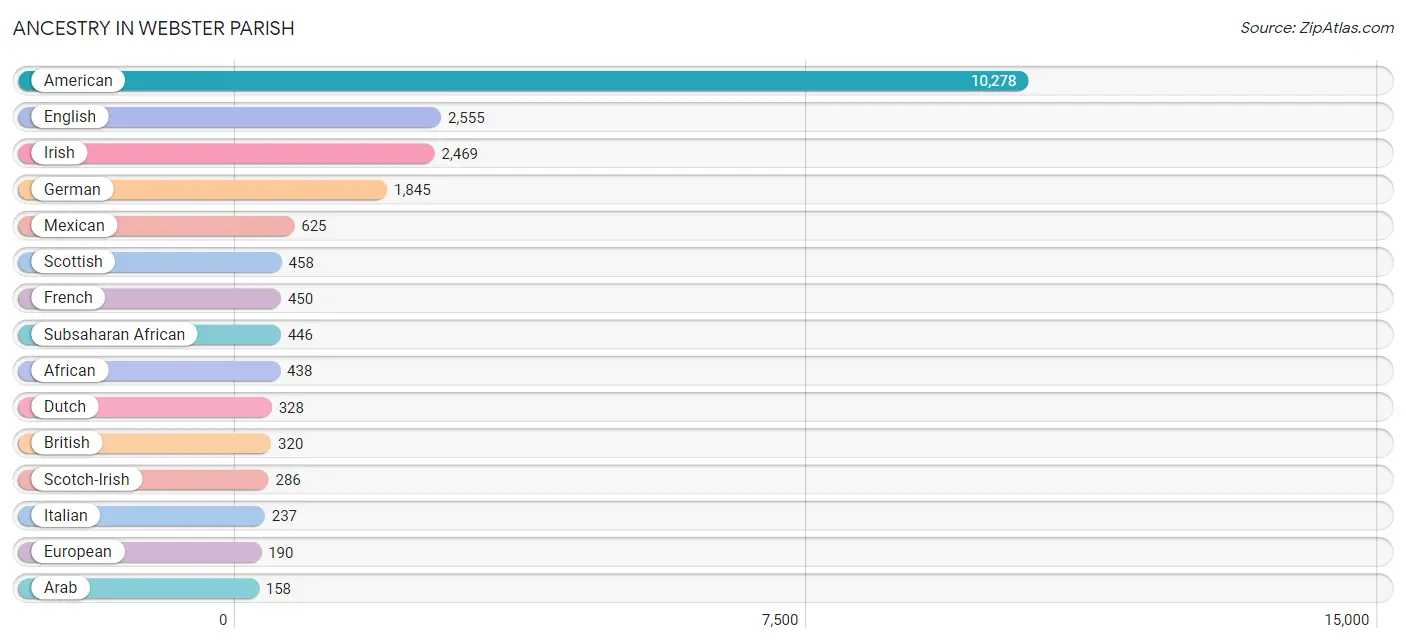
Ancestry in Webster Parish
The most populous ancestries reported in Webster Parish are American (10,278 | 28.0%), English (2,555 | 7.0%), Irish (2,469 | 6.7%), German (1,845 | 5.0%), and Mexican (625 | 1.7%), together accounting for 48.4% of all Webster Parish residents.
| Ancestry | # Population | % Population |
| African | 438 | 1.2% |
| Alaskan Athabascan | 10 | 0.0% |
| American | 10,278 | 28.0% |
| Arab | 158 | 0.4% |
| Bhutanese | 61 | 0.2% |
| Blackfeet | 62 | 0.2% |
| Brazilian | 23 | 0.1% |
| British | 320 | 0.9% |
| Cajun | 31 | 0.1% |
| Canadian | 21 | 0.1% |
| Celtic | 1 | 0.0% |
| Central American | 52 | 0.1% |
| Cherokee | 126 | 0.3% |
| Choctaw | 4 | 0.0% |
| Colombian | 10 | 0.0% |
| Cuban | 9 | 0.0% |
| Cypriot | 6 | 0.0% |
| Dutch | 328 | 0.9% |
| Eastern European | 18 | 0.1% |
| English | 2,555 | 7.0% |
| European | 190 | 0.5% |
| Finnish | 9 | 0.0% |
| French | 450 | 1.2% |
| French American Indian | 6 | 0.0% |
| French Canadian | 109 | 0.3% |
| German | 1,845 | 5.0% |
| Greek | 2 | 0.0% |
| Haitian | 16 | 0.0% |
| Honduran | 13 | 0.0% |
| Houma | 58 | 0.2% |
| Irish | 2,469 | 6.7% |
| Iroquois | 4 | 0.0% |
| Italian | 237 | 0.6% |
| Jamaican | 55 | 0.2% |
| Korean | 76 | 0.2% |
| Lebanese | 86 | 0.2% |
| Malaysian | 15 | 0.0% |
| Mexican | 625 | 1.7% |
| Native Hawaiian | 8 | 0.0% |
| Navajo | 2 | 0.0% |
| Nicaraguan | 39 | 0.1% |
| Nigerian | 8 | 0.0% |
| Northern European | 43 | 0.1% |
| Norwegian | 94 | 0.3% |
| Pakistani | 32 | 0.1% |
| Palestinian | 65 | 0.2% |
| Polish | 44 | 0.1% |
| Puerto Rican | 69 | 0.2% |
| Russian | 20 | 0.1% |
| Scandinavian | 29 | 0.1% |
| Scotch-Irish | 286 | 0.8% |
| Scottish | 458 | 1.3% |
| Sioux | 12 | 0.0% |
| South American | 10 | 0.0% |
| Spaniard | 4 | 0.0% |
| Spanish | 45 | 0.1% |
| Sri Lankan | 9 | 0.0% |
| Subsaharan African | 446 | 1.2% |
| Swedish | 36 | 0.1% |
| Syrian | 7 | 0.0% |
| Thai | 15 | 0.0% |
| Ukrainian | 19 | 0.1% |
| Welsh | 46 | 0.1% |
| Yugoslavian | 13 | 0.0% | View All 64 Rows |
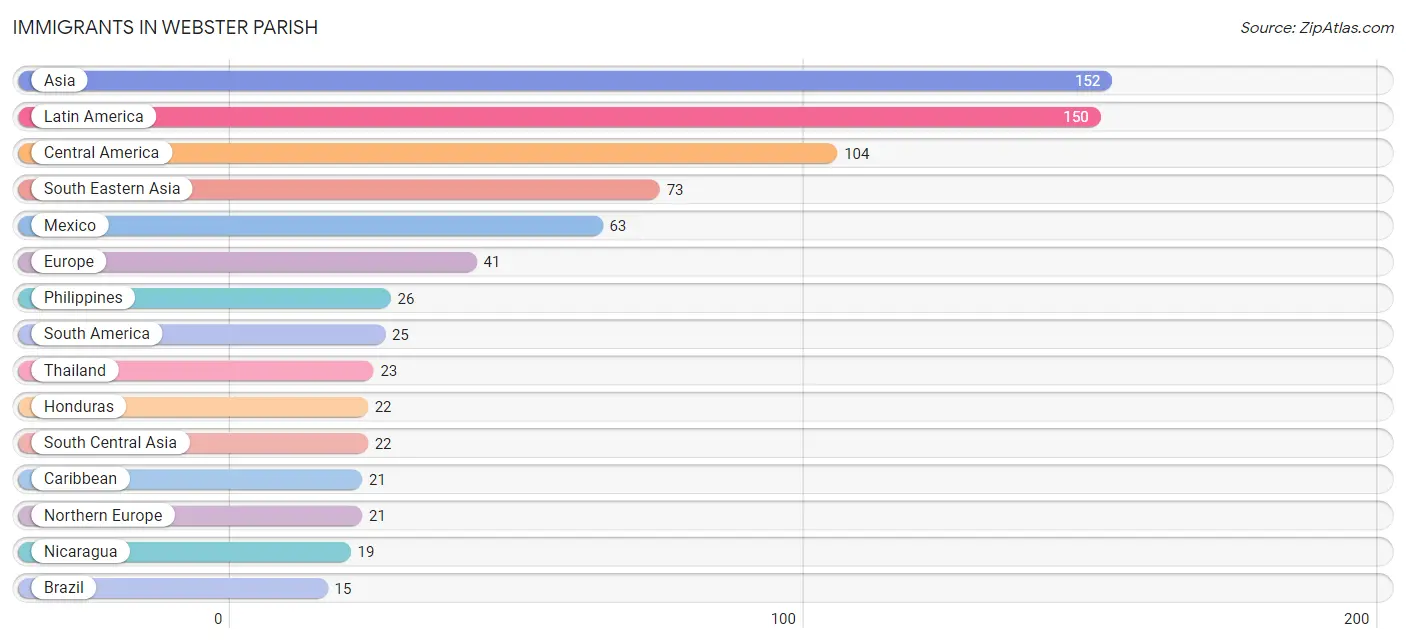
Immigrants in Webster Parish
The most numerous immigrant groups reported in Webster Parish came from Asia (152 | 0.4%), Latin America (150 | 0.4%), Central America (104 | 0.3%), South Eastern Asia (73 | 0.2%), and Mexico (63 | 0.2%), together accounting for 1.5% of all Webster Parish residents.
| Immigration Origin | # Population | % Population |
| Asia | 152 | 0.4% |
| Australia | 7 | 0.0% |
| Brazil | 15 | 0.0% |
| Canada | 9 | 0.0% |
| Caribbean | 21 | 0.1% |
| Central America | 104 | 0.3% |
| Colombia | 10 | 0.0% |
| Cuba | 9 | 0.0% |
| Eastern Asia | 6 | 0.0% |
| Eastern Europe | 9 | 0.0% |
| England | 7 | 0.0% |
| Europe | 41 | 0.1% |
| Fiji | 7 | 0.0% |
| Germany | 11 | 0.0% |
| Honduras | 22 | 0.1% |
| India | 8 | 0.0% |
| Jamaica | 12 | 0.0% |
| Japan | 6 | 0.0% |
| Laos | 15 | 0.0% |
| Latin America | 150 | 0.4% |
| Mexico | 63 | 0.2% |
| Nicaragua | 19 | 0.1% |
| Northern Europe | 21 | 0.1% |
| Oceania | 14 | 0.0% |
| Pakistan | 14 | 0.0% |
| Philippines | 26 | 0.1% |
| Romania | 9 | 0.0% |
| South America | 25 | 0.1% |
| South Central Asia | 22 | 0.1% |
| South Eastern Asia | 73 | 0.2% |
| Thailand | 23 | 0.1% |
| Vietnam | 9 | 0.0% |
| Western Europe | 11 | 0.0% | View All 33 Rows |
Sex and Age in Webster Parish
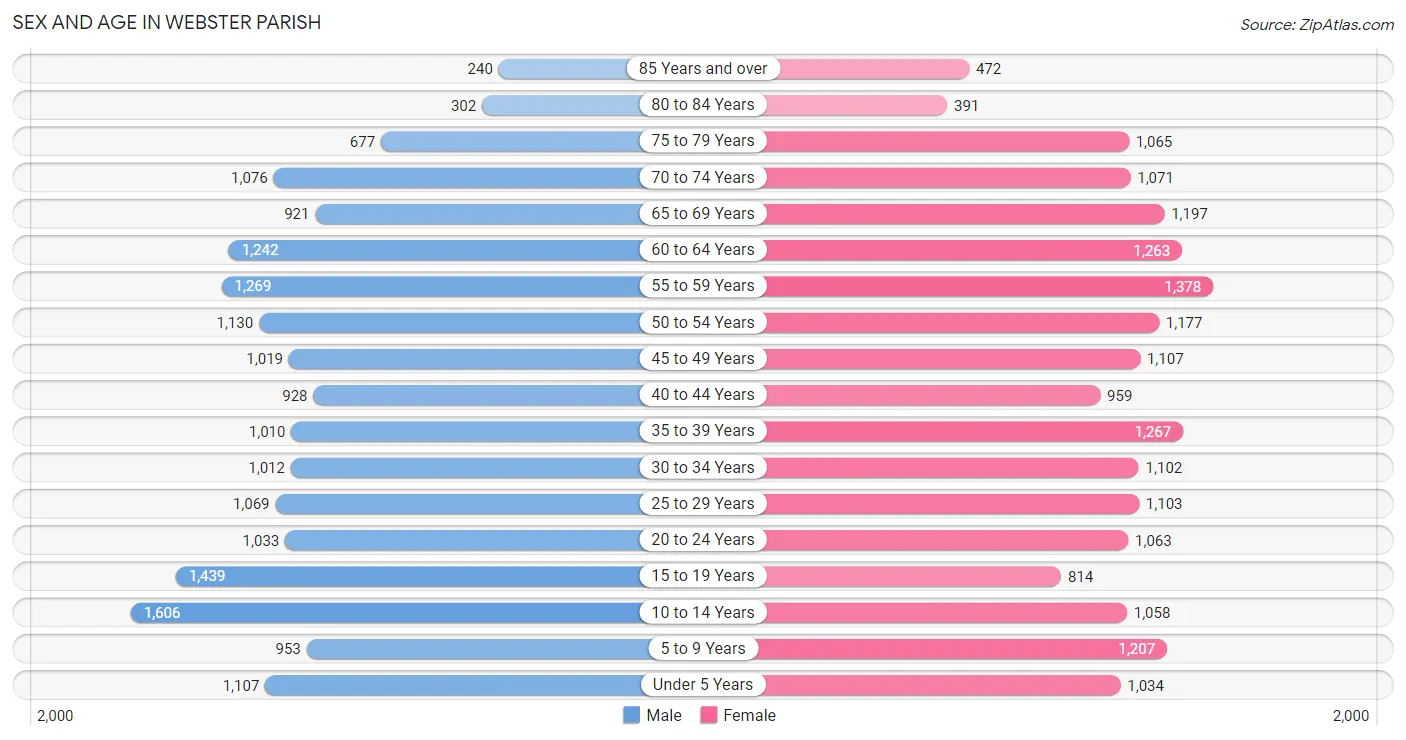
Sex and Age in Webster Parish
The most populous age groups in Webster Parish are 10 to 14 Years (1,606 | 8.9%) for men and 55 to 59 Years (1,378 | 7.4%) for women.
| Age Bracket | Male | Female |
| Under 5 Years | 1,107 (6.1%) | 1,034 (5.5%) |
| 5 to 9 Years | 953 (5.3%) | 1,207 (6.4%) |
| 10 to 14 Years | 1,606 (8.9%) | 1,058 (5.7%) |
| 15 to 19 Years | 1,439 (8.0%) | 814 (4.3%) |
| 20 to 24 Years | 1,033 (5.7%) | 1,063 (5.7%) |
| 25 to 29 Years | 1,069 (5.9%) | 1,103 (5.9%) |
| 30 to 34 Years | 1,012 (5.6%) | 1,102 (5.9%) |
| 35 to 39 Years | 1,010 (5.6%) | 1,267 (6.8%) |
| 40 to 44 Years | 928 (5.1%) | 959 (5.1%) |
| 45 to 49 Years | 1,019 (5.7%) | 1,107 (5.9%) |
| 50 to 54 Years | 1,130 (6.3%) | 1,177 (6.3%) |
| 55 to 59 Years | 1,269 (7.0%) | 1,378 (7.4%) |
| 60 to 64 Years | 1,242 (6.9%) | 1,263 (6.7%) |
| 65 to 69 Years | 921 (5.1%) | 1,197 (6.4%) |
| 70 to 74 Years | 1,076 (6.0%) | 1,071 (5.7%) |
| 75 to 79 Years | 677 (3.7%) | 1,065 (5.7%) |
| 80 to 84 Years | 302 (1.7%) | 391 (2.1%) |
| 85 Years and over | 240 (1.3%) | 472 (2.5%) |
| Total | 18,033 (100.0%) | 18,728 (100.0%) |
Families and Households in Webster Parish
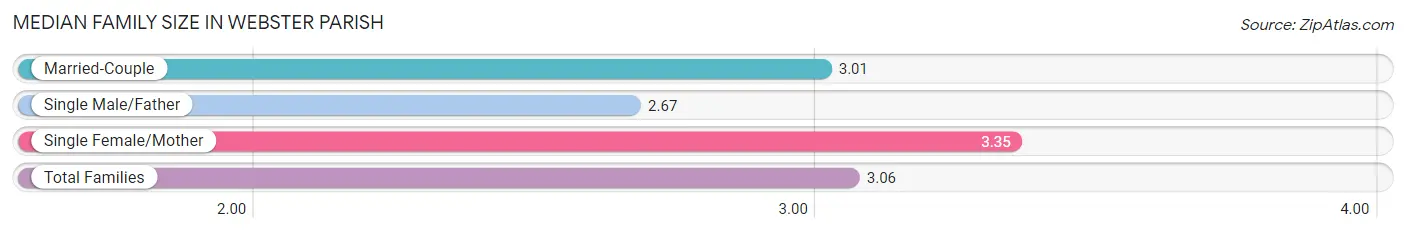
Median Family Size in Webster Parish
The median family size in Webster Parish is 3.06 persons per family, with single female/mother families (2,145 | 22.6%) accounting for the largest median family size of 3.35 persons per family. On the other hand, single male/father families (930 | 9.8%) represent the smallest median family size with 2.67 persons per family.
| Family Type | # Families | Family Size |
| Married-Couple | 6,430 (67.6%) | 3.01 |
| Single Male/Father | 930 (9.8%) | 2.67 |
| Single Female/Mother | 2,145 (22.6%) | 3.35 |
| Total Families | 9,505 (100.0%) | 3.06 |
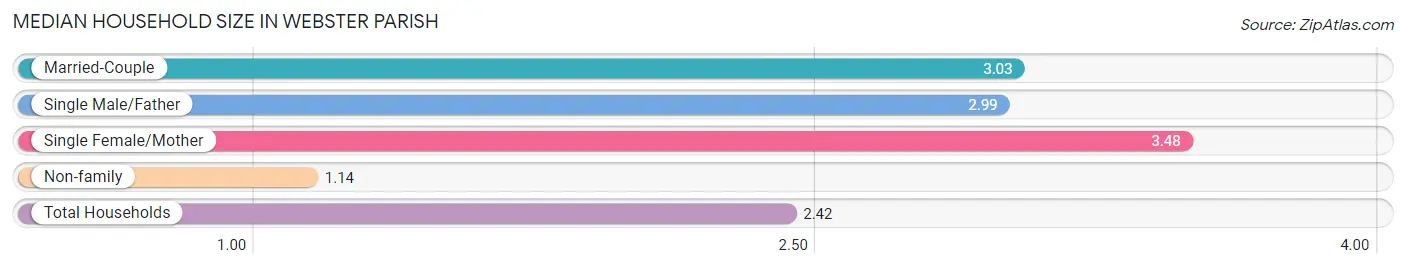
Median Household Size in Webster Parish
The median household size in Webster Parish is 2.42 persons per household, with single female/mother households (2,145 | 14.5%) accounting for the largest median household size of 3.48 persons per household. non-family households (5,296 | 35.8%) represent the smallest median household size with 1.14 persons per household.
| Household Type | # Households | Household Size |
| Married-Couple | 6,430 (43.4%) | 3.03 |
| Single Male/Father | 930 (6.3%) | 2.99 |
| Single Female/Mother | 2,145 (14.5%) | 3.48 |
| Non-family | 5,296 (35.8%) | 1.14 |
| Total Households | 14,801 (100.0%) | 2.42 |
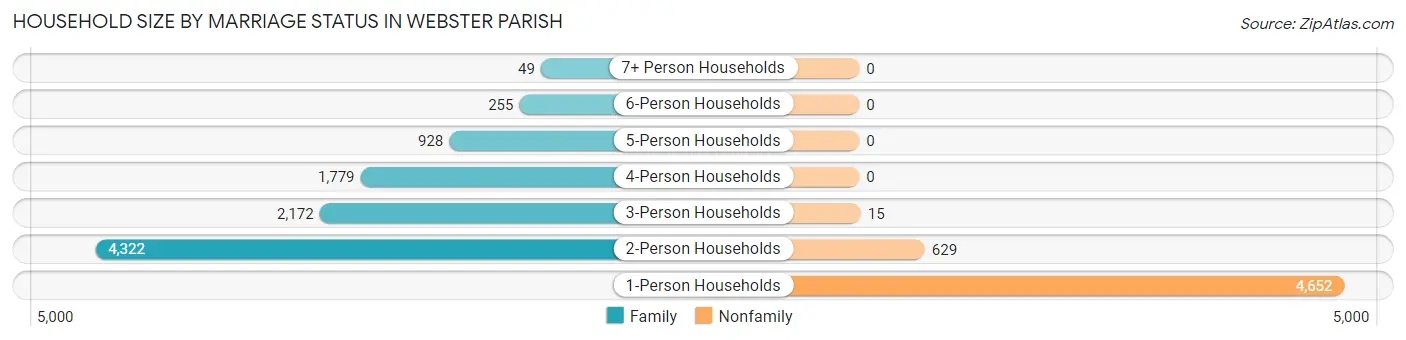
Household Size by Marriage Status in Webster Parish
Out of a total of 14,801 households in Webster Parish, 9,505 (64.2%) are family households, while 5,296 (35.8%) are nonfamily households. The most numerous type of family households are 2-person households, comprising 4,322, and the most common type of nonfamily households are 1-person households, comprising 4,652.
| Household Size | Family Households | Nonfamily Households |
| 1-Person Households | - | 4,652 (31.4%) |
| 2-Person Households | 4,322 (29.2%) | 629 (4.3%) |
| 3-Person Households | 2,172 (14.7%) | 15 (0.1%) |
| 4-Person Households | 1,779 (12.0%) | 0 (0.0%) |
| 5-Person Households | 928 (6.3%) | 0 (0.0%) |
| 6-Person Households | 255 (1.7%) | 0 (0.0%) |
| 7+ Person Households | 49 (0.3%) | 0 (0.0%) |
| Total | 9,505 (64.2%) | 5,296 (35.8%) |
Female Fertility in Webster Parish
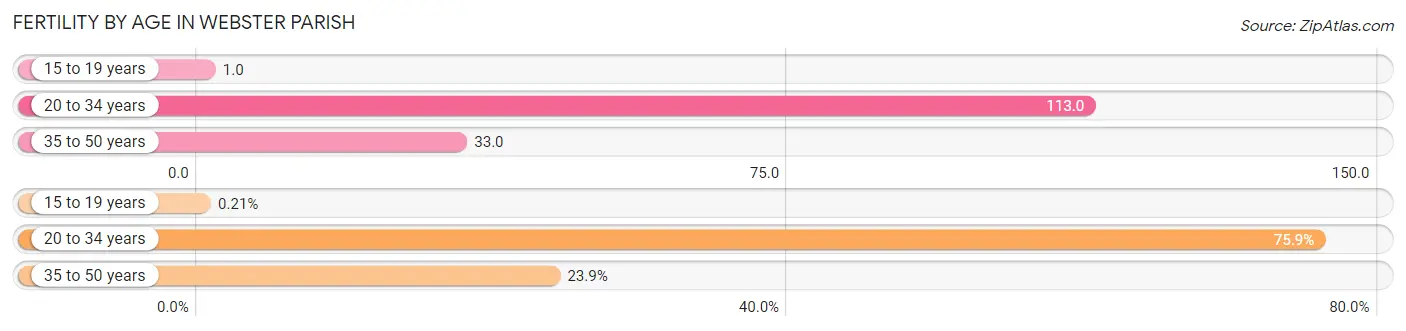
Fertility by Age in Webster Parish
Average fertility rate in Webster Parish is 64.0 births per 1,000 women. Women in the age bracket of 20 to 34 years have the highest fertility rate with 113.0 births per 1,000 women. Women in the age bracket of 20 to 34 years acount for 75.9% of all women with births.
| Age Bracket | Women with Births | Births / 1,000 Women |
| 15 to 19 years | 1 (0.2%) | 1.0 |
| 20 to 34 years | 368 (75.9%) | 113.0 |
| 35 to 50 years | 116 (23.9%) | 33.0 |
| Total | 485 (100.0%) | 64.0 |
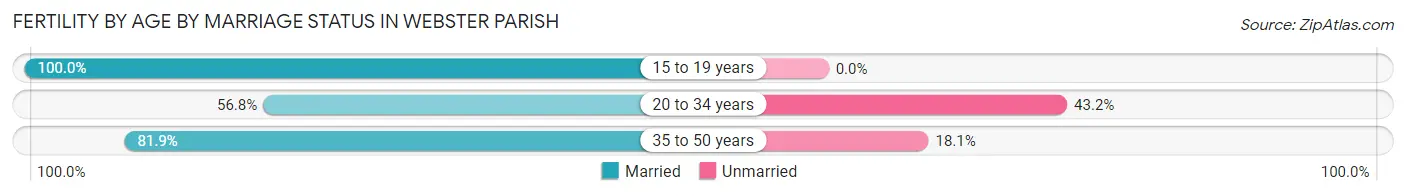
Fertility by Age by Marriage Status in Webster Parish
62.9% of women with births (485) in Webster Parish are married. The highest percentage of unmarried women with births falls into 20 to 34 years age bracket with 43.2% of them unmarried at the time of birth, while the lowest percentage of unmarried women with births belong to 15 to 19 years age bracket with 0.0% of them unmarried.
| Age Bracket | Married | Unmarried |
| 15 to 19 years | 1 (100.0%) | 0 (0.0%) |
| 20 to 34 years | 209 (56.8%) | 159 (43.2%) |
| 35 to 50 years | 95 (81.9%) | 21 (18.1%) |
| Total | 305 (62.9%) | 180 (37.1%) |
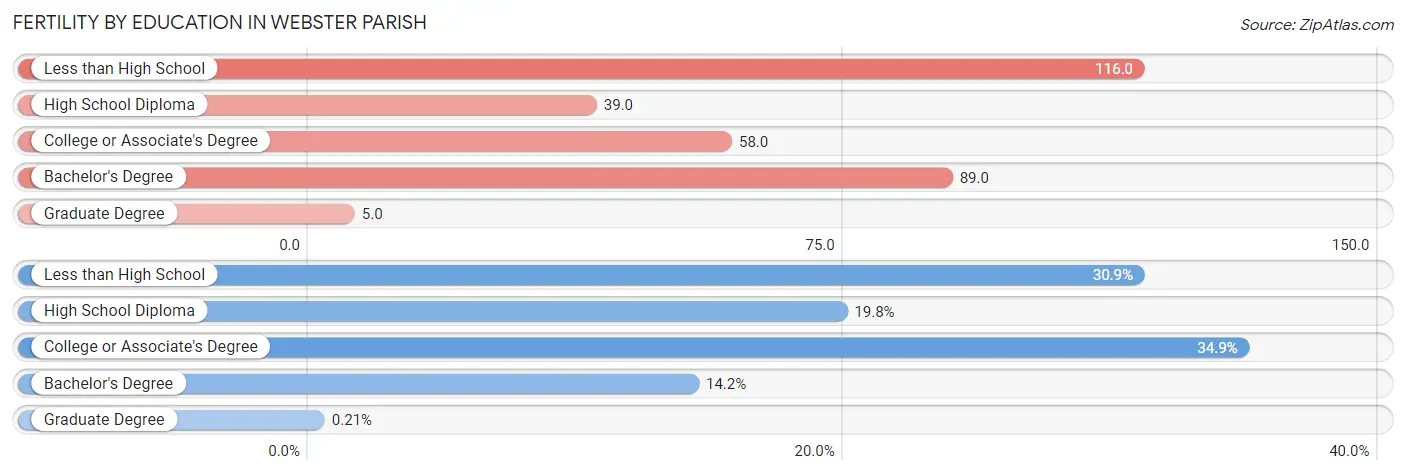
Fertility by Education in Webster Parish
Average fertility rate in Webster Parish is 64.0 births per 1,000 women. Women with the education attainment of less than high school have the highest fertility rate of 116.0 births per 1,000 women, while women with the education attainment of graduate degree have the lowest fertility at 5.0 births per 1,000 women. Women with the education attainment of college or associate's degree represent 34.8% of all women with births.
| Educational Attainment | Women with Births | Births / 1,000 Women |
| Less than High School | 150 (30.9%) | 116.0 |
| High School Diploma | 96 (19.8%) | 39.0 |
| College or Associate's Degree | 169 (34.8%) | 58.0 |
| Bachelor's Degree | 69 (14.2%) | 89.0 |
| Graduate Degree | 1 (0.2%) | 5.0 |
| Total | 485 (100.0%) | 64.0 |
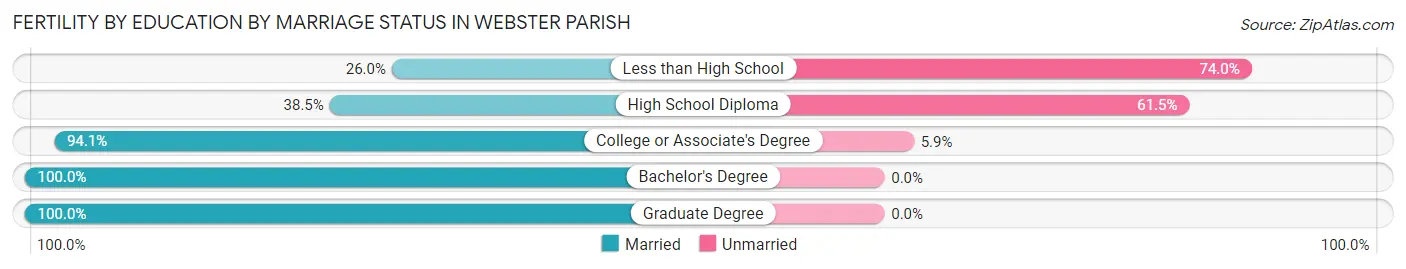
Fertility by Education by Marriage Status in Webster Parish
37.1% of women with births in Webster Parish are unmarried. Women with the educational attainment of bachelor's degree are most likely to be married with 100.0% of them married at childbirth, while women with the educational attainment of less than high school are least likely to be married with 74.0% of them unmarried at childbirth.
| Educational Attainment | Married | Unmarried |
| Less than High School | 39 (26.0%) | 111 (74.0%) |
| High School Diploma | 37 (38.5%) | 59 (61.5%) |
| College or Associate's Degree | 159 (94.1%) | 10 (5.9%) |
| Bachelor's Degree | 69 (100.0%) | 0 (0.0%) |
| Graduate Degree | 1 (100.0%) | 0 (0.0%) |
| Total | 305 (62.9%) | 180 (37.1%) |
Income in Webster Parish
Income Overview in Webster Parish
Per Capita Income in Webster Parish is $22,706, while median incomes of families and households are $45,302 and $34,263 respectively.
| Characteristic | Number | Measure |
| Per Capita Income | 36,761 | $22,706 |
| Median Family Income | 9,505 | $45,302 |
| Mean Family Income | 9,505 | $68,875 |
| Median Household Income | 14,801 | $34,263 |
| Mean Household Income | 14,801 | $54,821 |
| Income Deficit | 9,505 | $8,975 |
| Wage / Income Gap (%) | 36,761 | 22.77% |
| Wage / Income Gap ($) | 36,761 | 77.23¢ per $1 |
| Gini / Inequality Index | 36,761 | 0.50 |
Earnings by Sex in Webster Parish
Average Earnings in Webster Parish are $23,657, $26,969 for men and $20,829 for women, a difference of 22.8%.
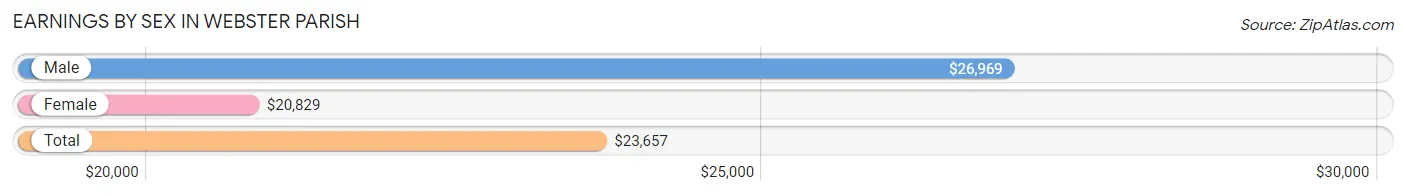
| Sex | Number | Average Earnings |
| Male | 7,448 (52.0%) | $26,969 |
| Female | 6,863 (48.0%) | $20,829 |
| Total | 14,311 (100.0%) | $23,657 |
Earnings by Sex by Income Bracket in Webster Parish
The most common earnings brackets in Webster Parish are $75,000 to $99,999 for men (624 | 8.4%) and $10,000 to $12,499 for women (753 | 11.0%).
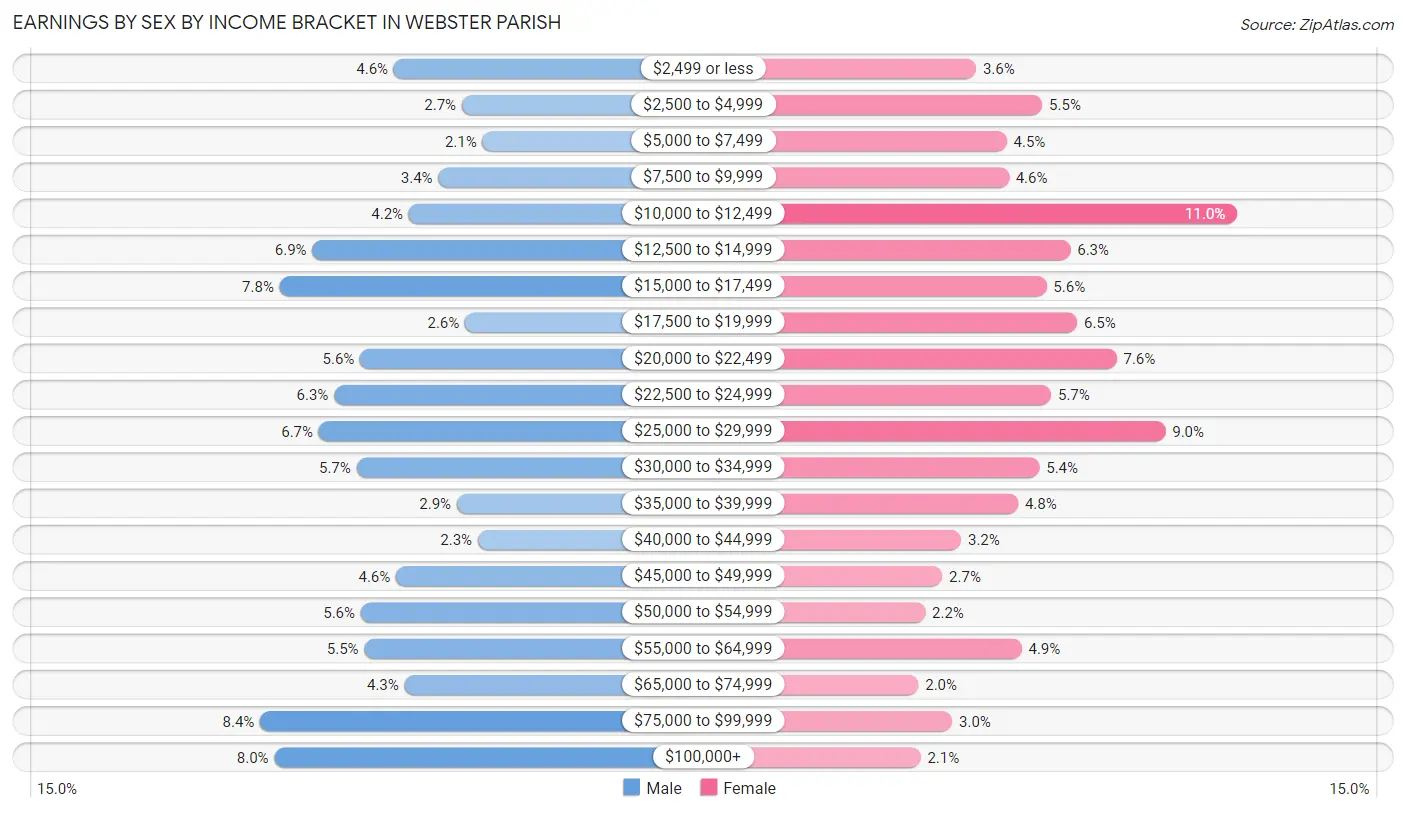
| Income | Male | Female |
| $2,499 or less | 344 (4.6%) | 249 (3.6%) |
| $2,500 to $4,999 | 202 (2.7%) | 377 (5.5%) |
| $5,000 to $7,499 | 159 (2.1%) | 308 (4.5%) |
| $7,500 to $9,999 | 251 (3.4%) | 312 (4.5%) |
| $10,000 to $12,499 | 313 (4.2%) | 753 (11.0%) |
| $12,500 to $14,999 | 515 (6.9%) | 431 (6.3%) |
| $15,000 to $17,499 | 583 (7.8%) | 385 (5.6%) |
| $17,500 to $19,999 | 195 (2.6%) | 444 (6.5%) |
| $20,000 to $22,499 | 415 (5.6%) | 520 (7.6%) |
| $22,500 to $24,999 | 469 (6.3%) | 394 (5.7%) |
| $25,000 to $29,999 | 501 (6.7%) | 614 (8.9%) |
| $30,000 to $34,999 | 422 (5.7%) | 371 (5.4%) |
| $35,000 to $39,999 | 212 (2.9%) | 330 (4.8%) |
| $40,000 to $44,999 | 168 (2.3%) | 220 (3.2%) |
| $45,000 to $49,999 | 340 (4.6%) | 184 (2.7%) |
| $50,000 to $54,999 | 413 (5.6%) | 151 (2.2%) |
| $55,000 to $64,999 | 406 (5.4%) | 337 (4.9%) |
| $65,000 to $74,999 | 322 (4.3%) | 138 (2.0%) |
| $75,000 to $99,999 | 624 (8.4%) | 203 (3.0%) |
| $100,000+ | 594 (8.0%) | 142 (2.1%) |
| Total | 7,448 (100.0%) | 6,863 (100.0%) |
Earnings by Sex by Educational Attainment in Webster Parish
Average earnings in Webster Parish are $30,465 for men and $21,723 for women, a difference of 28.7%. Men with an educational attainment of graduate degree enjoy the highest average annual earnings of $78,993, while those with high school diploma education earn the least with $23,795. Women with an educational attainment of graduate degree earn the most with the average annual earnings of $55,718, while those with less than high school education have the smallest earnings of $10,370.
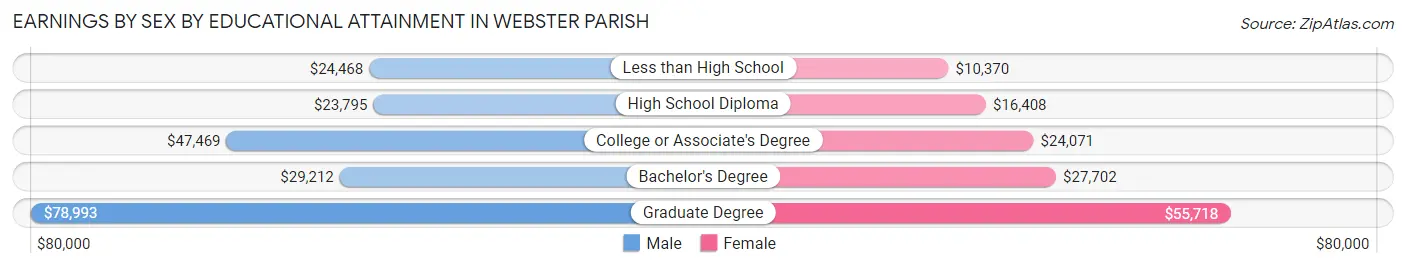
| Educational Attainment | Male Income | Female Income |
| Less than High School | $24,468 | $10,370 |
| High School Diploma | $23,795 | $16,408 |
| College or Associate's Degree | $47,469 | $24,071 |
| Bachelor's Degree | $29,212 | $27,702 |
| Graduate Degree | $78,993 | $55,718 |
| Total | $30,465 | $21,723 |
Family Income in Webster Parish
Family Income Brackets in Webster Parish
According to the Webster Parish family income data, there are 1,549 families falling into the $35,000 to $49,999 income range, which is the most common income bracket and makes up 16.3% of all families. Conversely, the $200,000+ income bracket is the least frequent group with only 342 families (3.6%) belonging to this category.
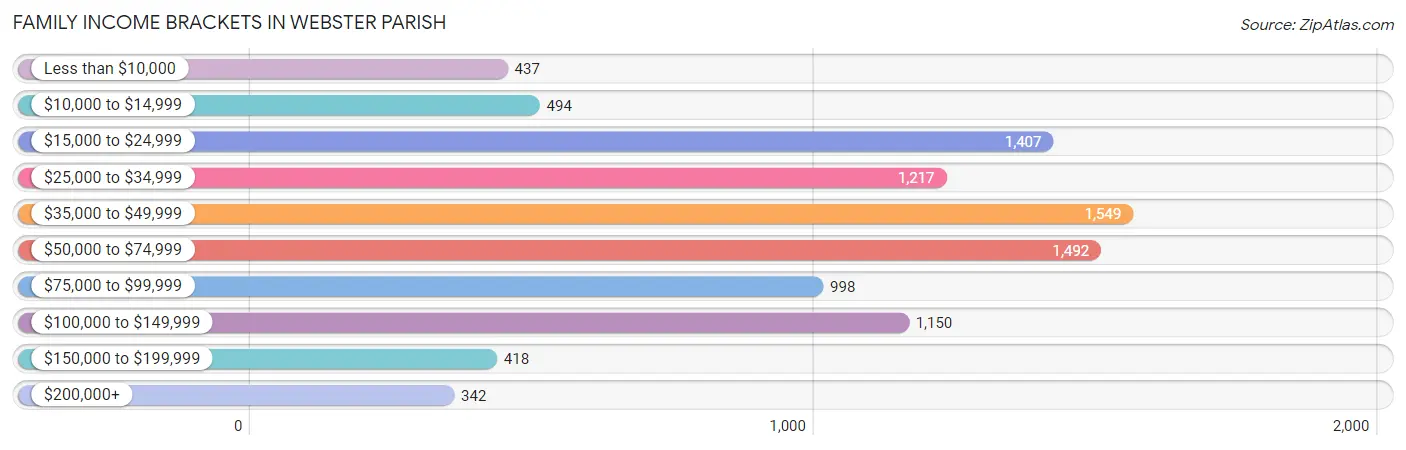
| Income Bracket | # Families | % Families |
| Less than $10,000 | 437 | 4.6% |
| $10,000 to $14,999 | 494 | 5.2% |
| $15,000 to $24,999 | 1,407 | 14.8% |
| $25,000 to $34,999 | 1,217 | 12.8% |
| $35,000 to $49,999 | 1,549 | 16.3% |
| $50,000 to $74,999 | 1,492 | 15.7% |
| $75,000 to $99,999 | 998 | 10.5% |
| $100,000 to $149,999 | 1,150 | 12.1% |
| $150,000 to $199,999 | 418 | 4.4% |
| $200,000+ | 342 | 3.6% |
Family Income by Famaliy Size in Webster Parish
7+ person families (49 | 0.5%) account for the highest median family income in Webster Parish with $81,406 per family, while 2-person families (4,547 | 47.8%) have the highest median income of $25,226 per family member.
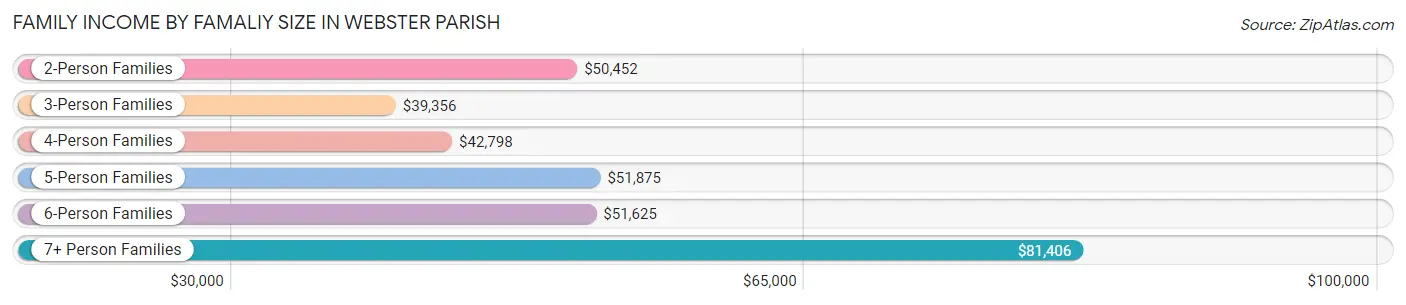
| Income Bracket | # Families | Median Income |
| 2-Person Families | 4,547 (47.8%) | $50,452 |
| 3-Person Families | 2,211 (23.3%) | $39,356 |
| 4-Person Families | 1,586 (16.7%) | $42,798 |
| 5-Person Families | 879 (9.2%) | $51,875 |
| 6-Person Families | 233 (2.5%) | $51,625 |
| 7+ Person Families | 49 (0.5%) | $81,406 |
| Total | 9,505 (100.0%) | $45,302 |
Family Income by Number of Earners in Webster Parish
The median family income in Webster Parish is $45,302, with families comprising 3+ earners (505) having the highest median family income of $99,563, while families with no earners (2,537) have the lowest median family income of $33,738, accounting for 5.3% and 26.7% of families, respectively.
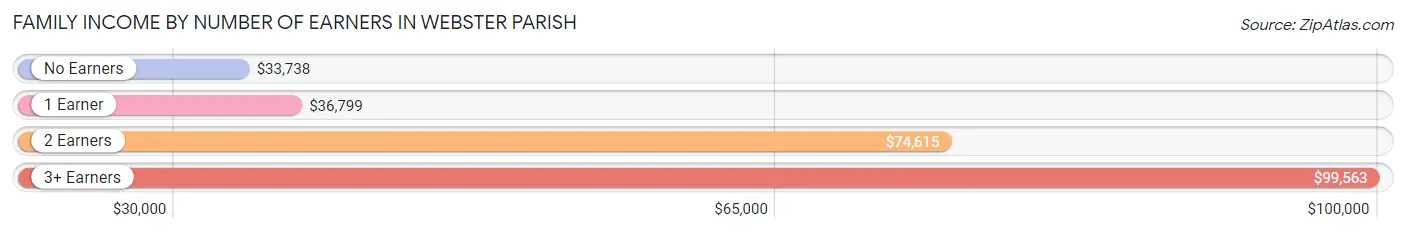
| Number of Earners | # Families | Median Income |
| No Earners | 2,537 (26.7%) | $33,738 |
| 1 Earner | 3,699 (38.9%) | $36,799 |
| 2 Earners | 2,764 (29.1%) | $74,615 |
| 3+ Earners | 505 (5.3%) | $99,563 |
| Total | 9,505 (100.0%) | $45,302 |
Household Income in Webster Parish
Household Income Brackets in Webster Parish
With 2,857 households falling in the category, the $15,000 to $24,999 income range is the most frequent in Webster Parish, accounting for 19.3% of all households. In contrast, only 370 households (2.5%) fall into the $200,000+ income bracket, making it the least populous group.
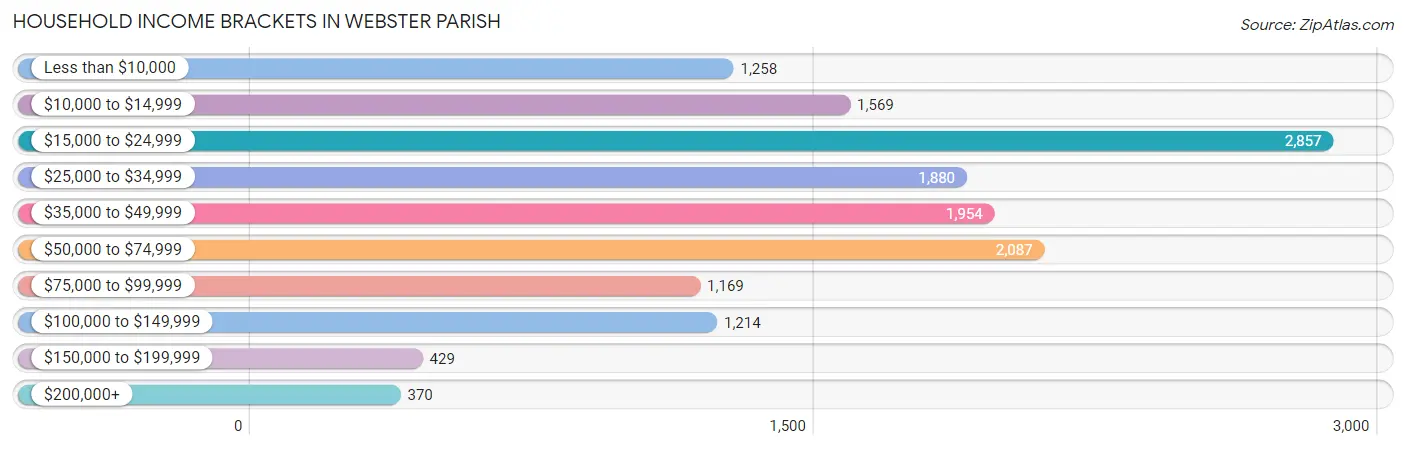
| Income Bracket | # Households | % Households |
| Less than $10,000 | 1,258 | 8.5% |
| $10,000 to $14,999 | 1,569 | 10.6% |
| $15,000 to $24,999 | 2,857 | 19.3% |
| $25,000 to $34,999 | 1,880 | 12.7% |
| $35,000 to $49,999 | 1,954 | 13.2% |
| $50,000 to $74,999 | 2,087 | 14.1% |
| $75,000 to $99,999 | 1,169 | 7.9% |
| $100,000 to $149,999 | 1,214 | 8.2% |
| $150,000 to $199,999 | 429 | 2.9% |
| $200,000+ | 370 | 2.5% |
Household Income by Householder Age in Webster Parish
The median household income in Webster Parish is $34,263, with the highest median household income of $40,407 found in the 45 to 64 years age bracket for the primary householder. A total of 5,424 households (36.6%) fall into this category. Meanwhile, the 15 to 24 years age bracket for the primary householder has the lowest median household income of $20,663, with 478 households (3.2%) in this group.
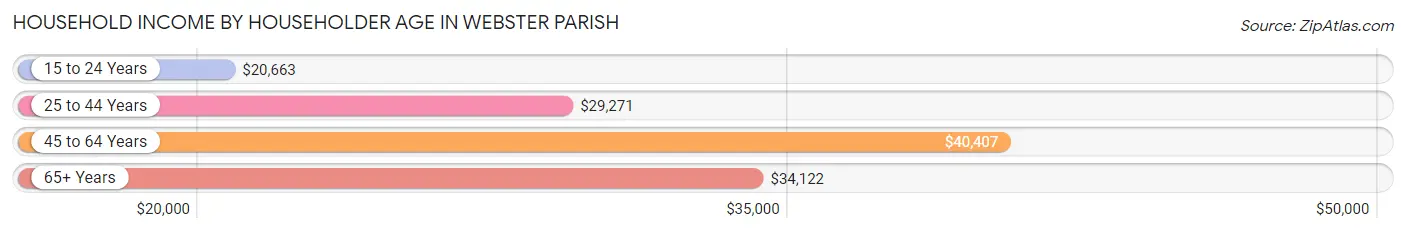
| Income Bracket | # Households | Median Income |
| 15 to 24 Years | 478 (3.2%) | $20,663 |
| 25 to 44 Years | 4,006 (27.1%) | $29,271 |
| 45 to 64 Years | 5,424 (36.6%) | $40,407 |
| 65+ Years | 4,893 (33.1%) | $34,122 |
| Total | 14,801 (100.0%) | $34,263 |
Poverty in Webster Parish
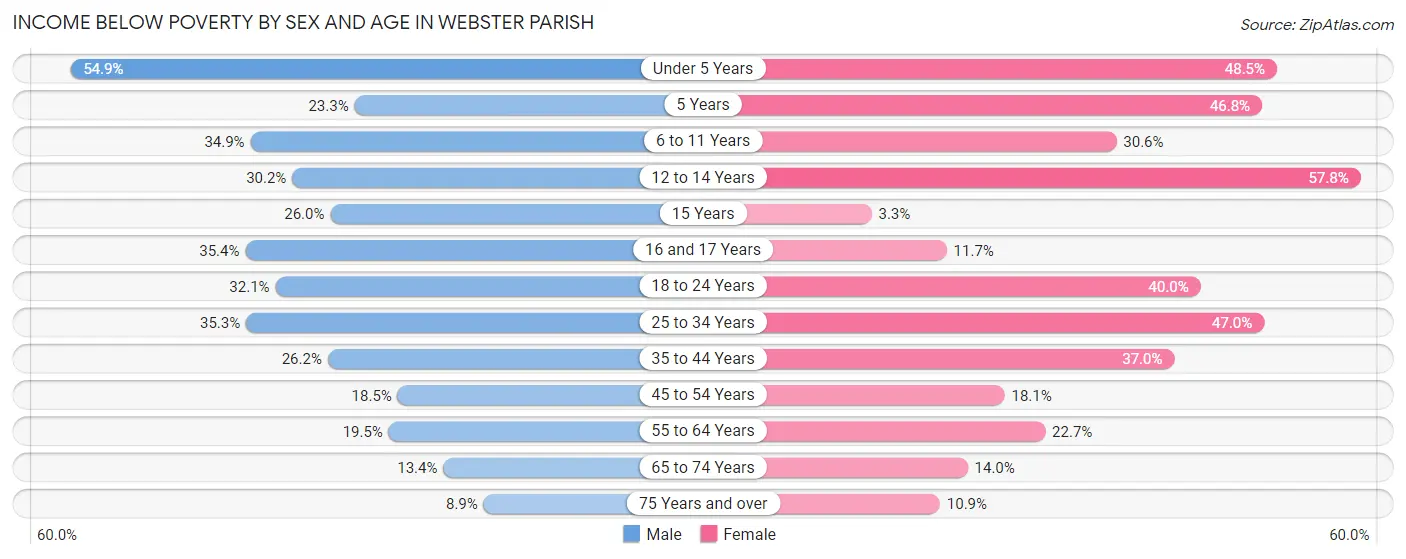
Income Below Poverty by Sex and Age in Webster Parish
With 26.3% poverty level for males and 28.9% for females among the residents of Webster Parish, under 5 year old males and 12 to 14 year old females are the most vulnerable to poverty, with 608 males (54.9%) and 364 females (57.8%) in their respective age groups living below the poverty level.
| Age Bracket | Male | Female |
| Under 5 Years | 608 (54.9%) | 500 (48.4%) |
| 5 Years | 50 (23.3%) | 51 (46.8%) |
| 6 to 11 Years | 474 (34.8%) | 452 (30.6%) |
| 12 to 14 Years | 289 (30.2%) | 364 (57.8%) |
| 15 Years | 48 (26.0%) | 4 (3.3%) |
| 16 and 17 Years | 266 (35.4%) | 43 (11.7%) |
| 18 to 24 Years | 472 (32.1%) | 537 (40.0%) |
| 25 to 34 Years | 659 (35.3%) | 1,030 (47.0%) |
| 35 to 44 Years | 470 (26.2%) | 822 (37.0%) |
| 45 to 54 Years | 384 (18.4%) | 412 (18.1%) |
| 55 to 64 Years | 484 (19.5%) | 596 (22.7%) |
| 65 to 74 Years | 258 (13.4%) | 310 (14.0%) |
| 75 Years and over | 107 (8.9%) | 198 (10.9%) |
| Total | 4,569 (26.3%) | 5,319 (28.9%) |
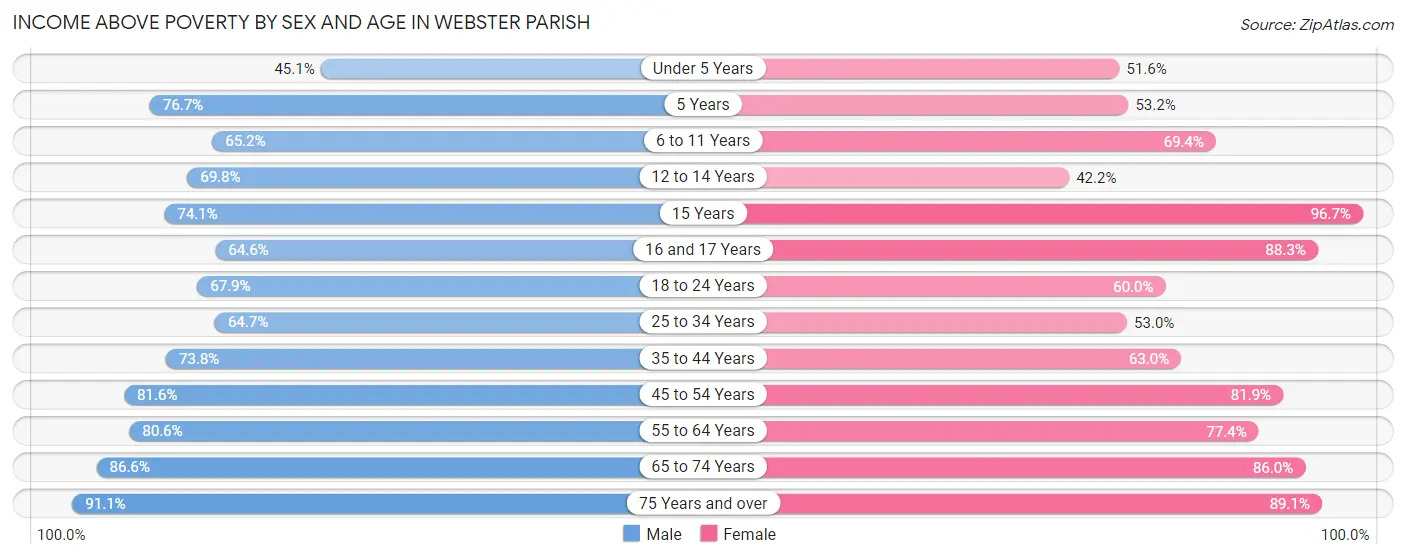
Income Above Poverty by Sex and Age in Webster Parish
According to the poverty statistics in Webster Parish, males aged 75 years and over and females aged 15 years are the age groups that are most secure financially, with 91.1% of males and 96.7% of females in these age groups living above the poverty line.
| Age Bracket | Male | Female |
| Under 5 Years | 499 (45.1%) | 532 (51.5%) |
| 5 Years | 165 (76.7%) | 58 (53.2%) |
| 6 to 11 Years | 886 (65.1%) | 1,026 (69.4%) |
| 12 to 14 Years | 668 (69.8%) | 266 (42.2%) |
| 15 Years | 137 (74.1%) | 117 (96.7%) |
| 16 and 17 Years | 485 (64.6%) | 325 (88.3%) |
| 18 to 24 Years | 1,000 (67.9%) | 807 (60.0%) |
| 25 to 34 Years | 1,206 (64.7%) | 1,160 (53.0%) |
| 35 to 44 Years | 1,321 (73.8%) | 1,398 (63.0%) |
| 45 to 54 Years | 1,697 (81.6%) | 1,861 (81.9%) |
| 55 to 64 Years | 2,005 (80.5%) | 2,035 (77.3%) |
| 65 to 74 Years | 1,671 (86.6%) | 1,902 (86.0%) |
| 75 Years and over | 1,098 (91.1%) | 1,615 (89.1%) |
| Total | 12,838 (73.8%) | 13,102 (71.1%) |
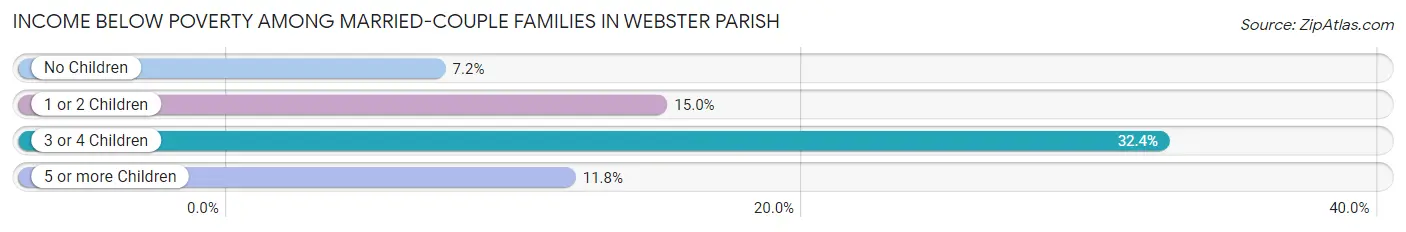
Income Below Poverty Among Married-Couple Families in Webster Parish
The poverty statistics for married-couple families in Webster Parish show that 11.6% or 743 of the total 6,430 families live below the poverty line. Families with 3 or 4 children have the highest poverty rate of 32.4%, comprising of 157 families. On the other hand, families with no children have the lowest poverty rate of 7.2%, which includes 283 families.
| Children | Above Poverty | Below Poverty |
| No Children | 3,633 (92.8%) | 283 (7.2%) |
| 1 or 2 Children | 1,712 (85.1%) | 301 (14.9%) |
| 3 or 4 Children | 327 (67.6%) | 157 (32.4%) |
| 5 or more Children | 15 (88.2%) | 2 (11.8%) |
| Total | 5,687 (88.4%) | 743 (11.6%) |
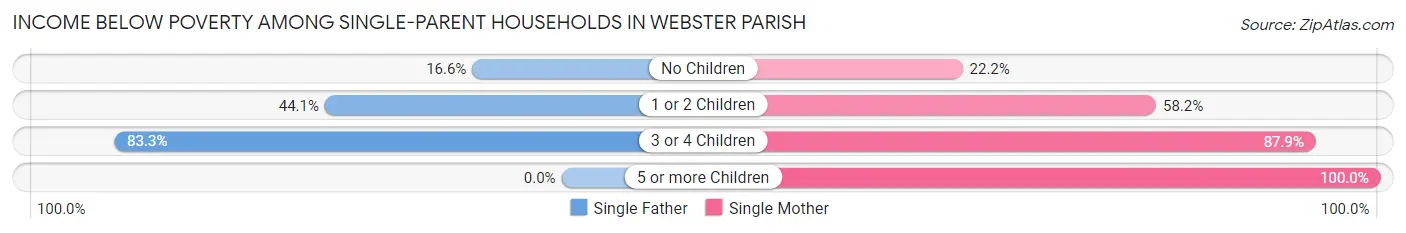
Income Below Poverty Among Single-Parent Households in Webster Parish
According to the poverty data in Webster Parish, 32.0% or 298 single-father households and 48.0% or 1,030 single-mother households are living below the poverty line. Among single-father households, those with 3 or 4 children have the highest poverty rate, with 60 households (83.3%) experiencing poverty. Likewise, among single-mother households, those with 5 or more children have the highest poverty rate, with 12 households (100.0%) falling below the poverty line.
| Children | Single Father | Single Mother |
| No Children | 85 (16.6%) | 181 (22.2%) |
| 1 or 2 Children | 153 (44.1%) | 626 (58.2%) |
| 3 or 4 Children | 60 (83.3%) | 211 (87.9%) |
| 5 or more Children | 0 (0.0%) | 12 (100.0%) |
| Total | 298 (32.0%) | 1,030 (48.0%) |
Income Below Poverty Among Married-Couple vs Single-Parent Households in Webster Parish
The poverty data for Webster Parish shows that 743 of the married-couple family households (11.6%) and 1,328 of the single-parent households (43.2%) are living below the poverty level. Within the married-couple family households, those with 3 or 4 children have the highest poverty rate, with 157 households (32.4%) falling below the poverty line. Among the single-parent households, those with 5 or more children have the highest poverty rate, with 12 household (100.0%) living below poverty.
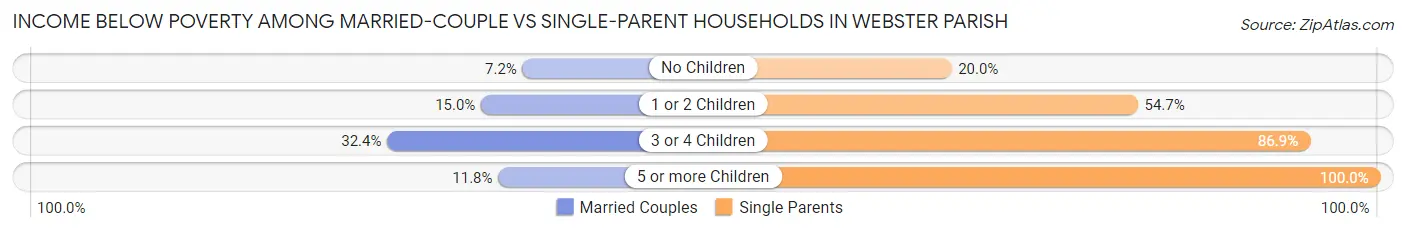
| Children | Married-Couple Families | Single-Parent Households |
| No Children | 283 (7.2%) | 266 (20.0%) |
| 1 or 2 Children | 301 (14.9%) | 779 (54.7%) |
| 3 or 4 Children | 157 (32.4%) | 271 (86.9%) |
| 5 or more Children | 2 (11.8%) | 12 (100.0%) |
| Total | 743 (11.6%) | 1,328 (43.2%) |
Employment Characteristics in Webster Parish
Employment by Class of Employer in Webster Parish
Among the 12,853 employed individuals in Webster Parish, private company employees (8,763 | 68.2%), state government employees (1,022 | 8.0%), and self-employed (not incorporated) (897 | 7.0%) make up the most common classes of employment.
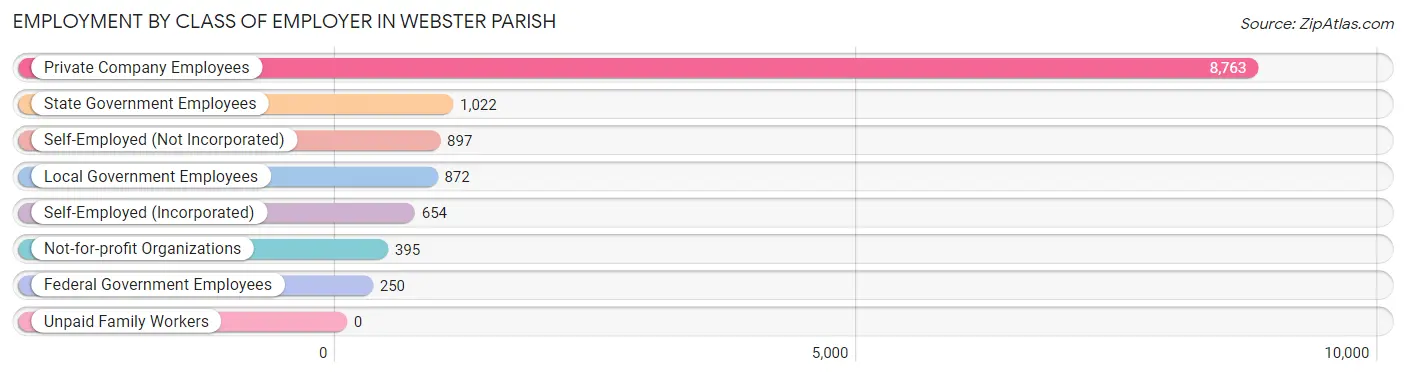
| Employer Class | # Employees | % Employees |
| Private Company Employees | 8,763 | 68.2% |
| Self-Employed (Incorporated) | 654 | 5.1% |
| Self-Employed (Not Incorporated) | 897 | 7.0% |
| Not-for-profit Organizations | 395 | 3.1% |
| Local Government Employees | 872 | 6.8% |
| State Government Employees | 1,022 | 8.0% |
| Federal Government Employees | 250 | 1.9% |
| Unpaid Family Workers | 0 | 0.0% |
| Total | 12,853 | 100.0% |
Employment Status by Age in Webster Parish
According to the labor force statistics for Webster Parish, out of the total population over 16 years of age (29,490), 46.7% or 13,772 individuals are in the labor force, with 5.3% or 730 of them unemployed. The age group with the highest labor force participation rate is 35 to 44 years, with 73.1% or 3,044 individuals in the labor force. Within the labor force, the 16 to 19 years age range has the highest percentage of unemployed individuals, with 13.5% or 51 of them being unemployed.
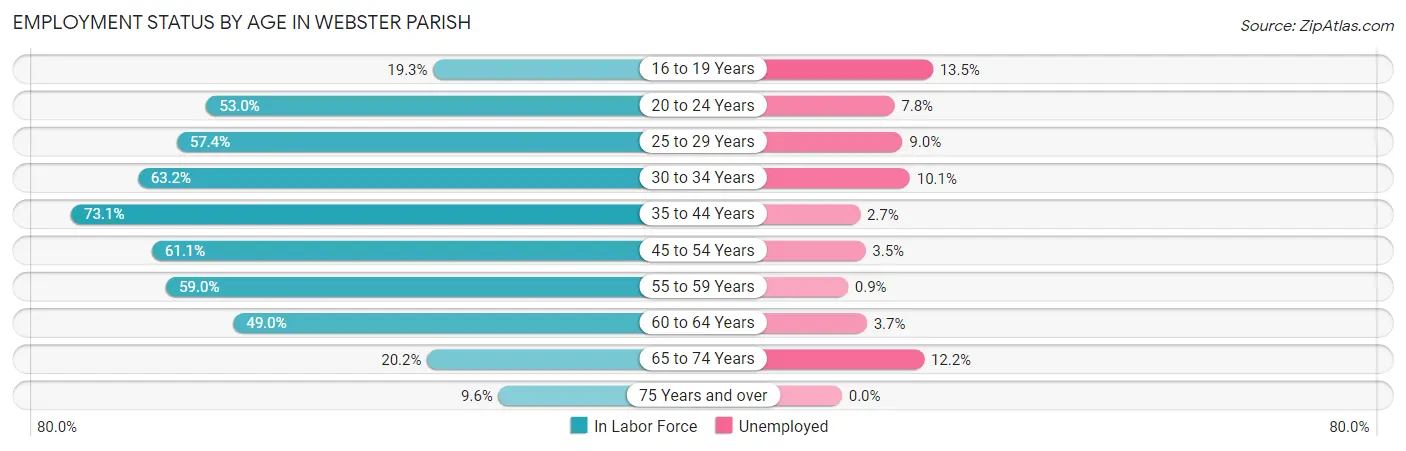
| Age Bracket | In Labor Force | Unemployed |
| 16 to 19 Years | 376 (19.3%) | 51 (13.5%) |
| 20 to 24 Years | 1,111 (53.0%) | 87 (7.8%) |
| 25 to 29 Years | 1,247 (57.4%) | 112 (9.0%) |
| 30 to 34 Years | 1,336 (63.2%) | 135 (10.1%) |
| 35 to 44 Years | 3,044 (73.1%) | 82 (2.7%) |
| 45 to 54 Years | 2,709 (61.1%) | 95 (3.5%) |
| 55 to 59 Years | 1,562 (59.0%) | 14 (0.9%) |
| 60 to 64 Years | 1,227 (49.0%) | 45 (3.7%) |
| 65 to 74 Years | 862 (20.2%) | 105 (12.2%) |
| 75 Years and over | 302 (9.6%) | 0 (0.0%) |
| Total | 13,772 (46.7%) | 730 (5.3%) |
Employment Status by Educational Attainment in Webster Parish
According to labor force statistics for Webster Parish, 61.7% of individuals (11,128) out of the total population between 25 and 64 years of age (18,035) are in the labor force, with 4.3% or 479 of them being unemployed. The group with the highest labor force participation rate are those with the educational attainment of bachelor's degree or higher, with 78.0% or 1,860 individuals in the labor force. Within the labor force, individuals with less than high school education have the highest percentage of unemployment, with 10.3% or 61 of them being unemployed.
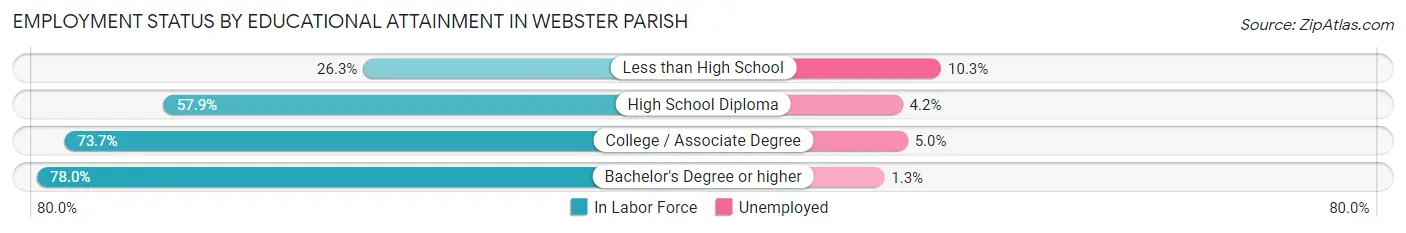
| Educational Attainment | In Labor Force | Unemployed |
| Less than High School | 593 (26.3%) | 232 (10.3%) |
| High School Diploma | 4,421 (57.9%) | 321 (4.2%) |
| College / Associate Degree | 4,245 (73.7%) | 288 (5.0%) |
| Bachelor's Degree or higher | 1,860 (78.0%) | 31 (1.3%) |
| Total | 11,128 (61.7%) | 776 (4.3%) |
Employment Occupations by Sex in Webster Parish
Management, Business, Science and Arts Occupations
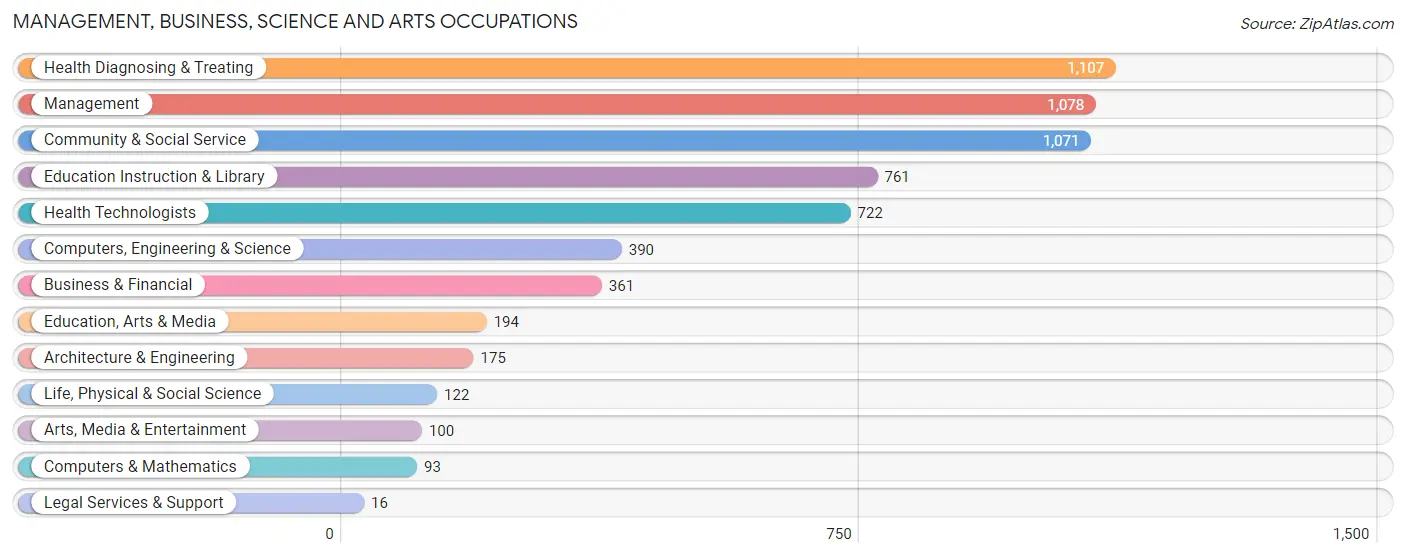
The most common Management, Business, Science and Arts occupations in Webster Parish are Health Diagnosing & Treating (1,107 | 8.5%), Management (1,078 | 8.3%), Community & Social Service (1,071 | 8.2%), Education Instruction & Library (761 | 5.9%), and Health Technologists (722 | 5.6%).
Management, Business, Science and Arts Occupations by Sex
Within the Management, Business, Science and Arts occupations in Webster Parish, the most male-oriented occupations are Architecture & Engineering (100.0%), Legal Services & Support (100.0%), and Computers, Engineering & Science (71.3%), while the most female-oriented occupations are Education Instruction & Library (89.0%), Health Diagnosing & Treating (84.8%), and Community & Social Service (79.1%).
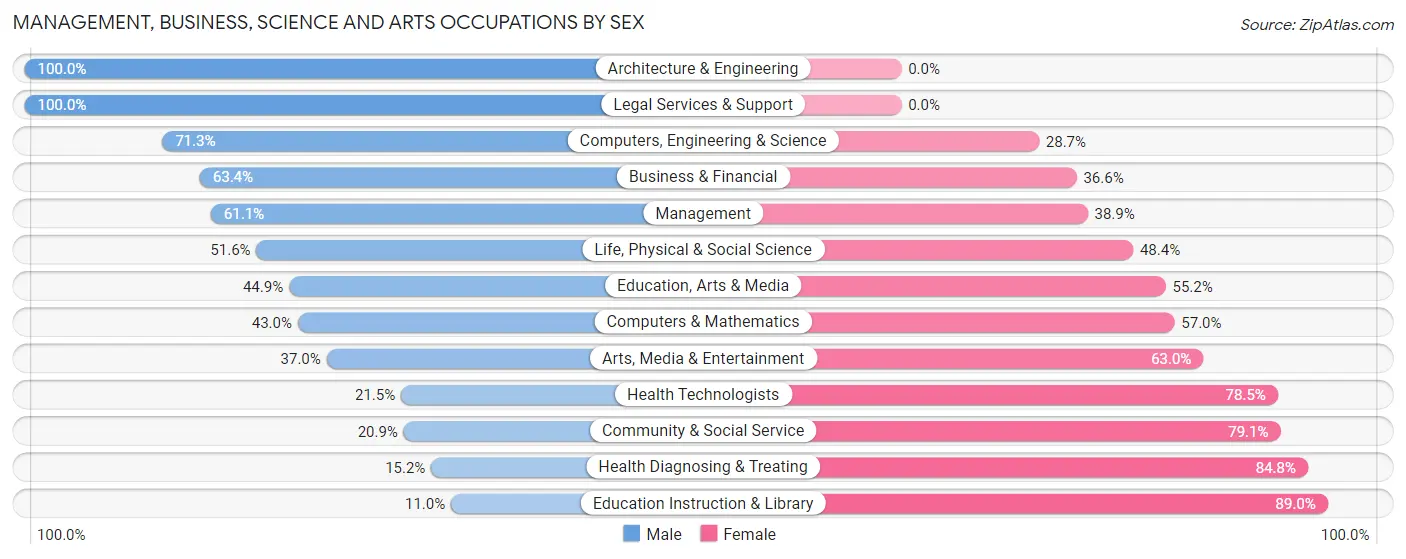
| Occupation | Male | Female |
| Management | 659 (61.1%) | 419 (38.9%) |
| Business & Financial | 229 (63.4%) | 132 (36.6%) |
| Computers, Engineering & Science | 278 (71.3%) | 112 (28.7%) |
| Computers & Mathematics | 40 (43.0%) | 53 (57.0%) |
| Architecture & Engineering | 175 (100.0%) | 0 (0.0%) |
| Life, Physical & Social Science | 63 (51.6%) | 59 (48.4%) |
| Community & Social Service | 224 (20.9%) | 847 (79.1%) |
| Education, Arts & Media | 87 (44.9%) | 107 (55.1%) |
| Legal Services & Support | 16 (100.0%) | 0 (0.0%) |
| Education Instruction & Library | 84 (11.0%) | 677 (89.0%) |
| Arts, Media & Entertainment | 37 (37.0%) | 63 (63.0%) |
| Health Diagnosing & Treating | 168 (15.2%) | 939 (84.8%) |
| Health Technologists | 155 (21.5%) | 567 (78.5%) |
| Total (Category) | 1,558 (38.9%) | 2,449 (61.1%) |
| Total (Overall) | 6,769 (52.1%) | 6,225 (47.9%) |
Services Occupations
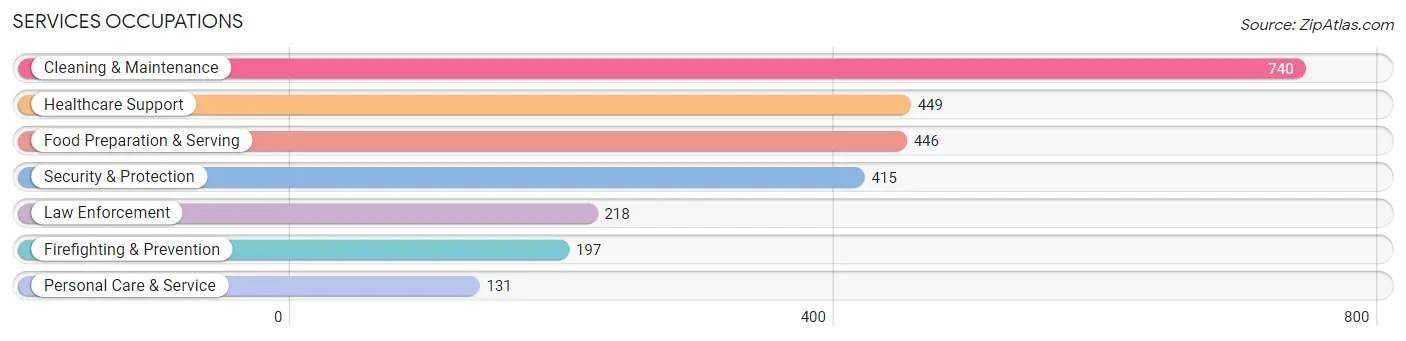
The most common Services occupations in Webster Parish are Cleaning & Maintenance (740 | 5.7%), Healthcare Support (449 | 3.5%), Food Preparation & Serving (446 | 3.4%), Security & Protection (415 | 3.2%), and Law Enforcement (218 | 1.7%).
Services Occupations by Sex
Within the Services occupations in Webster Parish, the most male-oriented occupations are Firefighting & Prevention (89.8%), Security & Protection (87.2%), and Law Enforcement (84.9%), while the most female-oriented occupations are Personal Care & Service (95.4%), Food Preparation & Serving (87.7%), and Healthcare Support (81.1%).
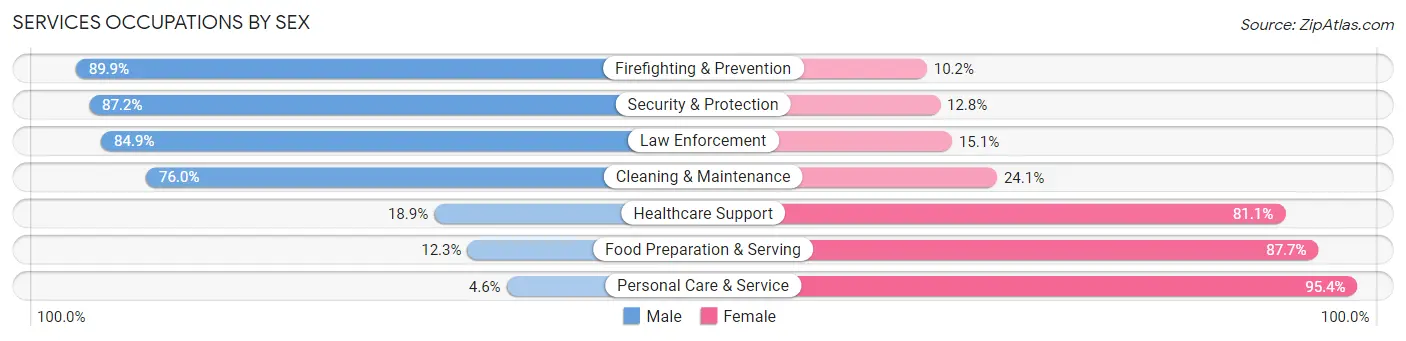
| Occupation | Male | Female |
| Healthcare Support | 85 (18.9%) | 364 (81.1%) |
| Security & Protection | 362 (87.2%) | 53 (12.8%) |
| Firefighting & Prevention | 177 (89.8%) | 20 (10.2%) |
| Law Enforcement | 185 (84.9%) | 33 (15.1%) |
| Food Preparation & Serving | 55 (12.3%) | 391 (87.7%) |
| Cleaning & Maintenance | 562 (75.9%) | 178 (24.0%) |
| Personal Care & Service | 6 (4.6%) | 125 (95.4%) |
| Total (Category) | 1,070 (49.1%) | 1,111 (50.9%) |
| Total (Overall) | 6,769 (52.1%) | 6,225 (47.9%) |
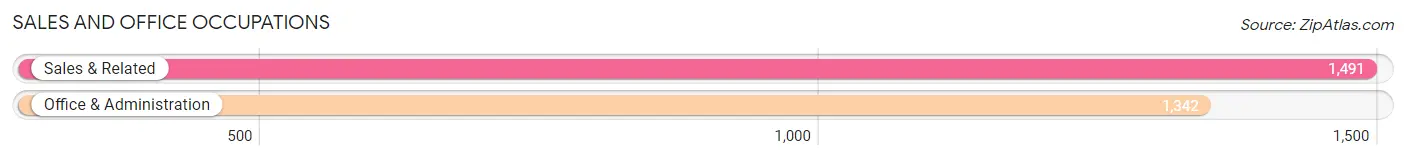
Sales and Office Occupations
The most common Sales and Office occupations in Webster Parish are Sales & Related (1,491 | 11.5%), and Office & Administration (1,342 | 10.3%).
Sales and Office Occupations by Sex

| Occupation | Male | Female |
| Sales & Related | 473 (31.7%) | 1,018 (68.3%) |
| Office & Administration | 170 (12.7%) | 1,172 (87.3%) |
| Total (Category) | 643 (22.7%) | 2,190 (77.3%) |
| Total (Overall) | 6,769 (52.1%) | 6,225 (47.9%) |
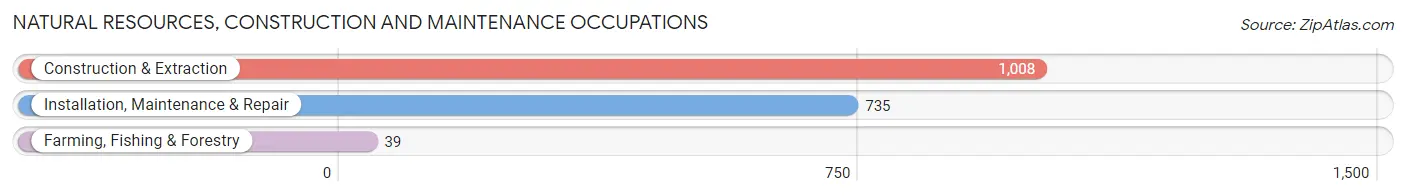
Natural Resources, Construction and Maintenance Occupations
The most common Natural Resources, Construction and Maintenance occupations in Webster Parish are Construction & Extraction (1,008 | 7.8%), Installation, Maintenance & Repair (735 | 5.7%), and Farming, Fishing & Forestry (39 | 0.3%).
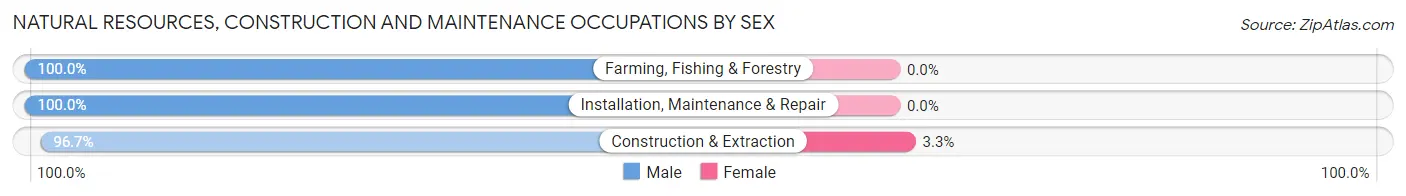
Natural Resources, Construction and Maintenance Occupations by Sex
| Occupation | Male | Female |
| Farming, Fishing & Forestry | 39 (100.0%) | 0 (0.0%) |
| Construction & Extraction | 975 (96.7%) | 33 (3.3%) |
| Installation, Maintenance & Repair | 735 (100.0%) | 0 (0.0%) |
| Total (Category) | 1,749 (98.2%) | 33 (1.8%) |
| Total (Overall) | 6,769 (52.1%) | 6,225 (47.9%) |
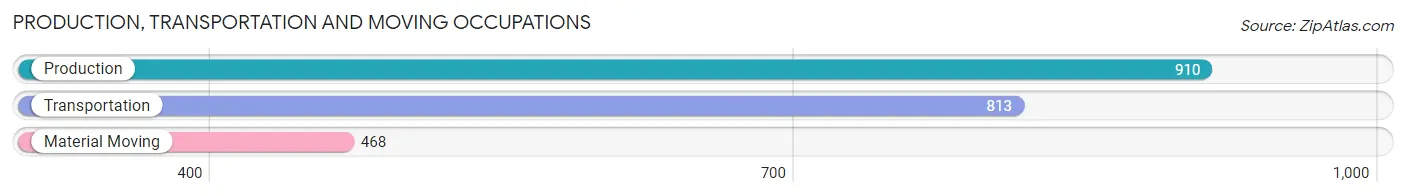
Production, Transportation and Moving Occupations
The most common Production, Transportation and Moving occupations in Webster Parish are Production (910 | 7.0%), Transportation (813 | 6.3%), and Material Moving (468 | 3.6%).
Production, Transportation and Moving Occupations by Sex
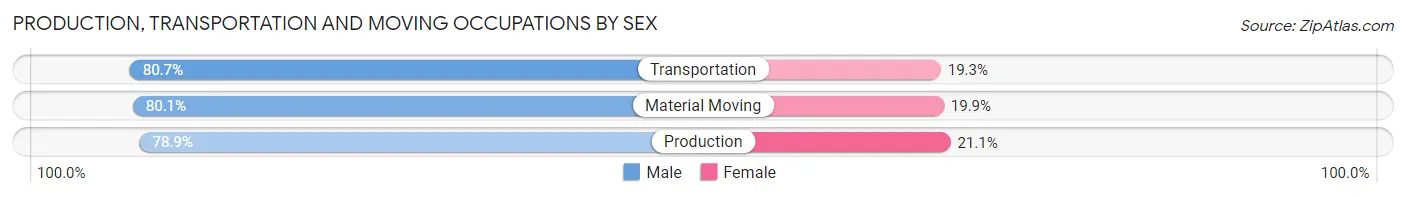
| Occupation | Male | Female |
| Production | 718 (78.9%) | 192 (21.1%) |
| Transportation | 656 (80.7%) | 157 (19.3%) |
| Material Moving | 375 (80.1%) | 93 (19.9%) |
| Total (Category) | 1,749 (79.8%) | 442 (20.2%) |
| Total (Overall) | 6,769 (52.1%) | 6,225 (47.9%) |
Employment Industries by Sex in Webster Parish
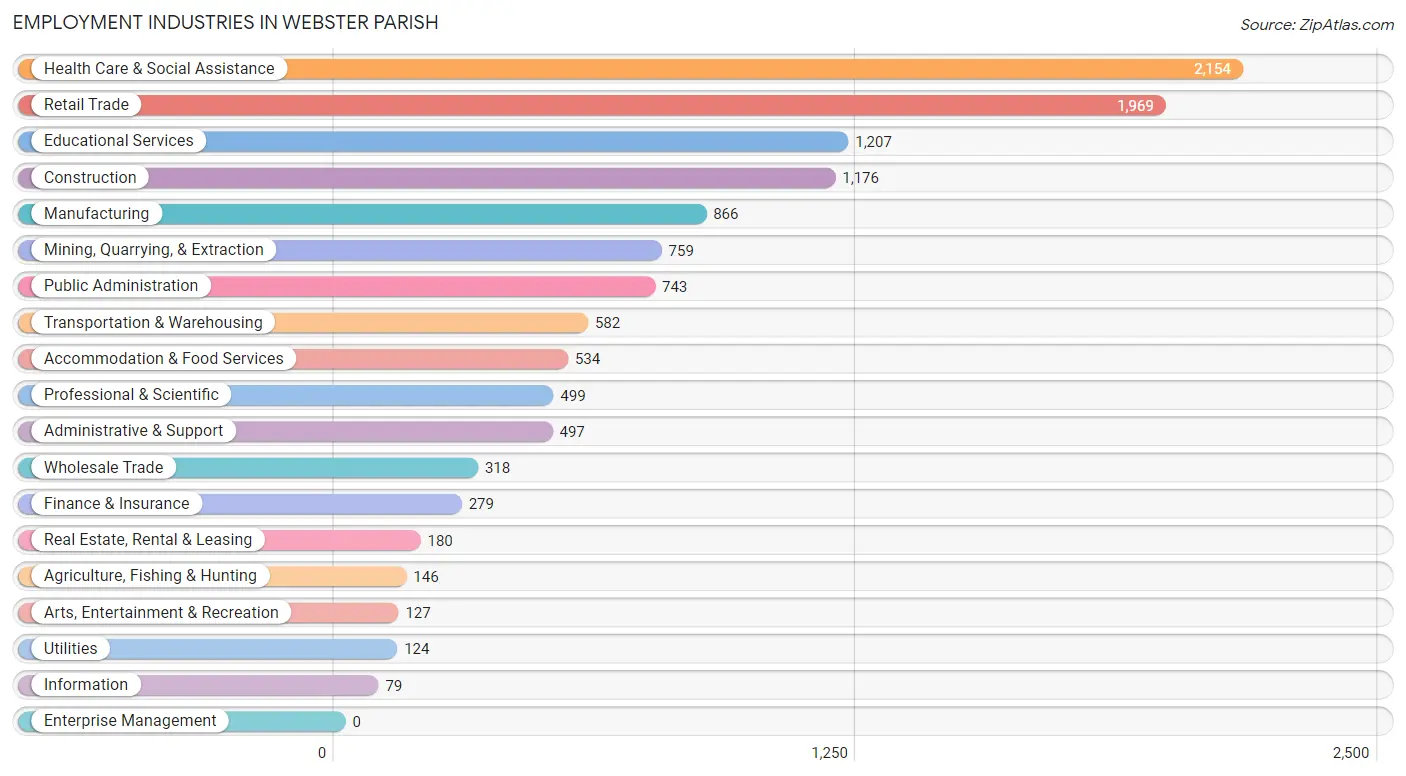
Employment Industries in Webster Parish
The major employment industries in Webster Parish include Health Care & Social Assistance (2,154 | 16.6%), Retail Trade (1,969 | 15.1%), Educational Services (1,207 | 9.3%), Construction (1,176 | 9.0%), and Manufacturing (866 | 6.7%).
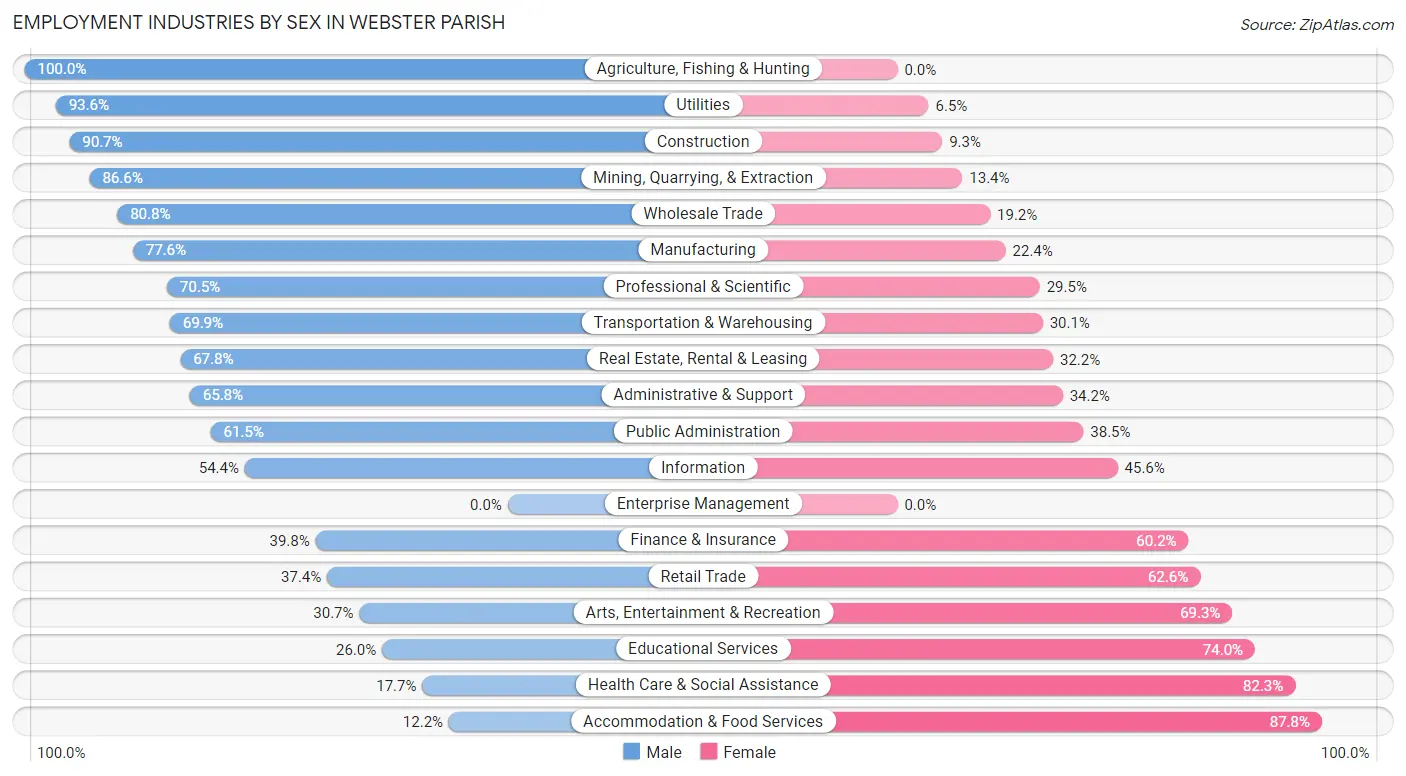
Employment Industries by Sex in Webster Parish
The Webster Parish industries that see more men than women are Agriculture, Fishing & Hunting (100.0%), Utilities (93.5%), and Construction (90.7%), whereas the industries that tend to have a higher number of women are Accommodation & Food Services (87.8%), Health Care & Social Assistance (82.3%), and Educational Services (74.0%).
| Industry | Male | Female |
| Agriculture, Fishing & Hunting | 146 (100.0%) | 0 (0.0%) |
| Mining, Quarrying, & Extraction | 657 (86.6%) | 102 (13.4%) |
| Construction | 1,067 (90.7%) | 109 (9.3%) |
| Manufacturing | 672 (77.6%) | 194 (22.4%) |
| Wholesale Trade | 257 (80.8%) | 61 (19.2%) |
| Retail Trade | 736 (37.4%) | 1,233 (62.6%) |
| Transportation & Warehousing | 407 (69.9%) | 175 (30.1%) |
| Utilities | 116 (93.5%) | 8 (6.5%) |
| Information | 43 (54.4%) | 36 (45.6%) |
| Finance & Insurance | 111 (39.8%) | 168 (60.2%) |
| Real Estate, Rental & Leasing | 122 (67.8%) | 58 (32.2%) |
| Professional & Scientific | 352 (70.5%) | 147 (29.5%) |
| Enterprise Management | 0 (0.0%) | 0 (0.0%) |
| Administrative & Support | 327 (65.8%) | 170 (34.2%) |
| Educational Services | 314 (26.0%) | 893 (74.0%) |
| Health Care & Social Assistance | 381 (17.7%) | 1,773 (82.3%) |
| Arts, Entertainment & Recreation | 39 (30.7%) | 88 (69.3%) |
| Accommodation & Food Services | 65 (12.2%) | 469 (87.8%) |
| Public Administration | 457 (61.5%) | 286 (38.5%) |
| Total | 6,769 (52.1%) | 6,225 (47.9%) |
Education in Webster Parish
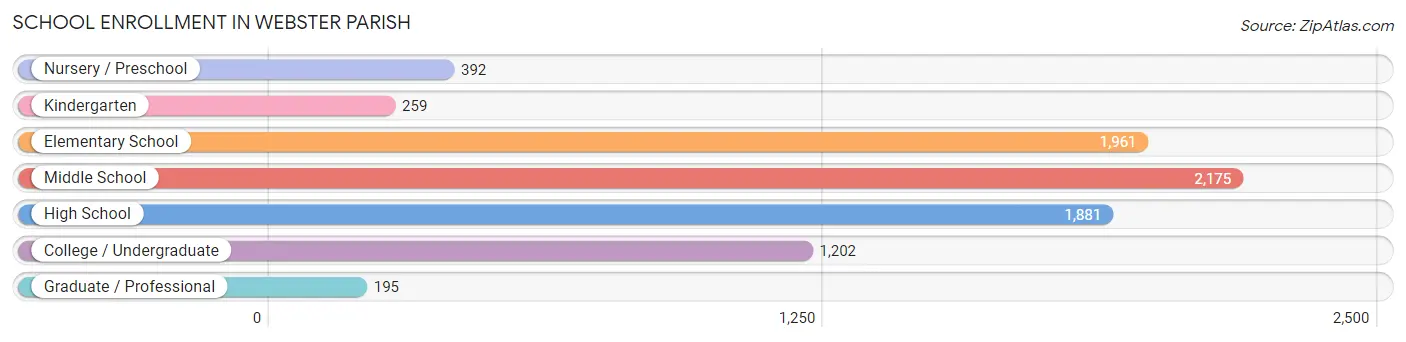
School Enrollment in Webster Parish
The most common levels of schooling among the 8,065 students in Webster Parish are middle school (2,175 | 27.0%), elementary school (1,961 | 24.3%), and high school (1,881 | 23.3%).
| School Level | # Students | % Students |
| Nursery / Preschool | 392 | 4.9% |
| Kindergarten | 259 | 3.2% |
| Elementary School | 1,961 | 24.3% |
| Middle School | 2,175 | 27.0% |
| High School | 1,881 | 23.3% |
| College / Undergraduate | 1,202 | 14.9% |
| Graduate / Professional | 195 | 2.4% |
| Total | 8,065 | 100.0% |
School Enrollment by Age by Funding Source in Webster Parish
Out of a total of 8,065 students who are enrolled in schools in Webster Parish, 847 (10.5%) attend a private institution, while the remaining 7,218 (89.5%) are enrolled in public schools. The age group of 35 years and over has the highest likelihood of being enrolled in private schools, with 89 (27.5% in the age bracket) enrolled. Conversely, the age group of 5 to 9 year old has the lowest likelihood of being enrolled in a private school, with 1,884 (92.2% in the age bracket) attending a public institution.
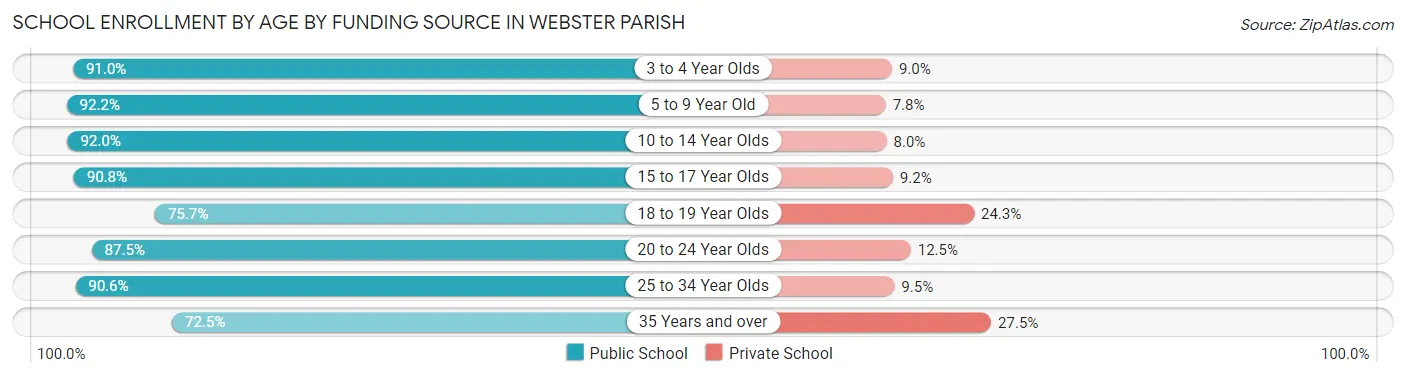
| Age Bracket | Public School | Private School |
| 3 to 4 Year Olds | 313 (91.0%) | 31 (9.0%) |
| 5 to 9 Year Old | 1,884 (92.2%) | 160 (7.8%) |
| 10 to 14 Year Olds | 2,429 (92.0%) | 211 (8.0%) |
| 15 to 17 Year Olds | 1,288 (90.8%) | 130 (9.2%) |
| 18 to 19 Year Olds | 455 (75.7%) | 146 (24.3%) |
| 20 to 24 Year Olds | 385 (87.5%) | 55 (12.5%) |
| 25 to 34 Year Olds | 230 (90.5%) | 24 (9.5%) |
| 35 Years and over | 235 (72.5%) | 89 (27.5%) |
| Total | 7,218 (89.5%) | 847 (10.5%) |
Educational Attainment by Field of Study in Webster Parish
Education (1,006 | 25.4%), science & technology (806 | 20.3%), business (659 | 16.6%), liberal arts & history (326 | 8.2%), and arts & humanities (231 | 5.8%) are the most common fields of study among 3,965 individuals in Webster Parish who have obtained a bachelor's degree or higher.
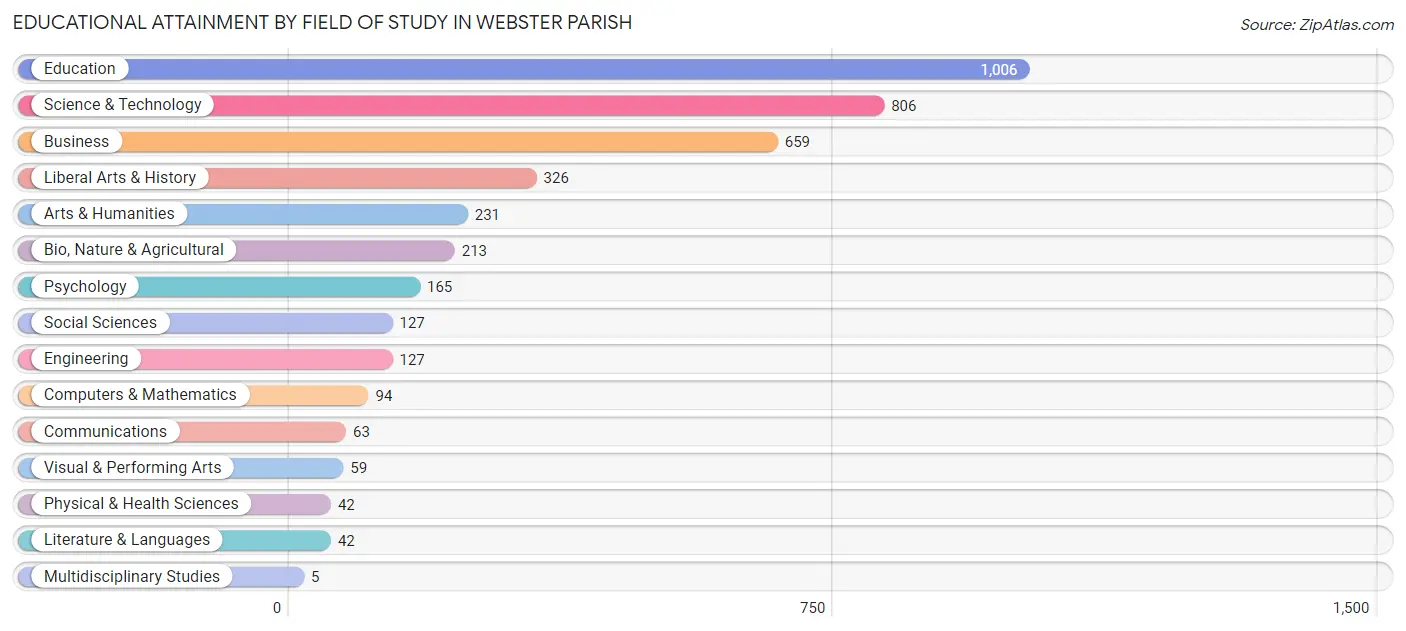
| Field of Study | # Graduates | % Graduates |
| Computers & Mathematics | 94 | 2.4% |
| Bio, Nature & Agricultural | 213 | 5.4% |
| Physical & Health Sciences | 42 | 1.1% |
| Psychology | 165 | 4.2% |
| Social Sciences | 127 | 3.2% |
| Engineering | 127 | 3.2% |
| Multidisciplinary Studies | 5 | 0.1% |
| Science & Technology | 806 | 20.3% |
| Business | 659 | 16.6% |
| Education | 1,006 | 25.4% |
| Literature & Languages | 42 | 1.1% |
| Liberal Arts & History | 326 | 8.2% |
| Visual & Performing Arts | 59 | 1.5% |
| Communications | 63 | 1.6% |
| Arts & Humanities | 231 | 5.8% |
| Total | 3,965 | 100.0% |
Transportation & Commute in Webster Parish
Vehicle Availability by Sex in Webster Parish
The most prevalent vehicle ownership categories in Webster Parish are males with 2 vehicles (2,455, accounting for 37.0%) and females with 2 vehicles (2,130, making up 39.8%).
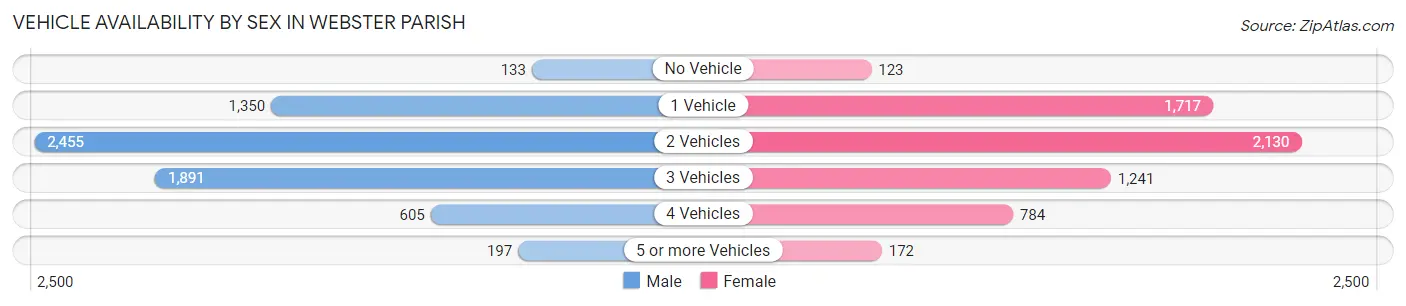
| Vehicles Available | Male | Female |
| No Vehicle | 133 (2.0%) | 123 (2.0%) |
| 1 Vehicle | 1,350 (20.4%) | 1,717 (27.8%) |
| 2 Vehicles | 2,455 (37.0%) | 2,130 (34.5%) |
| 3 Vehicles | 1,891 (28.5%) | 1,241 (20.1%) |
| 4 Vehicles | 605 (9.1%) | 784 (12.7%) |
| 5 or more Vehicles | 197 (3.0%) | 172 (2.8%) |
| Total | 6,631 (100.0%) | 6,167 (100.0%) |
Commute Time in Webster Parish
The most frequently occuring commute durations in Webster Parish are 10 to 14 minutes (2,672 commuters, 22.4%), 15 to 19 minutes (1,530 commuters, 12.8%), and 20 to 24 minutes (1,526 commuters, 12.8%).
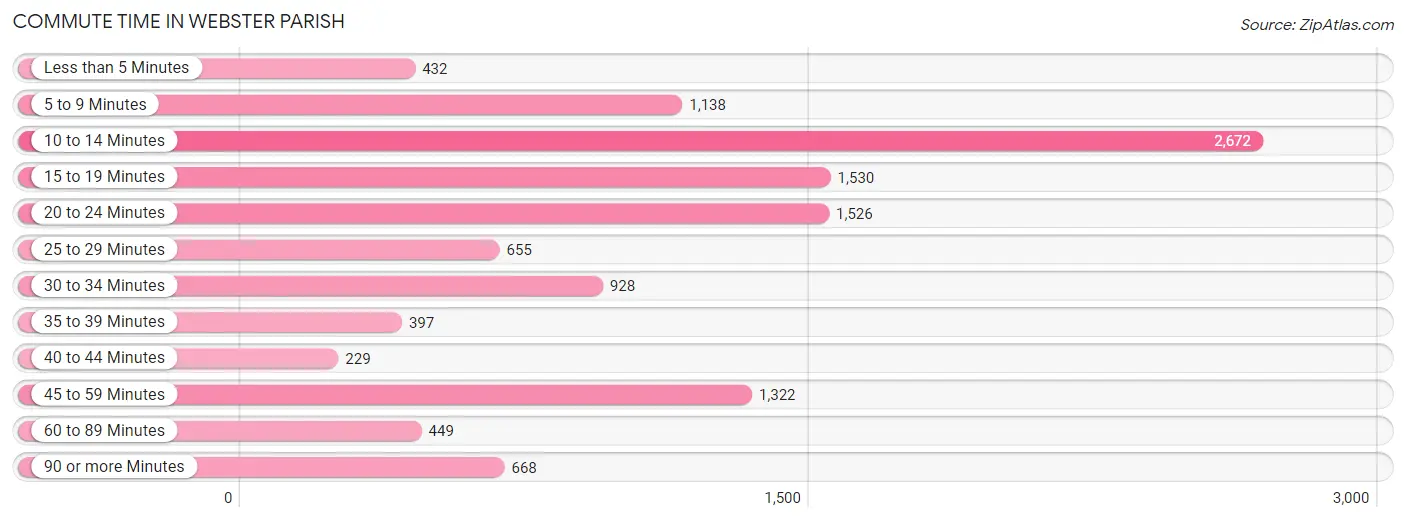
| Commute Time | # Commuters | % Commuters |
| Less than 5 Minutes | 432 | 3.6% |
| 5 to 9 Minutes | 1,138 | 9.5% |
| 10 to 14 Minutes | 2,672 | 22.4% |
| 15 to 19 Minutes | 1,530 | 12.8% |
| 20 to 24 Minutes | 1,526 | 12.8% |
| 25 to 29 Minutes | 655 | 5.5% |
| 30 to 34 Minutes | 928 | 7.8% |
| 35 to 39 Minutes | 397 | 3.3% |
| 40 to 44 Minutes | 229 | 1.9% |
| 45 to 59 Minutes | 1,322 | 11.1% |
| 60 to 89 Minutes | 449 | 3.8% |
| 90 or more Minutes | 668 | 5.6% |
Commute Time by Sex in Webster Parish
The most common commute times in Webster Parish are 10 to 14 minutes (1,182 commuters, 19.2%) for males and 10 to 14 minutes (1,490 commuters, 25.8%) for females.
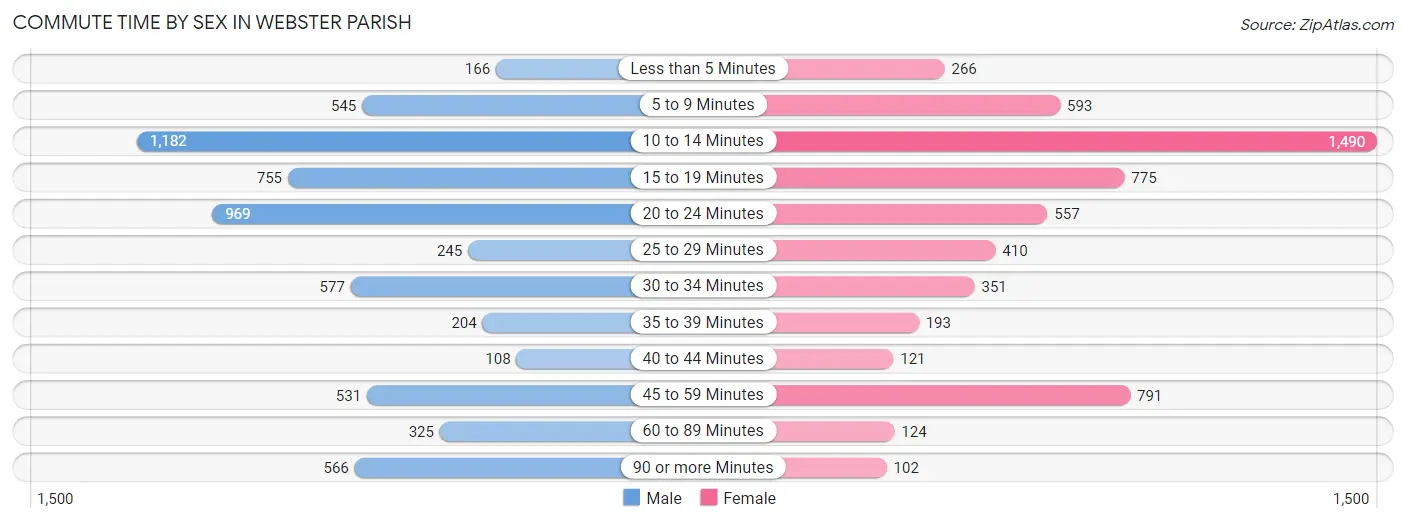
| Commute Time | Male | Female |
| Less than 5 Minutes | 166 (2.7%) | 266 (4.6%) |
| 5 to 9 Minutes | 545 (8.8%) | 593 (10.3%) |
| 10 to 14 Minutes | 1,182 (19.2%) | 1,490 (25.8%) |
| 15 to 19 Minutes | 755 (12.2%) | 775 (13.4%) |
| 20 to 24 Minutes | 969 (15.7%) | 557 (9.7%) |
| 25 to 29 Minutes | 245 (4.0%) | 410 (7.1%) |
| 30 to 34 Minutes | 577 (9.3%) | 351 (6.1%) |
| 35 to 39 Minutes | 204 (3.3%) | 193 (3.3%) |
| 40 to 44 Minutes | 108 (1.8%) | 121 (2.1%) |
| 45 to 59 Minutes | 531 (8.6%) | 791 (13.7%) |
| 60 to 89 Minutes | 325 (5.3%) | 124 (2.1%) |
| 90 or more Minutes | 566 (9.2%) | 102 (1.8%) |
Time of Departure to Work by Sex in Webster Parish
The most frequent times of departure to work in Webster Parish are 7:00 AM to 7:29 AM (1,773, 28.7%) for males and 7:00 AM to 7:29 AM (982, 17.0%) for females.
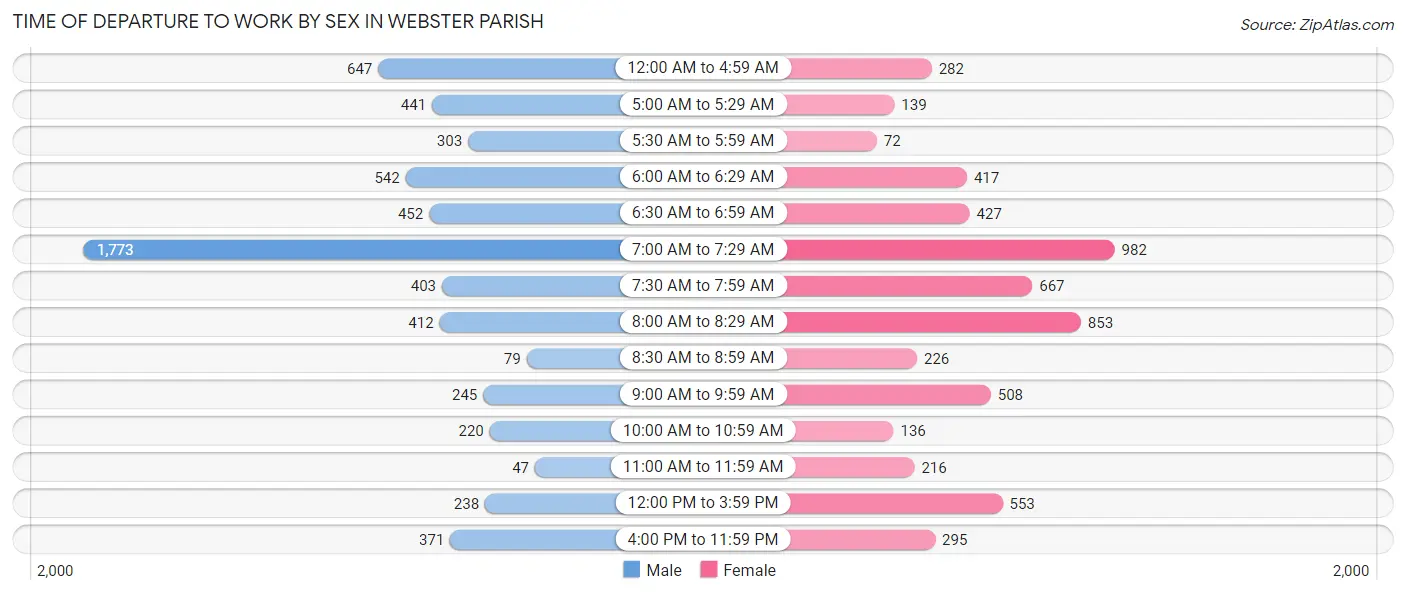
| Time of Departure | Male | Female |
| 12:00 AM to 4:59 AM | 647 (10.5%) | 282 (4.9%) |
| 5:00 AM to 5:29 AM | 441 (7.1%) | 139 (2.4%) |
| 5:30 AM to 5:59 AM | 303 (4.9%) | 72 (1.3%) |
| 6:00 AM to 6:29 AM | 542 (8.8%) | 417 (7.2%) |
| 6:30 AM to 6:59 AM | 452 (7.3%) | 427 (7.4%) |
| 7:00 AM to 7:29 AM | 1,773 (28.7%) | 982 (17.0%) |
| 7:30 AM to 7:59 AM | 403 (6.5%) | 667 (11.6%) |
| 8:00 AM to 8:29 AM | 412 (6.7%) | 853 (14.8%) |
| 8:30 AM to 8:59 AM | 79 (1.3%) | 226 (3.9%) |
| 9:00 AM to 9:59 AM | 245 (4.0%) | 508 (8.8%) |
| 10:00 AM to 10:59 AM | 220 (3.6%) | 136 (2.4%) |
| 11:00 AM to 11:59 AM | 47 (0.8%) | 216 (3.7%) |
| 12:00 PM to 3:59 PM | 238 (3.9%) | 553 (9.6%) |
| 4:00 PM to 11:59 PM | 371 (6.0%) | 295 (5.1%) |
| Total | 6,173 (100.0%) | 5,773 (100.0%) |
Housing Occupancy in Webster Parish
Occupancy by Ownership in Webster Parish
Of the total 14,801 dwellings in Webster Parish, owner-occupied units account for 9,926 (67.1%), while renter-occupied units make up 4,875 (32.9%).
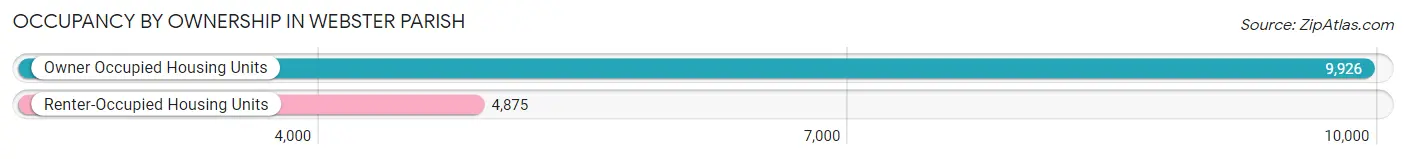
| Occupancy | # Housing Units | % Housing Units |
| Owner Occupied Housing Units | 9,926 | 67.1% |
| Renter-Occupied Housing Units | 4,875 | 32.9% |
| Total Occupied Housing Units | 14,801 | 100.0% |
Occupancy by Household Size in Webster Parish
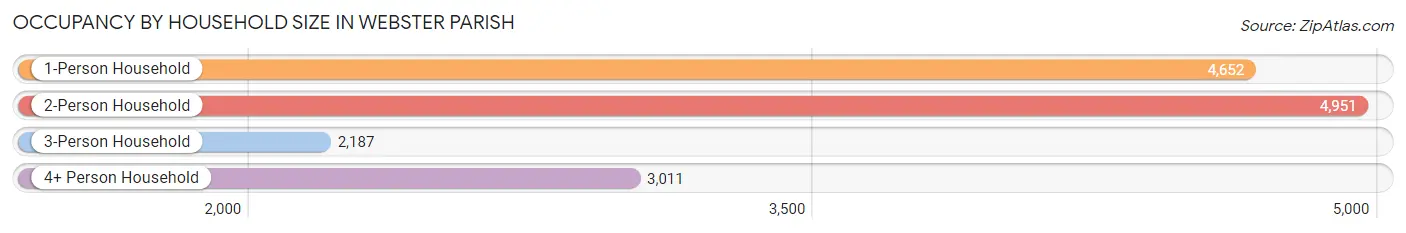
| Household Size | # Housing Units | % Housing Units |
| 1-Person Household | 4,652 | 31.4% |
| 2-Person Household | 4,951 | 33.5% |
| 3-Person Household | 2,187 | 14.8% |
| 4+ Person Household | 3,011 | 20.3% |
| Total Housing Units | 14,801 | 100.0% |
Occupancy by Ownership by Household Size in Webster Parish
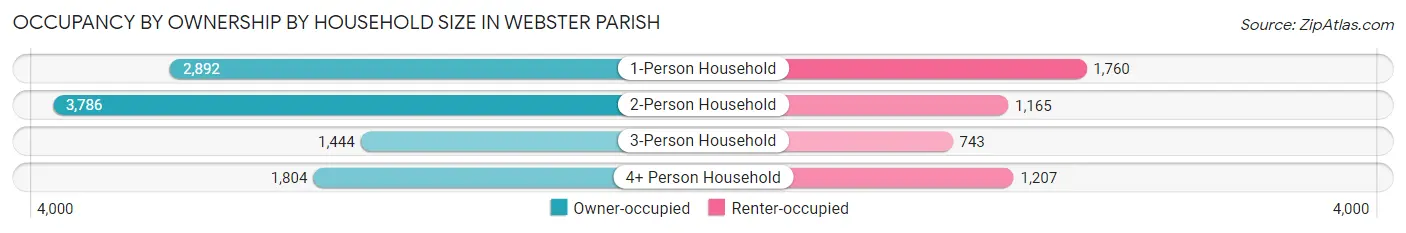
| Household Size | Owner-occupied | Renter-occupied |
| 1-Person Household | 2,892 (62.2%) | 1,760 (37.8%) |
| 2-Person Household | 3,786 (76.5%) | 1,165 (23.5%) |
| 3-Person Household | 1,444 (66.0%) | 743 (34.0%) |
| 4+ Person Household | 1,804 (59.9%) | 1,207 (40.1%) |
| Total Housing Units | 9,926 (67.1%) | 4,875 (32.9%) |
Occupancy by Educational Attainment in Webster Parish
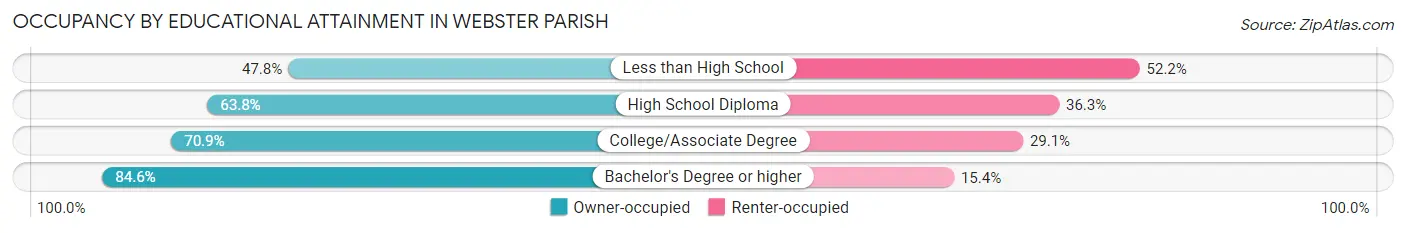
| Household Size | Owner-occupied | Renter-occupied |
| Less than High School | 933 (47.8%) | 1,020 (52.2%) |
| High School Diploma | 3,722 (63.7%) | 2,116 (36.2%) |
| College/Associate Degree | 3,408 (70.9%) | 1,399 (29.1%) |
| Bachelor's Degree or higher | 1,863 (84.6%) | 340 (15.4%) |
Occupancy by Age of Householder in Webster Parish
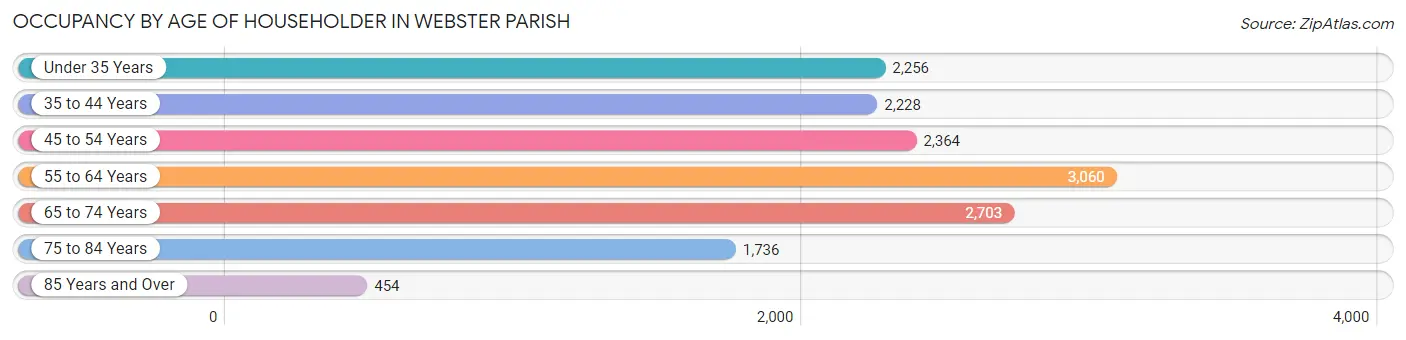
| Age Bracket | # Households | % Households |
| Under 35 Years | 2,256 | 15.2% |
| 35 to 44 Years | 2,228 | 15.0% |
| 45 to 54 Years | 2,364 | 16.0% |
| 55 to 64 Years | 3,060 | 20.7% |
| 65 to 74 Years | 2,703 | 18.3% |
| 75 to 84 Years | 1,736 | 11.7% |
| 85 Years and Over | 454 | 3.1% |
| Total | 14,801 | 100.0% |
Housing Finances in Webster Parish
Median Income by Occupancy in Webster Parish
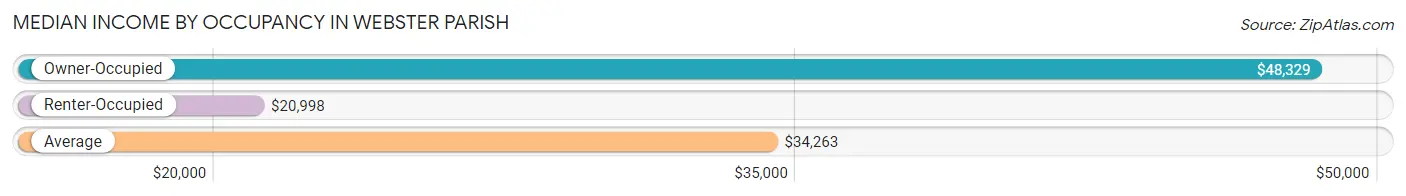
| Occupancy Type | # Households | Median Income |
| Owner-Occupied | 9,926 (67.1%) | $48,329 |
| Renter-Occupied | 4,875 (32.9%) | $20,998 |
| Average | 14,801 (100.0%) | $34,263 |
Occupancy by Householder Income Bracket in Webster Parish
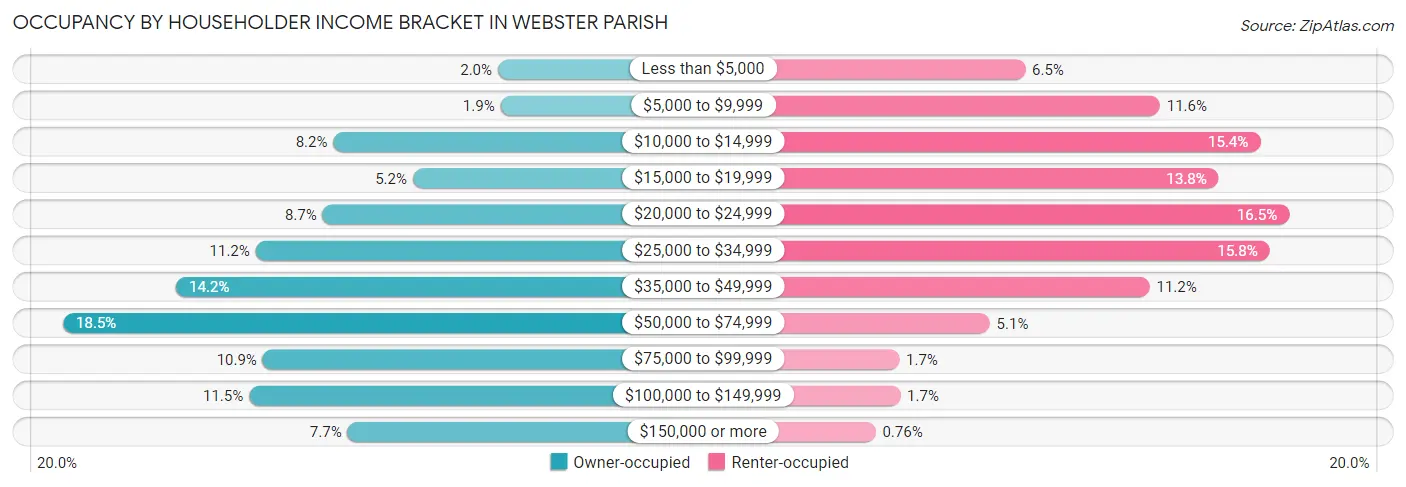
| Income Bracket | Owner-occupied | Renter-occupied |
| Less than $5,000 | 196 (2.0%) | 315 (6.5%) |
| $5,000 to $9,999 | 186 (1.9%) | 565 (11.6%) |
| $10,000 to $14,999 | 818 (8.2%) | 751 (15.4%) |
| $15,000 to $19,999 | 517 (5.2%) | 674 (13.8%) |
| $20,000 to $24,999 | 859 (8.6%) | 805 (16.5%) |
| $25,000 to $34,999 | 1,112 (11.2%) | 769 (15.8%) |
| $35,000 to $49,999 | 1,412 (14.2%) | 546 (11.2%) |
| $50,000 to $74,999 | 1,840 (18.5%) | 249 (5.1%) |
| $75,000 to $99,999 | 1,085 (10.9%) | 81 (1.7%) |
| $100,000 to $149,999 | 1,137 (11.5%) | 83 (1.7%) |
| $150,000 or more | 764 (7.7%) | 37 (0.8%) |
| Total | 9,926 (100.0%) | 4,875 (100.0%) |
Monthly Housing Cost Tiers in Webster Parish
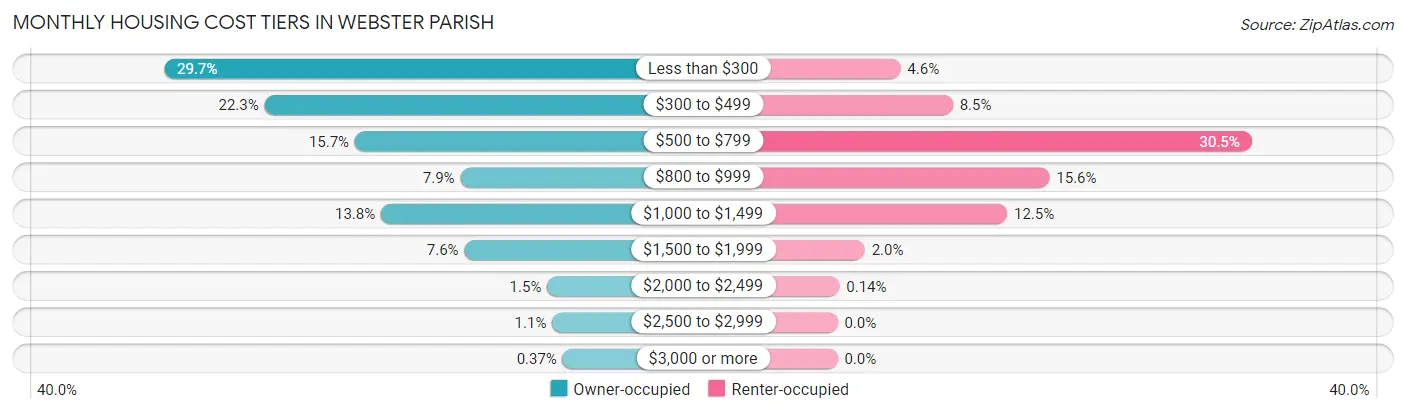
| Monthly Cost | Owner-occupied | Renter-occupied |
| Less than $300 | 2,951 (29.7%) | 226 (4.6%) |
| $300 to $499 | 2,216 (22.3%) | 414 (8.5%) |
| $500 to $799 | 1,555 (15.7%) | 1,487 (30.5%) |
| $800 to $999 | 784 (7.9%) | 761 (15.6%) |
| $1,000 to $1,499 | 1,365 (13.8%) | 609 (12.5%) |
| $1,500 to $1,999 | 755 (7.6%) | 98 (2.0%) |
| $2,000 to $2,499 | 150 (1.5%) | 7 (0.1%) |
| $2,500 to $2,999 | 113 (1.1%) | 0 (0.0%) |
| $3,000 or more | 37 (0.4%) | 0 (0.0%) |
| Total | 9,926 (100.0%) | 4,875 (100.0%) |
Physical Housing Characteristics in Webster Parish
Housing Structures in Webster Parish
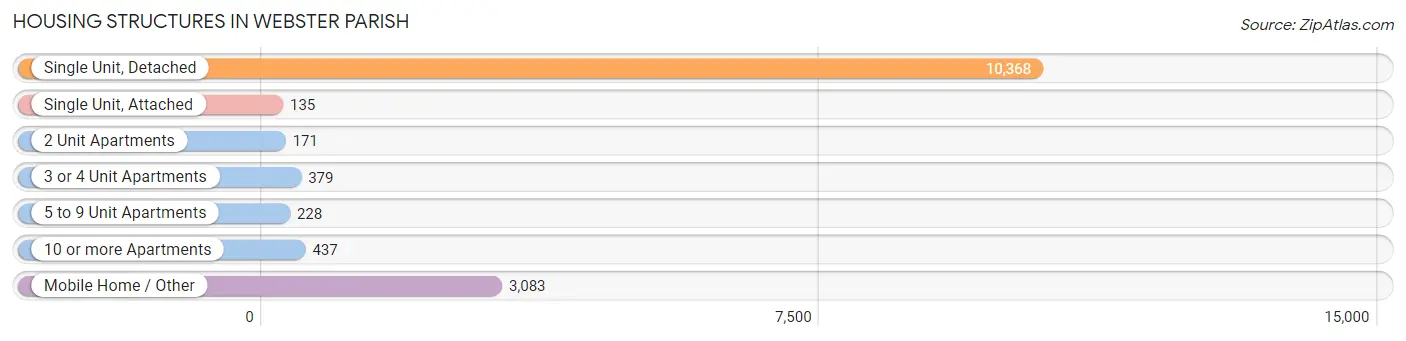
| Structure Type | # Housing Units | % Housing Units |
| Single Unit, Detached | 10,368 | 70.1% |
| Single Unit, Attached | 135 | 0.9% |
| 2 Unit Apartments | 171 | 1.2% |
| 3 or 4 Unit Apartments | 379 | 2.6% |
| 5 to 9 Unit Apartments | 228 | 1.5% |
| 10 or more Apartments | 437 | 2.9% |
| Mobile Home / Other | 3,083 | 20.8% |
| Total | 14,801 | 100.0% |
Housing Structures by Occupancy in Webster Parish
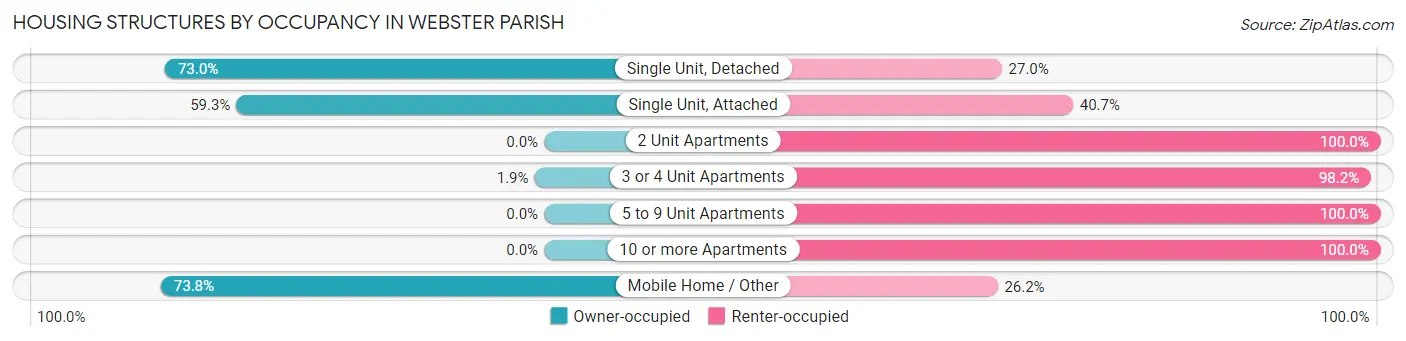
| Structure Type | Owner-occupied | Renter-occupied |
| Single Unit, Detached | 7,565 (73.0%) | 2,803 (27.0%) |
| Single Unit, Attached | 80 (59.3%) | 55 (40.7%) |
| 2 Unit Apartments | 0 (0.0%) | 171 (100.0%) |
| 3 or 4 Unit Apartments | 7 (1.8%) | 372 (98.2%) |
| 5 to 9 Unit Apartments | 0 (0.0%) | 228 (100.0%) |
| 10 or more Apartments | 0 (0.0%) | 437 (100.0%) |
| Mobile Home / Other | 2,274 (73.8%) | 809 (26.2%) |
| Total | 9,926 (67.1%) | 4,875 (32.9%) |
Housing Structures by Number of Rooms in Webster Parish
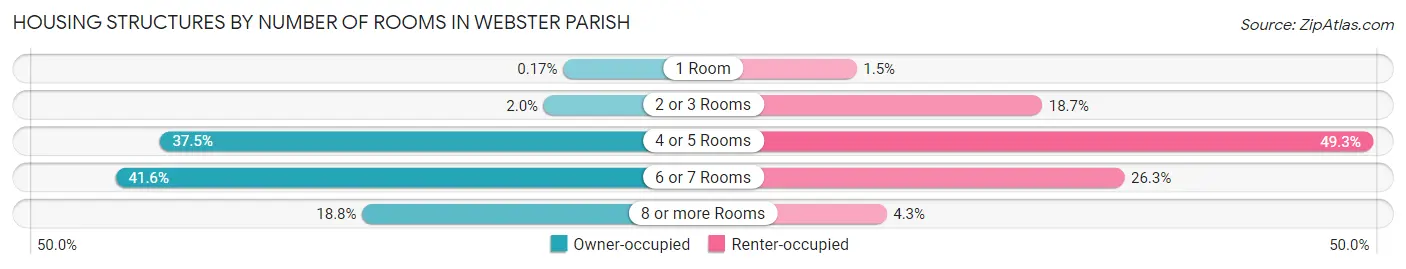
| Number of Rooms | Owner-occupied | Renter-occupied |
| 1 Room | 17 (0.2%) | 74 (1.5%) |
| 2 or 3 Rooms | 196 (2.0%) | 910 (18.7%) |
| 4 or 5 Rooms | 3,724 (37.5%) | 2,401 (49.2%) |
| 6 or 7 Rooms | 4,127 (41.6%) | 1,281 (26.3%) |
| 8 or more Rooms | 1,862 (18.8%) | 209 (4.3%) |
| Total | 9,926 (100.0%) | 4,875 (100.0%) |
Housing Structure by Heating Type in Webster Parish
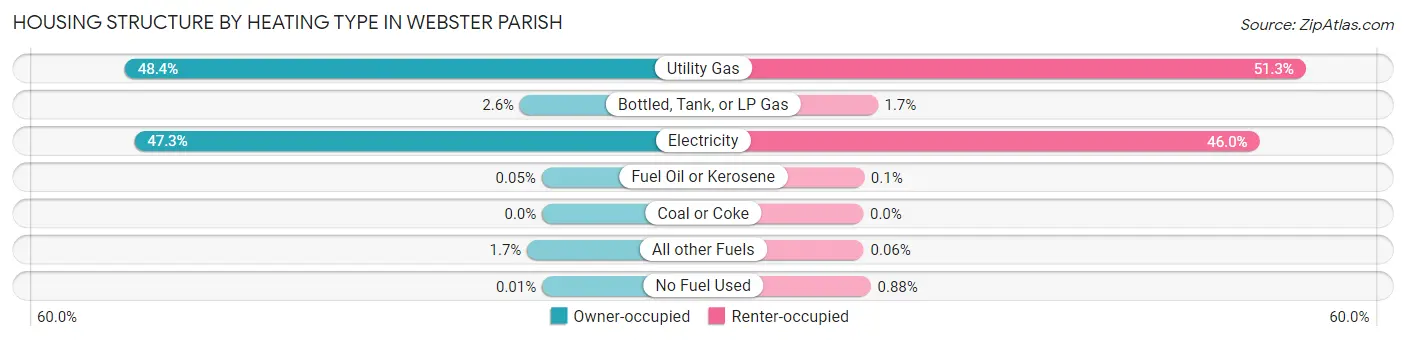
| Heating Type | Owner-occupied | Renter-occupied |
| Utility Gas | 4,801 (48.4%) | 2,502 (51.3%) |
| Bottled, Tank, or LP Gas | 255 (2.6%) | 82 (1.7%) |
| Electricity | 4,692 (47.3%) | 2,240 (46.0%) |
| Fuel Oil or Kerosene | 5 (0.1%) | 5 (0.1%) |
| Coal or Coke | 0 (0.0%) | 0 (0.0%) |
| All other Fuels | 172 (1.7%) | 3 (0.1%) |
| No Fuel Used | 1 (0.0%) | 43 (0.9%) |
| Total | 9,926 (100.0%) | 4,875 (100.0%) |
Household Vehicle Usage in Webster Parish
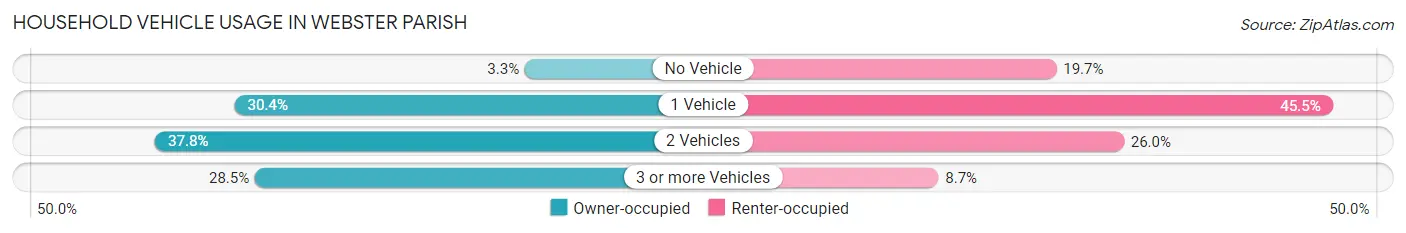
| Vehicles per Household | Owner-occupied | Renter-occupied |
| No Vehicle | 327 (3.3%) | 962 (19.7%) |
| 1 Vehicle | 3,018 (30.4%) | 2,219 (45.5%) |
| 2 Vehicles | 3,753 (37.8%) | 1,269 (26.0%) |
| 3 or more Vehicles | 2,828 (28.5%) | 425 (8.7%) |
| Total | 9,926 (100.0%) | 4,875 (100.0%) |
Real Estate & Mortgages in Webster Parish
Real Estate and Mortgage Overview in Webster Parish
| Characteristic | Without Mortgage | With Mortgage |
| Housing Units | 6,030 | 3,896 |
| Median Property Value | $85,900 | $139,600 |
| Median Household Income | $37,478 | $452 |
| Monthly Housing Costs | $305 | $29 |
| Real Estate Taxes | $258 | $1,405 |
Property Value by Mortgage Status in Webster Parish
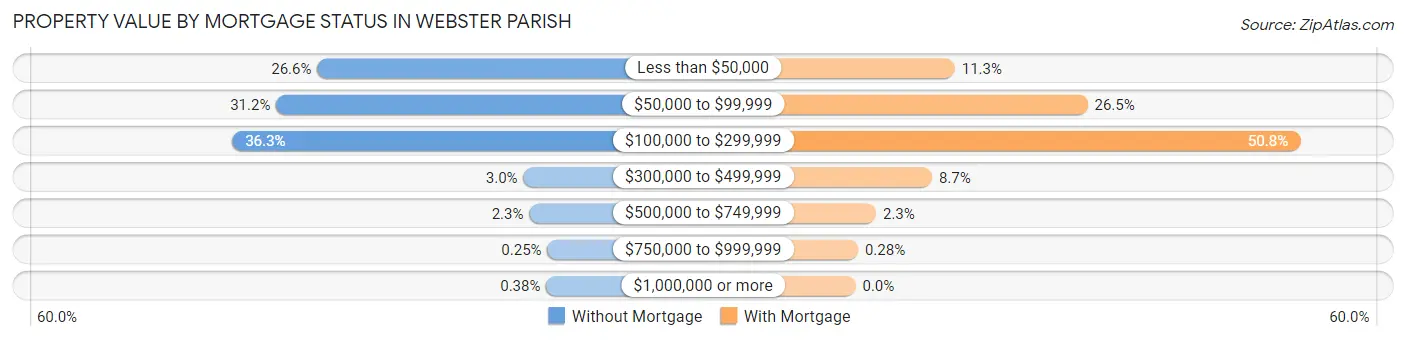
| Property Value | Without Mortgage | With Mortgage |
| Less than $50,000 | 1,601 (26.6%) | 442 (11.3%) |
| $50,000 to $99,999 | 1,884 (31.2%) | 1,033 (26.5%) |
| $100,000 to $299,999 | 2,187 (36.3%) | 1,979 (50.8%) |
| $300,000 to $499,999 | 180 (3.0%) | 340 (8.7%) |
| $500,000 to $749,999 | 140 (2.3%) | 91 (2.3%) |
| $750,000 to $999,999 | 15 (0.3%) | 11 (0.3%) |
| $1,000,000 or more | 23 (0.4%) | 0 (0.0%) |
| Total | 6,030 (100.0%) | 3,896 (100.0%) |
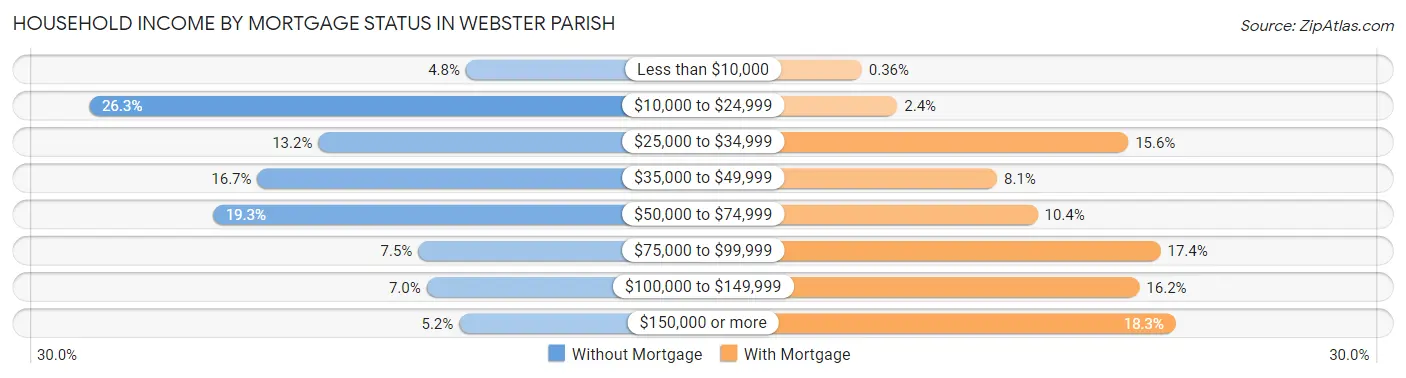
Household Income by Mortgage Status in Webster Parish
| Household Income | Without Mortgage | With Mortgage |
| Less than $10,000 | 289 (4.8%) | 14 (0.4%) |
| $10,000 to $24,999 | 1,587 (26.3%) | 93 (2.4%) |
| $25,000 to $34,999 | 797 (13.2%) | 607 (15.6%) |
| $35,000 to $49,999 | 1,007 (16.7%) | 315 (8.1%) |
| $50,000 to $74,999 | 1,161 (19.3%) | 405 (10.4%) |
| $75,000 to $99,999 | 453 (7.5%) | 679 (17.4%) |
| $100,000 to $149,999 | 424 (7.0%) | 632 (16.2%) |
| $150,000 or more | 312 (5.2%) | 713 (18.3%) |
| Total | 6,030 (100.0%) | 3,896 (100.0%) |
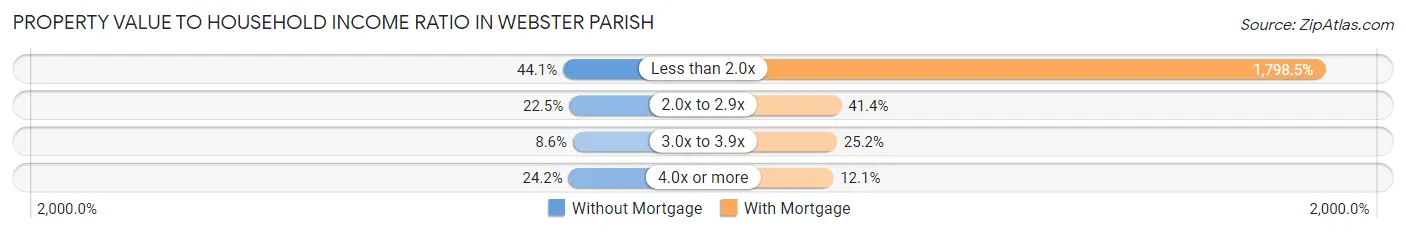
Property Value to Household Income Ratio in Webster Parish
| Value-to-Income Ratio | Without Mortgage | With Mortgage |
| Less than 2.0x | 2,661 (44.1%) | 70,068 (1,798.5%) |
| 2.0x to 2.9x | 1,357 (22.5%) | 1,613 (41.4%) |
| 3.0x to 3.9x | 518 (8.6%) | 980 (25.2%) |
| 4.0x or more | 1,456 (24.1%) | 472 (12.1%) |
| Total | 6,030 (100.0%) | 3,896 (100.0%) |
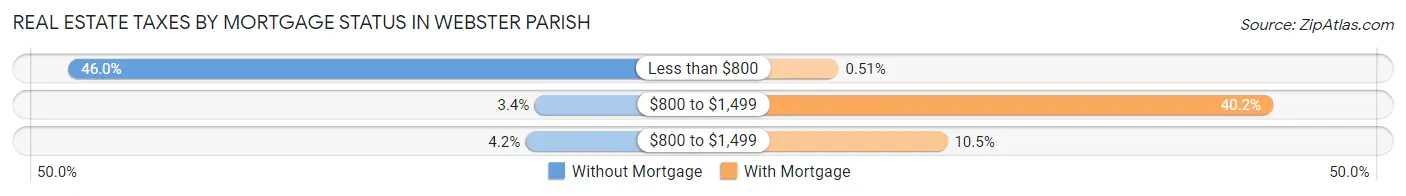
Real Estate Taxes by Mortgage Status in Webster Parish
| Property Taxes | Without Mortgage | With Mortgage |
| Less than $800 | 2,774 (46.0%) | 20 (0.5%) |
| $800 to $1,499 | 204 (3.4%) | 1,565 (40.2%) |
| $800 to $1,499 | 254 (4.2%) | 407 (10.4%) |
| Total | 6,030 (100.0%) | 3,896 (100.0%) |
Health & Disability in Webster Parish
Health Insurance Coverage by Age in Webster Parish
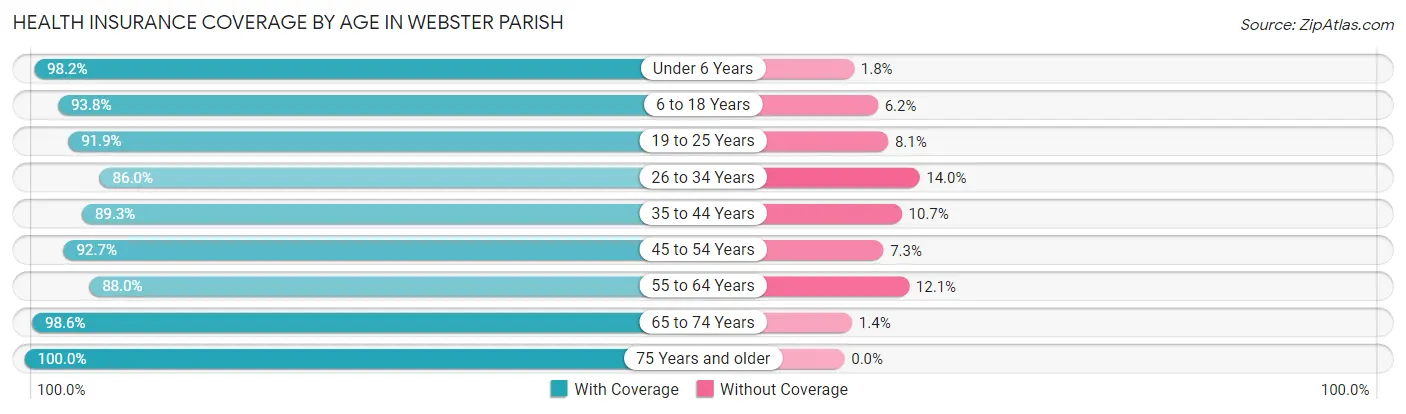
| Age Bracket | With Coverage | Without Coverage |
| Under 6 Years | 2,421 (98.2%) | 44 (1.8%) |
| 6 to 18 Years | 5,794 (93.8%) | 385 (6.2%) |
| 19 to 25 Years | 2,696 (91.9%) | 239 (8.1%) |
| 26 to 34 Years | 3,153 (86.0%) | 513 (14.0%) |
| 35 to 44 Years | 3,575 (89.3%) | 428 (10.7%) |
| 45 to 54 Years | 4,038 (92.7%) | 316 (7.3%) |
| 55 to 64 Years | 4,503 (87.9%) | 617 (12.0%) |
| 65 to 74 Years | 4,082 (98.6%) | 59 (1.4%) |
| 75 Years and older | 3,018 (100.0%) | 0 (0.0%) |
| Total | 33,280 (92.7%) | 2,601 (7.2%) |
Health Insurance Coverage by Citizenship Status in Webster Parish
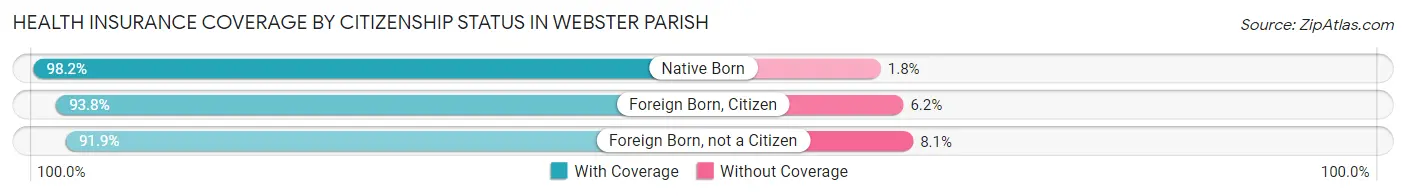
| Citizenship Status | With Coverage | Without Coverage |
| Native Born | 2,421 (98.2%) | 44 (1.8%) |
| Foreign Born, Citizen | 5,794 (93.8%) | 385 (6.2%) |
| Foreign Born, not a Citizen | 2,696 (91.9%) | 239 (8.1%) |
Health Insurance Coverage by Household Income in Webster Parish
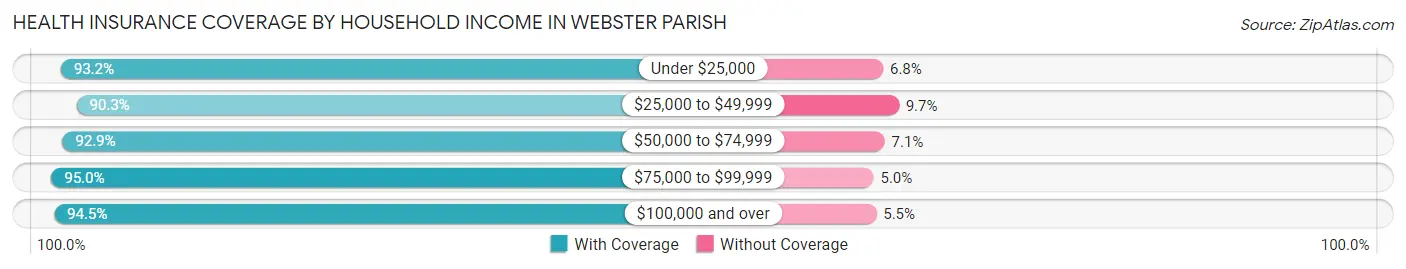
| Household Income | With Coverage | Without Coverage |
| Under $25,000 | 9,840 (93.2%) | 717 (6.8%) |
| $25,000 to $49,999 | 8,972 (90.3%) | 966 (9.7%) |
| $50,000 to $74,999 | 4,971 (92.9%) | 379 (7.1%) |
| $75,000 to $99,999 | 3,296 (95.0%) | 174 (5.0%) |
| $100,000 and over | 6,071 (94.5%) | 355 (5.5%) |
Public vs Private Health Insurance Coverage by Age in Webster Parish
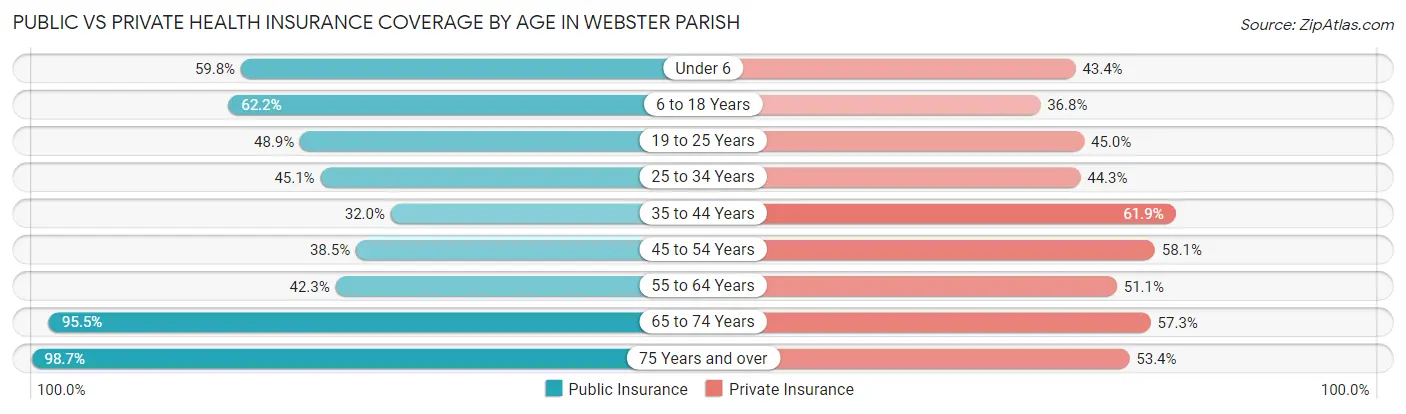
| Age Bracket | Public Insurance | Private Insurance |
| Under 6 | 1,475 (59.8%) | 1,069 (43.4%) |
| 6 to 18 Years | 3,843 (62.2%) | 2,276 (36.8%) |
| 19 to 25 Years | 1,434 (48.9%) | 1,320 (45.0%) |
| 25 to 34 Years | 1,653 (45.1%) | 1,623 (44.3%) |
| 35 to 44 Years | 1,282 (32.0%) | 2,479 (61.9%) |
| 45 to 54 Years | 1,676 (38.5%) | 2,530 (58.1%) |
| 55 to 64 Years | 2,165 (42.3%) | 2,614 (51.0%) |
| 65 to 74 Years | 3,954 (95.5%) | 2,374 (57.3%) |
| 75 Years and over | 2,979 (98.7%) | 1,611 (53.4%) |
| Total | 20,461 (57.0%) | 17,896 (49.9%) |
Disability Status by Sex by Age in Webster Parish
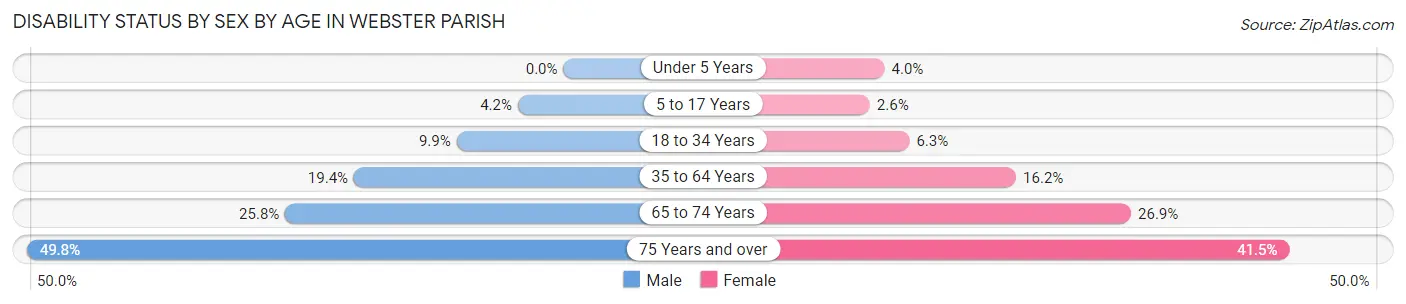
| Age Bracket | Male | Female |
| Under 5 Years | 0 (0.0%) | 41 (4.0%) |
| 5 to 17 Years | 148 (4.2%) | 72 (2.6%) |
| 18 to 34 Years | 329 (9.9%) | 222 (6.3%) |
| 35 to 64 Years | 1,235 (19.4%) | 1,153 (16.2%) |
| 65 to 74 Years | 498 (25.8%) | 594 (26.9%) |
| 75 Years and over | 600 (49.8%) | 753 (41.5%) |
Disability Class by Sex by Age in Webster Parish
Disability Class: Hearing Difficulty
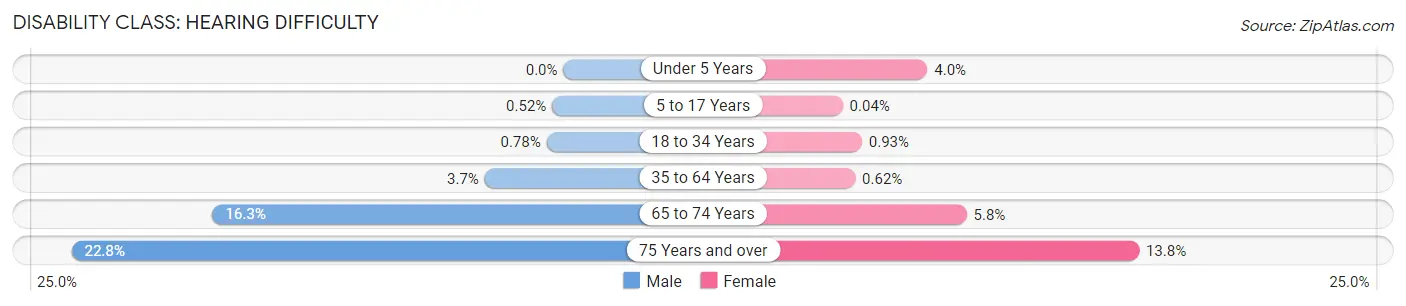
| Age Bracket | Male | Female |
| Under 5 Years | 0 (0.0%) | 41 (4.0%) |
| 5 to 17 Years | 18 (0.5%) | 1 (0.0%) |
| 18 to 34 Years | 26 (0.8%) | 33 (0.9%) |
| 35 to 64 Years | 232 (3.6%) | 44 (0.6%) |
| 65 to 74 Years | 314 (16.3%) | 128 (5.8%) |
| 75 Years and over | 275 (22.8%) | 250 (13.8%) |
Disability Class: Vision Difficulty
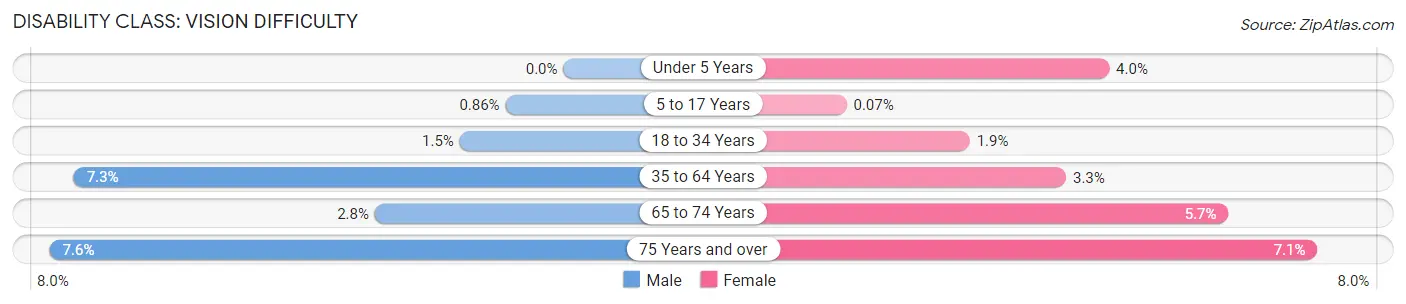
| Age Bracket | Male | Female |
| Under 5 Years | 0 (0.0%) | 41 (4.0%) |
| 5 to 17 Years | 30 (0.9%) | 2 (0.1%) |
| 18 to 34 Years | 51 (1.5%) | 67 (1.9%) |
| 35 to 64 Years | 462 (7.3%) | 237 (3.3%) |
| 65 to 74 Years | 54 (2.8%) | 127 (5.7%) |
| 75 Years and over | 92 (7.6%) | 128 (7.1%) |
Disability Class: Cognitive Difficulty
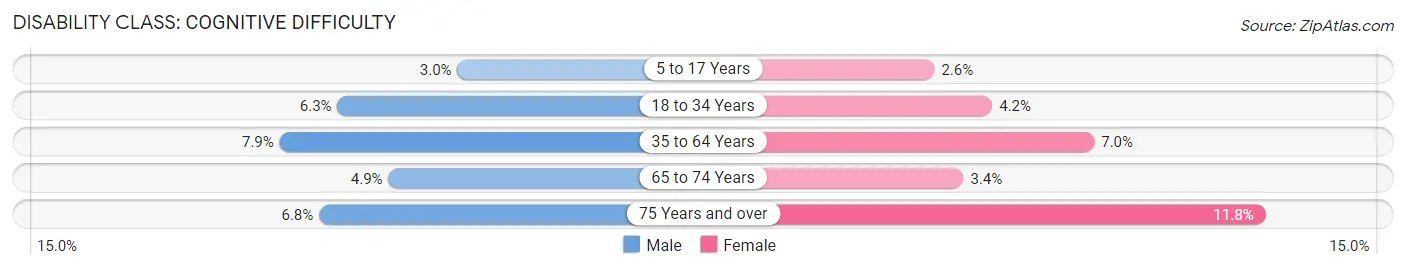
| Age Bracket | Male | Female |
| 5 to 17 Years | 103 (2.9%) | 71 (2.6%) |
| 18 to 34 Years | 209 (6.3%) | 148 (4.2%) |
| 35 to 64 Years | 502 (7.9%) | 501 (7.0%) |
| 65 to 74 Years | 94 (4.9%) | 75 (3.4%) |
| 75 Years and over | 82 (6.8%) | 214 (11.8%) |
Disability Class: Ambulatory Difficulty
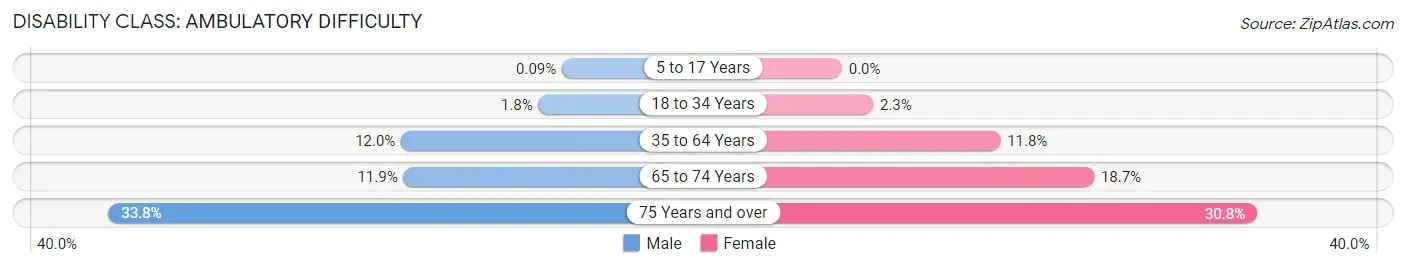
| Age Bracket | Male | Female |
| 5 to 17 Years | 3 (0.1%) | 0 (0.0%) |
| 18 to 34 Years | 61 (1.8%) | 82 (2.3%) |
| 35 to 64 Years | 765 (12.0%) | 838 (11.8%) |
| 65 to 74 Years | 229 (11.9%) | 414 (18.7%) |
| 75 Years and over | 407 (33.8%) | 559 (30.8%) |
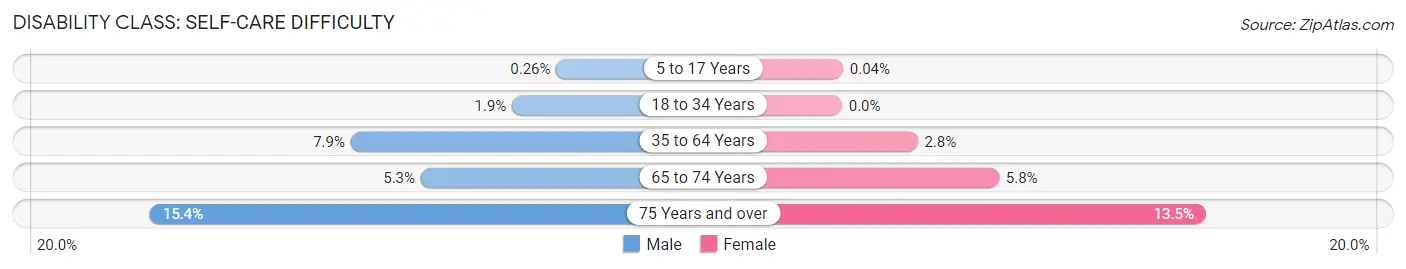
Disability Class: Self-Care Difficulty
| Age Bracket | Male | Female |
| 5 to 17 Years | 9 (0.3%) | 1 (0.0%) |
| 18 to 34 Years | 63 (1.9%) | 0 (0.0%) |
| 35 to 64 Years | 501 (7.9%) | 200 (2.8%) |
| 65 to 74 Years | 102 (5.3%) | 129 (5.8%) |
| 75 Years and over | 185 (15.3%) | 245 (13.5%) |
Technology Access in Webster Parish
Computing Device Access in Webster Parish
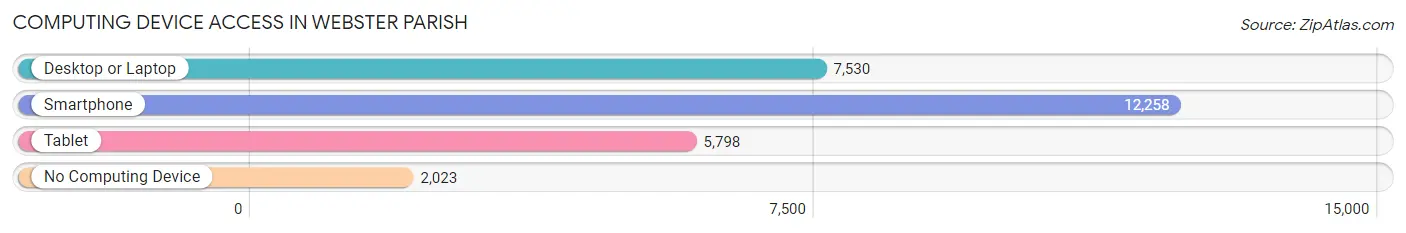
| Device Type | # Households | % Households |
| Desktop or Laptop | 7,530 | 50.9% |
| Smartphone | 12,258 | 82.8% |
| Tablet | 5,798 | 39.2% |
| No Computing Device | 2,023 | 13.7% |
| Total | 14,801 | 100.0% |
Internet Access in Webster Parish
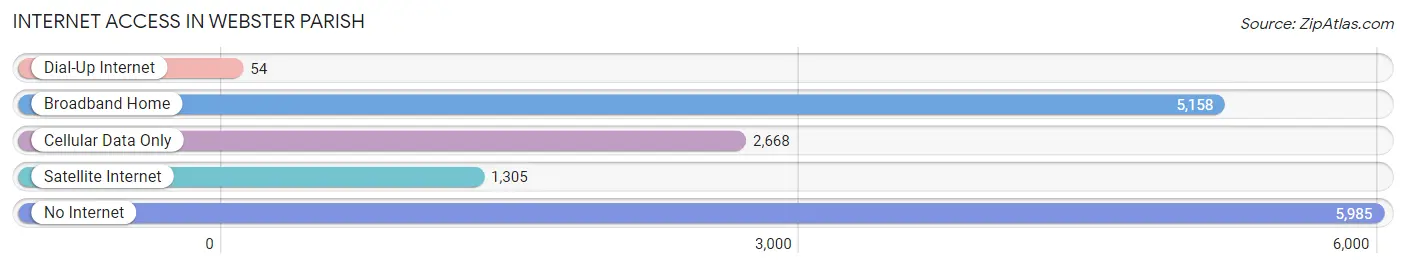
| Internet Type | # Households | % Households |
| Dial-Up Internet | 54 | 0.4% |
| Broadband Home | 5,158 | 34.8% |
| Cellular Data Only | 2,668 | 18.0% |
| Satellite Internet | 1,305 | 8.8% |
| No Internet | 5,985 | 40.4% |
| Total | 14,801 | 100.0% |
Webster Parish Summary
Webster Parish is located in the northwestern corner of Louisiana and is part of the Ark-La-Tex region. It is bordered by Bienville Parish to the north, Bossier Parish to the east, Claiborne Parish to the south, and Red River Parish to the west. The parish seat is Minden, and the largest city is Springhill. The parish has a total area of 602 square miles and a population of 41,207 as of the 2010 census.
History
Webster Parish was created in 1871 from parts of Bienville and Claiborne parishes. It was named for Daniel Webster, a prominent American statesman and senator from Massachusetts. The parish was originally home to the Caddo Indians, who were later displaced by European settlers. The first European settlers in the area were French and Spanish, who established trading posts and plantations in the area.
In the early 19th century, the area was part of the Neutral Strip, a disputed area between the United States and Spain. The Neutral Strip was eventually ceded to the United States in 1819, and the area became part of the Louisiana Purchase in 1803.
In the late 19th century, the area was home to a large number of Confederate veterans, who settled in the area after the Civil War. The veterans established a number of small towns, including Minden, which was named after the town of Minden in Germany.
Geography
Webster Parish is located in the northwestern corner of Louisiana and is part of the Ark-La-Tex region. It is bordered by Bienville Parish to the north, Bossier Parish to the east, Claiborne Parish to the south, and Red River Parish to the west. The parish has a total area of 602 square miles and a population of 41,207 as of the 2010 census.
The terrain of Webster Parish is mostly flat, with some rolling hills in the northern and western parts of the parish. The parish is drained by the Red River, which forms its western boundary. The parish is also home to several small lakes, including Lake Bistineau and Lake Claiborne.
Economy
The economy of Webster Parish is largely based on agriculture and forestry. The parish is home to a number of large farms, which produce cotton, soybeans, corn, and other crops. The timber industry is also an important part of the local economy, with the parish producing a variety of hardwoods, including oak, hickory, and cypress.
The parish is also home to a number of manufacturing and industrial businesses, including a paper mill, a chemical plant, and a steel mill. The parish is also home to a number of oil and gas production facilities.
Demographics
As of the 2010 census, Webster Parish had a population of 41,207. The racial makeup of the parish was 79.3% White, 17.7% African American, 0.5% Native American, 0.3% Asian, 0.1% Pacific Islander, 1.2% from other races, and 1.1% from two or more races. Hispanic or Latino of any race were 3.2% of the population.
The median income for a household in the parish was $35,945, and the median income for a family was $44,845. The per capita income for the parish was $18,945. About 17.2% of families and 21.2% of the population were below the poverty line, including 28.2% of those under age 18 and 16.2% of those age 65 or over.
Common Questions
What is the Total Population of Webster Parish?
Total Population of Webster Parish is 36,761.
What is the Total Male Population of Webster Parish?
Total Male Population of Webster Parish is 18,033.
What is the Total Female Population of Webster Parish?
Total Female Population of Webster Parish is 18,728.
What is the Ratio of Males per 100 Females in Webster Parish?
There are 96.29 Males per 100 Females in Webster Parish.
What is the Ratio of Females per 100 Males in Webster Parish?
There are 103.85 Females per 100 Males in Webster Parish.
What is the Median Population Age in Webster Parish?
Median Population Age in Webster Parish is 41.5 Years.
What is the Average Family Size in Webster Parish
Average Family Size in Webster Parish is 3.1 People.
What is the Average Household Size in Webster Parish
Average Household Size in Webster Parish is 2.4 People.
What is Per Capita Income in Webster Parish?
Per Capita income in Webster Parish is $22,706.
What is the Median Family Income in Webster Parish?
Median Family Income in Webster Parish is $45,302.
What is the Median Household income in Webster Parish?
Median Household Income in Webster Parish is $34,263.
What is Income or Wage Gap in Webster Parish?
Income or Wage Gap in Webster Parish is 22.8%.
Women in Webster Parish earn 77.2 cents for every dollar earned by a man.
What is Family Income Deficit in Webster Parish?
Family Income Deficit in Webster Parish is $8,975.
Families that are below poverty line in Webster Parish earn $8,975 less on average than the poverty threshold level.
What is Inequality or Gini Index in Webster Parish?
Inequality or Gini Index in Webster Parish is 0.50.
How Large is the Labor Force in Webster Parish?
There are 13,772 People in the Labor Forcein in Webster Parish.
What is the Percentage of People in the Labor Force in Webster Parish?
46.7% of People are in the Labor Force in Webster Parish.
What is the Unemployment Rate in Webster Parish?
Unemployment Rate in Webster Parish is 5.3%.