Washington Parish, LA
Washington Parish Map
Washington Parish Overview
45,514
TOTAL POPULATION
22,961
MALE POPULATION
22,553
FEMALE POPULATION
101.81
MALES / 100 FEMALES
98.22
FEMALES / 100 MALES
40.6
MEDIAN AGE
3.2
AVG FAMILY SIZE
2.5
AVG HOUSEHOLD SIZE
$24,287
PER CAPITA INCOME
$54,649
AVG FAMILY INCOME
$41,803
AVG HOUSEHOLD INCOME
32.6%
WAGE / INCOME GAP [ % ]
67.4¢/ $1
WAGE / INCOME GAP [ $ ]
$8,246
FAMILY INCOME DEFICIT
0.48
INEQUALITY / GINI INDEX
18,750
LABOR FORCE [ PEOPLE ]
51.7%
PERCENT IN LABOR FORCE
10.5%
UNEMPLOYMENT RATE
Washington Parish Area Codes
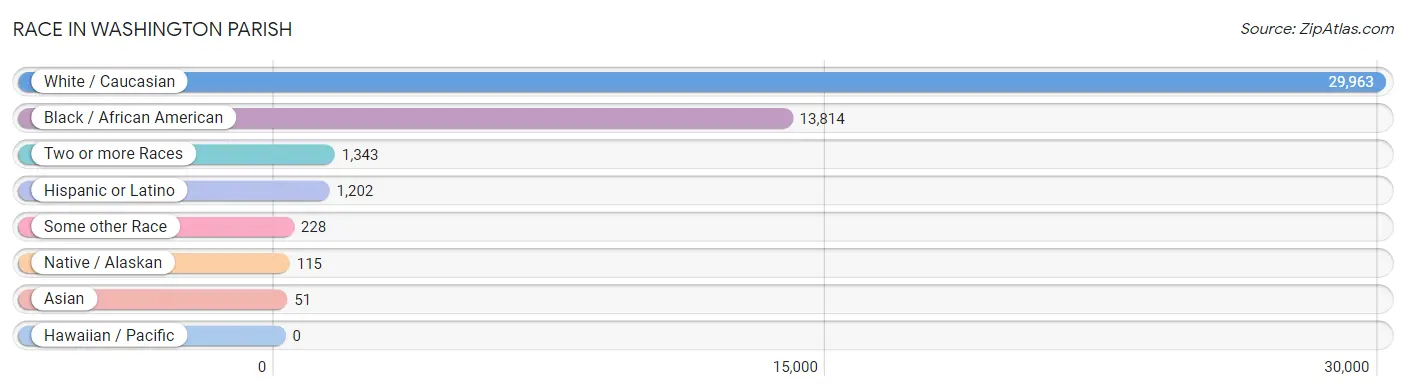
Race in Washington Parish
The most populous races in Washington Parish are White / Caucasian (29,963 | 65.8%), Black / African American (13,814 | 30.3%), and Two or more Races (1,343 | 2.9%).
| Race | # Population | % Population |
| Asian | 51 | 0.1% |
| Black / African American | 13,814 | 30.3% |
| Hawaiian / Pacific | 0 | 0.0% |
| Hispanic or Latino | 1,202 | 2.6% |
| Native / Alaskan | 115 | 0.3% |
| White / Caucasian | 29,963 | 65.8% |
| Two or more Races | 1,343 | 2.9% |
| Some other Race | 228 | 0.5% |
| Total | 45,514 | 100.0% |
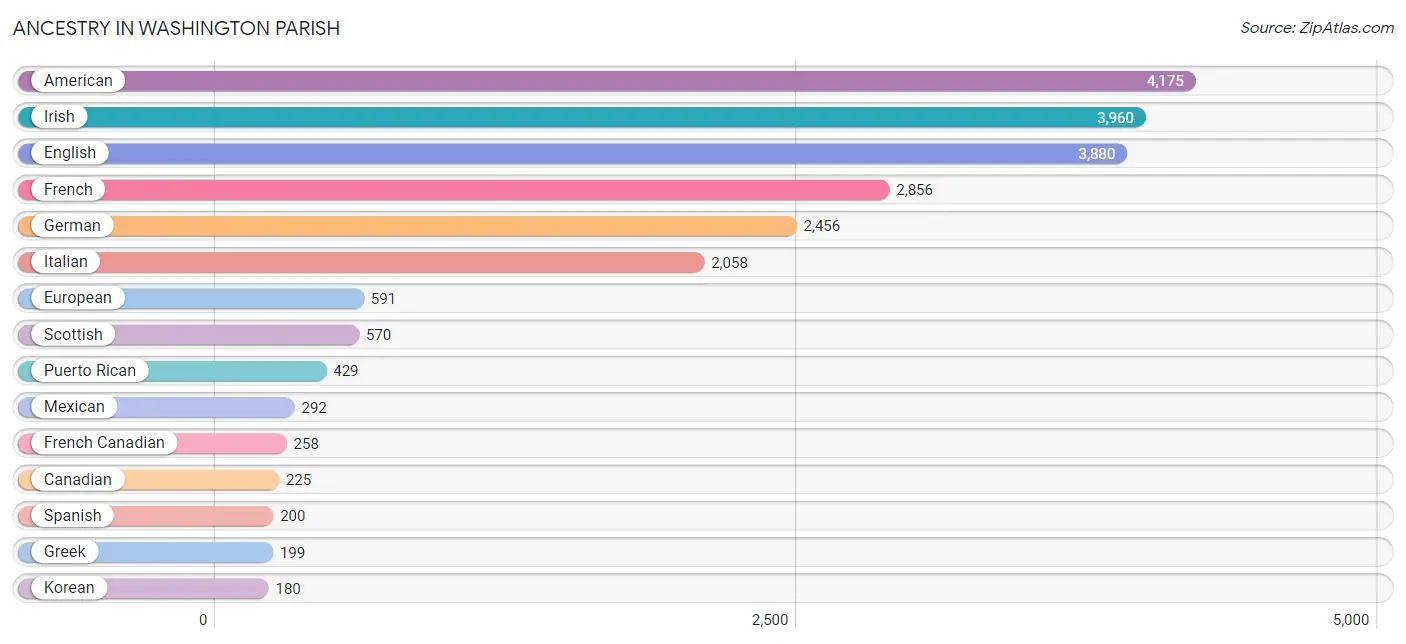
Ancestry in Washington Parish
The most populous ancestries reported in Washington Parish are American (4,175 | 9.2%), Irish (3,960 | 8.7%), English (3,880 | 8.5%), French (2,856 | 6.3%), and German (2,456 | 5.4%), together accounting for 38.1% of all Washington Parish residents.
| Ancestry | # Population | % Population |
| African | 86 | 0.2% |
| American | 4,175 | 9.2% |
| Apache | 22 | 0.1% |
| Arab | 16 | 0.0% |
| Austrian | 17 | 0.0% |
| Bahamian | 2 | 0.0% |
| Blackfeet | 13 | 0.0% |
| British | 173 | 0.4% |
| Burmese | 19 | 0.0% |
| Cajun | 103 | 0.2% |
| Canadian | 225 | 0.5% |
| Central American | 142 | 0.3% |
| Central American Indian | 6 | 0.0% |
| Cherokee | 99 | 0.2% |
| Cheyenne | 19 | 0.0% |
| Chippewa | 4 | 0.0% |
| Choctaw | 36 | 0.1% |
| Czech | 42 | 0.1% |
| Dutch | 50 | 0.1% |
| Eastern European | 11 | 0.0% |
| English | 3,880 | 8.5% |
| European | 591 | 1.3% |
| Finnish | 11 | 0.0% |
| French | 2,856 | 6.3% |
| French Canadian | 258 | 0.6% |
| German | 2,456 | 5.4% |
| Greek | 199 | 0.4% |
| Haitian | 14 | 0.0% |
| Honduran | 9 | 0.0% |
| Houma | 24 | 0.1% |
| Hungarian | 7 | 0.0% |
| Indian (Asian) | 16 | 0.0% |
| Iranian | 5 | 0.0% |
| Irish | 3,960 | 8.7% |
| Italian | 2,058 | 4.5% |
| Korean | 180 | 0.4% |
| Lebanese | 12 | 0.0% |
| Mexican | 292 | 0.6% |
| Moroccan | 4 | 0.0% |
| Native Hawaiian | 20 | 0.0% |
| Nicaraguan | 22 | 0.1% |
| Northern European | 31 | 0.1% |
| Norwegian | 52 | 0.1% |
| Polish | 48 | 0.1% |
| Portuguese | 26 | 0.1% |
| Puerto Rican | 429 | 0.9% |
| Salvadoran | 87 | 0.2% |
| Scotch-Irish | 137 | 0.3% |
| Scottish | 570 | 1.3% |
| Sioux | 3 | 0.0% |
| Spaniard | 132 | 0.3% |
| Spanish | 200 | 0.4% |
| Sri Lankan | 9 | 0.0% |
| Subsaharan African | 86 | 0.2% |
| Swedish | 12 | 0.0% |
| Swiss | 8 | 0.0% |
| Ukrainian | 12 | 0.0% |
| Welsh | 51 | 0.1% | View All 58 Rows |
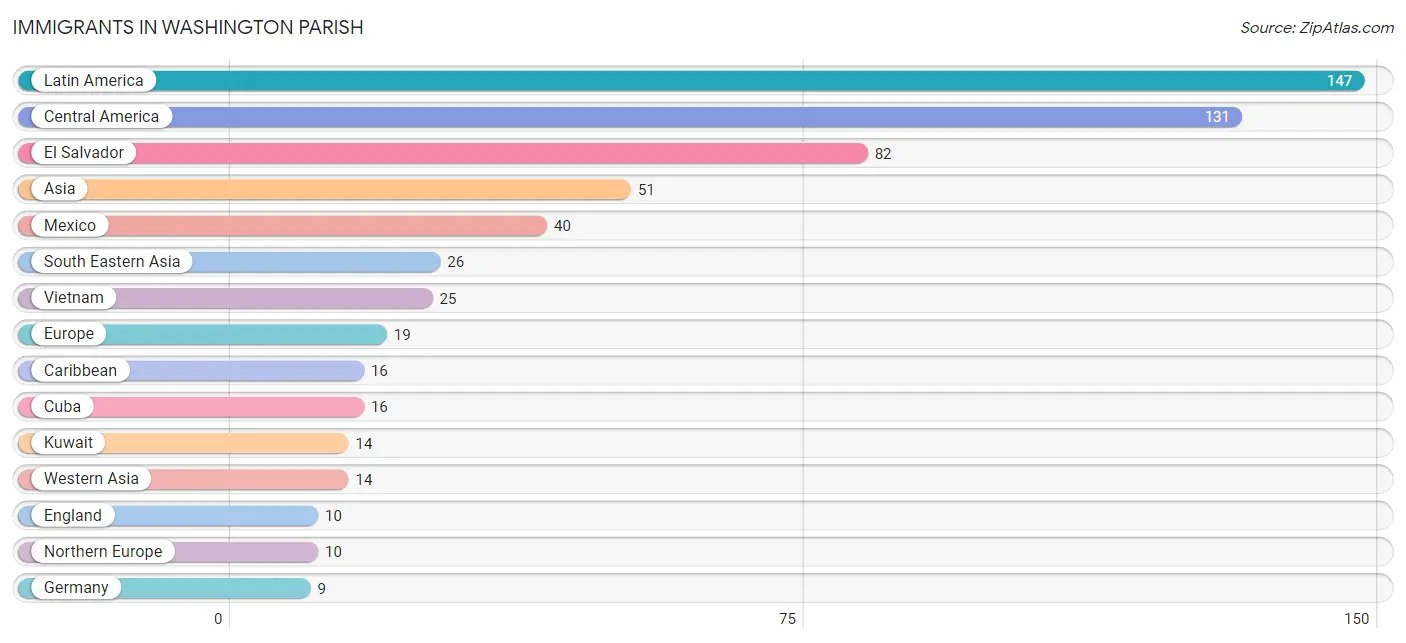
Immigrants in Washington Parish
The most numerous immigrant groups reported in Washington Parish came from Latin America (147 | 0.3%), Central America (131 | 0.3%), El Salvador (82 | 0.2%), Asia (51 | 0.1%), and Mexico (40 | 0.1%), together accounting for 1.0% of all Washington Parish residents.
| Immigration Origin | # Population | % Population |
| Asia | 51 | 0.1% |
| Canada | 6 | 0.0% |
| Caribbean | 16 | 0.0% |
| Central America | 131 | 0.3% |
| China | 6 | 0.0% |
| Cuba | 16 | 0.0% |
| Eastern Asia | 6 | 0.0% |
| El Salvador | 82 | 0.2% |
| England | 10 | 0.0% |
| Europe | 19 | 0.0% |
| Germany | 9 | 0.0% |
| Honduras | 9 | 0.0% |
| Iran | 5 | 0.0% |
| Kuwait | 14 | 0.0% |
| Latin America | 147 | 0.3% |
| Mexico | 40 | 0.1% |
| Northern Europe | 10 | 0.0% |
| Philippines | 1 | 0.0% |
| South Central Asia | 5 | 0.0% |
| South Eastern Asia | 26 | 0.1% |
| Vietnam | 25 | 0.1% |
| Western Asia | 14 | 0.0% |
| Western Europe | 9 | 0.0% | View All 23 Rows |
Sex and Age in Washington Parish
Sex and Age in Washington Parish
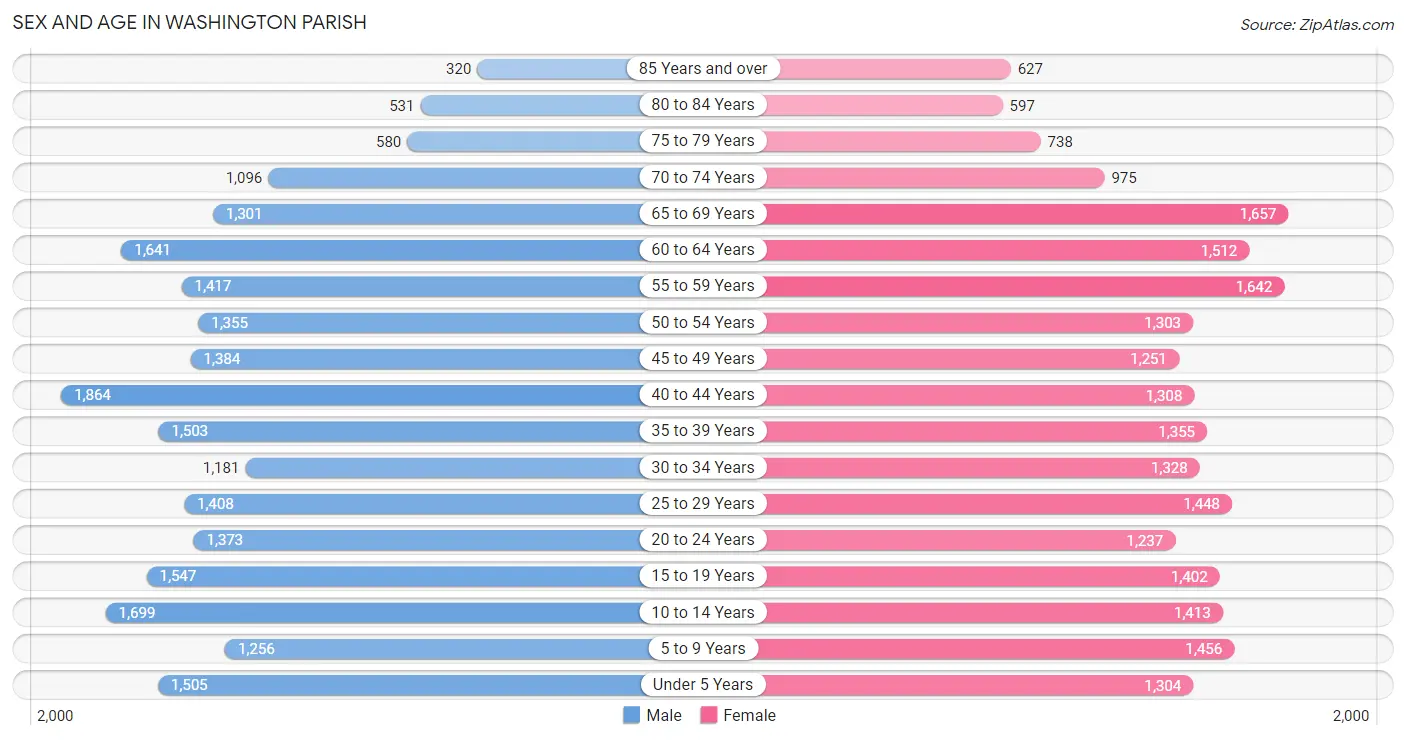
The most populous age groups in Washington Parish are 40 to 44 Years (1,864 | 8.1%) for men and 65 to 69 Years (1,657 | 7.3%) for women.
| Age Bracket | Male | Female |
| Under 5 Years | 1,505 (6.6%) | 1,304 (5.8%) |
| 5 to 9 Years | 1,256 (5.5%) | 1,456 (6.5%) |
| 10 to 14 Years | 1,699 (7.4%) | 1,413 (6.3%) |
| 15 to 19 Years | 1,547 (6.7%) | 1,402 (6.2%) |
| 20 to 24 Years | 1,373 (6.0%) | 1,237 (5.5%) |
| 25 to 29 Years | 1,408 (6.1%) | 1,448 (6.4%) |
| 30 to 34 Years | 1,181 (5.1%) | 1,328 (5.9%) |
| 35 to 39 Years | 1,503 (6.6%) | 1,355 (6.0%) |
| 40 to 44 Years | 1,864 (8.1%) | 1,308 (5.8%) |
| 45 to 49 Years | 1,384 (6.0%) | 1,251 (5.6%) |
| 50 to 54 Years | 1,355 (5.9%) | 1,303 (5.8%) |
| 55 to 59 Years | 1,417 (6.2%) | 1,642 (7.3%) |
| 60 to 64 Years | 1,641 (7.1%) | 1,512 (6.7%) |
| 65 to 69 Years | 1,301 (5.7%) | 1,657 (7.3%) |
| 70 to 74 Years | 1,096 (4.8%) | 975 (4.3%) |
| 75 to 79 Years | 580 (2.5%) | 738 (3.3%) |
| 80 to 84 Years | 531 (2.3%) | 597 (2.6%) |
| 85 Years and over | 320 (1.4%) | 627 (2.8%) |
| Total | 22,961 (100.0%) | 22,553 (100.0%) |
Families and Households in Washington Parish
Median Family Size in Washington Parish
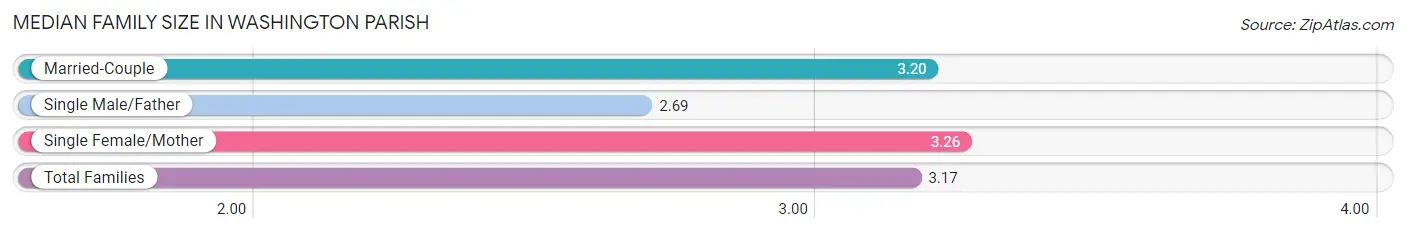
The median family size in Washington Parish is 3.17 persons per family, with single female/mother families (3,193 | 28.5%) accounting for the largest median family size of 3.26 persons per family. On the other hand, single male/father families (1,118 | 10.0%) represent the smallest median family size with 2.69 persons per family.
| Family Type | # Families | Family Size |
| Married-Couple | 6,878 (61.5%) | 3.20 |
| Single Male/Father | 1,118 (10.0%) | 2.69 |
| Single Female/Mother | 3,193 (28.5%) | 3.26 |
| Total Families | 11,189 (100.0%) | 3.17 |
Median Household Size in Washington Parish
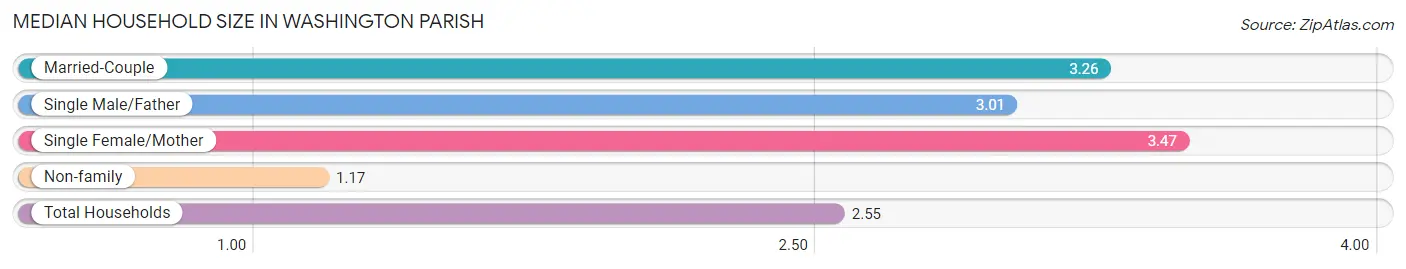
The median household size in Washington Parish is 2.55 persons per household, with single female/mother households (3,193 | 18.6%) accounting for the largest median household size of 3.47 persons per household. non-family households (5,973 | 34.8%) represent the smallest median household size with 1.17 persons per household.
| Household Type | # Households | Household Size |
| Married-Couple | 6,878 (40.1%) | 3.26 |
| Single Male/Father | 1,118 (6.5%) | 3.01 |
| Single Female/Mother | 3,193 (18.6%) | 3.47 |
| Non-family | 5,973 (34.8%) | 1.17 |
| Total Households | 17,162 (100.0%) | 2.55 |
Household Size by Marriage Status in Washington Parish
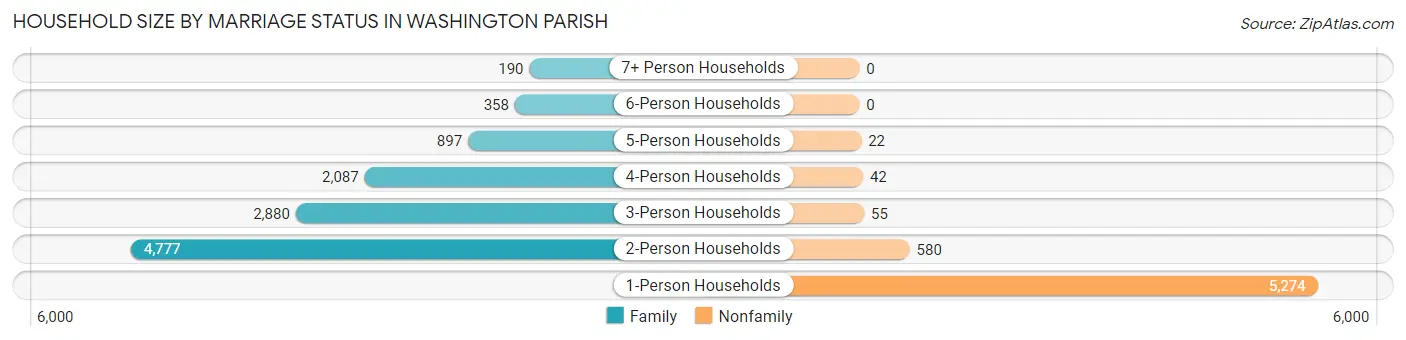
Out of a total of 17,162 households in Washington Parish, 11,189 (65.2%) are family households, while 5,973 (34.8%) are nonfamily households. The most numerous type of family households are 2-person households, comprising 4,777, and the most common type of nonfamily households are 1-person households, comprising 5,274.
| Household Size | Family Households | Nonfamily Households |
| 1-Person Households | - | 5,274 (30.7%) |
| 2-Person Households | 4,777 (27.8%) | 580 (3.4%) |
| 3-Person Households | 2,880 (16.8%) | 55 (0.3%) |
| 4-Person Households | 2,087 (12.2%) | 42 (0.2%) |
| 5-Person Households | 897 (5.2%) | 22 (0.1%) |
| 6-Person Households | 358 (2.1%) | 0 (0.0%) |
| 7+ Person Households | 190 (1.1%) | 0 (0.0%) |
| Total | 11,189 (65.2%) | 5,973 (34.8%) |
Female Fertility in Washington Parish
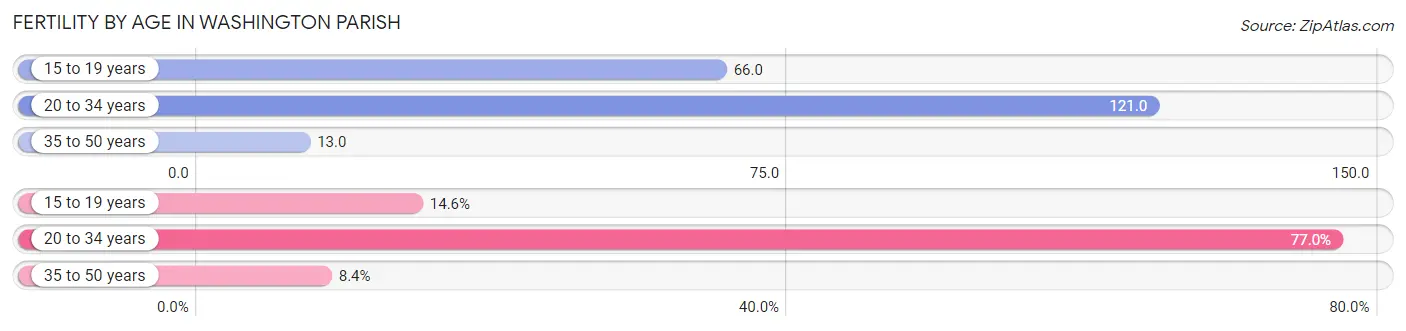
Fertility by Age in Washington Parish
Average fertility rate in Washington Parish is 66.0 births per 1,000 women. Women in the age bracket of 20 to 34 years have the highest fertility rate with 121.0 births per 1,000 women. Women in the age bracket of 20 to 34 years acount for 77.0% of all women with births.
| Age Bracket | Women with Births | Births / 1,000 Women |
| 15 to 19 years | 92 (14.6%) | 66.0 |
| 20 to 34 years | 486 (77.0%) | 121.0 |
| 35 to 50 years | 53 (8.4%) | 13.0 |
| Total | 631 (100.0%) | 66.0 |
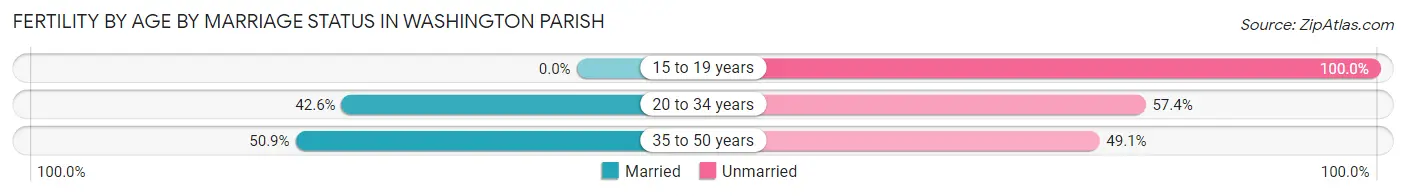
Fertility by Age by Marriage Status in Washington Parish
37.1% of women with births (631) in Washington Parish are married. The highest percentage of unmarried women with births falls into 15 to 19 years age bracket with 100.0% of them unmarried at the time of birth, while the lowest percentage of unmarried women with births belong to 35 to 50 years age bracket with 49.1% of them unmarried.
| Age Bracket | Married | Unmarried |
| 15 to 19 years | 0 (0.0%) | 92 (100.0%) |
| 20 to 34 years | 207 (42.6%) | 279 (57.4%) |
| 35 to 50 years | 27 (50.9%) | 26 (49.1%) |
| Total | 234 (37.1%) | 397 (62.9%) |
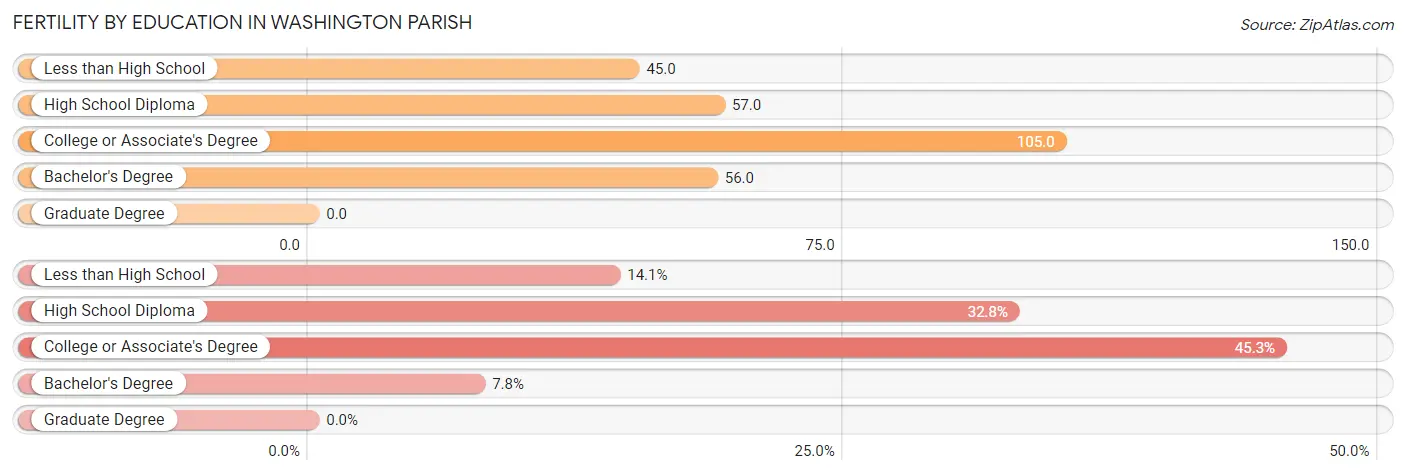
Fertility by Education in Washington Parish
| Educational Attainment | Women with Births | Births / 1,000 Women |
| Less than High School | 89 (14.1%) | 45.0 |
| High School Diploma | 207 (32.8%) | 57.0 |
| College or Associate's Degree | 286 (45.3%) | 105.0 |
| Bachelor's Degree | 49 (7.8%) | 56.0 |
| Graduate Degree | 0 (0.0%) | 0.0 |
| Total | 631 (100.0%) | 66.0 |
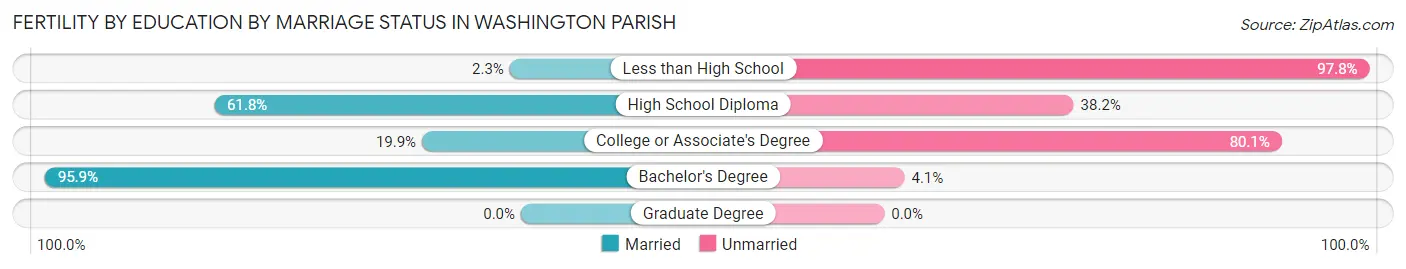
Fertility by Education by Marriage Status in Washington Parish
62.9% of women with births in Washington Parish are unmarried. Women with the educational attainment of bachelor's degree are most likely to be married with 95.9% of them married at childbirth, while women with the educational attainment of less than high school are least likely to be married with 97.8% of them unmarried at childbirth.
| Educational Attainment | Married | Unmarried |
| Less than High School | 2 (2.2%) | 87 (97.8%) |
| High School Diploma | 128 (61.8%) | 79 (38.2%) |
| College or Associate's Degree | 57 (19.9%) | 229 (80.1%) |
| Bachelor's Degree | 47 (95.9%) | 2 (4.1%) |
| Graduate Degree | 0 (0.0%) | 0 (0.0%) |
| Total | 234 (37.1%) | 397 (62.9%) |
Income in Washington Parish
Income Overview in Washington Parish
Per Capita Income in Washington Parish is $24,287, while median incomes of families and households are $54,649 and $41,803 respectively.
| Characteristic | Number | Measure |
| Per Capita Income | 45,514 | $24,287 |
| Median Family Income | 11,189 | $54,649 |
| Mean Family Income | 11,189 | $74,656 |
| Median Household Income | 17,162 | $41,803 |
| Mean Household Income | 17,162 | $62,460 |
| Income Deficit | 11,189 | $8,246 |
| Wage / Income Gap (%) | 45,514 | 32.61% |
| Wage / Income Gap ($) | 45,514 | 67.39¢ per $1 |
| Gini / Inequality Index | 45,514 | 0.48 |
Earnings by Sex in Washington Parish
Average Earnings in Washington Parish are $27,828, $35,283 for men and $23,778 for women, a difference of 32.6%.
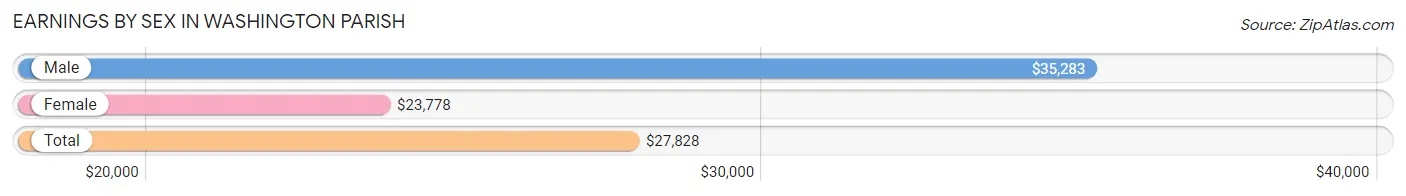
| Sex | Number | Average Earnings |
| Male | 9,753 (50.9%) | $35,283 |
| Female | 9,407 (49.1%) | $23,778 |
| Total | 19,160 (100.0%) | $27,828 |
Earnings by Sex by Income Bracket in Washington Parish
The most common earnings brackets in Washington Parish are $100,000+ for men (1,163 | 11.9%) and $25,000 to $29,999 for women (1,030 | 11.0%).
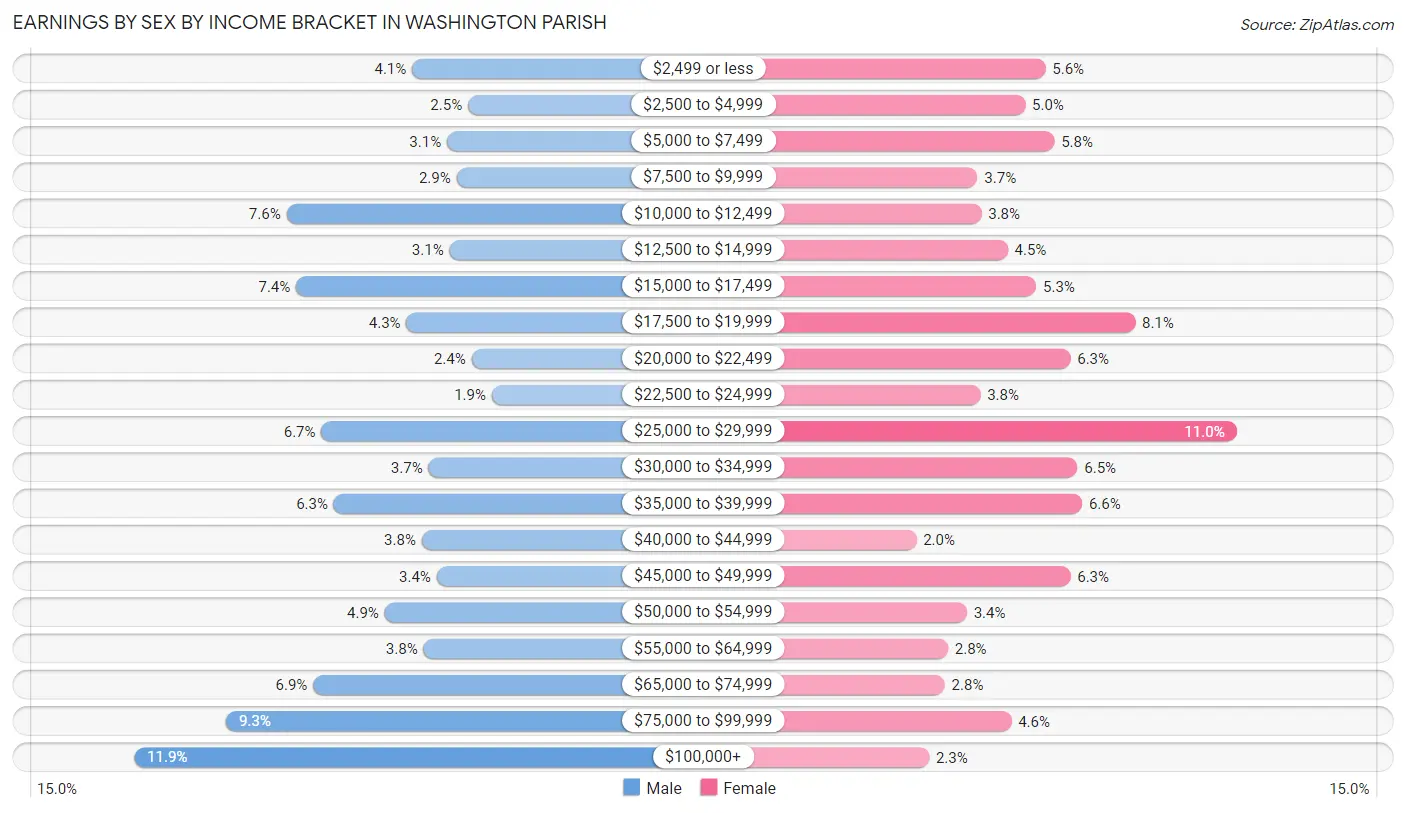
| Income | Male | Female |
| $2,499 or less | 401 (4.1%) | 525 (5.6%) |
| $2,500 to $4,999 | 248 (2.5%) | 471 (5.0%) |
| $5,000 to $7,499 | 305 (3.1%) | 548 (5.8%) |
| $7,500 to $9,999 | 279 (2.9%) | 345 (3.7%) |
| $10,000 to $12,499 | 745 (7.6%) | 356 (3.8%) |
| $12,500 to $14,999 | 298 (3.1%) | 425 (4.5%) |
| $15,000 to $17,499 | 719 (7.4%) | 500 (5.3%) |
| $17,500 to $19,999 | 416 (4.3%) | 762 (8.1%) |
| $20,000 to $22,499 | 238 (2.4%) | 591 (6.3%) |
| $22,500 to $24,999 | 182 (1.9%) | 353 (3.7%) |
| $25,000 to $29,999 | 650 (6.7%) | 1,030 (11.0%) |
| $30,000 to $34,999 | 356 (3.6%) | 610 (6.5%) |
| $35,000 to $39,999 | 615 (6.3%) | 622 (6.6%) |
| $40,000 to $44,999 | 375 (3.8%) | 183 (1.9%) |
| $45,000 to $49,999 | 334 (3.4%) | 591 (6.3%) |
| $50,000 to $54,999 | 476 (4.9%) | 317 (3.4%) |
| $55,000 to $64,999 | 370 (3.8%) | 267 (2.8%) |
| $65,000 to $74,999 | 672 (6.9%) | 259 (2.8%) |
| $75,000 to $99,999 | 911 (9.3%) | 435 (4.6%) |
| $100,000+ | 1,163 (11.9%) | 217 (2.3%) |
| Total | 9,753 (100.0%) | 9,407 (100.0%) |
Earnings by Sex by Educational Attainment in Washington Parish
Average earnings in Washington Parish are $40,769 for men and $26,776 for women, a difference of 34.3%. Men with an educational attainment of college or associate's degree enjoy the highest average annual earnings of $45,289, while those with less than high school education earn the least with $23,073. Women with an educational attainment of graduate degree earn the most with the average annual earnings of $50,651, while those with less than high school education have the smallest earnings of $18,183.
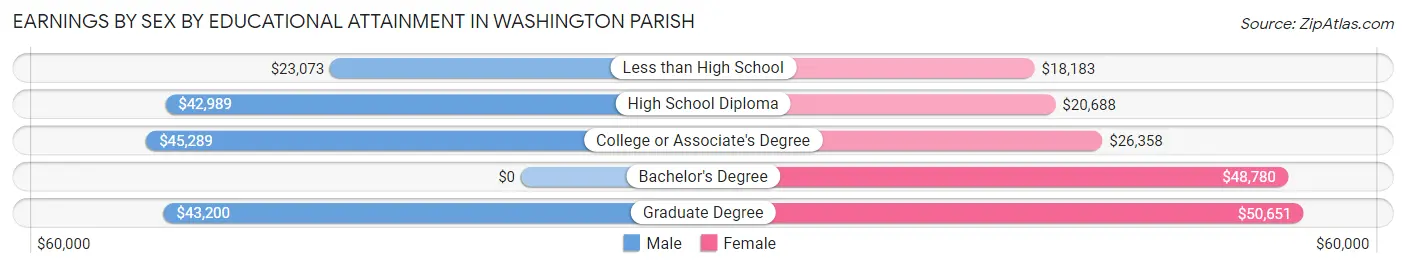
| Educational Attainment | Male Income | Female Income |
| Less than High School | $23,073 | $18,183 |
| High School Diploma | $42,989 | $20,688 |
| College or Associate's Degree | $45,289 | $26,358 |
| Bachelor's Degree | - | - |
| Graduate Degree | $43,200 | $50,651 |
| Total | $40,769 | $26,776 |
Family Income in Washington Parish
Family Income Brackets in Washington Parish
According to the Washington Parish family income data, there are 1,913 families falling into the $50,000 to $74,999 income range, which is the most common income bracket and makes up 17.1% of all families. Conversely, the less than $10,000 income bracket is the least frequent group with only 380 families (3.4%) belonging to this category.
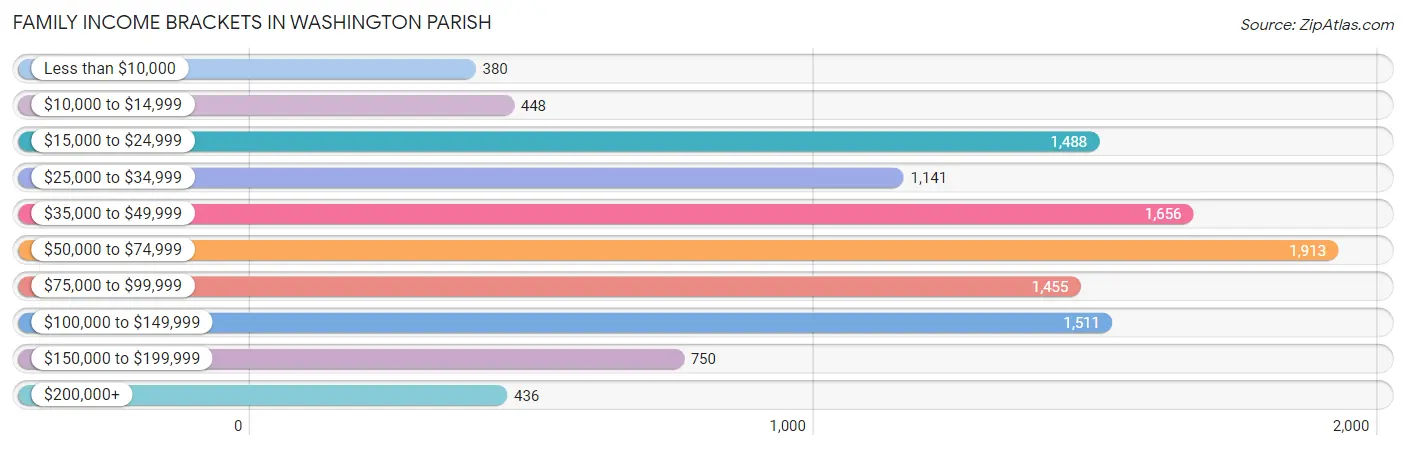
| Income Bracket | # Families | % Families |
| Less than $10,000 | 380 | 3.4% |
| $10,000 to $14,999 | 448 | 4.0% |
| $15,000 to $24,999 | 1,488 | 13.3% |
| $25,000 to $34,999 | 1,141 | 10.2% |
| $35,000 to $49,999 | 1,656 | 14.8% |
| $50,000 to $74,999 | 1,913 | 17.1% |
| $75,000 to $99,999 | 1,455 | 13.0% |
| $100,000 to $149,999 | 1,511 | 13.5% |
| $150,000 to $199,999 | 750 | 6.7% |
| $200,000+ | 436 | 3.9% |
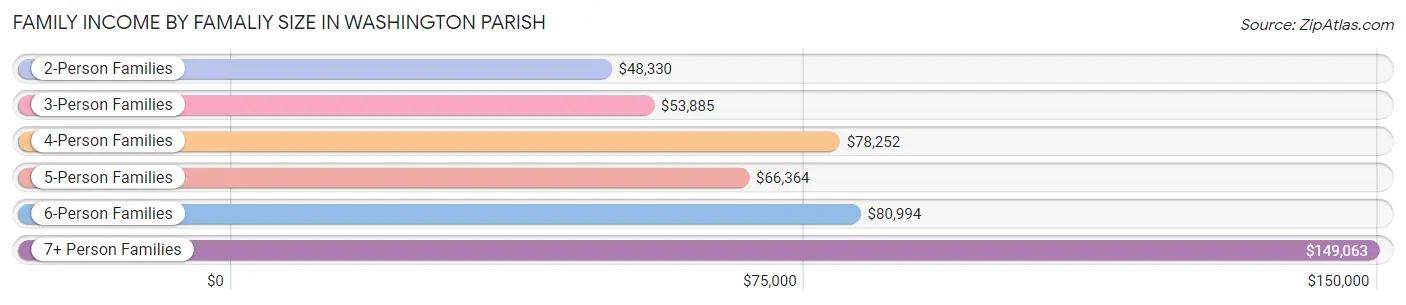
Family Income by Famaliy Size in Washington Parish
7+ person families (185 | 1.7%) account for the highest median family income in Washington Parish with $149,063 per family, while 2-person families (5,243 | 46.9%) have the highest median income of $24,165 per family member.
| Income Bracket | # Families | Median Income |
| 2-Person Families | 5,243 (46.9%) | $48,330 |
| 3-Person Families | 2,898 (25.9%) | $53,885 |
| 4-Person Families | 1,770 (15.8%) | $78,252 |
| 5-Person Families | 910 (8.1%) | $66,364 |
| 6-Person Families | 183 (1.6%) | $80,994 |
| 7+ Person Families | 185 (1.7%) | $149,063 |
| Total | 11,189 (100.0%) | $54,649 |
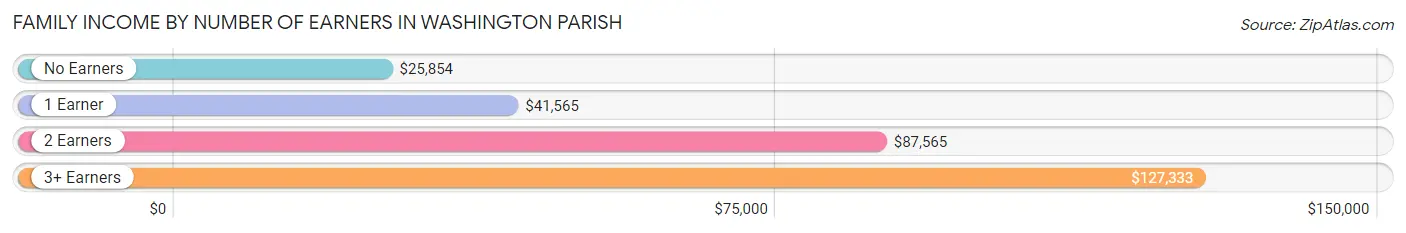
Family Income by Number of Earners in Washington Parish
The median family income in Washington Parish is $54,649, with families comprising 3+ earners (1,066) having the highest median family income of $127,333, while families with no earners (2,132) have the lowest median family income of $25,854, accounting for 9.5% and 19.1% of families, respectively.
| Number of Earners | # Families | Median Income |
| No Earners | 2,132 (19.1%) | $25,854 |
| 1 Earner | 4,634 (41.4%) | $41,565 |
| 2 Earners | 3,357 (30.0%) | $87,565 |
| 3+ Earners | 1,066 (9.5%) | $127,333 |
| Total | 11,189 (100.0%) | $54,649 |
Household Income in Washington Parish
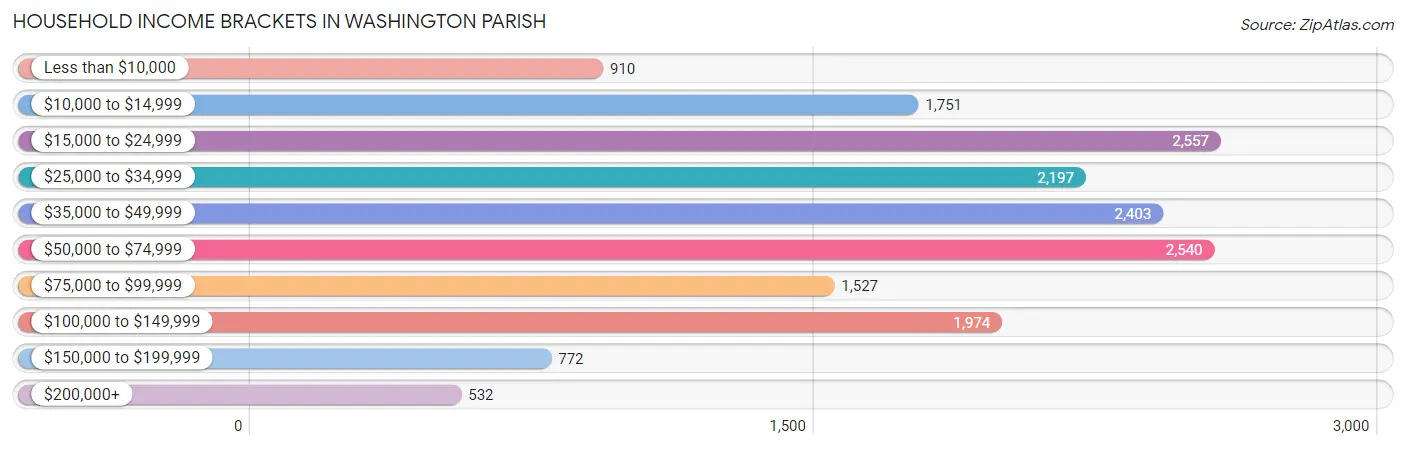
Household Income Brackets in Washington Parish
With 2,557 households falling in the category, the $15,000 to $24,999 income range is the most frequent in Washington Parish, accounting for 14.9% of all households. In contrast, only 532 households (3.1%) fall into the $200,000+ income bracket, making it the least populous group.
| Income Bracket | # Households | % Households |
| Less than $10,000 | 910 | 5.3% |
| $10,000 to $14,999 | 1,751 | 10.2% |
| $15,000 to $24,999 | 2,557 | 14.9% |
| $25,000 to $34,999 | 2,197 | 12.8% |
| $35,000 to $49,999 | 2,403 | 14.0% |
| $50,000 to $74,999 | 2,540 | 14.8% |
| $75,000 to $99,999 | 1,527 | 8.9% |
| $100,000 to $149,999 | 1,974 | 11.5% |
| $150,000 to $199,999 | 772 | 4.5% |
| $200,000+ | 532 | 3.1% |
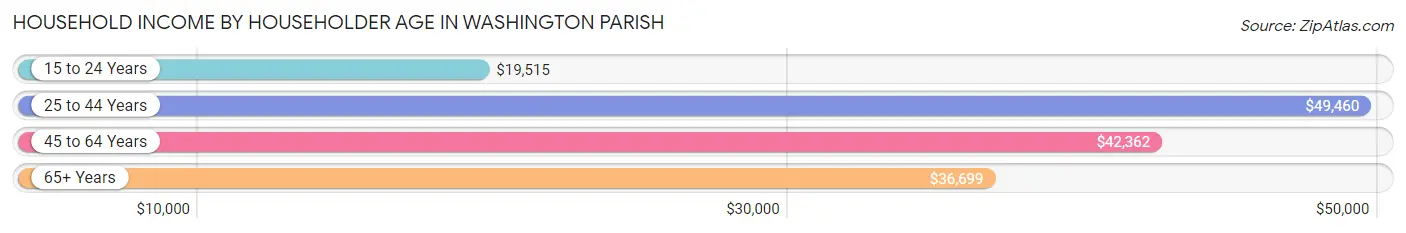
Household Income by Householder Age in Washington Parish
The median household income in Washington Parish is $41,803, with the highest median household income of $49,460 found in the 25 to 44 years age bracket for the primary householder. A total of 5,239 households (30.5%) fall into this category. Meanwhile, the 15 to 24 years age bracket for the primary householder has the lowest median household income of $19,515, with 653 households (3.8%) in this group.
| Income Bracket | # Households | Median Income |
| 15 to 24 Years | 653 (3.8%) | $19,515 |
| 25 to 44 Years | 5,239 (30.5%) | $49,460 |
| 45 to 64 Years | 6,132 (35.7%) | $42,362 |
| 65+ Years | 5,138 (29.9%) | $36,699 |
| Total | 17,162 (100.0%) | $41,803 |
Poverty in Washington Parish
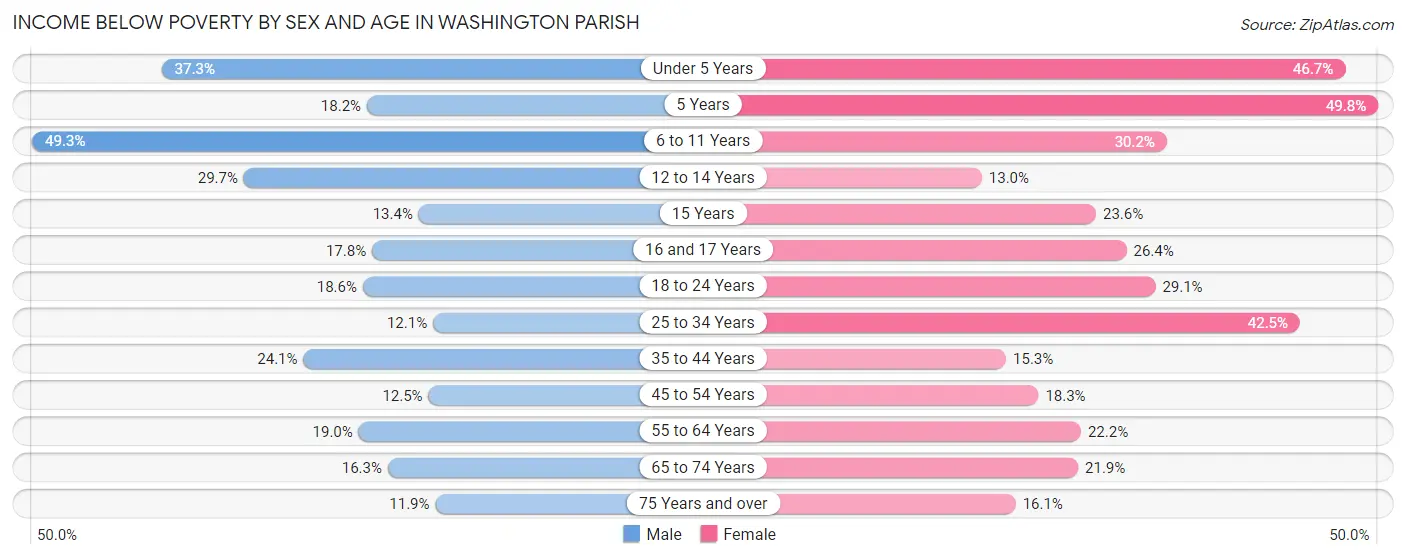
Income Below Poverty by Sex and Age in Washington Parish
With 21.6% poverty level for males and 25.4% for females among the residents of Washington Parish, 6 to 11 year old males and 5 year old females are the most vulnerable to poverty, with 884 males (49.3%) and 103 females (49.8%) in their respective age groups living below the poverty level.
| Age Bracket | Male | Female |
| Under 5 Years | 535 (37.3%) | 603 (46.7%) |
| 5 Years | 33 (18.2%) | 103 (49.8%) |
| 6 to 11 Years | 884 (49.3%) | 490 (30.1%) |
| 12 to 14 Years | 291 (29.7%) | 127 (13.0%) |
| 15 Years | 49 (13.4%) | 59 (23.6%) |
| 16 and 17 Years | 108 (17.8%) | 171 (26.4%) |
| 18 to 24 Years | 344 (18.6%) | 505 (29.1%) |
| 25 to 34 Years | 270 (12.1%) | 1,178 (42.5%) |
| 35 to 44 Years | 724 (24.1%) | 404 (15.2%) |
| 45 to 54 Years | 305 (12.5%) | 466 (18.2%) |
| 55 to 64 Years | 529 (19.0%) | 697 (22.2%) |
| 65 to 74 Years | 373 (16.3%) | 573 (21.9%) |
| 75 Years and over | 168 (11.9%) | 305 (16.1%) |
| Total | 4,613 (21.6%) | 5,681 (25.4%) |
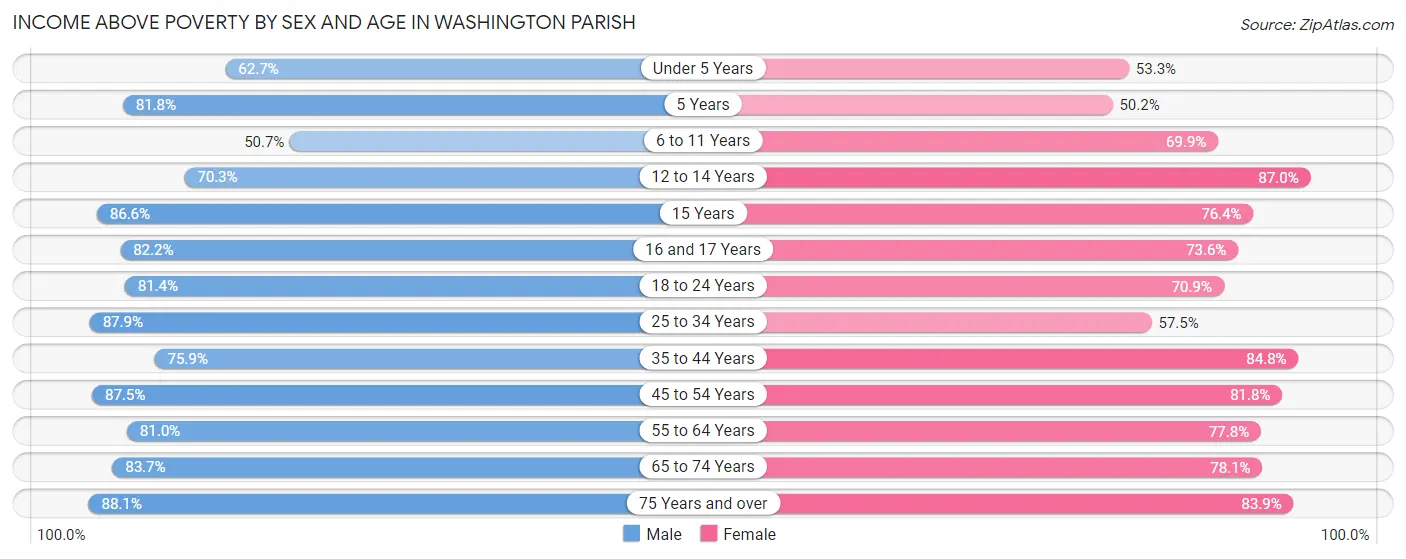
Income Above Poverty by Sex and Age in Washington Parish
According to the poverty statistics in Washington Parish, males aged 75 years and over and females aged 12 to 14 years are the age groups that are most secure financially, with 88.1% of males and 87.0% of females in these age groups living above the poverty line.
| Age Bracket | Male | Female |
| Under 5 Years | 900 (62.7%) | 688 (53.3%) |
| 5 Years | 148 (81.8%) | 104 (50.2%) |
| 6 to 11 Years | 909 (50.7%) | 1,135 (69.9%) |
| 12 to 14 Years | 690 (70.3%) | 850 (87.0%) |
| 15 Years | 316 (86.6%) | 191 (76.4%) |
| 16 and 17 Years | 500 (82.2%) | 476 (73.6%) |
| 18 to 24 Years | 1,504 (81.4%) | 1,230 (70.9%) |
| 25 to 34 Years | 1,961 (87.9%) | 1,593 (57.5%) |
| 35 to 44 Years | 2,276 (75.9%) | 2,246 (84.8%) |
| 45 to 54 Years | 2,131 (87.5%) | 2,087 (81.8%) |
| 55 to 64 Years | 2,255 (81.0%) | 2,443 (77.8%) |
| 65 to 74 Years | 1,917 (83.7%) | 2,040 (78.1%) |
| 75 Years and over | 1,246 (88.1%) | 1,585 (83.9%) |
| Total | 16,753 (78.4%) | 16,668 (74.6%) |
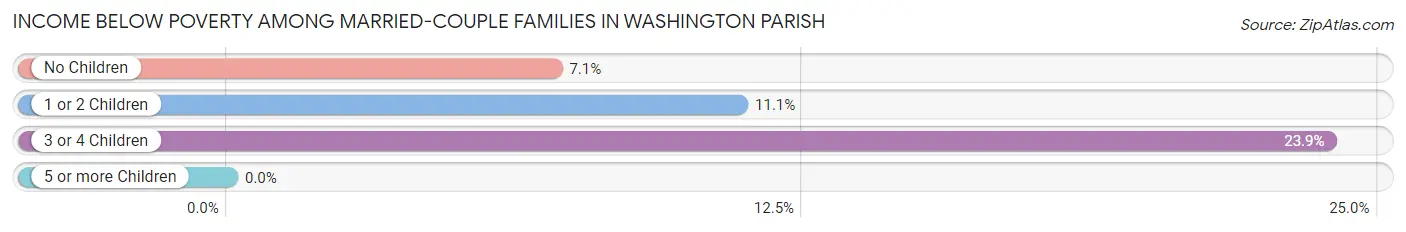
Income Below Poverty Among Married-Couple Families in Washington Parish
The poverty statistics for married-couple families in Washington Parish show that 9.6% or 659 of the total 6,878 families live below the poverty line. Families with 3 or 4 children have the highest poverty rate of 23.9%, comprising of 109 families. On the other hand, families with 5 or more children have the lowest poverty rate of 0.0%, which includes 0 families.
| Children | Above Poverty | Below Poverty |
| No Children | 3,618 (92.9%) | 275 (7.1%) |
| 1 or 2 Children | 2,203 (88.9%) | 275 (11.1%) |
| 3 or 4 Children | 347 (76.1%) | 109 (23.9%) |
| 5 or more Children | 51 (100.0%) | 0 (0.0%) |
| Total | 6,219 (90.4%) | 659 (9.6%) |
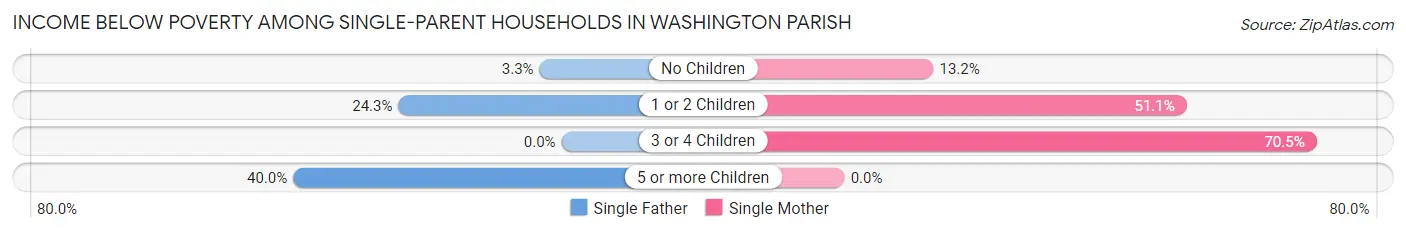
Income Below Poverty Among Single-Parent Households in Washington Parish
According to the poverty data in Washington Parish, 15.2% or 170 single-father households and 42.0% or 1,342 single-mother households are living below the poverty line. Among single-father households, those with 5 or more children have the highest poverty rate, with 2 households (40.0%) experiencing poverty. Likewise, among single-mother households, those with 3 or 4 children have the highest poverty rate, with 341 households (70.5%) falling below the poverty line.
| Children | Single Father | Single Mother |
| No Children | 16 (3.3%) | 134 (13.2%) |
| 1 or 2 Children | 152 (24.3%) | 867 (51.1%) |
| 3 or 4 Children | 0 (0.0%) | 341 (70.5%) |
| 5 or more Children | 2 (40.0%) | 0 (0.0%) |
| Total | 170 (15.2%) | 1,342 (42.0%) |
Income Below Poverty Among Married-Couple vs Single-Parent Households in Washington Parish
The poverty data for Washington Parish shows that 659 of the married-couple family households (9.6%) and 1,512 of the single-parent households (35.1%) are living below the poverty level. Within the married-couple family households, those with 3 or 4 children have the highest poverty rate, with 109 households (23.9%) falling below the poverty line. Among the single-parent households, those with 3 or 4 children have the highest poverty rate, with 341 household (70.5%) living below poverty.
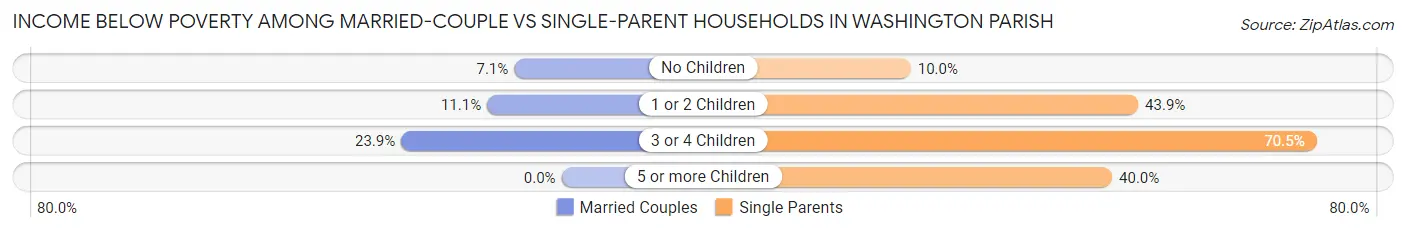
| Children | Married-Couple Families | Single-Parent Households |
| No Children | 275 (7.1%) | 150 (10.0%) |
| 1 or 2 Children | 275 (11.1%) | 1,019 (43.9%) |
| 3 or 4 Children | 109 (23.9%) | 341 (70.5%) |
| 5 or more Children | 0 (0.0%) | 2 (40.0%) |
| Total | 659 (9.6%) | 1,512 (35.1%) |
Employment Characteristics in Washington Parish
Employment by Class of Employer in Washington Parish
Among the 16,324 employed individuals in Washington Parish, private company employees (11,399 | 69.8%), local government employees (1,333 | 8.2%), and state government employees (1,123 | 6.9%) make up the most common classes of employment.
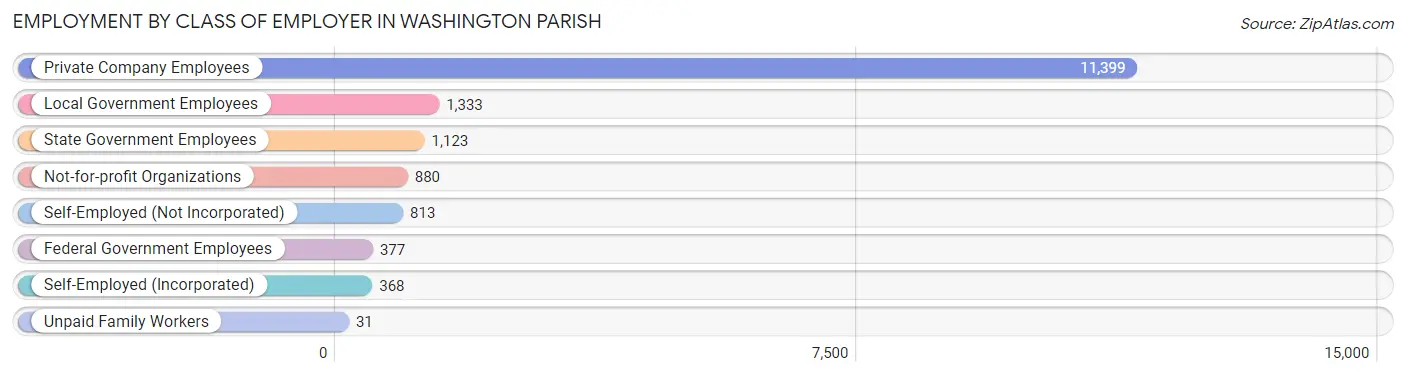
| Employer Class | # Employees | % Employees |
| Private Company Employees | 11,399 | 69.8% |
| Self-Employed (Incorporated) | 368 | 2.2% |
| Self-Employed (Not Incorporated) | 813 | 5.0% |
| Not-for-profit Organizations | 880 | 5.4% |
| Local Government Employees | 1,333 | 8.2% |
| State Government Employees | 1,123 | 6.9% |
| Federal Government Employees | 377 | 2.3% |
| Unpaid Family Workers | 31 | 0.2% |
| Total | 16,324 | 100.0% |
Employment Status by Age in Washington Parish
According to the labor force statistics for Washington Parish, out of the total population over 16 years of age (36,266), 51.7% or 18,750 individuals are in the labor force, with 10.5% or 1,969 of them unemployed. The age group with the highest labor force participation rate is 35 to 44 years, with 79.2% or 4,776 individuals in the labor force. Within the labor force, the 16 to 19 years age range has the highest percentage of unemployed individuals, with 37.5% or 316 of them being unemployed.
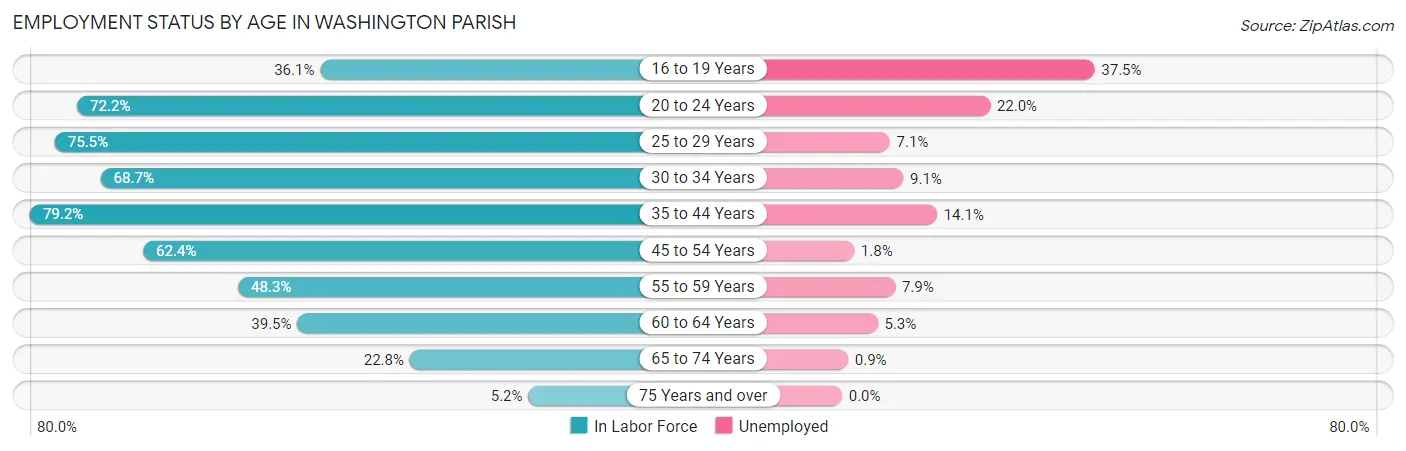
| Age Bracket | In Labor Force | Unemployed |
| 16 to 19 Years | 843 (36.1%) | 316 (37.5%) |
| 20 to 24 Years | 1,884 (72.2%) | 414 (22.0%) |
| 25 to 29 Years | 2,156 (75.5%) | 153 (7.1%) |
| 30 to 34 Years | 1,724 (68.7%) | 157 (9.1%) |
| 35 to 44 Years | 4,776 (79.2%) | 673 (14.1%) |
| 45 to 54 Years | 3,303 (62.4%) | 59 (1.8%) |
| 55 to 59 Years | 1,477 (48.3%) | 117 (7.9%) |
| 60 to 64 Years | 1,245 (39.5%) | 66 (5.3%) |
| 65 to 74 Years | 1,147 (22.8%) | 10 (0.9%) |
| 75 Years and over | 176 (5.2%) | 0 (0.0%) |
| Total | 18,750 (51.7%) | 1,969 (10.5%) |
Employment Status by Educational Attainment in Washington Parish
According to labor force statistics for Washington Parish, 64.1% of individuals (14,679) out of the total population between 25 and 64 years of age (22,900) are in the labor force, with 8.4% or 1,233 of them being unemployed. The group with the highest labor force participation rate are those with the educational attainment of bachelor's degree or higher, with 81.9% or 2,239 individuals in the labor force. Within the labor force, individuals with high school diploma education have the highest percentage of unemployment, with 9.4% or 632 of them being unemployed.
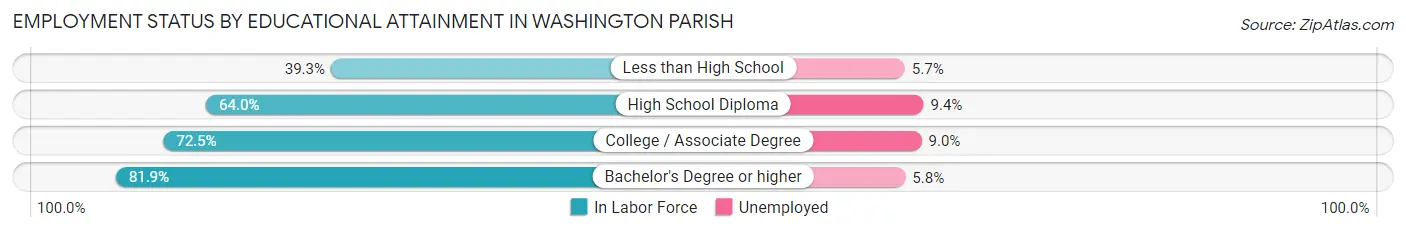
| Educational Attainment | In Labor Force | Unemployed |
| Less than High School | 1,526 (39.3%) | 221 (5.7%) |
| High School Diploma | 6,719 (64.0%) | 987 (9.4%) |
| College / Associate Degree | 4,195 (72.5%) | 521 (9.0%) |
| Bachelor's Degree or higher | 2,239 (81.9%) | 159 (5.8%) |
| Total | 14,679 (64.1%) | 1,924 (8.4%) |
Employment Occupations by Sex in Washington Parish
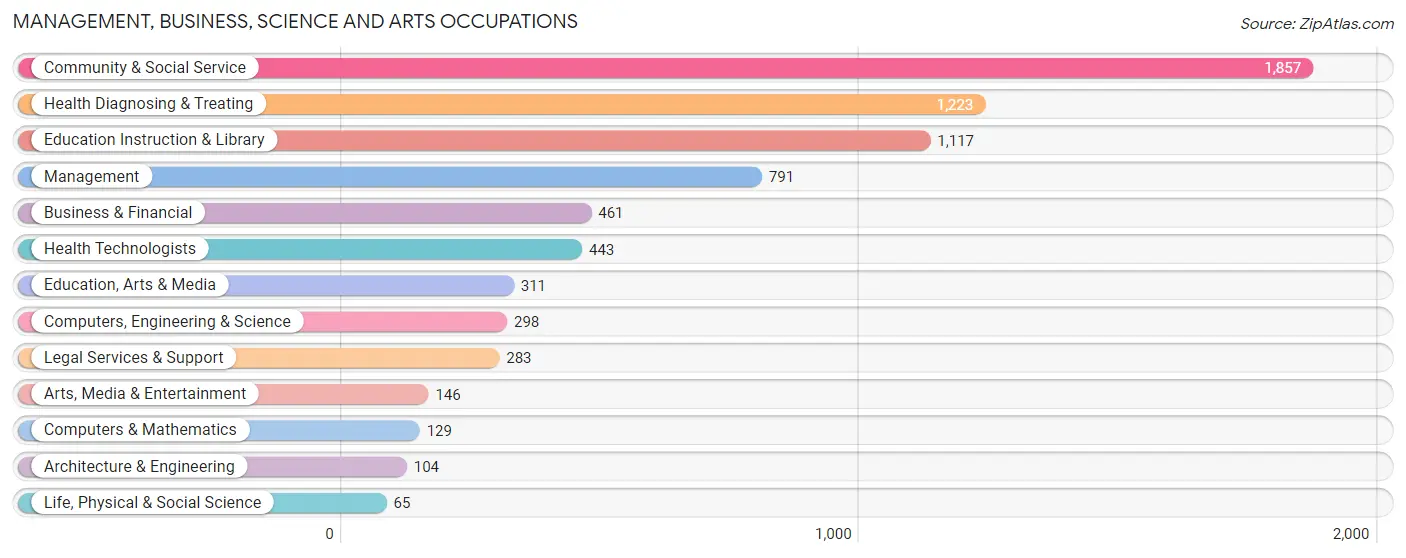
Management, Business, Science and Arts Occupations
The most common Management, Business, Science and Arts occupations in Washington Parish are Community & Social Service (1,857 | 11.1%), Health Diagnosing & Treating (1,223 | 7.3%), Education Instruction & Library (1,117 | 6.7%), Management (791 | 4.7%), and Business & Financial (461 | 2.8%).
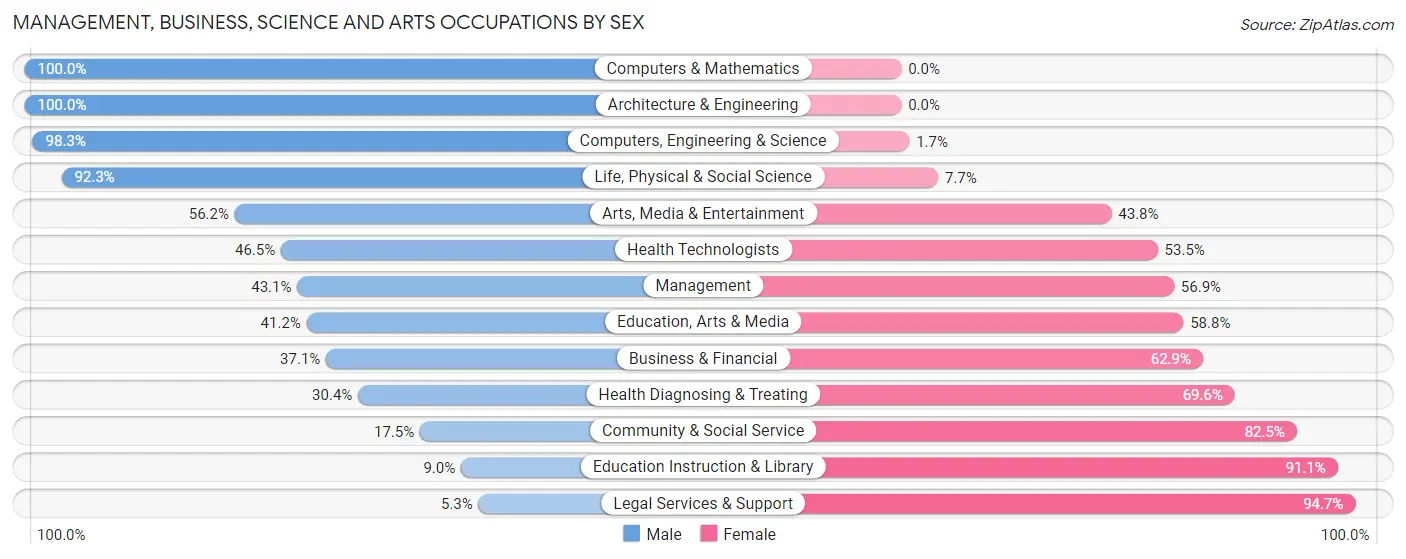
Management, Business, Science and Arts Occupations by Sex
Within the Management, Business, Science and Arts occupations in Washington Parish, the most male-oriented occupations are Computers & Mathematics (100.0%), Architecture & Engineering (100.0%), and Computers, Engineering & Science (98.3%), while the most female-oriented occupations are Legal Services & Support (94.7%), Education Instruction & Library (91.0%), and Community & Social Service (82.5%).
| Occupation | Male | Female |
| Management | 341 (43.1%) | 450 (56.9%) |
| Business & Financial | 171 (37.1%) | 290 (62.9%) |
| Computers, Engineering & Science | 293 (98.3%) | 5 (1.7%) |
| Computers & Mathematics | 129 (100.0%) | 0 (0.0%) |
| Architecture & Engineering | 104 (100.0%) | 0 (0.0%) |
| Life, Physical & Social Science | 60 (92.3%) | 5 (7.7%) |
| Community & Social Service | 325 (17.5%) | 1,532 (82.5%) |
| Education, Arts & Media | 128 (41.2%) | 183 (58.8%) |
| Legal Services & Support | 15 (5.3%) | 268 (94.7%) |
| Education Instruction & Library | 100 (8.9%) | 1,017 (91.0%) |
| Arts, Media & Entertainment | 82 (56.2%) | 64 (43.8%) |
| Health Diagnosing & Treating | 372 (30.4%) | 851 (69.6%) |
| Health Technologists | 206 (46.5%) | 237 (53.5%) |
| Total (Category) | 1,502 (32.4%) | 3,128 (67.6%) |
| Total (Overall) | 8,162 (48.7%) | 8,601 (51.3%) |
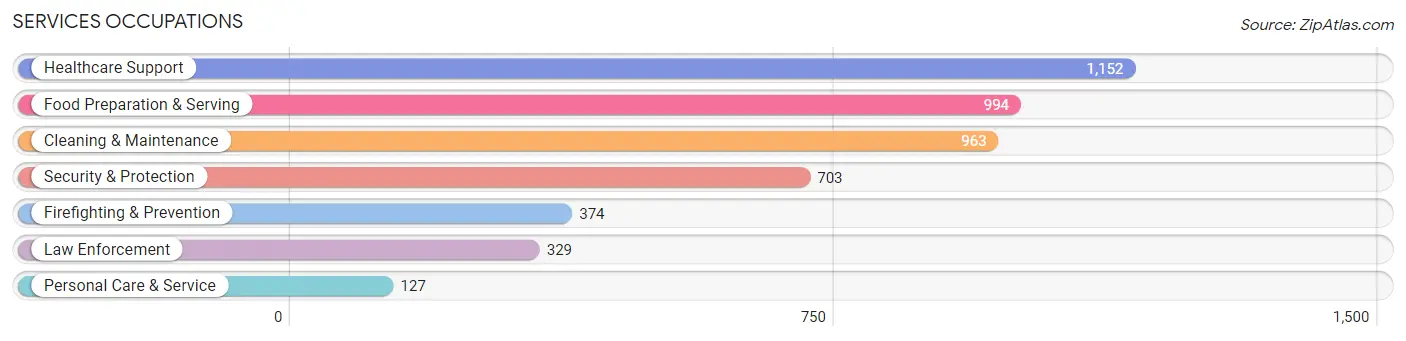
Services Occupations
The most common Services occupations in Washington Parish are Healthcare Support (1,152 | 6.9%), Food Preparation & Serving (994 | 5.9%), Cleaning & Maintenance (963 | 5.7%), Security & Protection (703 | 4.2%), and Firefighting & Prevention (374 | 2.2%).
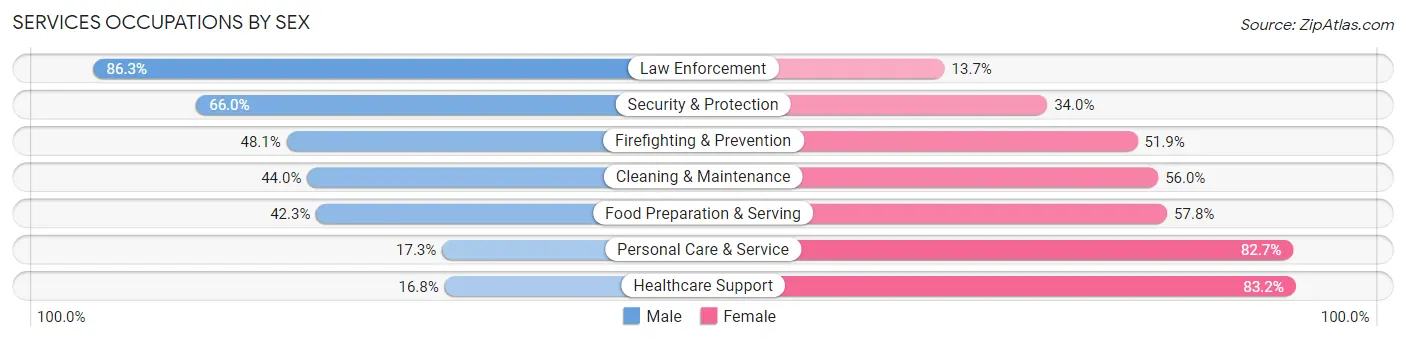
Services Occupations by Sex
Within the Services occupations in Washington Parish, the most male-oriented occupations are Law Enforcement (86.3%), Security & Protection (66.0%), and Firefighting & Prevention (48.1%), while the most female-oriented occupations are Healthcare Support (83.2%), Personal Care & Service (82.7%), and Food Preparation & Serving (57.8%).
| Occupation | Male | Female |
| Healthcare Support | 194 (16.8%) | 958 (83.2%) |
| Security & Protection | 464 (66.0%) | 239 (34.0%) |
| Firefighting & Prevention | 180 (48.1%) | 194 (51.9%) |
| Law Enforcement | 284 (86.3%) | 45 (13.7%) |
| Food Preparation & Serving | 420 (42.2%) | 574 (57.8%) |
| Cleaning & Maintenance | 424 (44.0%) | 539 (56.0%) |
| Personal Care & Service | 22 (17.3%) | 105 (82.7%) |
| Total (Category) | 1,524 (38.7%) | 2,415 (61.3%) |
| Total (Overall) | 8,162 (48.7%) | 8,601 (51.3%) |
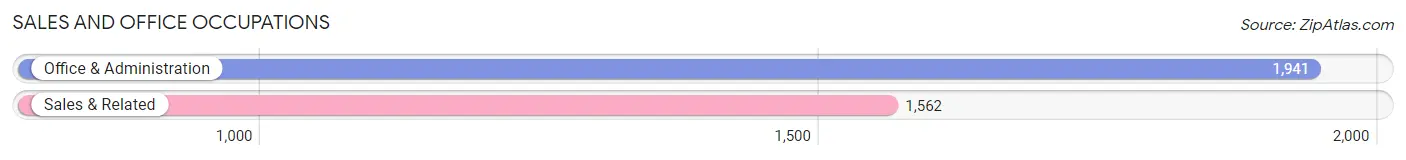
Sales and Office Occupations
The most common Sales and Office occupations in Washington Parish are Office & Administration (1,941 | 11.6%), and Sales & Related (1,562 | 9.3%).
Sales and Office Occupations by Sex
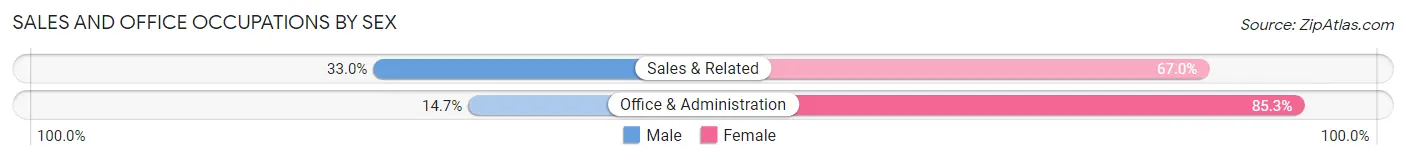
| Occupation | Male | Female |
| Sales & Related | 515 (33.0%) | 1,047 (67.0%) |
| Office & Administration | 286 (14.7%) | 1,655 (85.3%) |
| Total (Category) | 801 (22.9%) | 2,702 (77.1%) |
| Total (Overall) | 8,162 (48.7%) | 8,601 (51.3%) |
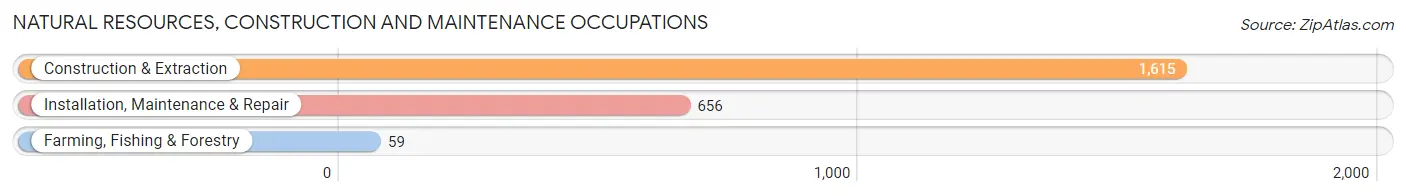
Natural Resources, Construction and Maintenance Occupations
The most common Natural Resources, Construction and Maintenance occupations in Washington Parish are Construction & Extraction (1,615 | 9.6%), Installation, Maintenance & Repair (656 | 3.9%), and Farming, Fishing & Forestry (59 | 0.4%).
Natural Resources, Construction and Maintenance Occupations by Sex
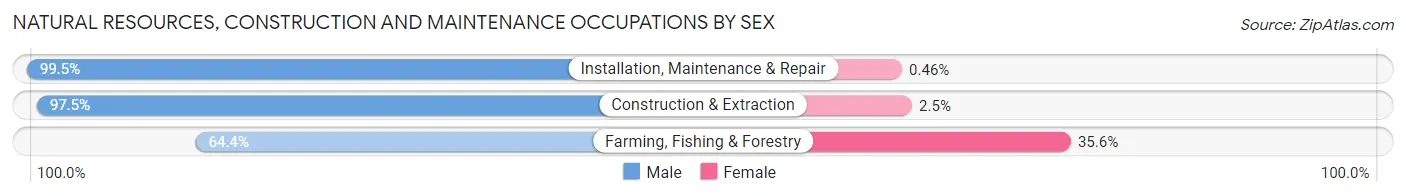
| Occupation | Male | Female |
| Farming, Fishing & Forestry | 38 (64.4%) | 21 (35.6%) |
| Construction & Extraction | 1,574 (97.5%) | 41 (2.5%) |
| Installation, Maintenance & Repair | 653 (99.5%) | 3 (0.5%) |
| Total (Category) | 2,265 (97.2%) | 65 (2.8%) |
| Total (Overall) | 8,162 (48.7%) | 8,601 (51.3%) |
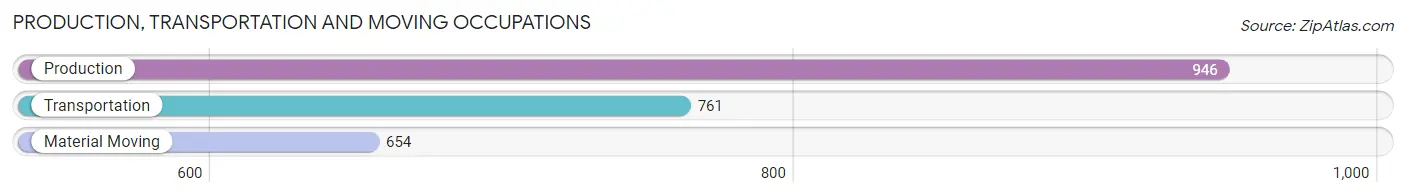
Production, Transportation and Moving Occupations
The most common Production, Transportation and Moving occupations in Washington Parish are Production (946 | 5.6%), Transportation (761 | 4.5%), and Material Moving (654 | 3.9%).
Production, Transportation and Moving Occupations by Sex
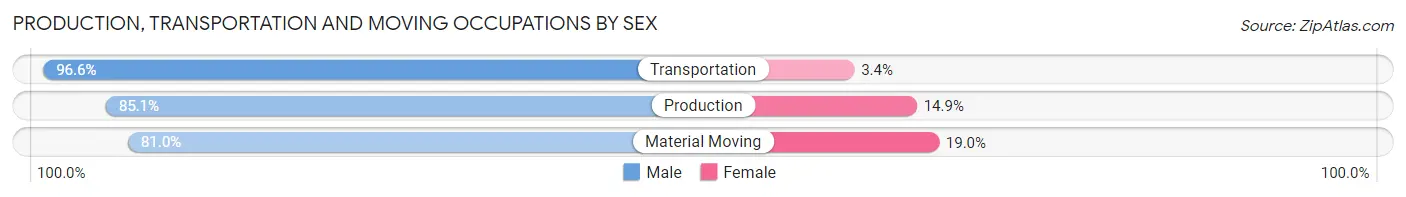
| Occupation | Male | Female |
| Production | 805 (85.1%) | 141 (14.9%) |
| Transportation | 735 (96.6%) | 26 (3.4%) |
| Material Moving | 530 (81.0%) | 124 (19.0%) |
| Total (Category) | 2,070 (87.7%) | 291 (12.3%) |
| Total (Overall) | 8,162 (48.7%) | 8,601 (51.3%) |
Employment Industries by Sex in Washington Parish
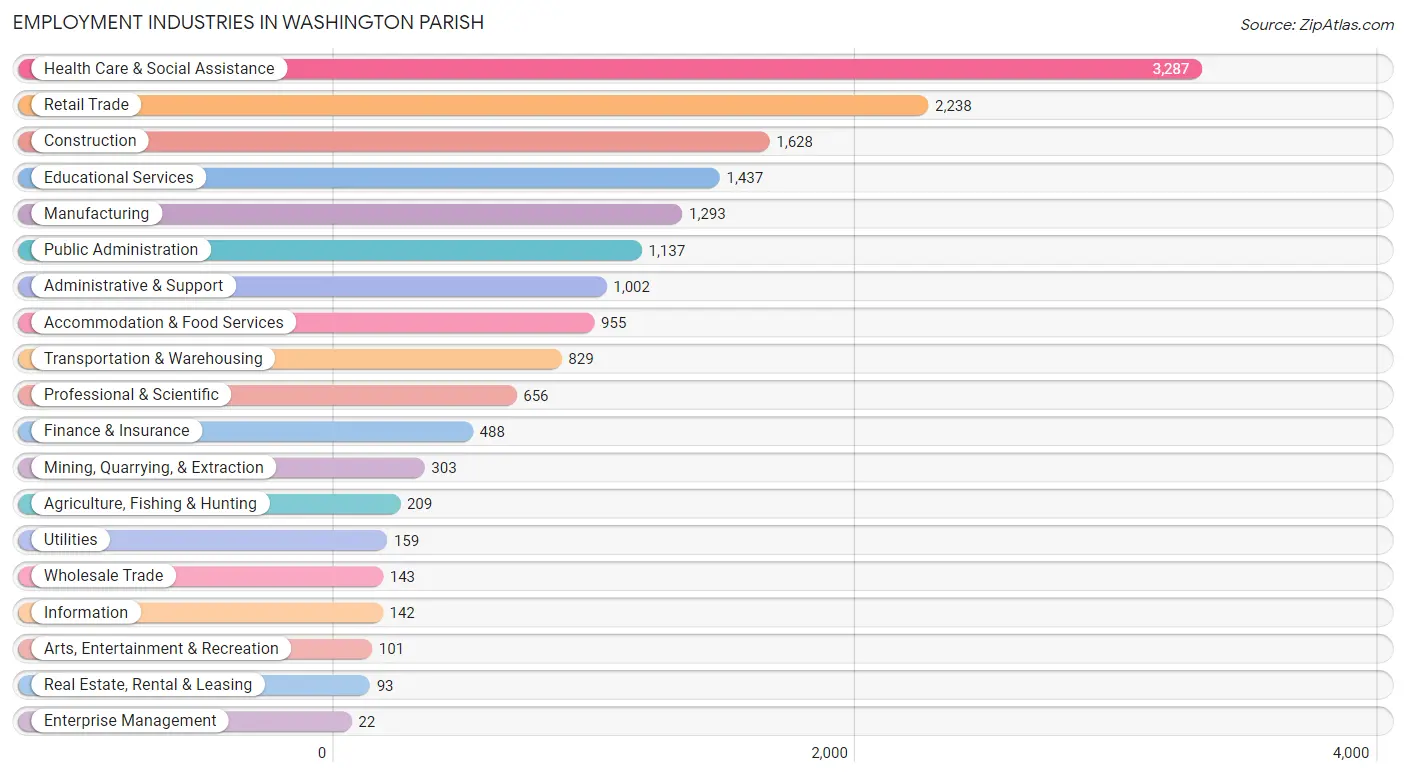
Employment Industries in Washington Parish
The major employment industries in Washington Parish include Health Care & Social Assistance (3,287 | 19.6%), Retail Trade (2,238 | 13.4%), Construction (1,628 | 9.7%), Educational Services (1,437 | 8.6%), and Manufacturing (1,293 | 7.7%).
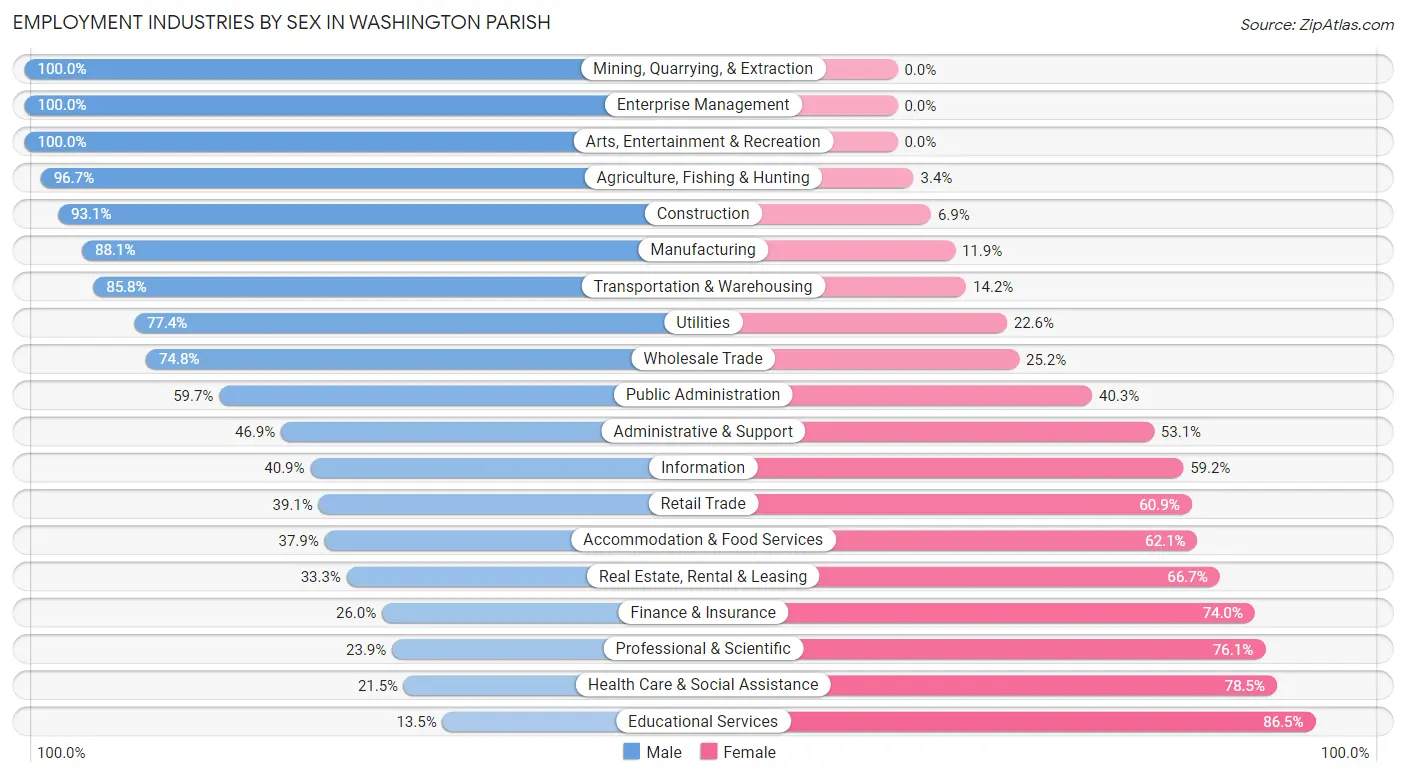
Employment Industries by Sex in Washington Parish
The Washington Parish industries that see more men than women are Mining, Quarrying, & Extraction (100.0%), Enterprise Management (100.0%), and Arts, Entertainment & Recreation (100.0%), whereas the industries that tend to have a higher number of women are Educational Services (86.5%), Health Care & Social Assistance (78.5%), and Professional & Scientific (76.1%).
| Industry | Male | Female |
| Agriculture, Fishing & Hunting | 202 (96.7%) | 7 (3.4%) |
| Mining, Quarrying, & Extraction | 303 (100.0%) | 0 (0.0%) |
| Construction | 1,515 (93.1%) | 113 (6.9%) |
| Manufacturing | 1,139 (88.1%) | 154 (11.9%) |
| Wholesale Trade | 107 (74.8%) | 36 (25.2%) |
| Retail Trade | 876 (39.1%) | 1,362 (60.9%) |
| Transportation & Warehousing | 711 (85.8%) | 118 (14.2%) |
| Utilities | 123 (77.4%) | 36 (22.6%) |
| Information | 58 (40.8%) | 84 (59.2%) |
| Finance & Insurance | 127 (26.0%) | 361 (74.0%) |
| Real Estate, Rental & Leasing | 31 (33.3%) | 62 (66.7%) |
| Professional & Scientific | 157 (23.9%) | 499 (76.1%) |
| Enterprise Management | 22 (100.0%) | 0 (0.0%) |
| Administrative & Support | 470 (46.9%) | 532 (53.1%) |
| Educational Services | 194 (13.5%) | 1,243 (86.5%) |
| Health Care & Social Assistance | 706 (21.5%) | 2,581 (78.5%) |
| Arts, Entertainment & Recreation | 101 (100.0%) | 0 (0.0%) |
| Accommodation & Food Services | 362 (37.9%) | 593 (62.1%) |
| Public Administration | 679 (59.7%) | 458 (40.3%) |
| Total | 8,162 (48.7%) | 8,601 (51.3%) |
Education in Washington Parish
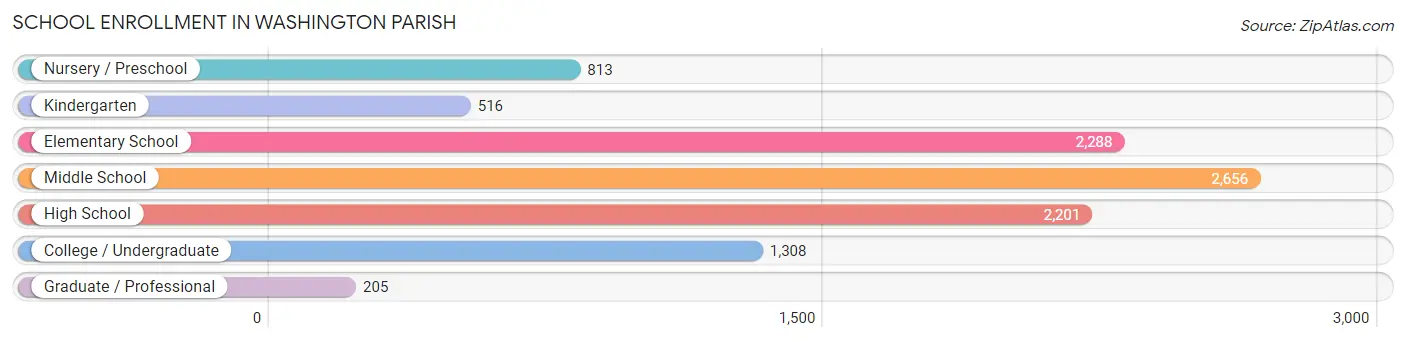
School Enrollment in Washington Parish
The most common levels of schooling among the 9,987 students in Washington Parish are middle school (2,656 | 26.6%), elementary school (2,288 | 22.9%), and high school (2,201 | 22.0%).
| School Level | # Students | % Students |
| Nursery / Preschool | 813 | 8.1% |
| Kindergarten | 516 | 5.2% |
| Elementary School | 2,288 | 22.9% |
| Middle School | 2,656 | 26.6% |
| High School | 2,201 | 22.0% |
| College / Undergraduate | 1,308 | 13.1% |
| Graduate / Professional | 205 | 2.1% |
| Total | 9,987 | 100.0% |
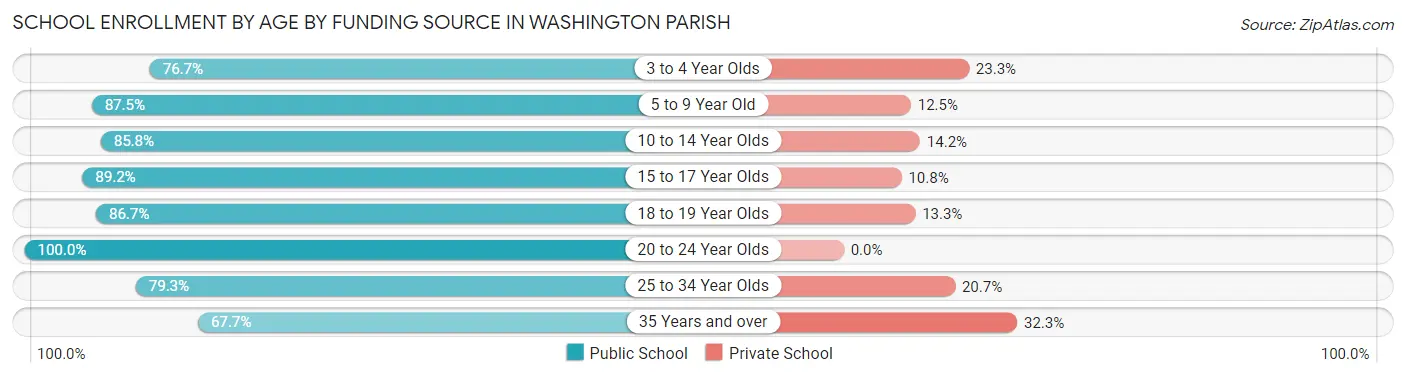
School Enrollment by Age by Funding Source in Washington Parish
Out of a total of 9,987 students who are enrolled in schools in Washington Parish, 1,388 (13.9%) attend a private institution, while the remaining 8,599 (86.1%) are enrolled in public schools. The age group of 35 years and over has the highest likelihood of being enrolled in private schools, with 146 (32.3% in the age bracket) enrolled. Conversely, the age group of 20 to 24 year olds has the lowest likelihood of being enrolled in a private school, with 615 (100.0% in the age bracket) attending a public institution.
| Age Bracket | Public School | Private School |
| 3 to 4 Year Olds | 506 (76.7%) | 154 (23.3%) |
| 5 to 9 Year Old | 2,314 (87.5%) | 331 (12.5%) |
| 10 to 14 Year Olds | 2,646 (85.8%) | 438 (14.2%) |
| 15 to 17 Year Olds | 1,557 (89.2%) | 188 (10.8%) |
| 18 to 19 Year Olds | 397 (86.7%) | 61 (13.3%) |
| 20 to 24 Year Olds | 615 (100.0%) | 0 (0.0%) |
| 25 to 34 Year Olds | 260 (79.3%) | 68 (20.7%) |
| 35 Years and over | 306 (67.7%) | 146 (32.3%) |
| Total | 8,599 (86.1%) | 1,388 (13.9%) |
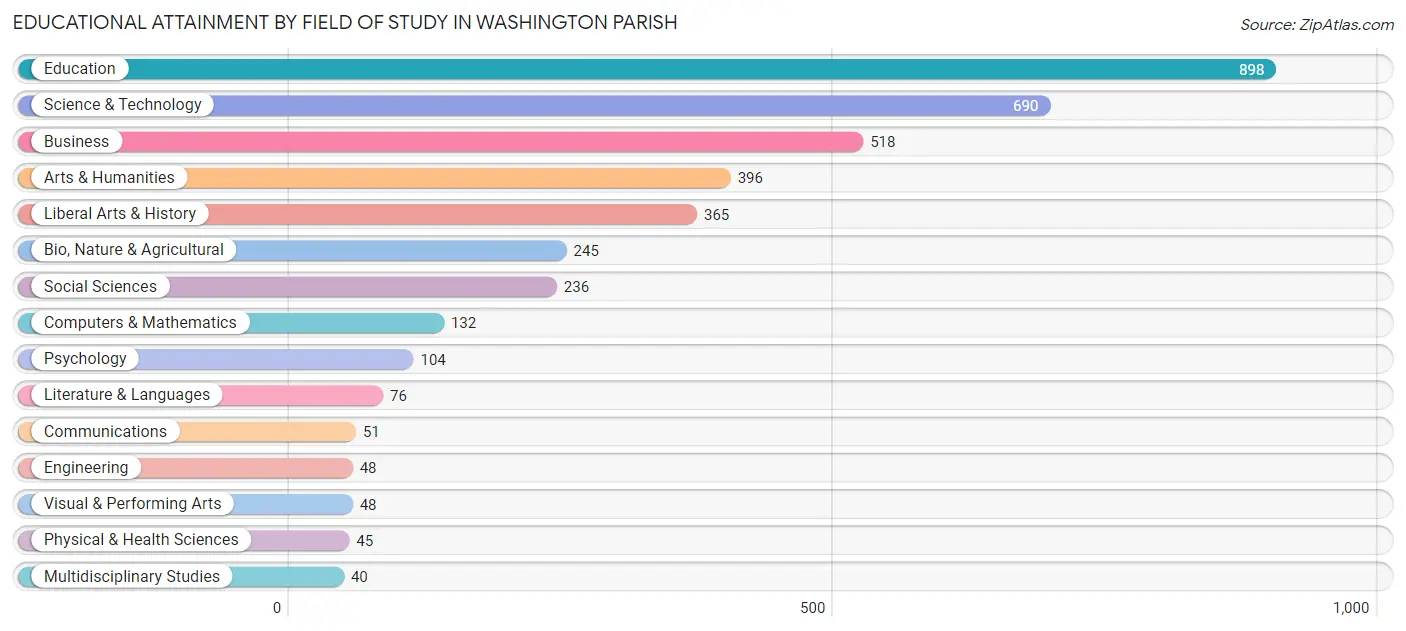
Educational Attainment by Field of Study in Washington Parish
Education (898 | 23.1%), science & technology (690 | 17.7%), business (518 | 13.3%), arts & humanities (396 | 10.2%), and liberal arts & history (365 | 9.4%) are the most common fields of study among 3,892 individuals in Washington Parish who have obtained a bachelor's degree or higher.
| Field of Study | # Graduates | % Graduates |
| Computers & Mathematics | 132 | 3.4% |
| Bio, Nature & Agricultural | 245 | 6.3% |
| Physical & Health Sciences | 45 | 1.2% |
| Psychology | 104 | 2.7% |
| Social Sciences | 236 | 6.1% |
| Engineering | 48 | 1.2% |
| Multidisciplinary Studies | 40 | 1.0% |
| Science & Technology | 690 | 17.7% |
| Business | 518 | 13.3% |
| Education | 898 | 23.1% |
| Literature & Languages | 76 | 1.9% |
| Liberal Arts & History | 365 | 9.4% |
| Visual & Performing Arts | 48 | 1.2% |
| Communications | 51 | 1.3% |
| Arts & Humanities | 396 | 10.2% |
| Total | 3,892 | 100.0% |
Transportation & Commute in Washington Parish
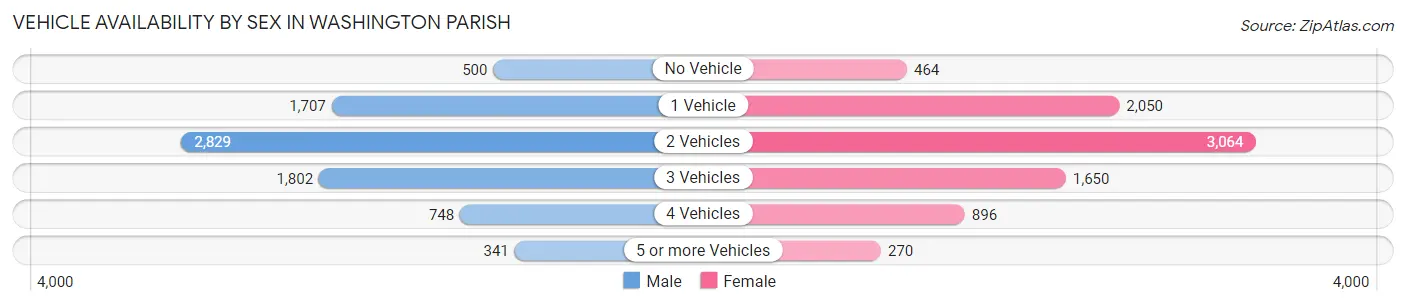
Vehicle Availability by Sex in Washington Parish
The most prevalent vehicle ownership categories in Washington Parish are males with 2 vehicles (2,829, accounting for 35.7%) and females with 2 vehicles (3,064, making up 33.7%).
| Vehicles Available | Male | Female |
| No Vehicle | 500 (6.3%) | 464 (5.5%) |
| 1 Vehicle | 1,707 (21.5%) | 2,050 (24.4%) |
| 2 Vehicles | 2,829 (35.7%) | 3,064 (36.5%) |
| 3 Vehicles | 1,802 (22.7%) | 1,650 (19.7%) |
| 4 Vehicles | 748 (9.4%) | 896 (10.7%) |
| 5 or more Vehicles | 341 (4.3%) | 270 (3.2%) |
| Total | 7,927 (100.0%) | 8,394 (100.0%) |
Commute Time in Washington Parish
The most frequently occuring commute durations in Washington Parish are 10 to 14 minutes (2,781 commuters, 17.5%), 5 to 9 minutes (2,479 commuters, 15.6%), and 15 to 19 minutes (1,852 commuters, 11.7%).
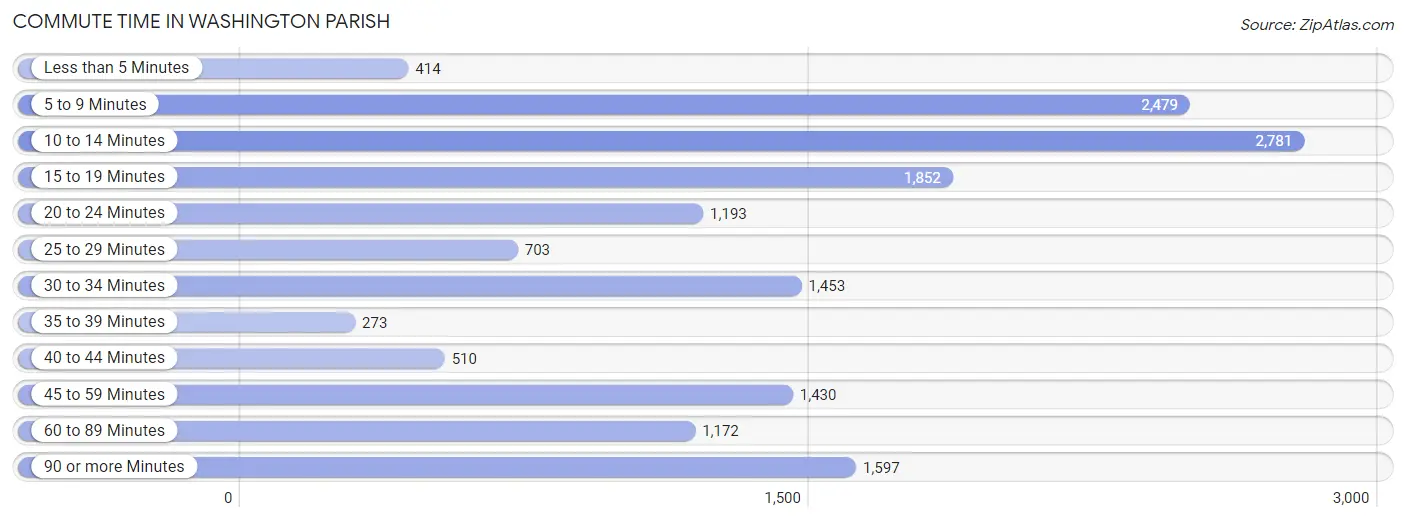
| Commute Time | # Commuters | % Commuters |
| Less than 5 Minutes | 414 | 2.6% |
| 5 to 9 Minutes | 2,479 | 15.6% |
| 10 to 14 Minutes | 2,781 | 17.5% |
| 15 to 19 Minutes | 1,852 | 11.7% |
| 20 to 24 Minutes | 1,193 | 7.5% |
| 25 to 29 Minutes | 703 | 4.4% |
| 30 to 34 Minutes | 1,453 | 9.2% |
| 35 to 39 Minutes | 273 | 1.7% |
| 40 to 44 Minutes | 510 | 3.2% |
| 45 to 59 Minutes | 1,430 | 9.0% |
| 60 to 89 Minutes | 1,172 | 7.4% |
| 90 or more Minutes | 1,597 | 10.1% |
Commute Time by Sex in Washington Parish
The most common commute times in Washington Parish are 10 to 14 minutes (1,356 commuters, 17.5%) for males and 10 to 14 minutes (1,425 commuters, 17.5%) for females.
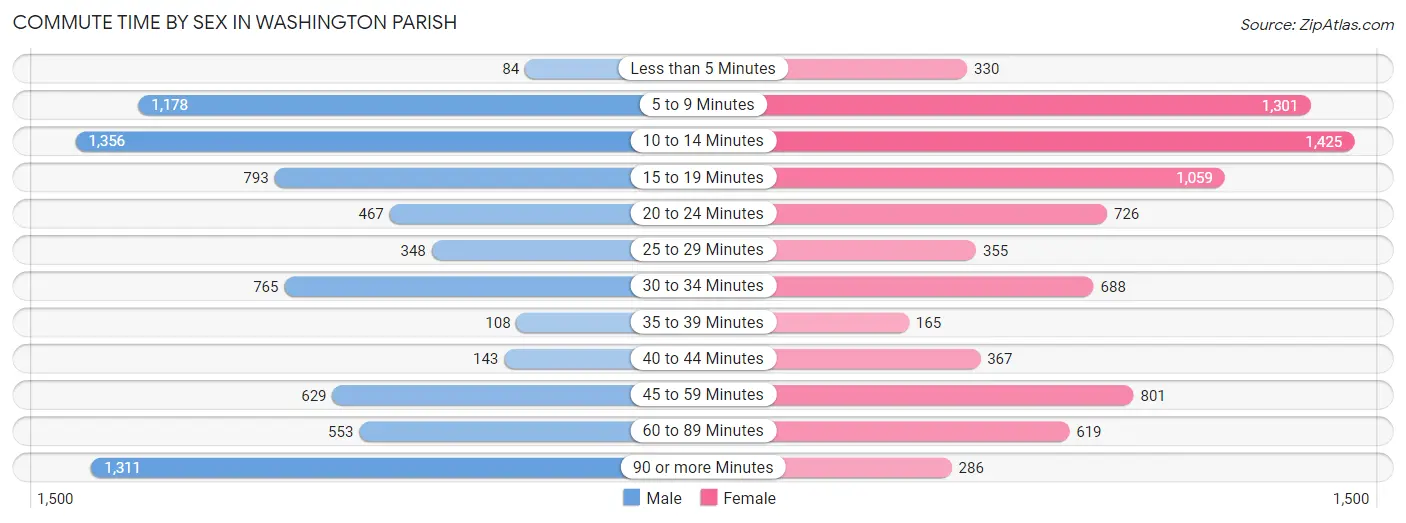
| Commute Time | Male | Female |
| Less than 5 Minutes | 84 (1.1%) | 330 (4.1%) |
| 5 to 9 Minutes | 1,178 (15.2%) | 1,301 (16.0%) |
| 10 to 14 Minutes | 1,356 (17.5%) | 1,425 (17.5%) |
| 15 to 19 Minutes | 793 (10.2%) | 1,059 (13.0%) |
| 20 to 24 Minutes | 467 (6.0%) | 726 (8.9%) |
| 25 to 29 Minutes | 348 (4.5%) | 355 (4.4%) |
| 30 to 34 Minutes | 765 (9.9%) | 688 (8.5%) |
| 35 to 39 Minutes | 108 (1.4%) | 165 (2.0%) |
| 40 to 44 Minutes | 143 (1.8%) | 367 (4.5%) |
| 45 to 59 Minutes | 629 (8.1%) | 801 (9.9%) |
| 60 to 89 Minutes | 553 (7.1%) | 619 (7.6%) |
| 90 or more Minutes | 1,311 (17.0%) | 286 (3.5%) |
Time of Departure to Work by Sex in Washington Parish
The most frequent times of departure to work in Washington Parish are 6:00 AM to 6:29 AM (1,607, 20.8%) for males and 7:00 AM to 7:29 AM (1,817, 22.4%) for females.
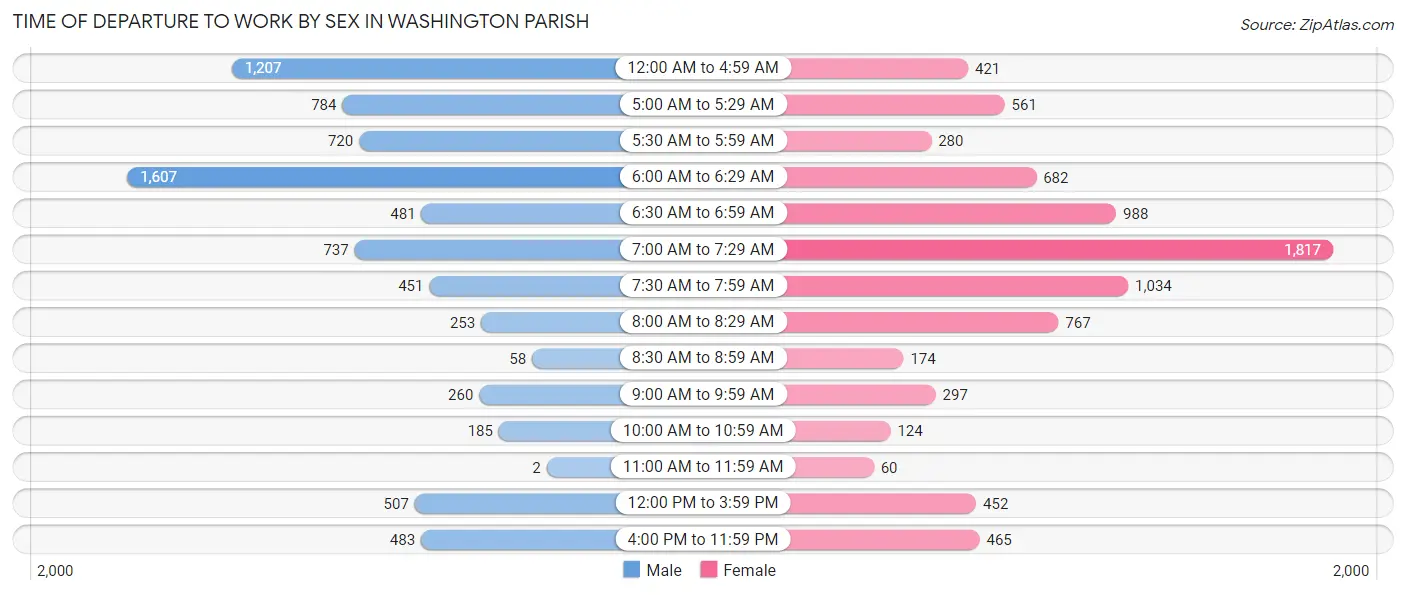
| Time of Departure | Male | Female |
| 12:00 AM to 4:59 AM | 1,207 (15.6%) | 421 (5.2%) |
| 5:00 AM to 5:29 AM | 784 (10.1%) | 561 (6.9%) |
| 5:30 AM to 5:59 AM | 720 (9.3%) | 280 (3.5%) |
| 6:00 AM to 6:29 AM | 1,607 (20.8%) | 682 (8.4%) |
| 6:30 AM to 6:59 AM | 481 (6.2%) | 988 (12.2%) |
| 7:00 AM to 7:29 AM | 737 (9.5%) | 1,817 (22.4%) |
| 7:30 AM to 7:59 AM | 451 (5.8%) | 1,034 (12.7%) |
| 8:00 AM to 8:29 AM | 253 (3.3%) | 767 (9.4%) |
| 8:30 AM to 8:59 AM | 58 (0.7%) | 174 (2.1%) |
| 9:00 AM to 9:59 AM | 260 (3.4%) | 297 (3.7%) |
| 10:00 AM to 10:59 AM | 185 (2.4%) | 124 (1.5%) |
| 11:00 AM to 11:59 AM | 2 (0.0%) | 60 (0.7%) |
| 12:00 PM to 3:59 PM | 507 (6.6%) | 452 (5.6%) |
| 4:00 PM to 11:59 PM | 483 (6.2%) | 465 (5.7%) |
| Total | 7,735 (100.0%) | 8,122 (100.0%) |
Housing Occupancy in Washington Parish
Occupancy by Ownership in Washington Parish
Of the total 17,162 dwellings in Washington Parish, owner-occupied units account for 11,586 (67.5%), while renter-occupied units make up 5,576 (32.5%).
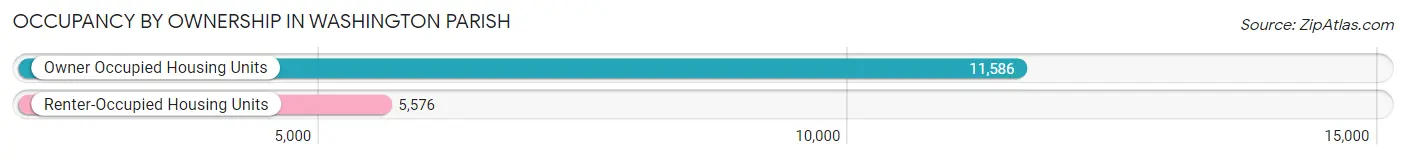
| Occupancy | # Housing Units | % Housing Units |
| Owner Occupied Housing Units | 11,586 | 67.5% |
| Renter-Occupied Housing Units | 5,576 | 32.5% |
| Total Occupied Housing Units | 17,162 | 100.0% |
Occupancy by Household Size in Washington Parish
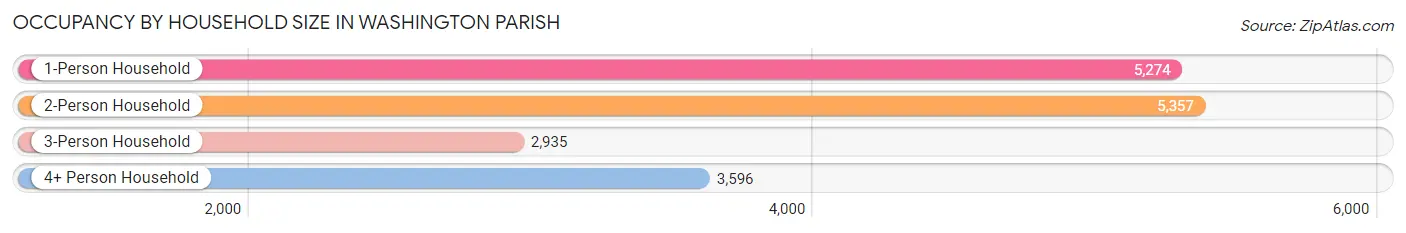
| Household Size | # Housing Units | % Housing Units |
| 1-Person Household | 5,274 | 30.7% |
| 2-Person Household | 5,357 | 31.2% |
| 3-Person Household | 2,935 | 17.1% |
| 4+ Person Household | 3,596 | 20.9% |
| Total Housing Units | 17,162 | 100.0% |
Occupancy by Ownership by Household Size in Washington Parish
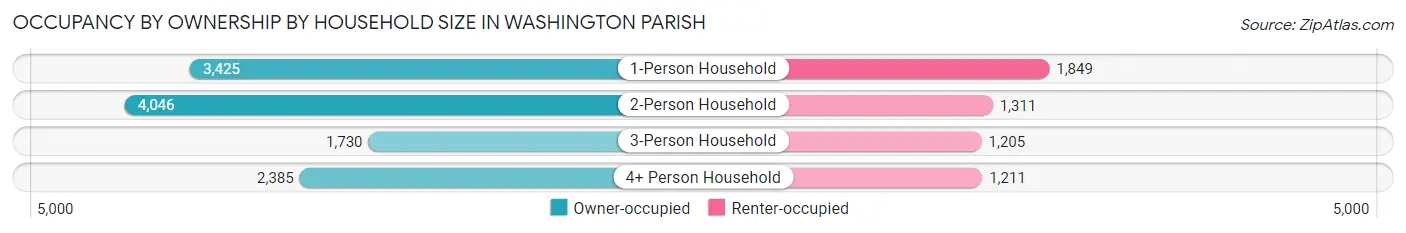
| Household Size | Owner-occupied | Renter-occupied |
| 1-Person Household | 3,425 (64.9%) | 1,849 (35.1%) |
| 2-Person Household | 4,046 (75.5%) | 1,311 (24.5%) |
| 3-Person Household | 1,730 (58.9%) | 1,205 (41.1%) |
| 4+ Person Household | 2,385 (66.3%) | 1,211 (33.7%) |
| Total Housing Units | 11,586 (67.5%) | 5,576 (32.5%) |
Occupancy by Educational Attainment in Washington Parish
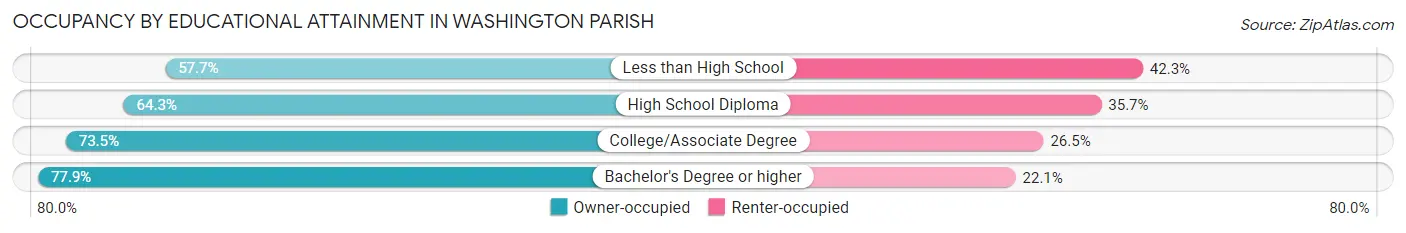
| Household Size | Owner-occupied | Renter-occupied |
| Less than High School | 1,556 (57.7%) | 1,141 (42.3%) |
| High School Diploma | 4,815 (64.3%) | 2,676 (35.7%) |
| College/Associate Degree | 3,595 (73.5%) | 1,299 (26.5%) |
| Bachelor's Degree or higher | 1,620 (77.9%) | 460 (22.1%) |
Occupancy by Age of Householder in Washington Parish
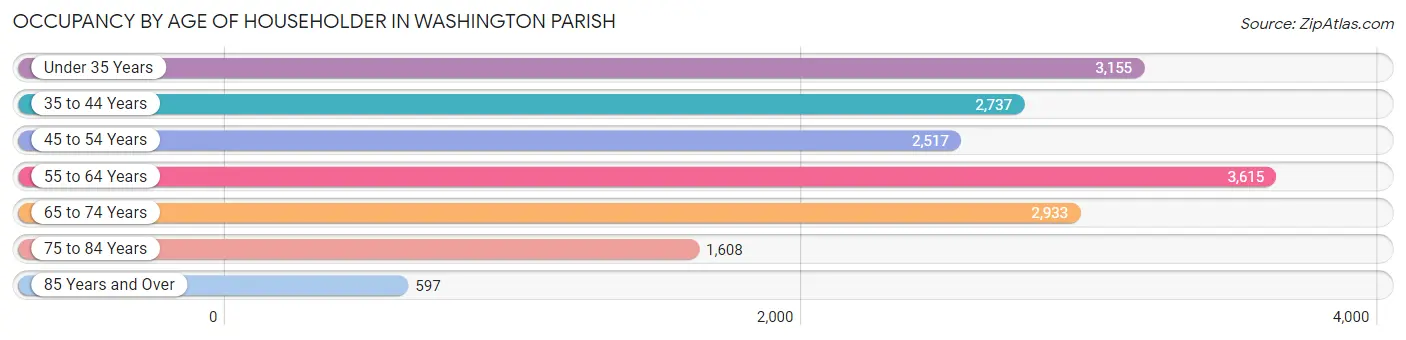
| Age Bracket | # Households | % Households |
| Under 35 Years | 3,155 | 18.4% |
| 35 to 44 Years | 2,737 | 16.0% |
| 45 to 54 Years | 2,517 | 14.7% |
| 55 to 64 Years | 3,615 | 21.1% |
| 65 to 74 Years | 2,933 | 17.1% |
| 75 to 84 Years | 1,608 | 9.4% |
| 85 Years and Over | 597 | 3.5% |
| Total | 17,162 | 100.0% |
Housing Finances in Washington Parish
Median Income by Occupancy in Washington Parish
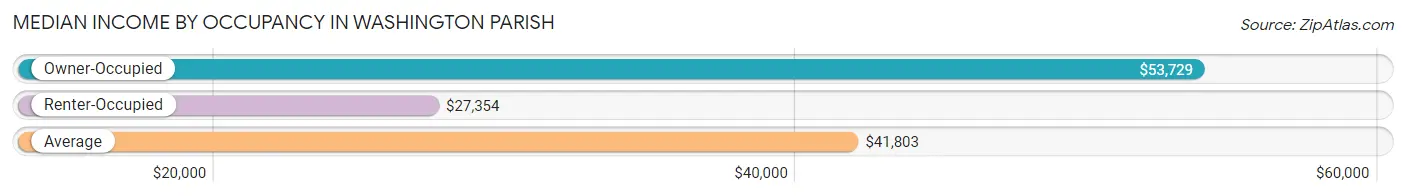
| Occupancy Type | # Households | Median Income |
| Owner-Occupied | 11,586 (67.5%) | $53,729 |
| Renter-Occupied | 5,576 (32.5%) | $27,354 |
| Average | 17,162 (100.0%) | $41,803 |
Occupancy by Householder Income Bracket in Washington Parish
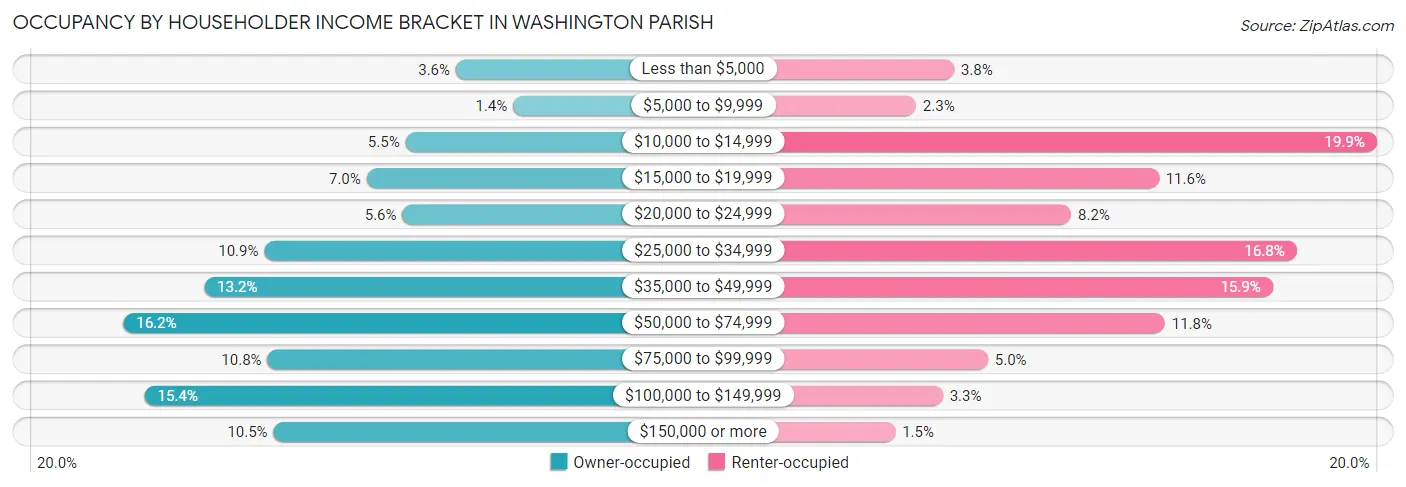
| Income Bracket | Owner-occupied | Renter-occupied |
| Less than $5,000 | 414 (3.6%) | 209 (3.7%) |
| $5,000 to $9,999 | 161 (1.4%) | 128 (2.3%) |
| $10,000 to $14,999 | 636 (5.5%) | 1,107 (19.9%) |
| $15,000 to $19,999 | 807 (7.0%) | 644 (11.6%) |
| $20,000 to $24,999 | 650 (5.6%) | 458 (8.2%) |
| $25,000 to $34,999 | 1,259 (10.9%) | 937 (16.8%) |
| $35,000 to $49,999 | 1,525 (13.2%) | 886 (15.9%) |
| $50,000 to $74,999 | 1,882 (16.2%) | 657 (11.8%) |
| $75,000 to $99,999 | 1,245 (10.7%) | 281 (5.0%) |
| $100,000 to $149,999 | 1,788 (15.4%) | 185 (3.3%) |
| $150,000 or more | 1,219 (10.5%) | 84 (1.5%) |
| Total | 11,586 (100.0%) | 5,576 (100.0%) |
Monthly Housing Cost Tiers in Washington Parish
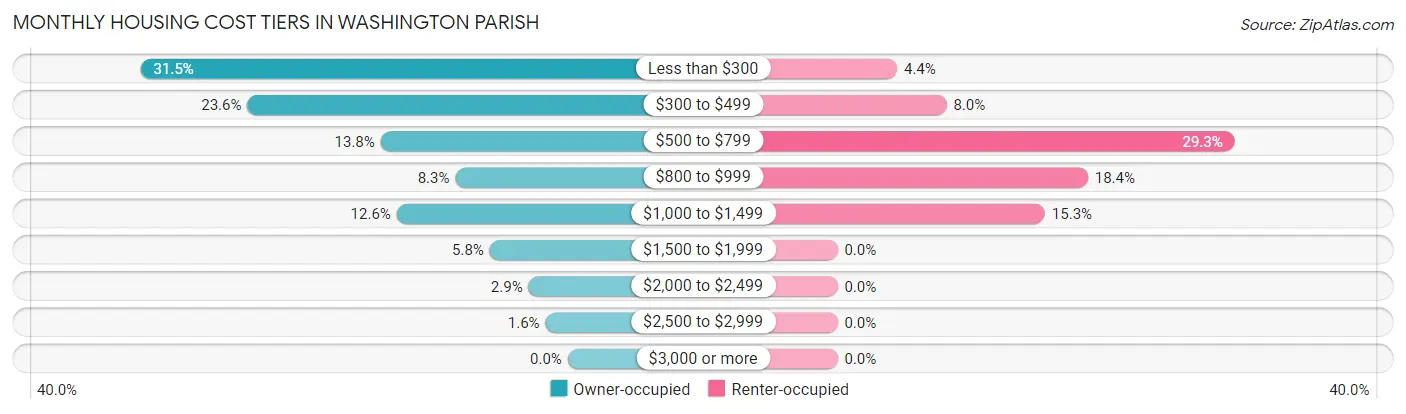
| Monthly Cost | Owner-occupied | Renter-occupied |
| Less than $300 | 3,646 (31.5%) | 245 (4.4%) |
| $300 to $499 | 2,734 (23.6%) | 448 (8.0%) |
| $500 to $799 | 1,596 (13.8%) | 1,631 (29.2%) |
| $800 to $999 | 959 (8.3%) | 1,028 (18.4%) |
| $1,000 to $1,499 | 1,460 (12.6%) | 852 (15.3%) |
| $1,500 to $1,999 | 666 (5.8%) | 0 (0.0%) |
| $2,000 to $2,499 | 335 (2.9%) | 0 (0.0%) |
| $2,500 to $2,999 | 190 (1.6%) | 0 (0.0%) |
| $3,000 or more | 0 (0.0%) | 0 (0.0%) |
| Total | 11,586 (100.0%) | 5,576 (100.0%) |
Physical Housing Characteristics in Washington Parish
Housing Structures in Washington Parish
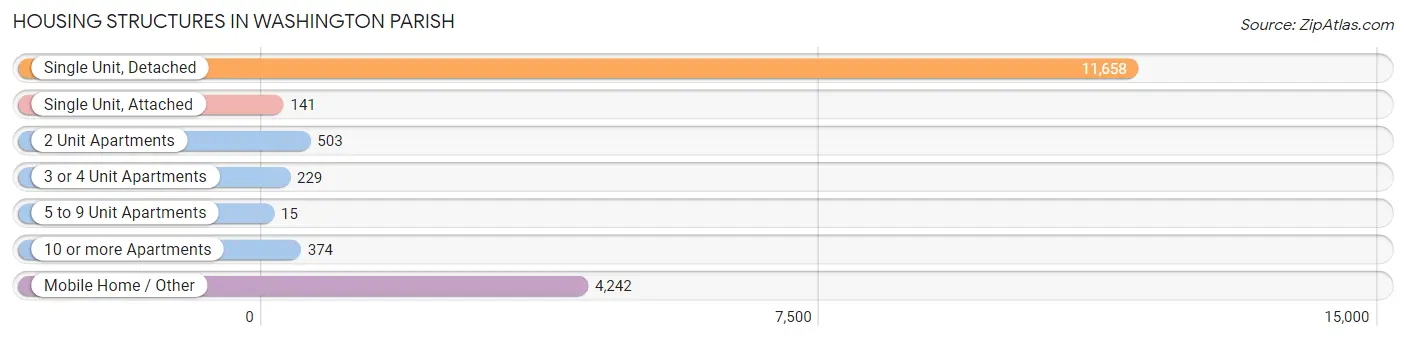
| Structure Type | # Housing Units | % Housing Units |
| Single Unit, Detached | 11,658 | 67.9% |
| Single Unit, Attached | 141 | 0.8% |
| 2 Unit Apartments | 503 | 2.9% |
| 3 or 4 Unit Apartments | 229 | 1.3% |
| 5 to 9 Unit Apartments | 15 | 0.1% |
| 10 or more Apartments | 374 | 2.2% |
| Mobile Home / Other | 4,242 | 24.7% |
| Total | 17,162 | 100.0% |
Housing Structures by Occupancy in Washington Parish
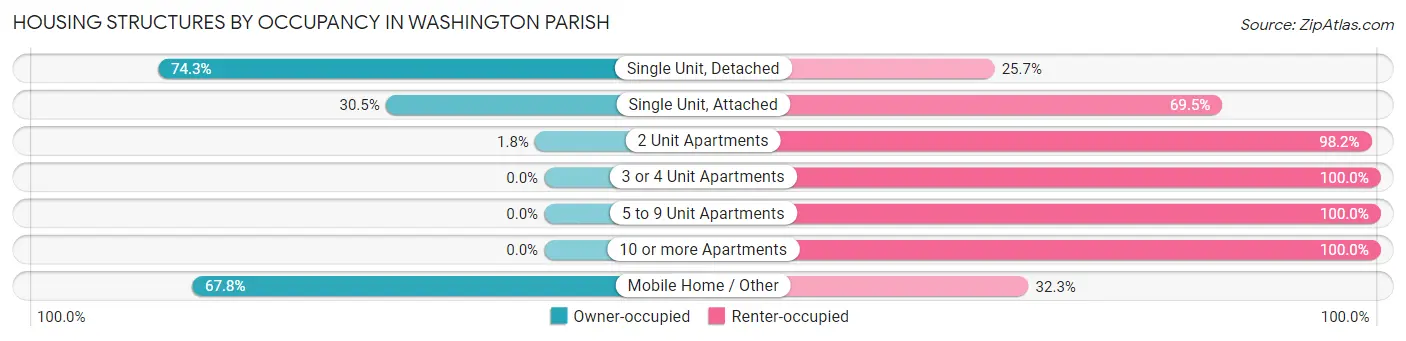
| Structure Type | Owner-occupied | Renter-occupied |
| Single Unit, Detached | 8,660 (74.3%) | 2,998 (25.7%) |
| Single Unit, Attached | 43 (30.5%) | 98 (69.5%) |
| 2 Unit Apartments | 9 (1.8%) | 494 (98.2%) |
| 3 or 4 Unit Apartments | 0 (0.0%) | 229 (100.0%) |
| 5 to 9 Unit Apartments | 0 (0.0%) | 15 (100.0%) |
| 10 or more Apartments | 0 (0.0%) | 374 (100.0%) |
| Mobile Home / Other | 2,874 (67.7%) | 1,368 (32.3%) |
| Total | 11,586 (67.5%) | 5,576 (32.5%) |
Housing Structures by Number of Rooms in Washington Parish
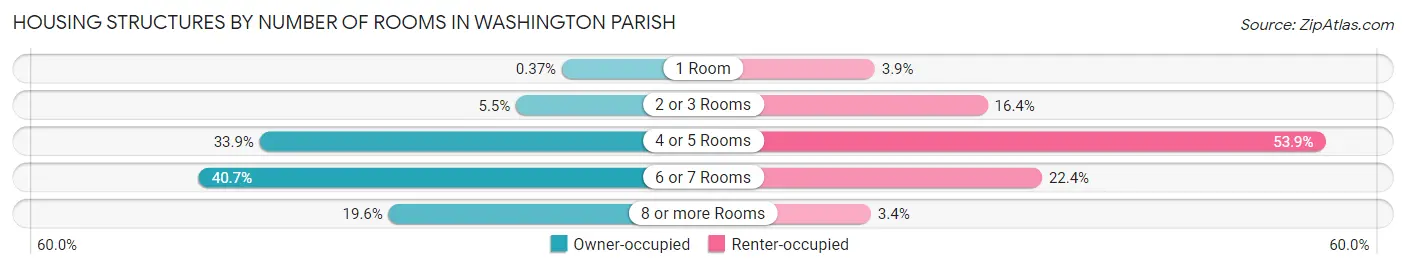
| Number of Rooms | Owner-occupied | Renter-occupied |
| 1 Room | 43 (0.4%) | 216 (3.9%) |
| 2 or 3 Rooms | 632 (5.4%) | 914 (16.4%) |
| 4 or 5 Rooms | 3,929 (33.9%) | 3,004 (53.9%) |
| 6 or 7 Rooms | 4,711 (40.7%) | 1,250 (22.4%) |
| 8 or more Rooms | 2,271 (19.6%) | 192 (3.4%) |
| Total | 11,586 (100.0%) | 5,576 (100.0%) |
Housing Structure by Heating Type in Washington Parish
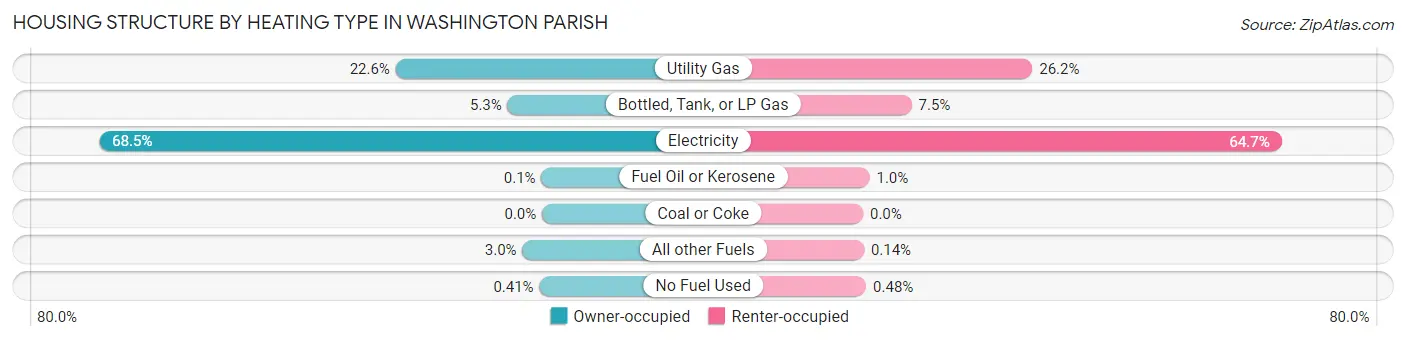
| Heating Type | Owner-occupied | Renter-occupied |
| Utility Gas | 2,622 (22.6%) | 1,459 (26.2%) |
| Bottled, Tank, or LP Gas | 618 (5.3%) | 419 (7.5%) |
| Electricity | 7,934 (68.5%) | 3,607 (64.7%) |
| Fuel Oil or Kerosene | 12 (0.1%) | 56 (1.0%) |
| Coal or Coke | 0 (0.0%) | 0 (0.0%) |
| All other Fuels | 352 (3.0%) | 8 (0.1%) |
| No Fuel Used | 48 (0.4%) | 27 (0.5%) |
| Total | 11,586 (100.0%) | 5,576 (100.0%) |
Household Vehicle Usage in Washington Parish
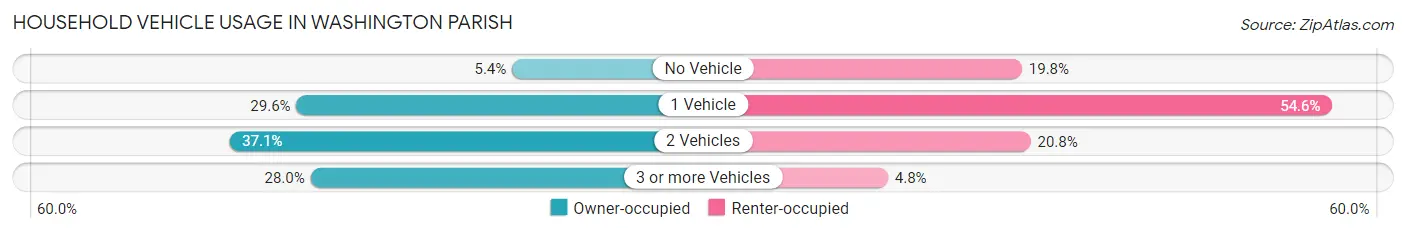
| Vehicles per Household | Owner-occupied | Renter-occupied |
| No Vehicle | 625 (5.4%) | 1,105 (19.8%) |
| 1 Vehicle | 3,424 (29.5%) | 3,044 (54.6%) |
| 2 Vehicles | 4,296 (37.1%) | 1,159 (20.8%) |
| 3 or more Vehicles | 3,241 (28.0%) | 268 (4.8%) |
| Total | 11,586 (100.0%) | 5,576 (100.0%) |
Real Estate & Mortgages in Washington Parish
Real Estate and Mortgage Overview in Washington Parish
| Characteristic | Without Mortgage | With Mortgage |
| Housing Units | 7,441 | 4,145 |
| Median Property Value | $108,400 | $166,300 |
| Median Household Income | $44,121 | $798 |
| Monthly Housing Costs | $304 | $0 |
| Real Estate Taxes | $327 | $1,021 |
Property Value by Mortgage Status in Washington Parish
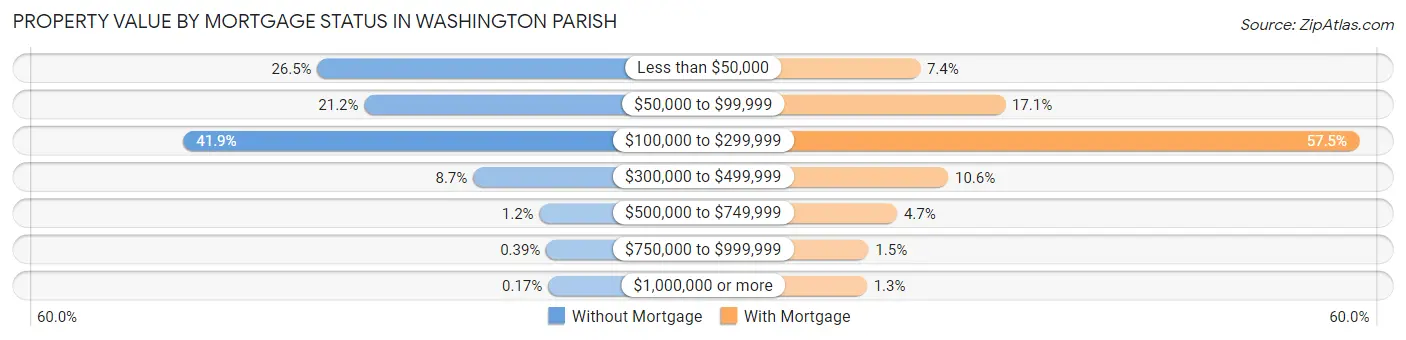
| Property Value | Without Mortgage | With Mortgage |
| Less than $50,000 | 1,974 (26.5%) | 305 (7.4%) |
| $50,000 to $99,999 | 1,575 (21.2%) | 708 (17.1%) |
| $100,000 to $299,999 | 3,114 (41.8%) | 2,384 (57.5%) |
| $300,000 to $499,999 | 650 (8.7%) | 438 (10.6%) |
| $500,000 to $749,999 | 86 (1.2%) | 196 (4.7%) |
| $750,000 to $999,999 | 29 (0.4%) | 61 (1.5%) |
| $1,000,000 or more | 13 (0.2%) | 53 (1.3%) |
| Total | 7,441 (100.0%) | 4,145 (100.0%) |
Household Income by Mortgage Status in Washington Parish
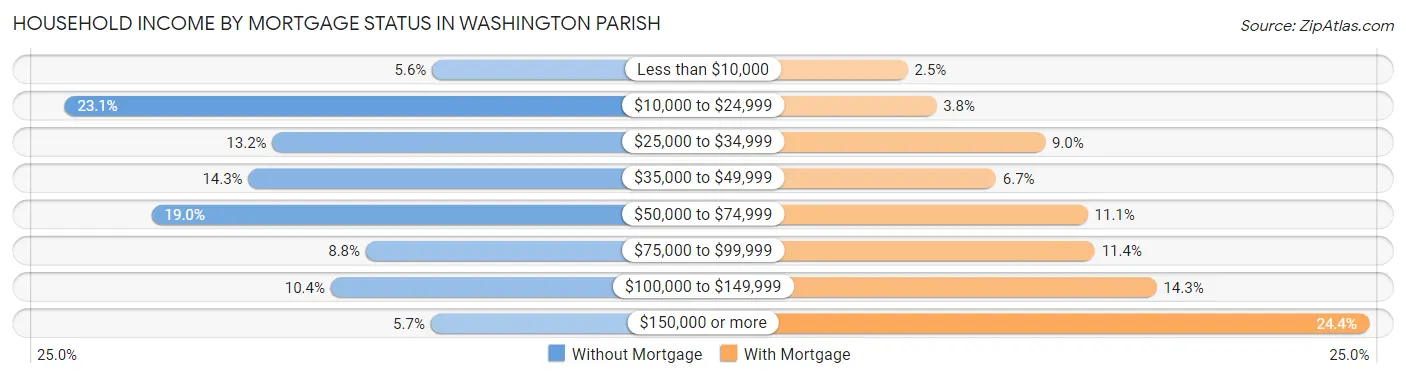
| Household Income | Without Mortgage | With Mortgage |
| Less than $10,000 | 416 (5.6%) | 103 (2.5%) |
| $10,000 to $24,999 | 1,719 (23.1%) | 159 (3.8%) |
| $25,000 to $34,999 | 982 (13.2%) | 374 (9.0%) |
| $35,000 to $49,999 | 1,067 (14.3%) | 277 (6.7%) |
| $50,000 to $74,999 | 1,410 (19.0%) | 458 (11.1%) |
| $75,000 to $99,999 | 651 (8.7%) | 472 (11.4%) |
| $100,000 to $149,999 | 775 (10.4%) | 594 (14.3%) |
| $150,000 or more | 421 (5.7%) | 1,013 (24.4%) |
| Total | 7,441 (100.0%) | 4,145 (100.0%) |
Property Value to Household Income Ratio in Washington Parish
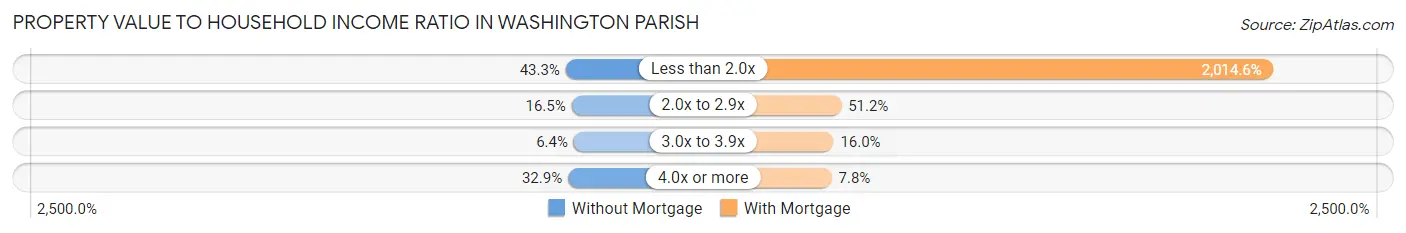
| Value-to-Income Ratio | Without Mortgage | With Mortgage |
| Less than 2.0x | 3,224 (43.3%) | 83,504 (2,014.6%) |
| 2.0x to 2.9x | 1,231 (16.5%) | 2,122 (51.2%) |
| 3.0x to 3.9x | 474 (6.4%) | 663 (16.0%) |
| 4.0x or more | 2,448 (32.9%) | 323 (7.8%) |
| Total | 7,441 (100.0%) | 4,145 (100.0%) |
Real Estate Taxes by Mortgage Status in Washington Parish
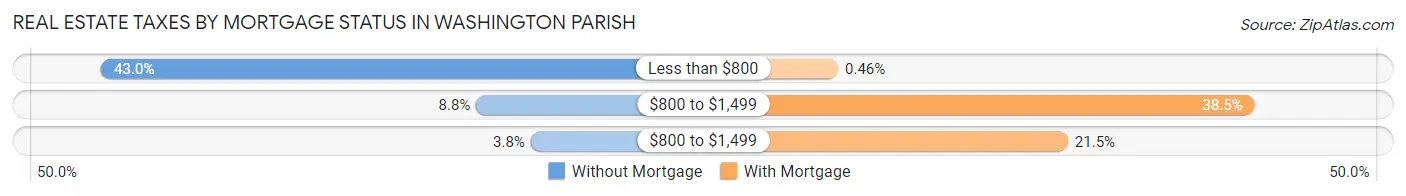
| Property Taxes | Without Mortgage | With Mortgage |
| Less than $800 | 3,201 (43.0%) | 19 (0.5%) |
| $800 to $1,499 | 652 (8.8%) | 1,596 (38.5%) |
| $800 to $1,499 | 281 (3.8%) | 889 (21.4%) |
| Total | 7,441 (100.0%) | 4,145 (100.0%) |
Health & Disability in Washington Parish
Health Insurance Coverage by Age in Washington Parish
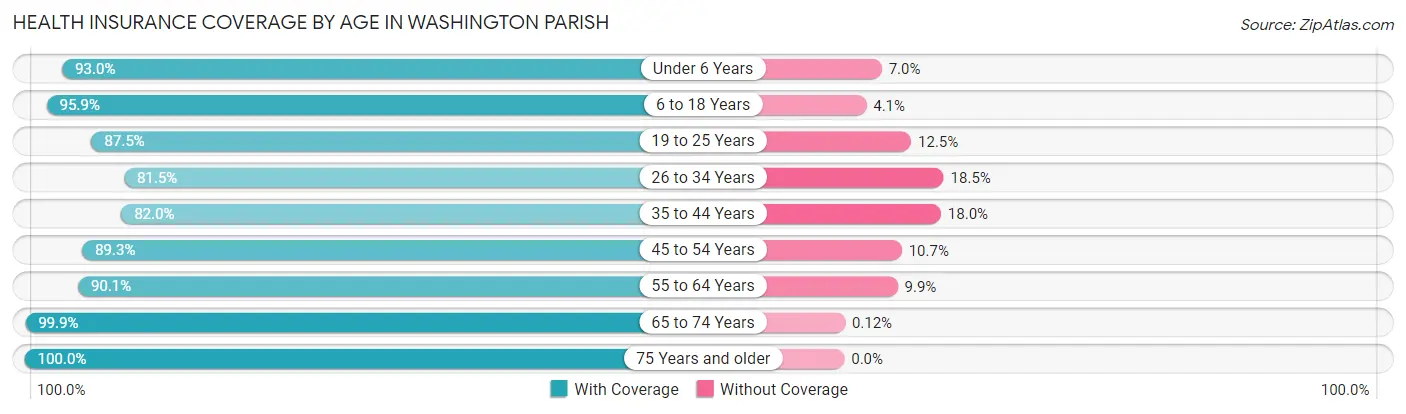
| Age Bracket | With Coverage | Without Coverage |
| Under 6 Years | 2,974 (93.0%) | 223 (7.0%) |
| 6 to 18 Years | 7,445 (95.9%) | 318 (4.1%) |
| 19 to 25 Years | 3,085 (87.5%) | 439 (12.5%) |
| 26 to 34 Years | 3,751 (81.5%) | 853 (18.5%) |
| 35 to 44 Years | 4,632 (82.0%) | 1,018 (18.0%) |
| 45 to 54 Years | 4,451 (89.3%) | 534 (10.7%) |
| 55 to 64 Years | 5,335 (90.1%) | 589 (9.9%) |
| 65 to 74 Years | 4,897 (99.9%) | 6 (0.1%) |
| 75 Years and older | 3,304 (100.0%) | 0 (0.0%) |
| Total | 39,874 (90.9%) | 3,980 (9.1%) |
Health Insurance Coverage by Citizenship Status in Washington Parish
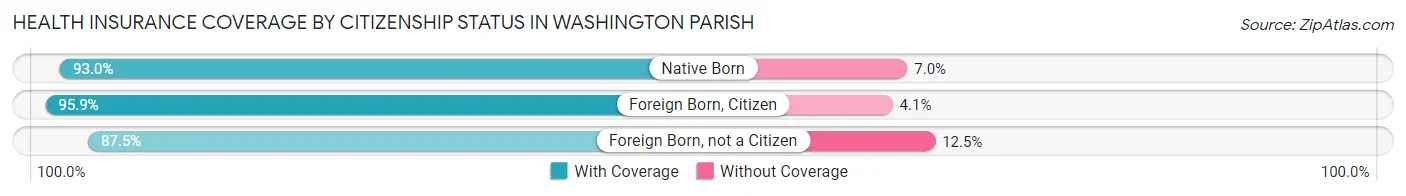
| Citizenship Status | With Coverage | Without Coverage |
| Native Born | 2,974 (93.0%) | 223 (7.0%) |
| Foreign Born, Citizen | 7,445 (95.9%) | 318 (4.1%) |
| Foreign Born, not a Citizen | 3,085 (87.5%) | 439 (12.5%) |
Health Insurance Coverage by Household Income in Washington Parish
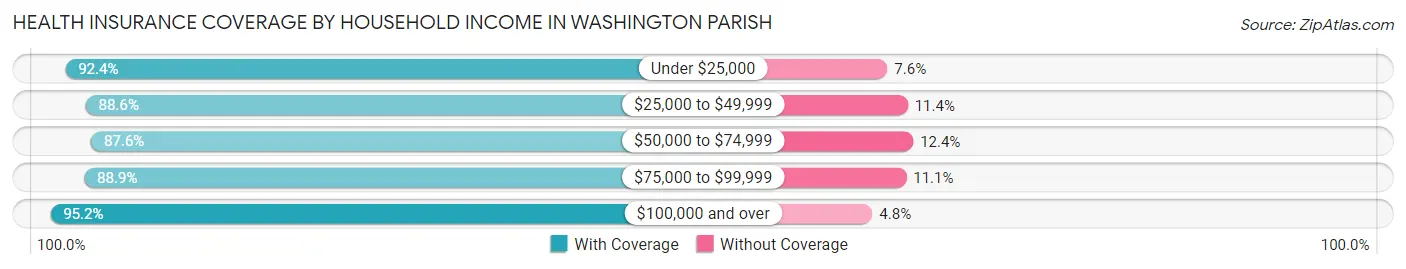
| Household Income | With Coverage | Without Coverage |
| Under $25,000 | 8,758 (92.4%) | 721 (7.6%) |
| $25,000 to $49,999 | 9,784 (88.6%) | 1,261 (11.4%) |
| $50,000 to $74,999 | 6,512 (87.6%) | 925 (12.4%) |
| $75,000 to $99,999 | 4,362 (88.9%) | 547 (11.1%) |
| $100,000 and over | 10,430 (95.2%) | 526 (4.8%) |
Public vs Private Health Insurance Coverage by Age in Washington Parish
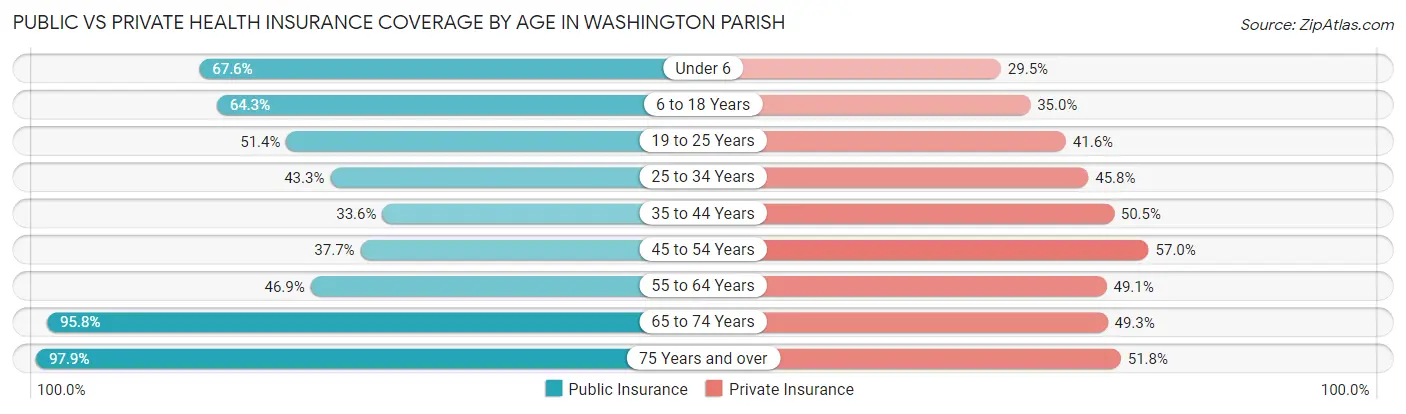
| Age Bracket | Public Insurance | Private Insurance |
| Under 6 | 2,160 (67.6%) | 944 (29.5%) |
| 6 to 18 Years | 4,993 (64.3%) | 2,715 (35.0%) |
| 19 to 25 Years | 1,812 (51.4%) | 1,466 (41.6%) |
| 25 to 34 Years | 1,992 (43.3%) | 2,107 (45.8%) |
| 35 to 44 Years | 1,899 (33.6%) | 2,852 (50.5%) |
| 45 to 54 Years | 1,878 (37.7%) | 2,839 (57.0%) |
| 55 to 64 Years | 2,780 (46.9%) | 2,911 (49.1%) |
| 65 to 74 Years | 4,699 (95.8%) | 2,418 (49.3%) |
| 75 Years and over | 3,234 (97.9%) | 1,711 (51.8%) |
| Total | 25,447 (58.0%) | 19,963 (45.5%) |
Disability Status by Sex by Age in Washington Parish
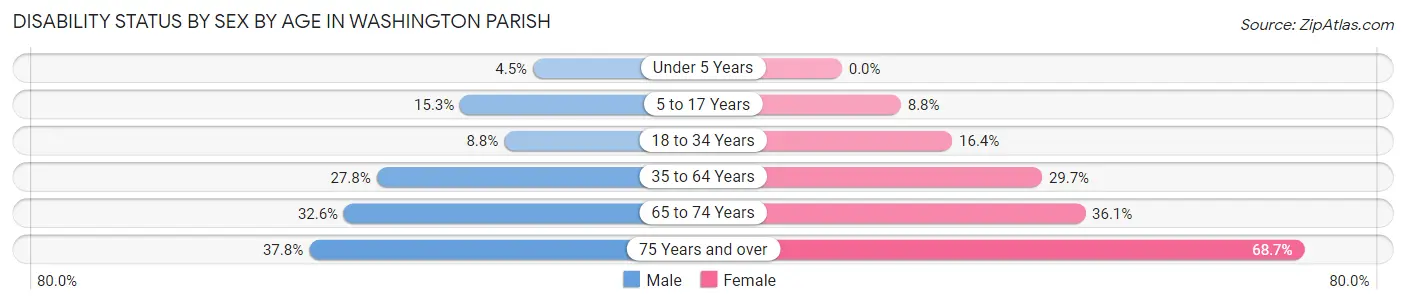
| Age Bracket | Male | Female |
| Under 5 Years | 68 (4.5%) | 0 (0.0%) |
| 5 to 17 Years | 602 (15.3%) | 330 (8.8%) |
| 18 to 34 Years | 359 (8.8%) | 738 (16.4%) |
| 35 to 64 Years | 2,281 (27.8%) | 2,478 (29.7%) |
| 65 to 74 Years | 746 (32.6%) | 944 (36.1%) |
| 75 Years and over | 534 (37.8%) | 1,298 (68.7%) |
Disability Class by Sex by Age in Washington Parish
Disability Class: Hearing Difficulty
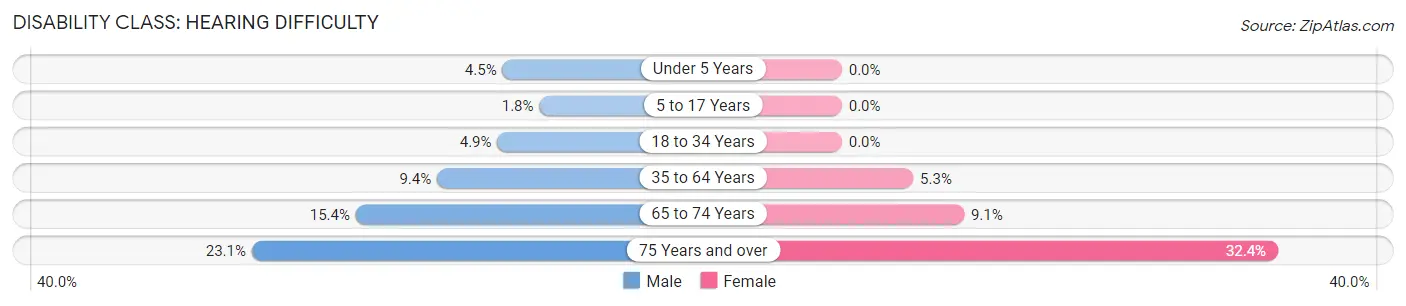
| Age Bracket | Male | Female |
| Under 5 Years | 68 (4.5%) | 0 (0.0%) |
| 5 to 17 Years | 70 (1.8%) | 0 (0.0%) |
| 18 to 34 Years | 200 (4.9%) | 0 (0.0%) |
| 35 to 64 Years | 771 (9.4%) | 442 (5.3%) |
| 65 to 74 Years | 353 (15.4%) | 237 (9.1%) |
| 75 Years and over | 327 (23.1%) | 612 (32.4%) |
Disability Class: Vision Difficulty
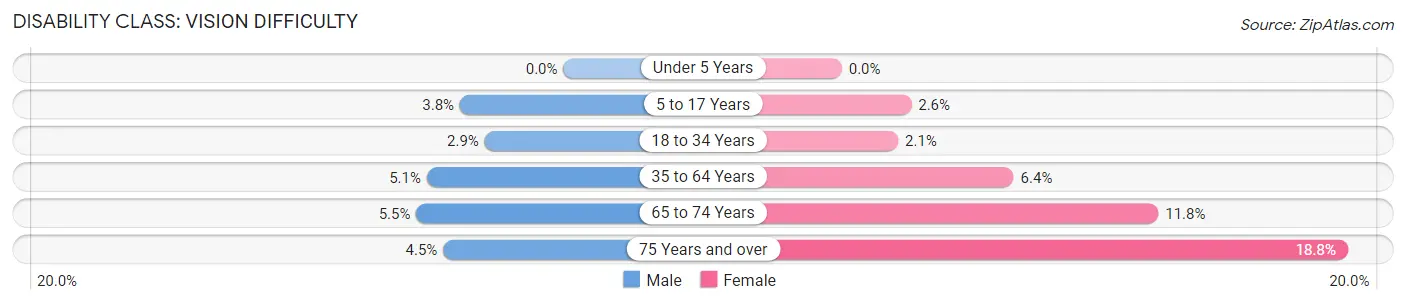
| Age Bracket | Male | Female |
| Under 5 Years | 0 (0.0%) | 0 (0.0%) |
| 5 to 17 Years | 151 (3.8%) | 97 (2.6%) |
| 18 to 34 Years | 119 (2.9%) | 94 (2.1%) |
| 35 to 64 Years | 417 (5.1%) | 532 (6.4%) |
| 65 to 74 Years | 125 (5.5%) | 307 (11.7%) |
| 75 Years and over | 63 (4.5%) | 355 (18.8%) |
Disability Class: Cognitive Difficulty
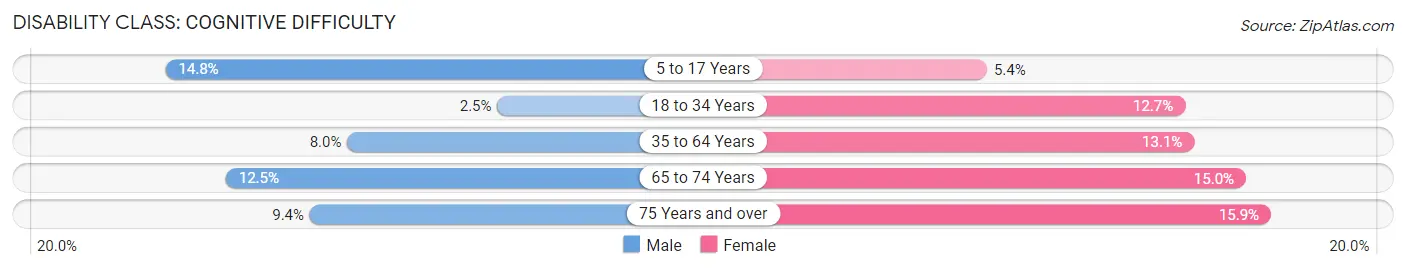
| Age Bracket | Male | Female |
| 5 to 17 Years | 580 (14.8%) | 203 (5.4%) |
| 18 to 34 Years | 100 (2.5%) | 574 (12.7%) |
| 35 to 64 Years | 659 (8.0%) | 1,091 (13.1%) |
| 65 to 74 Years | 287 (12.5%) | 392 (15.0%) |
| 75 Years and over | 133 (9.4%) | 301 (15.9%) |
Disability Class: Ambulatory Difficulty
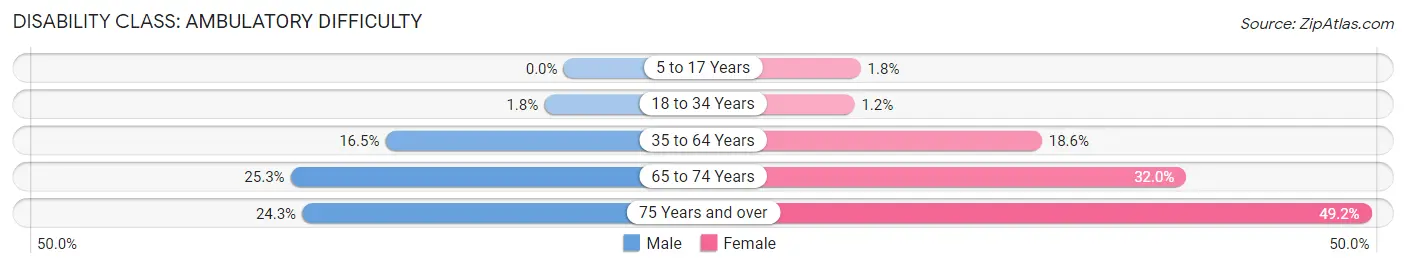
| Age Bracket | Male | Female |
| 5 to 17 Years | 0 (0.0%) | 66 (1.8%) |
| 18 to 34 Years | 73 (1.8%) | 53 (1.2%) |
| 35 to 64 Years | 1,359 (16.5%) | 1,548 (18.6%) |
| 65 to 74 Years | 580 (25.3%) | 835 (32.0%) |
| 75 Years and over | 343 (24.3%) | 929 (49.1%) |
Disability Class: Self-Care Difficulty
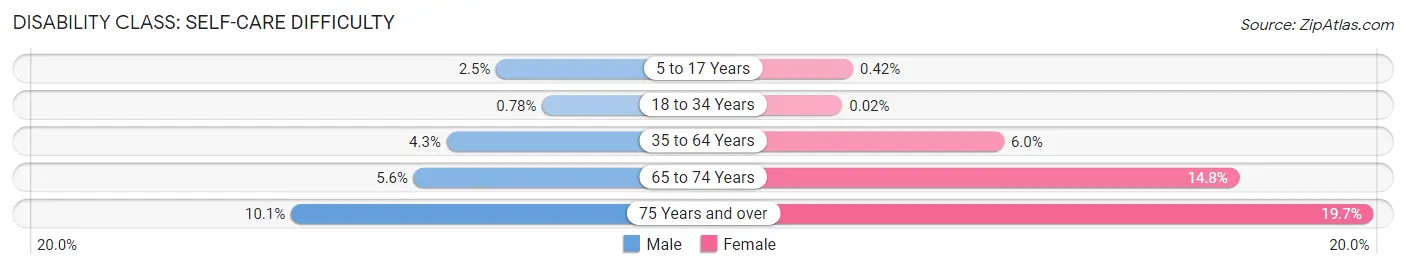
| Age Bracket | Male | Female |
| 5 to 17 Years | 98 (2.5%) | 16 (0.4%) |
| 18 to 34 Years | 32 (0.8%) | 1 (0.0%) |
| 35 to 64 Years | 356 (4.3%) | 502 (6.0%) |
| 65 to 74 Years | 127 (5.6%) | 386 (14.8%) |
| 75 Years and over | 143 (10.1%) | 373 (19.7%) |
Technology Access in Washington Parish
Computing Device Access in Washington Parish
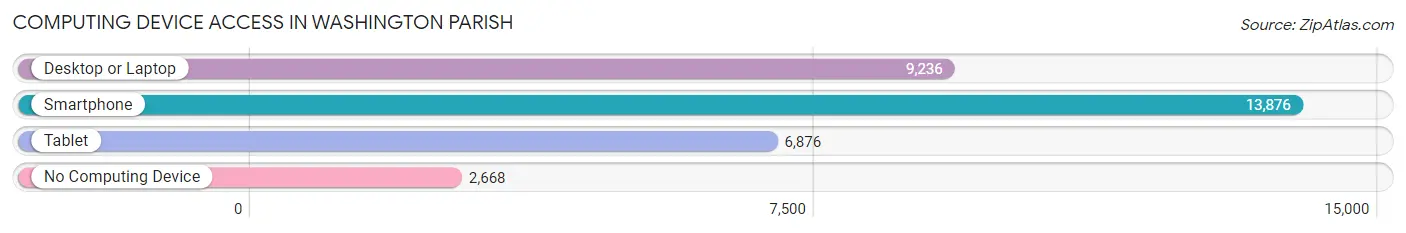
| Device Type | # Households | % Households |
| Desktop or Laptop | 9,236 | 53.8% |
| Smartphone | 13,876 | 80.8% |
| Tablet | 6,876 | 40.1% |
| No Computing Device | 2,668 | 15.5% |
| Total | 17,162 | 100.0% |
Internet Access in Washington Parish
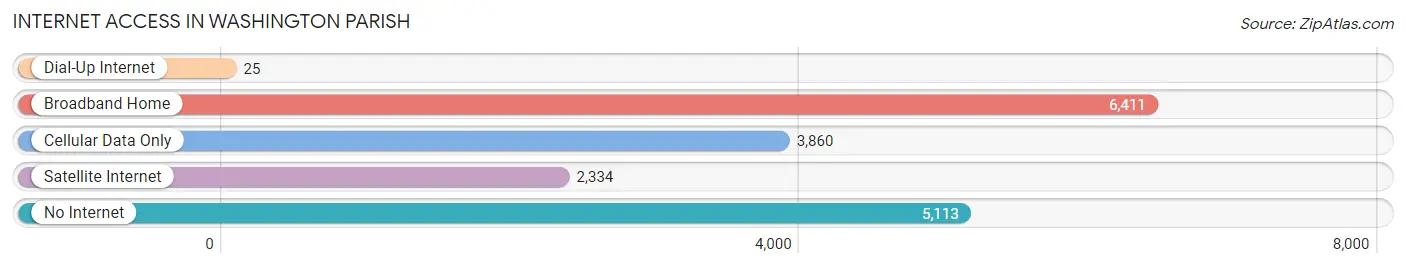
| Internet Type | # Households | % Households |
| Dial-Up Internet | 25 | 0.2% |
| Broadband Home | 6,411 | 37.4% |
| Cellular Data Only | 3,860 | 22.5% |
| Satellite Internet | 2,334 | 13.6% |
| No Internet | 5,113 | 29.8% |
| Total | 17,162 | 100.0% |
Washington Parish Summary
History
Washington Parish is located in the southeastern corner of Louisiana and is part of the greater New Orleans metropolitan area. The parish was established in 1819 and is named after George Washington, the first president of the United States. The parish is bordered by St. Tammany Parish to the north, Tangipahoa Parish to the east, St. Helena Parish to the south, and Pearl River County, Mississippi to the west.
The first settlers of Washington Parish were French-speaking Acadians who arrived in the area in the late 1700s. These settlers were primarily farmers and fishermen who established small communities along the rivers and bayous of the parish. The area was also home to several Native American tribes, including the Choctaw, Chickasaw, and Houma.
In the early 1800s, the area was part of the Territory of Orleans, which was later divided into the states of Louisiana and Mississippi. In 1819, Washington Parish was established as part of the newly formed state of Louisiana.
The parish was largely rural until the late 19th century, when the lumber industry began to boom in the area. The lumber industry brought an influx of new settlers to the area, and the population of the parish grew rapidly.
Geography
Washington Parish is located in the southeastern corner of Louisiana and is part of the greater New Orleans metropolitan area. The parish is bordered by St. Tammany Parish to the north, Tangipahoa Parish to the east, St. Helena Parish to the south, and Pearl River County, Mississippi to the west.
The parish is mostly rural, with the majority of the land being used for farming and timber production. The terrain is mostly flat, with some rolling hills in the northern part of the parish. The parish is home to several rivers and bayous, including the Bogue Chitto, Pearl, and Tickfaw Rivers.
The parish has a humid subtropical climate, with hot, humid summers and mild winters. The average annual temperature is around 70°F, and the average annual precipitation is around 50 inches.
Economy
The economy of Washington Parish is largely based on agriculture and timber production. The parish is home to several large timber companies, including Weyerhaeuser and International Paper. The timber industry is the largest employer in the parish, and it provides jobs for thousands of people.
The parish is also home to several manufacturing companies, including a paper mill, a furniture factory, and a plastics plant. The manufacturing sector provides jobs for hundreds of people in the parish.
The parish is also home to several small businesses, including restaurants, retail stores, and service providers. Tourism is also an important part of the economy, with visitors coming to the area to enjoy the natural beauty of the parish.
Demographics
As of the 2010 census, the population of Washington Parish was 46,721. The population is mostly white (77.3%), with African Americans making up 19.3% of the population. The median household income is $41,945, and the median home value is $117,400.
The parish is home to several small towns, including Bogalusa, Franklinton, and Angie. The largest city in the parish is Bogalusa, which has a population of 12,232. The parish is also home to several unincorporated communities, including Varnado, Enon, and Pine.
Conclusion
Washington Parish is a rural parish located in the southeastern corner of Louisiana. The parish was established in 1819 and is named after George Washington, the first president of the United States. The economy of the parish is largely based on agriculture and timber production, and the population is mostly white. The parish is home to several small towns and unincorporated communities, and it is part of the greater New Orleans metropolitan area.
Common Questions
What is the Total Population of Washington Parish?
Total Population of Washington Parish is 45,514.
What is the Total Male Population of Washington Parish?
Total Male Population of Washington Parish is 22,961.
What is the Total Female Population of Washington Parish?
Total Female Population of Washington Parish is 22,553.
What is the Ratio of Males per 100 Females in Washington Parish?
There are 101.81 Males per 100 Females in Washington Parish.
What is the Ratio of Females per 100 Males in Washington Parish?
There are 98.22 Females per 100 Males in Washington Parish.
What is the Median Population Age in Washington Parish?
Median Population Age in Washington Parish is 40.6 Years.
What is the Average Family Size in Washington Parish
Average Family Size in Washington Parish is 3.2 People.
What is the Average Household Size in Washington Parish
Average Household Size in Washington Parish is 2.5 People.
What is Per Capita Income in Washington Parish?
Per Capita income in Washington Parish is $24,287.
What is the Median Family Income in Washington Parish?
Median Family Income in Washington Parish is $54,649.
What is the Median Household income in Washington Parish?
Median Household Income in Washington Parish is $41,803.
What is Income or Wage Gap in Washington Parish?
Income or Wage Gap in Washington Parish is 32.6%.
Women in Washington Parish earn 67.4 cents for every dollar earned by a man.
What is Family Income Deficit in Washington Parish?
Family Income Deficit in Washington Parish is $8,246.
Families that are below poverty line in Washington Parish earn $8,246 less on average than the poverty threshold level.
What is Inequality or Gini Index in Washington Parish?
Inequality or Gini Index in Washington Parish is 0.48.
How Large is the Labor Force in Washington Parish?
There are 18,750 People in the Labor Forcein in Washington Parish.
What is the Percentage of People in the Labor Force in Washington Parish?
51.7% of People are in the Labor Force in Washington Parish.
What is the Unemployment Rate in Washington Parish?
Unemployment Rate in Washington Parish is 10.5%.