Vernon Parish, LA
Vernon Parish Map
Vernon Parish Overview
48,452
TOTAL POPULATION
25,336
MALE POPULATION
23,116
FEMALE POPULATION
109.60
MALES / 100 FEMALES
91.24
FEMALES / 100 MALES
31.5
MEDIAN AGE
3.2
AVG FAMILY SIZE
2.6
AVG HOUSEHOLD SIZE
$28,797
PER CAPITA INCOME
$65,394
AVG FAMILY INCOME
$56,547
AVG HOUSEHOLD INCOME
32.7%
WAGE / INCOME GAP [ % ]
67.3¢/ $1
WAGE / INCOME GAP [ $ ]
$9,998
FAMILY INCOME DEFICIT
0.46
INEQUALITY / GINI INDEX
22,314
LABOR FORCE [ PEOPLE ]
59.8%
PERCENT IN LABOR FORCE
6.1%
UNEMPLOYMENT RATE
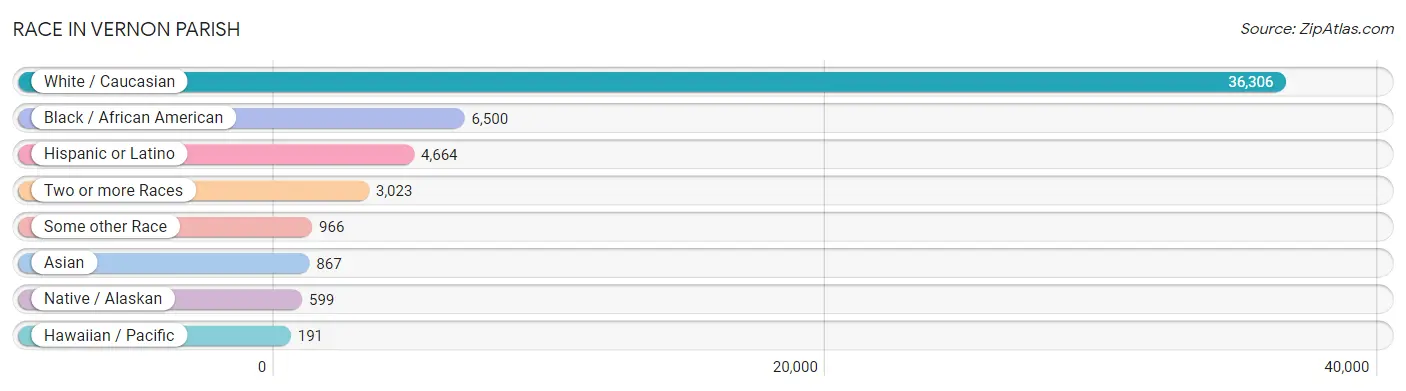
Race in Vernon Parish
The most populous races in Vernon Parish are White / Caucasian (36,306 | 74.9%), Black / African American (6,500 | 13.4%), and Hispanic or Latino (4,664 | 9.6%).
| Race | # Population | % Population |
| Asian | 867 | 1.8% |
| Black / African American | 6,500 | 13.4% |
| Hawaiian / Pacific | 191 | 0.4% |
| Hispanic or Latino | 4,664 | 9.6% |
| Native / Alaskan | 599 | 1.2% |
| White / Caucasian | 36,306 | 74.9% |
| Two or more Races | 3,023 | 6.2% |
| Some other Race | 966 | 2.0% |
| Total | 48,452 | 100.0% |
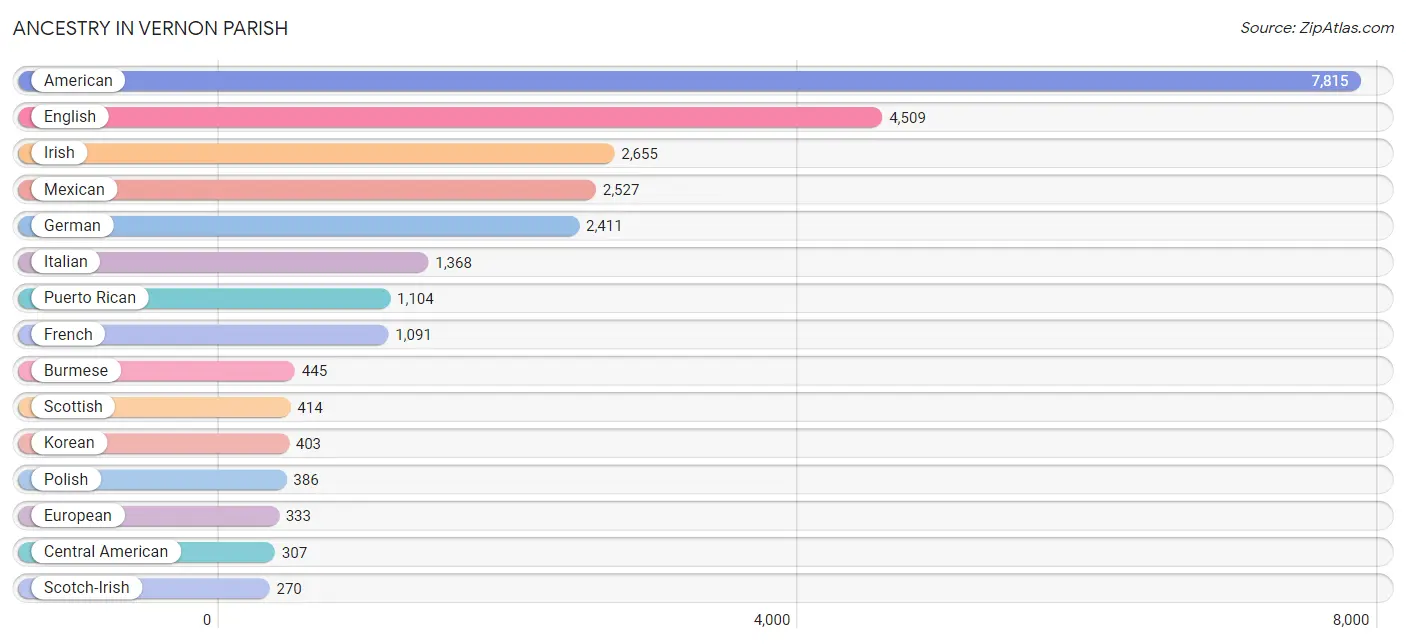
Ancestry in Vernon Parish
The most populous ancestries reported in Vernon Parish are American (7,815 | 16.1%), English (4,509 | 9.3%), Irish (2,655 | 5.5%), Mexican (2,527 | 5.2%), and German (2,411 | 5.0%), together accounting for 41.1% of all Vernon Parish residents.
| Ancestry | # Population | % Population |
| Afghan | 3 | 0.0% |
| African | 184 | 0.4% |
| American | 7,815 | 16.1% |
| Apache | 4 | 0.0% |
| Arab | 58 | 0.1% |
| Argentinean | 3 | 0.0% |
| Armenian | 10 | 0.0% |
| Assyrian / Chaldean / Syriac | 10 | 0.0% |
| Austrian | 17 | 0.0% |
| Belgian | 36 | 0.1% |
| Bhutanese | 70 | 0.1% |
| Blackfeet | 12 | 0.0% |
| Brazilian | 7 | 0.0% |
| British | 95 | 0.2% |
| Bulgarian | 9 | 0.0% |
| Burmese | 445 | 0.9% |
| Cajun | 68 | 0.1% |
| Canadian | 23 | 0.1% |
| Central American | 307 | 0.6% |
| Central American Indian | 8 | 0.0% |
| Cherokee | 258 | 0.5% |
| Chilean | 12 | 0.0% |
| Choctaw | 181 | 0.4% |
| Colombian | 55 | 0.1% |
| Costa Rican | 48 | 0.1% |
| Creek | 50 | 0.1% |
| Crow | 2 | 0.0% |
| Cuban | 99 | 0.2% |
| Czech | 41 | 0.1% |
| Danish | 40 | 0.1% |
| Dominican | 90 | 0.2% |
| Dutch | 170 | 0.4% |
| Dutch West Indian | 4 | 0.0% |
| Eastern European | 21 | 0.0% |
| Ecuadorian | 11 | 0.0% |
| English | 4,509 | 9.3% |
| European | 333 | 0.7% |
| Filipino | 3 | 0.0% |
| Finnish | 9 | 0.0% |
| French | 1,091 | 2.2% |
| French Canadian | 190 | 0.4% |
| German | 2,411 | 5.0% |
| Greek | 15 | 0.0% |
| Guamanian / Chamorro | 99 | 0.2% |
| Haitian | 51 | 0.1% |
| Honduran | 61 | 0.1% |
| Houma | 37 | 0.1% |
| Hungarian | 11 | 0.0% |
| Indian (Asian) | 95 | 0.2% |
| Iranian | 26 | 0.1% |
| Iraqi | 4 | 0.0% |
| Irish | 2,655 | 5.5% |
| Iroquois | 23 | 0.1% |
| Israeli | 29 | 0.1% |
| Italian | 1,368 | 2.8% |
| Jamaican | 147 | 0.3% |
| Korean | 403 | 0.8% |
| Lithuanian | 4 | 0.0% |
| Lumbee | 17 | 0.0% |
| Mexican | 2,527 | 5.2% |
| Mexican American Indian | 2 | 0.0% |
| Moroccan | 10 | 0.0% |
| Native Hawaiian | 40 | 0.1% |
| Navajo | 9 | 0.0% |
| Nicaraguan | 59 | 0.1% |
| Nigerian | 13 | 0.0% |
| Northern European | 6 | 0.0% |
| Norwegian | 202 | 0.4% |
| Osage | 21 | 0.0% |
| Pakistani | 70 | 0.1% |
| Panamanian | 129 | 0.3% |
| Pennsylvania German | 8 | 0.0% |
| Polish | 386 | 0.8% |
| Portuguese | 23 | 0.1% |
| Puerto Rican | 1,104 | 2.3% |
| Romanian | 22 | 0.1% |
| Russian | 61 | 0.1% |
| Salvadoran | 10 | 0.0% |
| Samoan | 22 | 0.1% |
| Scandinavian | 133 | 0.3% |
| Scotch-Irish | 270 | 0.6% |
| Scottish | 414 | 0.9% |
| Seminole | 12 | 0.0% |
| Sioux | 13 | 0.0% |
| Slovak | 12 | 0.0% |
| South American | 109 | 0.2% |
| Spaniard | 41 | 0.1% |
| Spanish | 98 | 0.2% |
| Spanish American | 3 | 0.0% |
| Sri Lankan | 185 | 0.4% |
| Subsaharan African | 203 | 0.4% |
| Swedish | 68 | 0.1% |
| Swiss | 38 | 0.1% |
| Syrian | 23 | 0.1% |
| Thai | 38 | 0.1% |
| Ukrainian | 28 | 0.1% |
| Venezuelan | 9 | 0.0% |
| Vietnamese | 2 | 0.0% |
| Welsh | 183 | 0.4% |
| West Indian | 1 | 0.0% |
| Yaqui | 4 | 0.0% |
| Yugoslavian | 4 | 0.0% | View All 102 Rows |
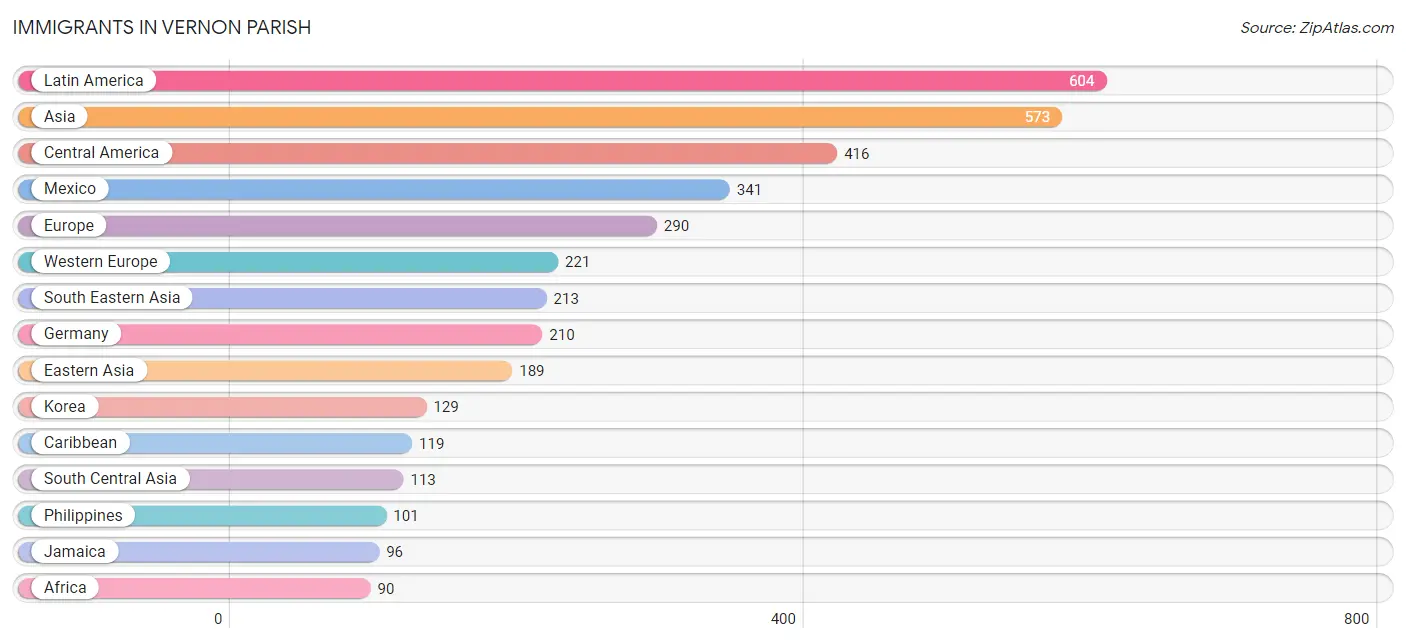
Immigrants in Vernon Parish
The most numerous immigrant groups reported in Vernon Parish came from Latin America (604 | 1.3%), Asia (573 | 1.2%), Central America (416 | 0.9%), Mexico (341 | 0.7%), and Europe (290 | 0.6%), together accounting for 4.6% of all Vernon Parish residents.
| Immigration Origin | # Population | % Population |
| Afghanistan | 67 | 0.1% |
| Africa | 90 | 0.2% |
| Argentina | 2 | 0.0% |
| Asia | 573 | 1.2% |
| Australia | 12 | 0.0% |
| Austria | 2 | 0.0% |
| Bangladesh | 2 | 0.0% |
| Belgium | 1 | 0.0% |
| Bosnia and Herzegovina | 9 | 0.0% |
| Brazil | 7 | 0.0% |
| Bulgaria | 5 | 0.0% |
| Canada | 11 | 0.0% |
| Caribbean | 119 | 0.3% |
| Central America | 416 | 0.9% |
| China | 43 | 0.1% |
| Colombia | 39 | 0.1% |
| Costa Rica | 18 | 0.0% |
| Cuba | 13 | 0.0% |
| Czechoslovakia | 1 | 0.0% |
| Dominican Republic | 10 | 0.0% |
| Eastern Africa | 4 | 0.0% |
| Eastern Asia | 189 | 0.4% |
| Eastern Europe | 59 | 0.1% |
| Ecuador | 21 | 0.0% |
| England | 5 | 0.0% |
| Europe | 290 | 0.6% |
| France | 8 | 0.0% |
| Germany | 210 | 0.4% |
| Honduras | 41 | 0.1% |
| Hong Kong | 19 | 0.0% |
| India | 27 | 0.1% |
| Iran | 7 | 0.0% |
| Iraq | 11 | 0.0% |
| Israel | 29 | 0.1% |
| Italy | 2 | 0.0% |
| Jamaica | 96 | 0.2% |
| Japan | 17 | 0.0% |
| Korea | 129 | 0.3% |
| Kuwait | 2 | 0.0% |
| Latin America | 604 | 1.3% |
| Lebanon | 3 | 0.0% |
| Mexico | 341 | 0.7% |
| Middle Africa | 3 | 0.0% |
| Nepal | 10 | 0.0% |
| Nigeria | 8 | 0.0% |
| Northern Africa | 7 | 0.0% |
| Northern Europe | 7 | 0.0% |
| Oceania | 38 | 0.1% |
| Panama | 16 | 0.0% |
| Philippines | 101 | 0.2% |
| Russia | 4 | 0.0% |
| South America | 69 | 0.1% |
| South Central Asia | 113 | 0.2% |
| South Eastern Asia | 213 | 0.4% |
| Southern Europe | 3 | 0.0% |
| Spain | 1 | 0.0% |
| Taiwan | 3 | 0.0% |
| Thailand | 31 | 0.1% |
| Ukraine | 40 | 0.1% |
| Vietnam | 81 | 0.2% |
| Western Africa | 9 | 0.0% |
| Western Asia | 58 | 0.1% |
| Western Europe | 221 | 0.5% | View All 63 Rows |
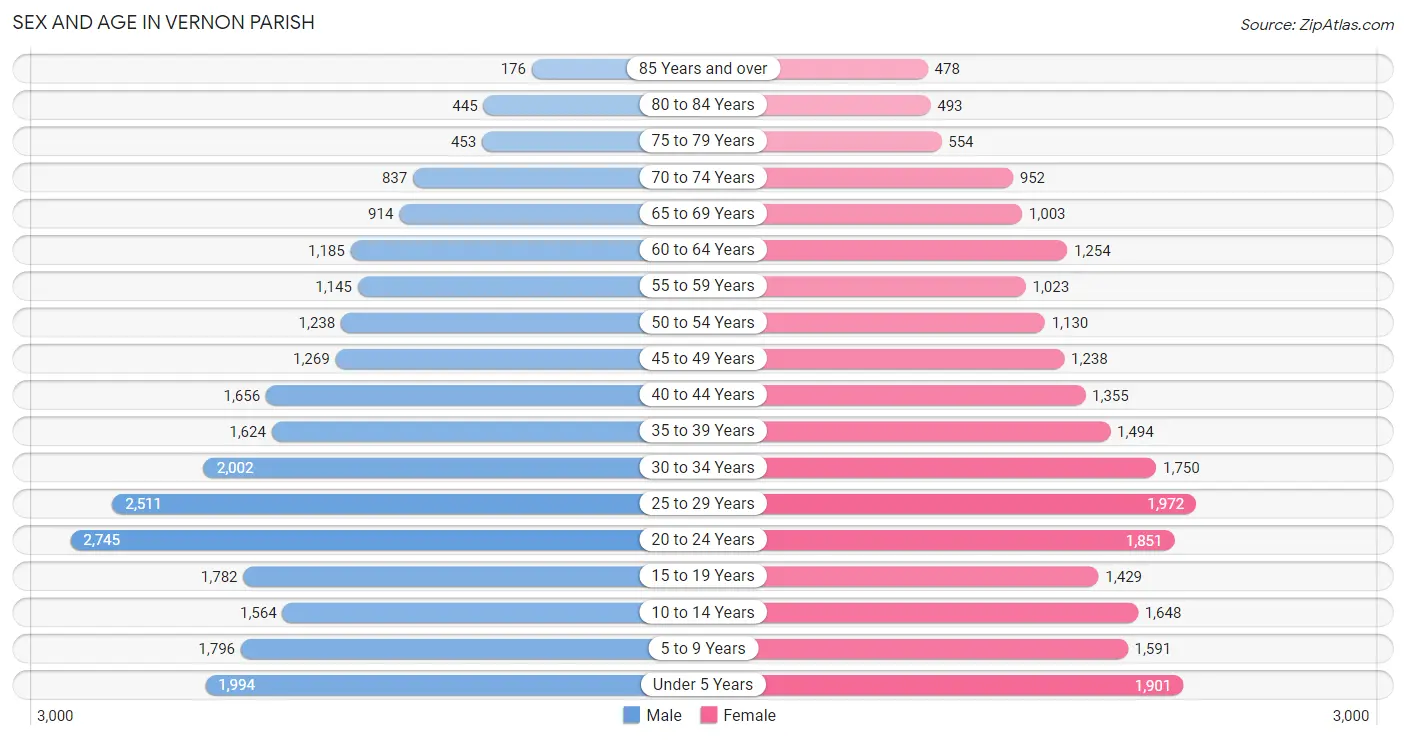
Sex and Age in Vernon Parish
Sex and Age in Vernon Parish
The most populous age groups in Vernon Parish are 20 to 24 Years (2,745 | 10.8%) for men and 25 to 29 Years (1,972 | 8.5%) for women.
| Age Bracket | Male | Female |
| Under 5 Years | 1,994 (7.9%) | 1,901 (8.2%) |
| 5 to 9 Years | 1,796 (7.1%) | 1,591 (6.9%) |
| 10 to 14 Years | 1,564 (6.2%) | 1,648 (7.1%) |
| 15 to 19 Years | 1,782 (7.0%) | 1,429 (6.2%) |
| 20 to 24 Years | 2,745 (10.8%) | 1,851 (8.0%) |
| 25 to 29 Years | 2,511 (9.9%) | 1,972 (8.5%) |
| 30 to 34 Years | 2,002 (7.9%) | 1,750 (7.6%) |
| 35 to 39 Years | 1,624 (6.4%) | 1,494 (6.5%) |
| 40 to 44 Years | 1,656 (6.5%) | 1,355 (5.9%) |
| 45 to 49 Years | 1,269 (5.0%) | 1,238 (5.4%) |
| 50 to 54 Years | 1,238 (4.9%) | 1,130 (4.9%) |
| 55 to 59 Years | 1,145 (4.5%) | 1,023 (4.4%) |
| 60 to 64 Years | 1,185 (4.7%) | 1,254 (5.4%) |
| 65 to 69 Years | 914 (3.6%) | 1,003 (4.3%) |
| 70 to 74 Years | 837 (3.3%) | 952 (4.1%) |
| 75 to 79 Years | 453 (1.8%) | 554 (2.4%) |
| 80 to 84 Years | 445 (1.8%) | 493 (2.1%) |
| 85 Years and over | 176 (0.7%) | 478 (2.1%) |
| Total | 25,336 (100.0%) | 23,116 (100.0%) |
Families and Households in Vernon Parish
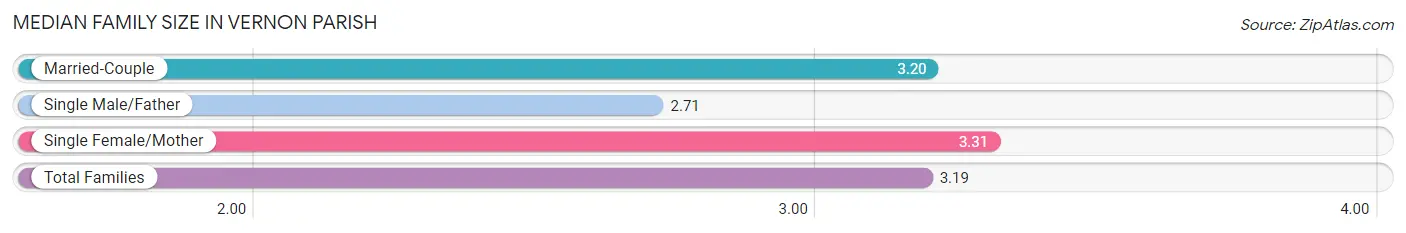
Median Family Size in Vernon Parish
The median family size in Vernon Parish is 3.19 persons per family, with single female/mother families (2,028 | 16.6%) accounting for the largest median family size of 3.31 persons per family. On the other hand, single male/father families (735 | 6.0%) represent the smallest median family size with 2.71 persons per family.
| Family Type | # Families | Family Size |
| Married-Couple | 9,458 (77.4%) | 3.20 |
| Single Male/Father | 735 (6.0%) | 2.71 |
| Single Female/Mother | 2,028 (16.6%) | 3.31 |
| Total Families | 12,221 (100.0%) | 3.19 |
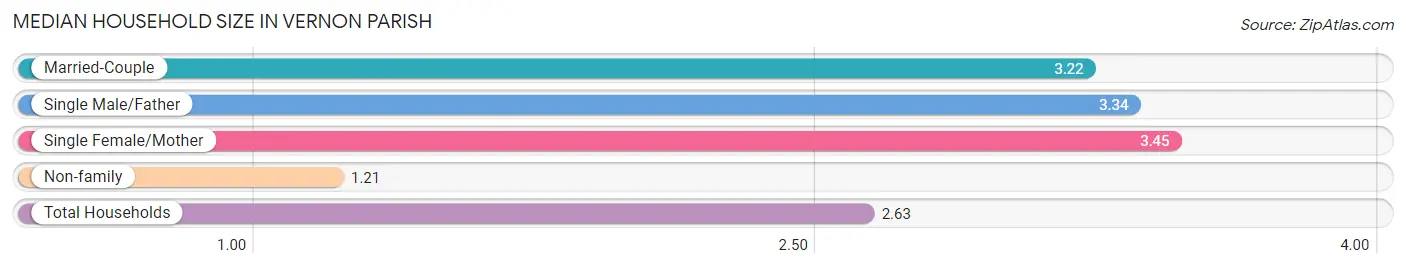
Median Household Size in Vernon Parish
The median household size in Vernon Parish is 2.63 persons per household, with single female/mother households (2,028 | 11.4%) accounting for the largest median household size of 3.45 persons per household. non-family households (5,505 | 31.1%) represent the smallest median household size with 1.21 persons per household.
| Household Type | # Households | Household Size |
| Married-Couple | 9,458 (53.4%) | 3.22 |
| Single Male/Father | 735 (4.2%) | 3.34 |
| Single Female/Mother | 2,028 (11.4%) | 3.45 |
| Non-family | 5,505 (31.1%) | 1.21 |
| Total Households | 17,726 (100.0%) | 2.63 |
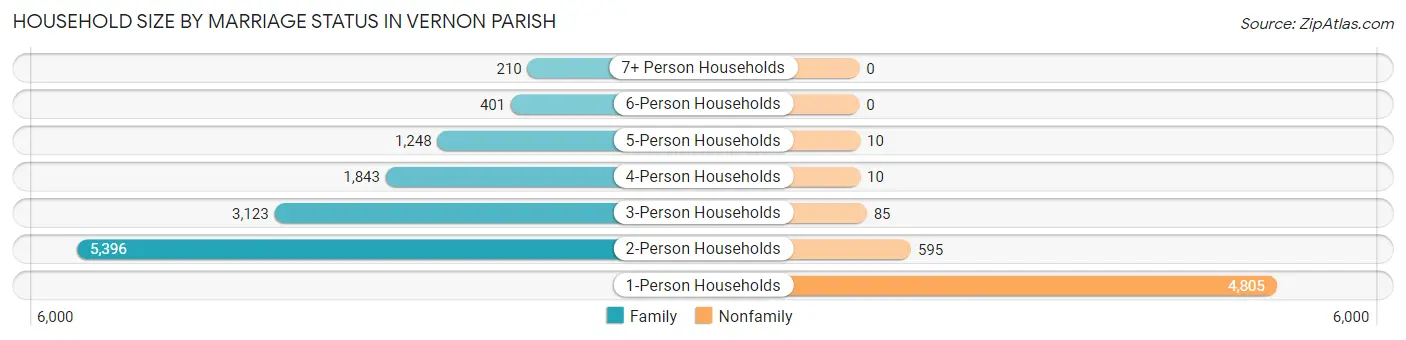
Household Size by Marriage Status in Vernon Parish
Out of a total of 17,726 households in Vernon Parish, 12,221 (68.9%) are family households, while 5,505 (31.1%) are nonfamily households. The most numerous type of family households are 2-person households, comprising 5,396, and the most common type of nonfamily households are 1-person households, comprising 4,805.
| Household Size | Family Households | Nonfamily Households |
| 1-Person Households | - | 4,805 (27.1%) |
| 2-Person Households | 5,396 (30.4%) | 595 (3.4%) |
| 3-Person Households | 3,123 (17.6%) | 85 (0.5%) |
| 4-Person Households | 1,843 (10.4%) | 10 (0.1%) |
| 5-Person Households | 1,248 (7.0%) | 10 (0.1%) |
| 6-Person Households | 401 (2.3%) | 0 (0.0%) |
| 7+ Person Households | 210 (1.2%) | 0 (0.0%) |
| Total | 12,221 (68.9%) | 5,505 (31.1%) |
Female Fertility in Vernon Parish
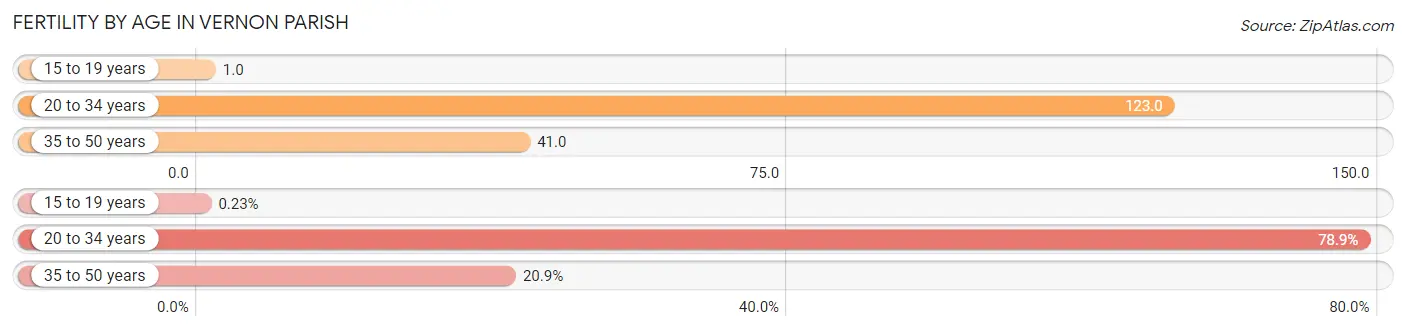
Fertility by Age in Vernon Parish
Average fertility rate in Vernon Parish is 76.0 births per 1,000 women. Women in the age bracket of 20 to 34 years have the highest fertility rate with 123.0 births per 1,000 women. Women in the age bracket of 20 to 34 years acount for 78.9% of all women with births.
| Age Bracket | Women with Births | Births / 1,000 Women |
| 15 to 19 years | 2 (0.2%) | 1.0 |
| 20 to 34 years | 683 (78.9%) | 123.0 |
| 35 to 50 years | 181 (20.9%) | 41.0 |
| Total | 866 (100.0%) | 76.0 |
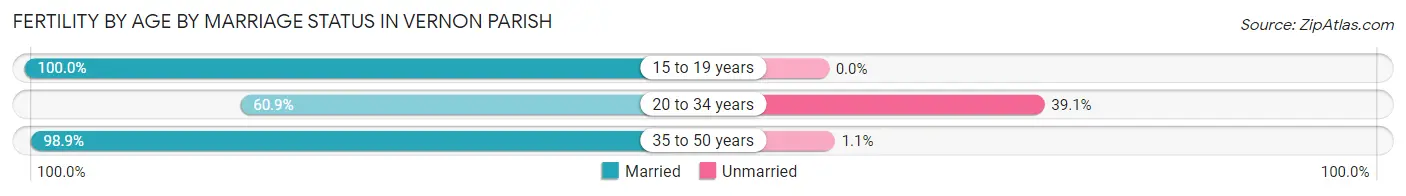
Fertility by Age by Marriage Status in Vernon Parish
68.9% of women with births (866) in Vernon Parish are married. The highest percentage of unmarried women with births falls into 20 to 34 years age bracket with 39.1% of them unmarried at the time of birth, while the lowest percentage of unmarried women with births belong to 15 to 19 years age bracket with 0.0% of them unmarried.
| Age Bracket | Married | Unmarried |
| 15 to 19 years | 2 (100.0%) | 0 (0.0%) |
| 20 to 34 years | 416 (60.9%) | 267 (39.1%) |
| 35 to 50 years | 179 (98.9%) | 2 (1.1%) |
| Total | 597 (68.9%) | 269 (31.1%) |
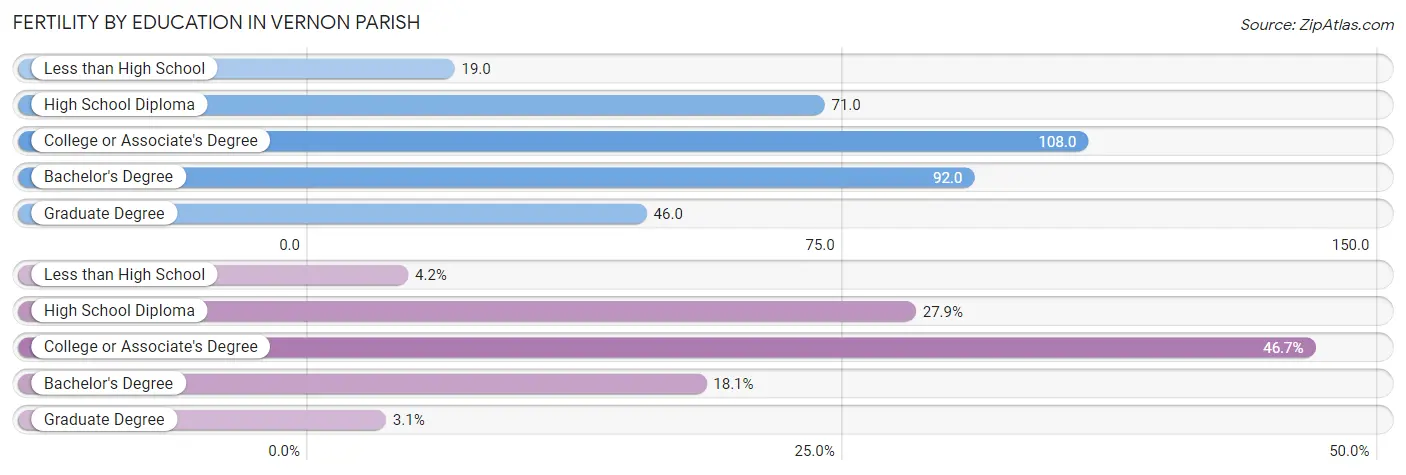
Fertility by Education in Vernon Parish
Average fertility rate in Vernon Parish is 76.0 births per 1,000 women. Women with the education attainment of college or associate's degree have the highest fertility rate of 108.0 births per 1,000 women, while women with the education attainment of less than high school have the lowest fertility at 19.0 births per 1,000 women. Women with the education attainment of college or associate's degree represent 46.7% of all women with births.
| Educational Attainment | Women with Births | Births / 1,000 Women |
| Less than High School | 36 (4.2%) | 19.0 |
| High School Diploma | 242 (27.9%) | 71.0 |
| College or Associate's Degree | 404 (46.7%) | 108.0 |
| Bachelor's Degree | 157 (18.1%) | 92.0 |
| Graduate Degree | 27 (3.1%) | 46.0 |
| Total | 866 (100.0%) | 76.0 |
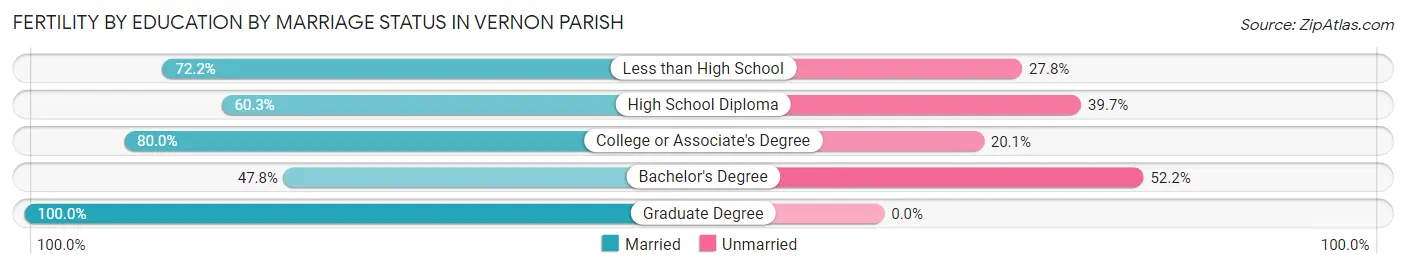
Fertility by Education by Marriage Status in Vernon Parish
31.1% of women with births in Vernon Parish are unmarried. Women with the educational attainment of graduate degree are most likely to be married with 100.0% of them married at childbirth, while women with the educational attainment of bachelor's degree are least likely to be married with 52.2% of them unmarried at childbirth.
| Educational Attainment | Married | Unmarried |
| Less than High School | 26 (72.2%) | 10 (27.8%) |
| High School Diploma | 146 (60.3%) | 96 (39.7%) |
| College or Associate's Degree | 323 (79.9%) | 81 (20.1%) |
| Bachelor's Degree | 75 (47.8%) | 82 (52.2%) |
| Graduate Degree | 27 (100.0%) | 0 (0.0%) |
| Total | 597 (68.9%) | 269 (31.1%) |
Income in Vernon Parish
Income Overview in Vernon Parish
Per Capita Income in Vernon Parish is $28,797, while median incomes of families and households are $65,394 and $56,547 respectively.
| Characteristic | Number | Measure |
| Per Capita Income | 48,452 | $28,797 |
| Median Family Income | 12,221 | $65,394 |
| Mean Family Income | 12,221 | $81,320 |
| Median Household Income | 17,726 | $56,547 |
| Mean Household Income | 17,726 | $72,993 |
| Income Deficit | 12,221 | $9,998 |
| Wage / Income Gap (%) | 48,452 | 32.66% |
| Wage / Income Gap ($) | 48,452 | 67.34¢ per $1 |
| Gini / Inequality Index | 48,452 | 0.46 |
Earnings by Sex in Vernon Parish
Average Earnings in Vernon Parish are $36,540, $43,039 for men and $28,983 for women, a difference of 32.7%.
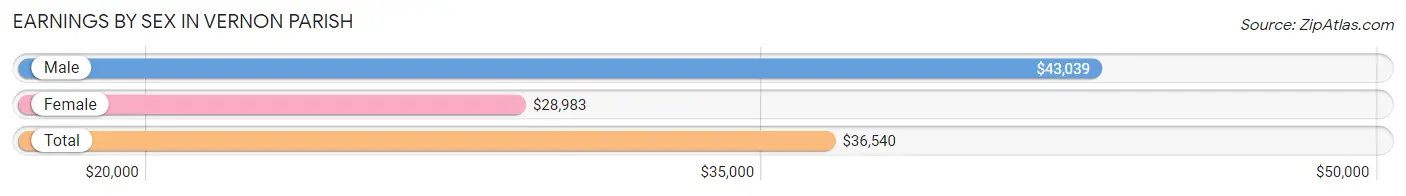
| Sex | Number | Average Earnings |
| Male | 13,814 (60.9%) | $43,039 |
| Female | 8,878 (39.1%) | $28,983 |
| Total | 22,692 (100.0%) | $36,540 |
Earnings by Sex by Income Bracket in Vernon Parish
The most common earnings brackets in Vernon Parish are $55,000 to $64,999 for men (1,540 | 11.2%) and $25,000 to $29,999 for women (763 | 8.6%).
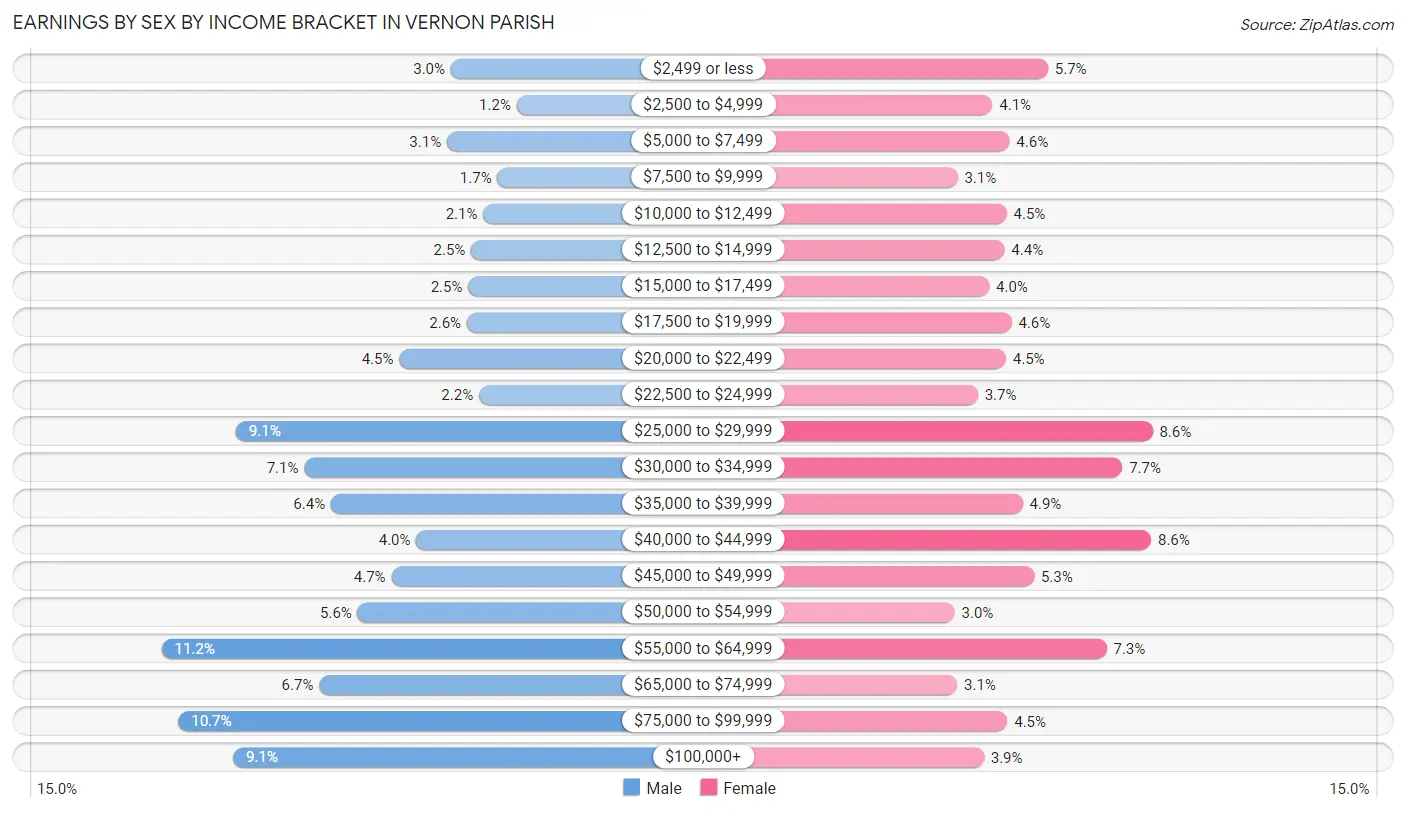
| Income | Male | Female |
| $2,499 or less | 417 (3.0%) | 502 (5.7%) |
| $2,500 to $4,999 | 162 (1.2%) | 363 (4.1%) |
| $5,000 to $7,499 | 433 (3.1%) | 406 (4.6%) |
| $7,500 to $9,999 | 236 (1.7%) | 276 (3.1%) |
| $10,000 to $12,499 | 291 (2.1%) | 399 (4.5%) |
| $12,500 to $14,999 | 338 (2.5%) | 393 (4.4%) |
| $15,000 to $17,499 | 350 (2.5%) | 355 (4.0%) |
| $17,500 to $19,999 | 355 (2.6%) | 411 (4.6%) |
| $20,000 to $22,499 | 618 (4.5%) | 397 (4.5%) |
| $22,500 to $24,999 | 308 (2.2%) | 327 (3.7%) |
| $25,000 to $29,999 | 1,252 (9.1%) | 763 (8.6%) |
| $30,000 to $34,999 | 986 (7.1%) | 687 (7.7%) |
| $35,000 to $39,999 | 883 (6.4%) | 439 (4.9%) |
| $40,000 to $44,999 | 551 (4.0%) | 759 (8.6%) |
| $45,000 to $49,999 | 648 (4.7%) | 467 (5.3%) |
| $50,000 to $54,999 | 779 (5.6%) | 269 (3.0%) |
| $55,000 to $64,999 | 1,540 (11.2%) | 648 (7.3%) |
| $65,000 to $74,999 | 928 (6.7%) | 275 (3.1%) |
| $75,000 to $99,999 | 1,476 (10.7%) | 400 (4.5%) |
| $100,000+ | 1,263 (9.1%) | 342 (3.8%) |
| Total | 13,814 (100.0%) | 8,878 (100.0%) |
Earnings by Sex by Educational Attainment in Vernon Parish
Average earnings in Vernon Parish are $52,984 for men and $32,785 for women, a difference of 38.1%. Men with an educational attainment of graduate degree enjoy the highest average annual earnings of $84,250, while those with less than high school education earn the least with $36,897. Women with an educational attainment of graduate degree earn the most with the average annual earnings of $46,250, while those with less than high school education have the smallest earnings of $20,267.
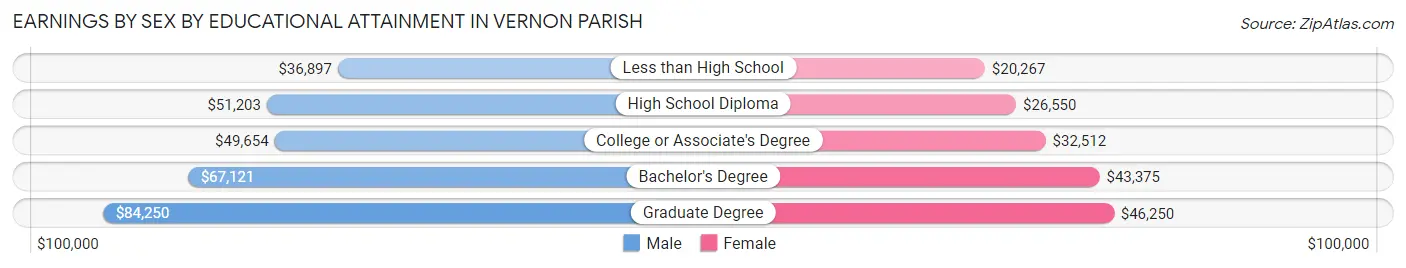
| Educational Attainment | Male Income | Female Income |
| Less than High School | $36,897 | $20,267 |
| High School Diploma | $51,203 | $26,550 |
| College or Associate's Degree | $49,654 | $32,512 |
| Bachelor's Degree | $67,121 | $43,375 |
| Graduate Degree | $84,250 | $46,250 |
| Total | $52,984 | $32,785 |
Family Income in Vernon Parish
Family Income Brackets in Vernon Parish
According to the Vernon Parish family income data, there are 2,481 families falling into the $50,000 to $74,999 income range, which is the most common income bracket and makes up 20.3% of all families. Conversely, the $10,000 to $14,999 income bracket is the least frequent group with only 306 families (2.5%) belonging to this category.
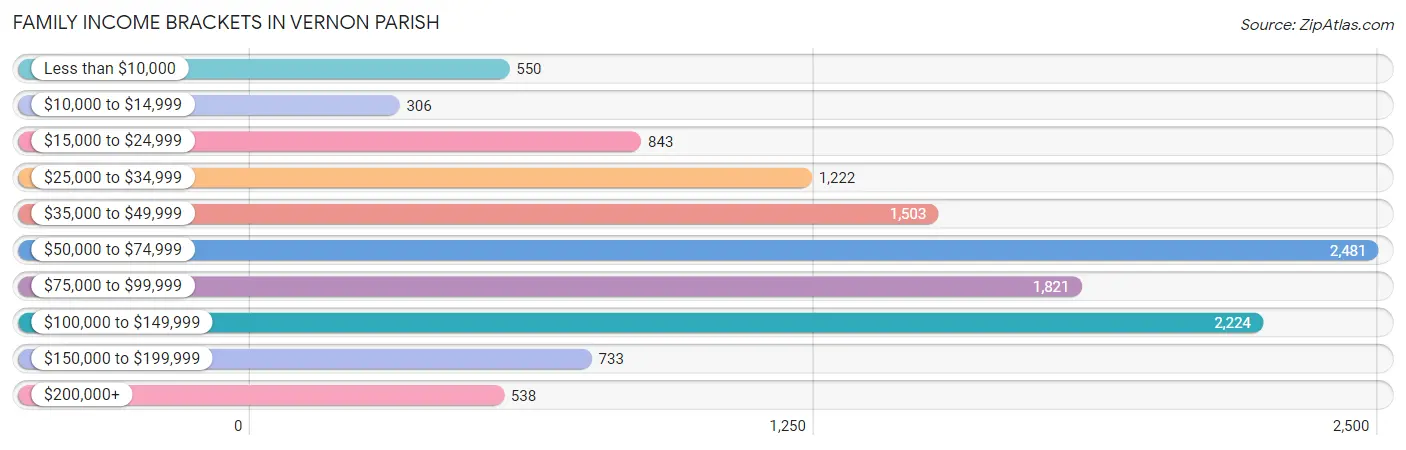
| Income Bracket | # Families | % Families |
| Less than $10,000 | 550 | 4.5% |
| $10,000 to $14,999 | 306 | 2.5% |
| $15,000 to $24,999 | 843 | 6.9% |
| $25,000 to $34,999 | 1,222 | 10.0% |
| $35,000 to $49,999 | 1,503 | 12.3% |
| $50,000 to $74,999 | 2,481 | 20.3% |
| $75,000 to $99,999 | 1,821 | 14.9% |
| $100,000 to $149,999 | 2,224 | 18.2% |
| $150,000 to $199,999 | 733 | 6.0% |
| $200,000+ | 538 | 4.4% |
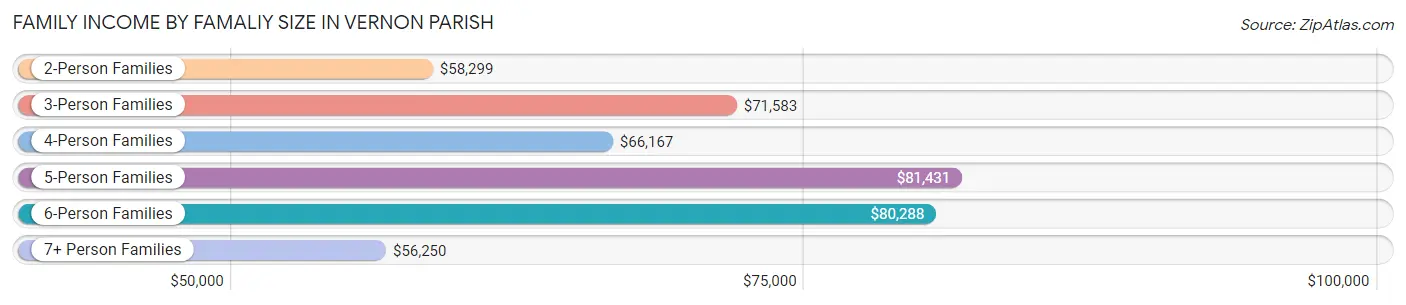
Family Income by Famaliy Size in Vernon Parish
5-person families (1,187 | 9.7%) account for the highest median family income in Vernon Parish with $81,431 per family, while 2-person families (5,738 | 46.9%) have the highest median income of $29,150 per family member.
| Income Bracket | # Families | Median Income |
| 2-Person Families | 5,738 (46.9%) | $58,299 |
| 3-Person Families | 3,058 (25.0%) | $71,583 |
| 4-Person Families | 1,688 (13.8%) | $66,167 |
| 5-Person Families | 1,187 (9.7%) | $81,431 |
| 6-Person Families | 366 (3.0%) | $80,288 |
| 7+ Person Families | 184 (1.5%) | $56,250 |
| Total | 12,221 (100.0%) | $65,394 |
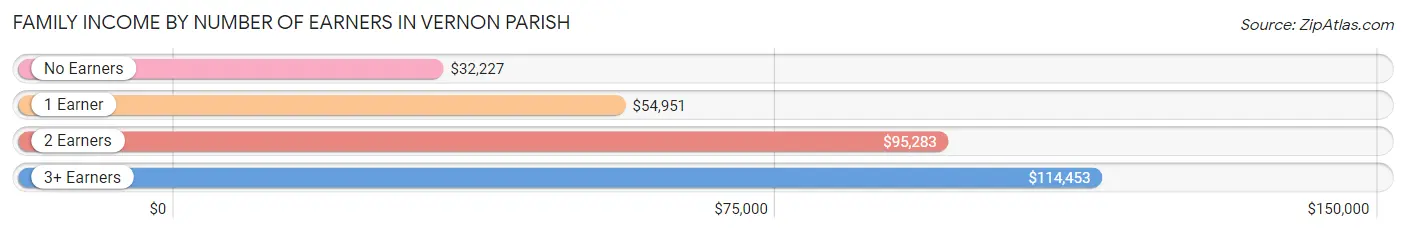
Family Income by Number of Earners in Vernon Parish
The median family income in Vernon Parish is $65,394, with families comprising 3+ earners (465) having the highest median family income of $114,453, while families with no earners (2,008) have the lowest median family income of $32,227, accounting for 3.8% and 16.4% of families, respectively.
| Number of Earners | # Families | Median Income |
| No Earners | 2,008 (16.4%) | $32,227 |
| 1 Earner | 5,313 (43.5%) | $54,951 |
| 2 Earners | 4,435 (36.3%) | $95,283 |
| 3+ Earners | 465 (3.8%) | $114,453 |
| Total | 12,221 (100.0%) | $65,394 |
Household Income in Vernon Parish
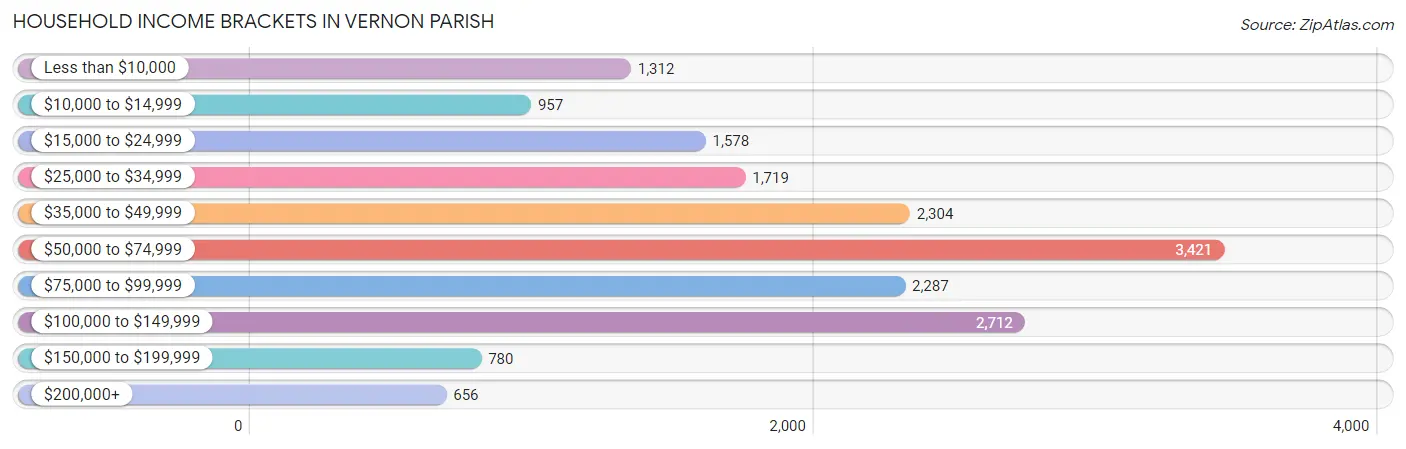
Household Income Brackets in Vernon Parish
With 3,421 households falling in the category, the $50,000 to $74,999 income range is the most frequent in Vernon Parish, accounting for 19.3% of all households. In contrast, only 656 households (3.7%) fall into the $200,000+ income bracket, making it the least populous group.
| Income Bracket | # Households | % Households |
| Less than $10,000 | 1,312 | 7.4% |
| $10,000 to $14,999 | 957 | 5.4% |
| $15,000 to $24,999 | 1,578 | 8.9% |
| $25,000 to $34,999 | 1,719 | 9.7% |
| $35,000 to $49,999 | 2,304 | 13.0% |
| $50,000 to $74,999 | 3,421 | 19.3% |
| $75,000 to $99,999 | 2,287 | 12.9% |
| $100,000 to $149,999 | 2,712 | 15.3% |
| $150,000 to $199,999 | 780 | 4.4% |
| $200,000+ | 656 | 3.7% |
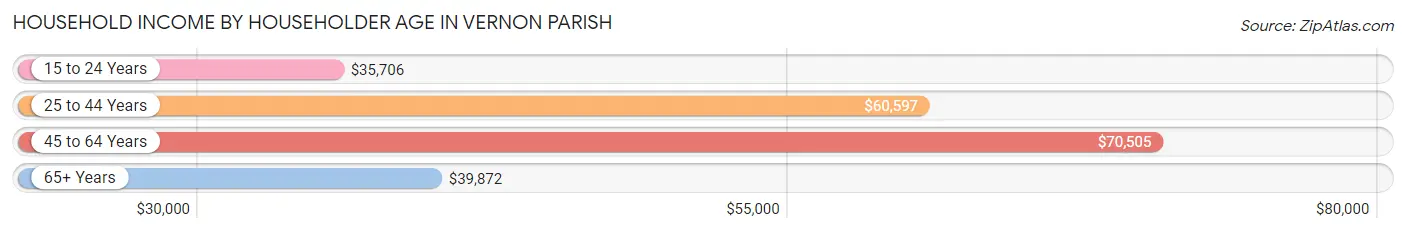
Household Income by Householder Age in Vernon Parish
The median household income in Vernon Parish is $56,547, with the highest median household income of $70,505 found in the 45 to 64 years age bracket for the primary householder. A total of 5,227 households (29.5%) fall into this category. Meanwhile, the 15 to 24 years age bracket for the primary householder has the lowest median household income of $35,706, with 1,505 households (8.5%) in this group.
| Income Bracket | # Households | Median Income |
| 15 to 24 Years | 1,505 (8.5%) | $35,706 |
| 25 to 44 Years | 7,041 (39.7%) | $60,597 |
| 45 to 64 Years | 5,227 (29.5%) | $70,505 |
| 65+ Years | 3,953 (22.3%) | $39,872 |
| Total | 17,726 (100.0%) | $56,547 |
Poverty in Vernon Parish
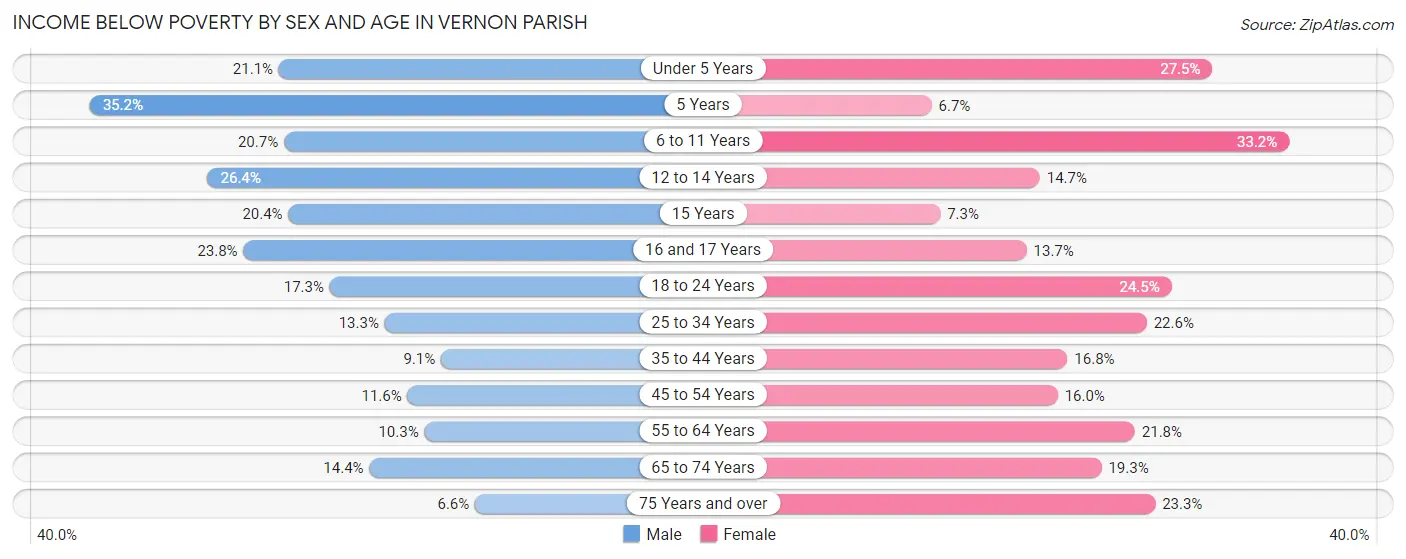
Income Below Poverty by Sex and Age in Vernon Parish
With 14.9% poverty level for males and 21.3% for females among the residents of Vernon Parish, 5 year old males and 6 to 11 year old females are the most vulnerable to poverty, with 109 males (35.2%) and 623 females (33.2%) in their respective age groups living below the poverty level.
| Age Bracket | Male | Female |
| Under 5 Years | 411 (21.1%) | 520 (27.5%) |
| 5 Years | 109 (35.2%) | 17 (6.7%) |
| 6 to 11 Years | 438 (20.7%) | 623 (33.2%) |
| 12 to 14 Years | 234 (26.4%) | 159 (14.7%) |
| 15 Years | 70 (20.4%) | 22 (7.3%) |
| 16 and 17 Years | 123 (23.7%) | 80 (13.7%) |
| 18 to 24 Years | 443 (17.3%) | 545 (24.5%) |
| 25 to 34 Years | 562 (13.3%) | 834 (22.6%) |
| 35 to 44 Years | 297 (9.1%) | 475 (16.8%) |
| 45 to 54 Years | 288 (11.6%) | 379 (16.0%) |
| 55 to 64 Years | 240 (10.3%) | 495 (21.8%) |
| 65 to 74 Years | 248 (14.4%) | 376 (19.3%) |
| 75 Years and over | 66 (6.6%) | 336 (23.3%) |
| Total | 3,529 (14.9%) | 4,861 (21.3%) |
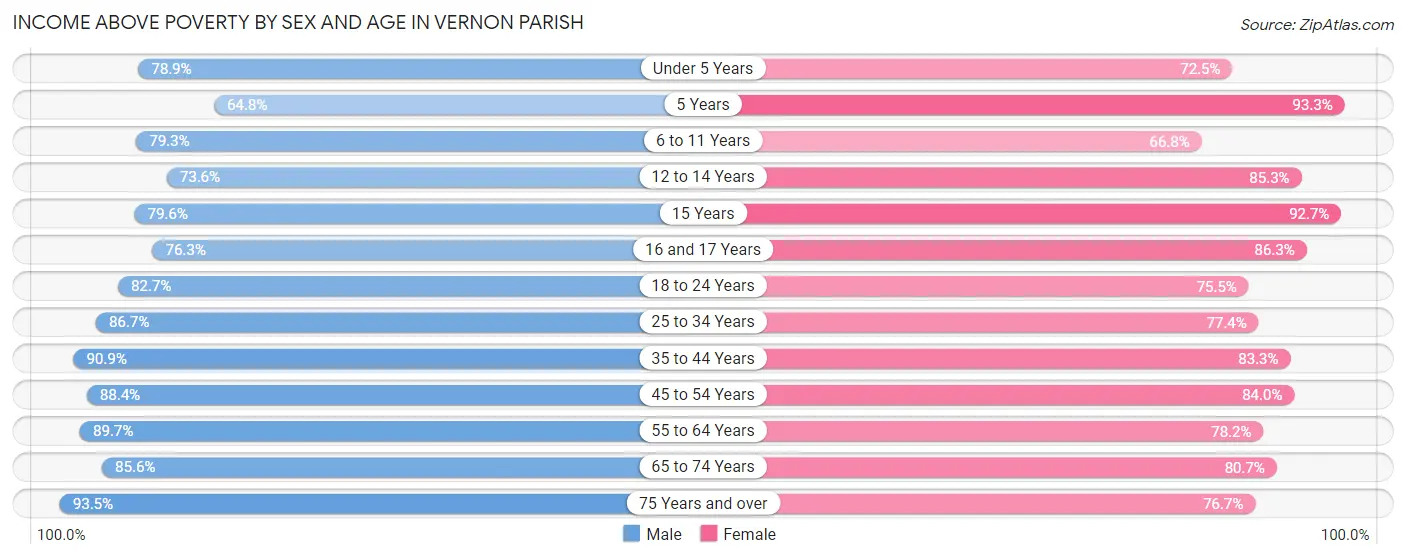
Income Above Poverty by Sex and Age in Vernon Parish
According to the poverty statistics in Vernon Parish, males aged 75 years and over and females aged 5 years are the age groups that are most secure financially, with 93.4% of males and 93.3% of females in these age groups living above the poverty line.
| Age Bracket | Male | Female |
| Under 5 Years | 1,535 (78.9%) | 1,370 (72.5%) |
| 5 Years | 201 (64.8%) | 238 (93.3%) |
| 6 to 11 Years | 1,674 (79.3%) | 1,253 (66.8%) |
| 12 to 14 Years | 652 (73.6%) | 923 (85.3%) |
| 15 Years | 273 (79.6%) | 279 (92.7%) |
| 16 and 17 Years | 395 (76.2%) | 503 (86.3%) |
| 18 to 24 Years | 2,112 (82.7%) | 1,681 (75.5%) |
| 25 to 34 Years | 3,676 (86.7%) | 2,850 (77.4%) |
| 35 to 44 Years | 2,975 (90.9%) | 2,360 (83.3%) |
| 45 to 54 Years | 2,202 (88.4%) | 1,986 (84.0%) |
| 55 to 64 Years | 2,087 (89.7%) | 1,780 (78.2%) |
| 65 to 74 Years | 1,474 (85.6%) | 1,574 (80.7%) |
| 75 Years and over | 941 (93.4%) | 1,108 (76.7%) |
| Total | 20,197 (85.1%) | 17,905 (78.6%) |
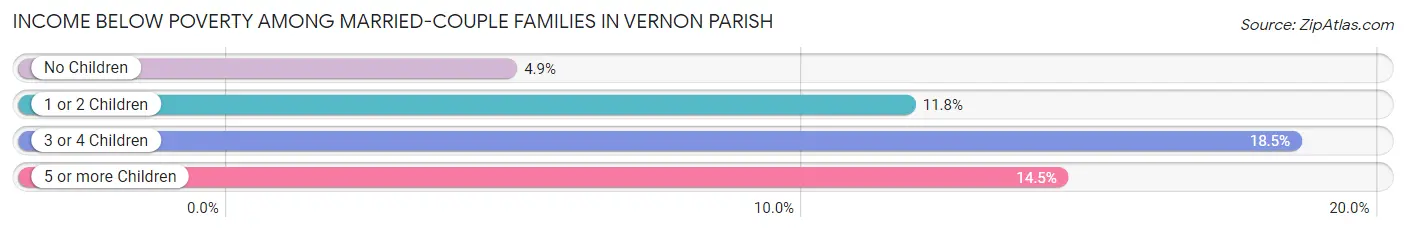
Income Below Poverty Among Married-Couple Families in Vernon Parish
The poverty statistics for married-couple families in Vernon Parish show that 8.9% or 839 of the total 9,458 families live below the poverty line. Families with 3 or 4 children have the highest poverty rate of 18.5%, comprising of 227 families. On the other hand, families with no children have the lowest poverty rate of 4.9%, which includes 253 families.
| Children | Above Poverty | Below Poverty |
| No Children | 4,955 (95.1%) | 253 (4.9%) |
| 1 or 2 Children | 2,594 (88.2%) | 347 (11.8%) |
| 3 or 4 Children | 999 (81.5%) | 227 (18.5%) |
| 5 or more Children | 71 (85.5%) | 12 (14.5%) |
| Total | 8,619 (91.1%) | 839 (8.9%) |
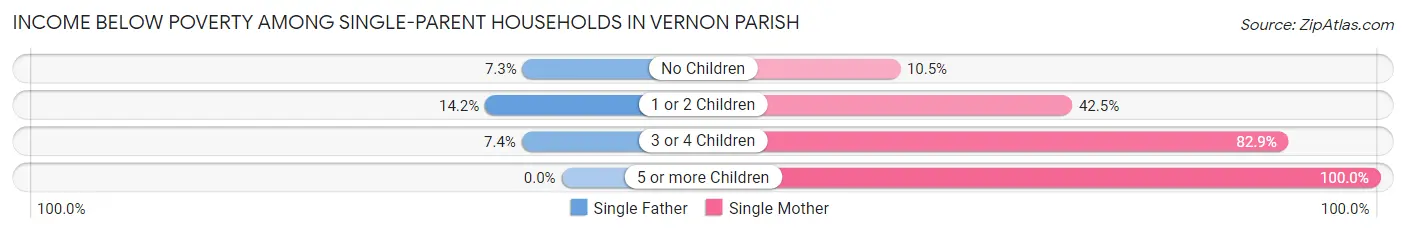
Income Below Poverty Among Single-Parent Households in Vernon Parish
According to the poverty data in Vernon Parish, 12.1% or 89 single-father households and 40.0% or 812 single-mother households are living below the poverty line. Among single-father households, those with 1 or 2 children have the highest poverty rate, with 73 households (14.2%) experiencing poverty. Likewise, among single-mother households, those with 5 or more children have the highest poverty rate, with 2 households (100.0%) falling below the poverty line.
| Children | Single Father | Single Mother |
| No Children | 14 (7.2%) | 50 (10.5%) |
| 1 or 2 Children | 73 (14.2%) | 552 (42.5%) |
| 3 or 4 Children | 2 (7.4%) | 208 (82.9%) |
| 5 or more Children | 0 (0.0%) | 2 (100.0%) |
| Total | 89 (12.1%) | 812 (40.0%) |
Income Below Poverty Among Married-Couple vs Single-Parent Households in Vernon Parish
The poverty data for Vernon Parish shows that 839 of the married-couple family households (8.9%) and 901 of the single-parent households (32.6%) are living below the poverty level. Within the married-couple family households, those with 3 or 4 children have the highest poverty rate, with 227 households (18.5%) falling below the poverty line. Among the single-parent households, those with 3 or 4 children have the highest poverty rate, with 210 household (75.5%) living below poverty.
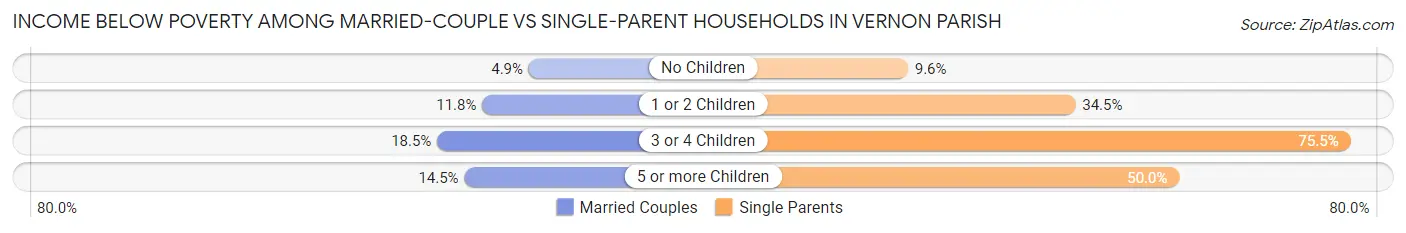
| Children | Married-Couple Families | Single-Parent Households |
| No Children | 253 (4.9%) | 64 (9.6%) |
| 1 or 2 Children | 347 (11.8%) | 625 (34.5%) |
| 3 or 4 Children | 227 (18.5%) | 210 (75.5%) |
| 5 or more Children | 12 (14.5%) | 2 (50.0%) |
| Total | 839 (8.9%) | 901 (32.6%) |
Employment Characteristics in Vernon Parish
Employment by Class of Employer in Vernon Parish
Among the 20,966 employed individuals in Vernon Parish, private company employees (9,426 | 45.0%), federal government employees (7,271 | 34.7%), and local government employees (1,364 | 6.5%) make up the most common classes of employment.
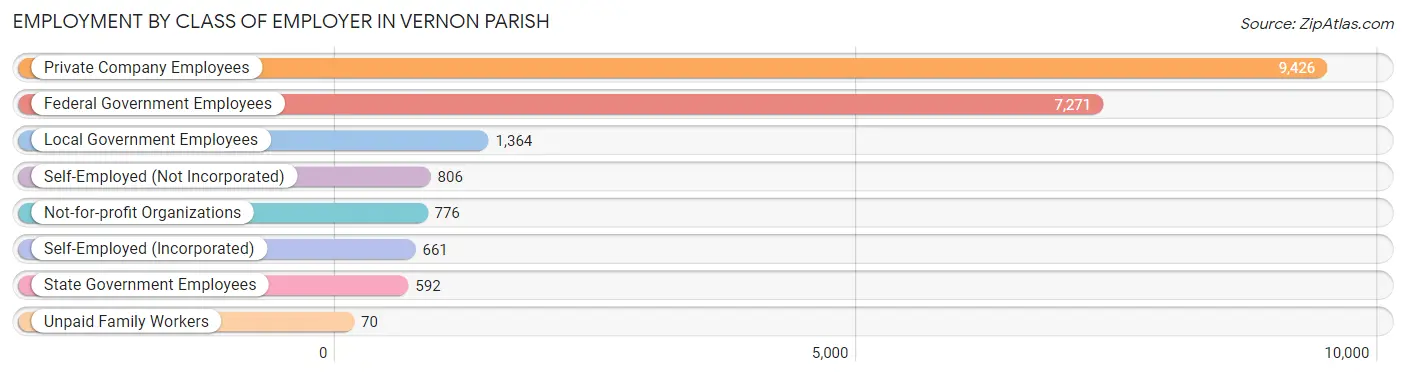
| Employer Class | # Employees | % Employees |
| Private Company Employees | 9,426 | 45.0% |
| Self-Employed (Incorporated) | 661 | 3.2% |
| Self-Employed (Not Incorporated) | 806 | 3.8% |
| Not-for-profit Organizations | 776 | 3.7% |
| Local Government Employees | 1,364 | 6.5% |
| State Government Employees | 592 | 2.8% |
| Federal Government Employees | 7,271 | 34.7% |
| Unpaid Family Workers | 70 | 0.3% |
| Total | 20,966 | 100.0% |
Employment Status by Age in Vernon Parish
According to the labor force statistics for Vernon Parish, out of the total population over 16 years of age (37,314), 59.8% or 22,314 individuals are in the labor force, with 6.1% or 1,361 of them unemployed. The age group with the highest labor force participation rate is 35 to 44 years, with 80.7% or 4,946 individuals in the labor force. Within the labor force, the 16 to 19 years age range has the highest percentage of unemployed individuals, with 26.9% or 278 of them being unemployed.
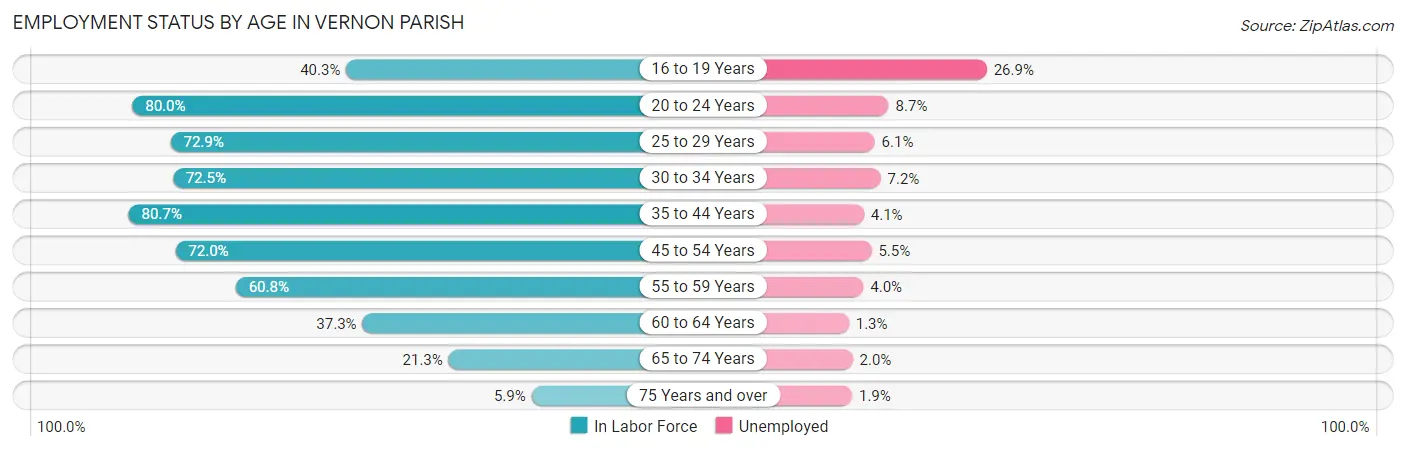
| Age Bracket | In Labor Force | Unemployed |
| 16 to 19 Years | 1,035 (40.3%) | 278 (26.9%) |
| 20 to 24 Years | 3,677 (80.0%) | 320 (8.7%) |
| 25 to 29 Years | 3,268 (72.9%) | 199 (6.1%) |
| 30 to 34 Years | 2,720 (72.5%) | 196 (7.2%) |
| 35 to 44 Years | 4,946 (80.7%) | 203 (4.1%) |
| 45 to 54 Years | 3,510 (72.0%) | 193 (5.5%) |
| 55 to 59 Years | 1,318 (60.8%) | 53 (4.0%) |
| 60 to 64 Years | 910 (37.3%) | 12 (1.3%) |
| 65 to 74 Years | 789 (21.3%) | 16 (2.0%) |
| 75 Years and over | 153 (5.9%) | 3 (1.9%) |
| Total | 22,314 (59.8%) | 1,361 (6.1%) |
Employment Status by Educational Attainment in Vernon Parish
According to labor force statistics for Vernon Parish, 69.9% of individuals (16,668) out of the total population between 25 and 64 years of age (23,846) are in the labor force, with 5.0% or 833 of them being unemployed. The group with the highest labor force participation rate are those with the educational attainment of bachelor's degree or higher, with 83.1% or 3,915 individuals in the labor force. Within the labor force, individuals with less than high school education have the highest percentage of unemployment, with 6.7% or 79 of them being unemployed.
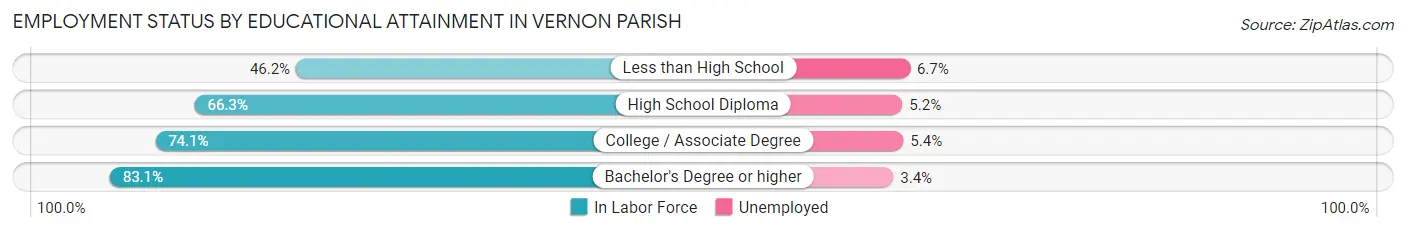
| Educational Attainment | In Labor Force | Unemployed |
| Less than High School | 1,180 (46.2%) | 171 (6.7%) |
| High School Diploma | 5,968 (66.3%) | 468 (5.2%) |
| College / Associate Degree | 5,617 (74.1%) | 409 (5.4%) |
| Bachelor's Degree or higher | 3,915 (83.1%) | 160 (3.4%) |
| Total | 16,668 (69.9%) | 1,192 (5.0%) |
Employment Occupations by Sex in Vernon Parish
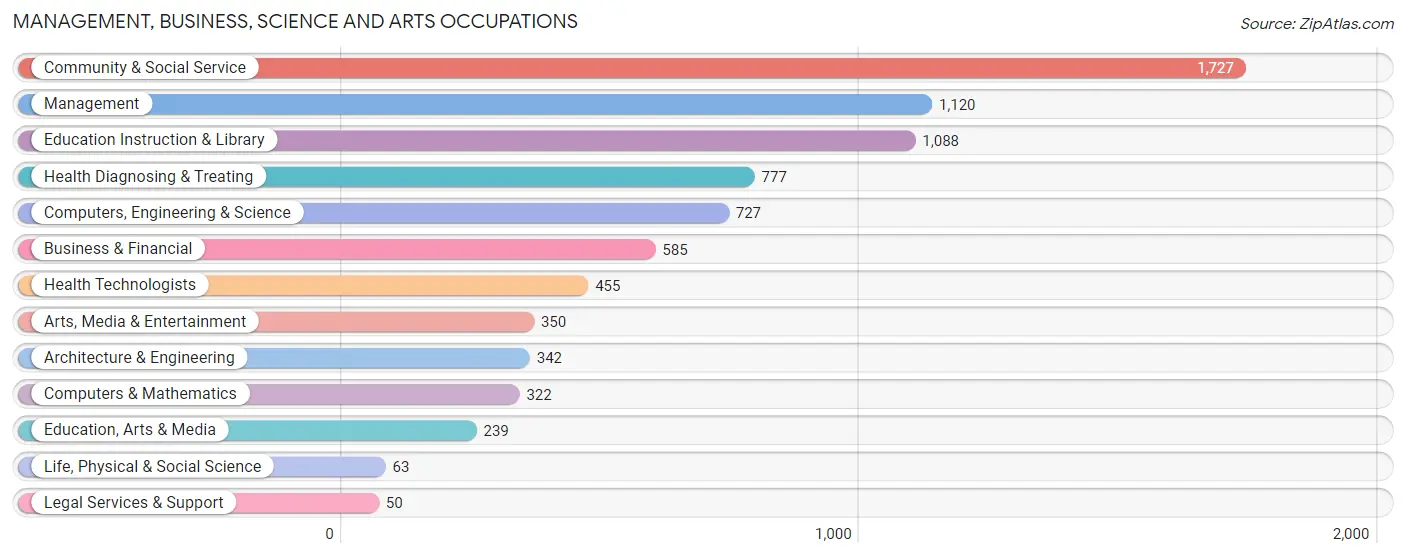
Management, Business, Science and Arts Occupations
The most common Management, Business, Science and Arts occupations in Vernon Parish are Community & Social Service (1,727 | 10.9%), Management (1,120 | 7.0%), Education Instruction & Library (1,088 | 6.9%), Health Diagnosing & Treating (777 | 4.9%), and Computers, Engineering & Science (727 | 4.6%).
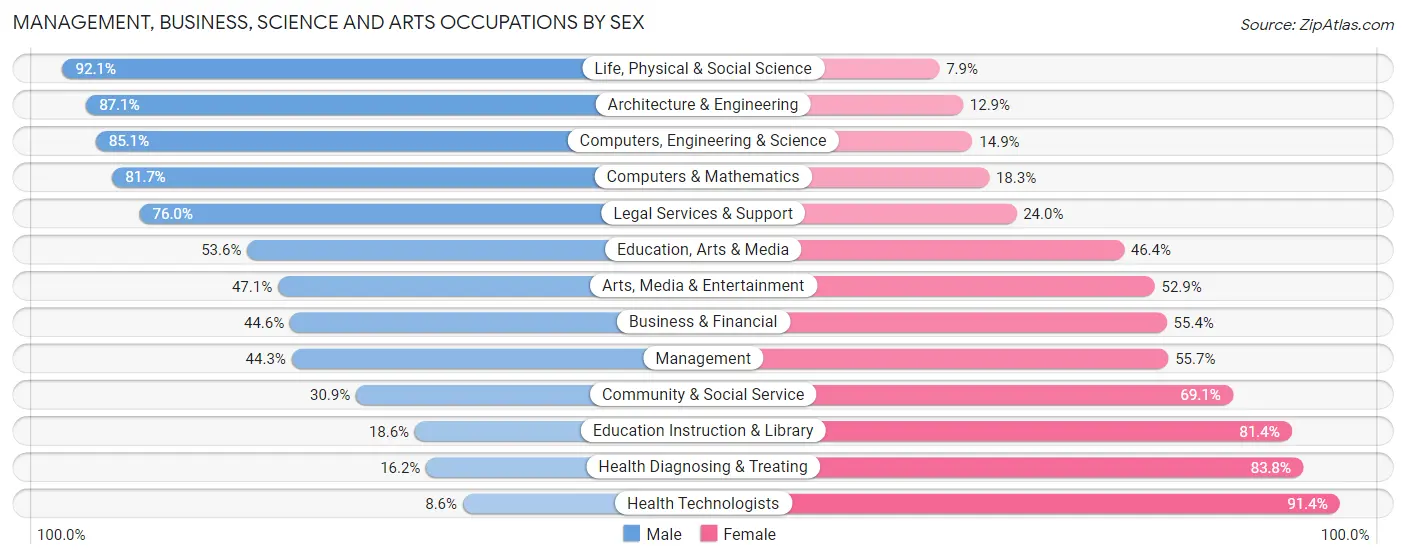
Management, Business, Science and Arts Occupations by Sex
Within the Management, Business, Science and Arts occupations in Vernon Parish, the most male-oriented occupations are Life, Physical & Social Science (92.1%), Architecture & Engineering (87.1%), and Computers, Engineering & Science (85.1%), while the most female-oriented occupations are Health Technologists (91.4%), Health Diagnosing & Treating (83.8%), and Education Instruction & Library (81.4%).
| Occupation | Male | Female |
| Management | 496 (44.3%) | 624 (55.7%) |
| Business & Financial | 261 (44.6%) | 324 (55.4%) |
| Computers, Engineering & Science | 619 (85.1%) | 108 (14.9%) |
| Computers & Mathematics | 263 (81.7%) | 59 (18.3%) |
| Architecture & Engineering | 298 (87.1%) | 44 (12.9%) |
| Life, Physical & Social Science | 58 (92.1%) | 5 (7.9%) |
| Community & Social Service | 533 (30.9%) | 1,194 (69.1%) |
| Education, Arts & Media | 128 (53.6%) | 111 (46.4%) |
| Legal Services & Support | 38 (76.0%) | 12 (24.0%) |
| Education Instruction & Library | 202 (18.6%) | 886 (81.4%) |
| Arts, Media & Entertainment | 165 (47.1%) | 185 (52.9%) |
| Health Diagnosing & Treating | 126 (16.2%) | 651 (83.8%) |
| Health Technologists | 39 (8.6%) | 416 (91.4%) |
| Total (Category) | 2,035 (41.2%) | 2,901 (58.8%) |
| Total (Overall) | 8,408 (52.9%) | 7,471 (47.0%) |
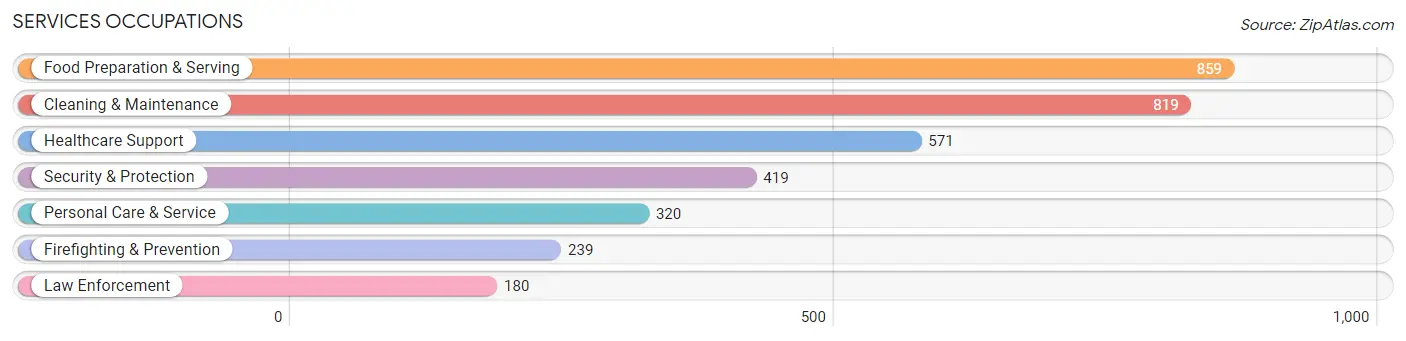
Services Occupations
The most common Services occupations in Vernon Parish are Food Preparation & Serving (859 | 5.4%), Cleaning & Maintenance (819 | 5.2%), Healthcare Support (571 | 3.6%), Security & Protection (419 | 2.6%), and Personal Care & Service (320 | 2.0%).
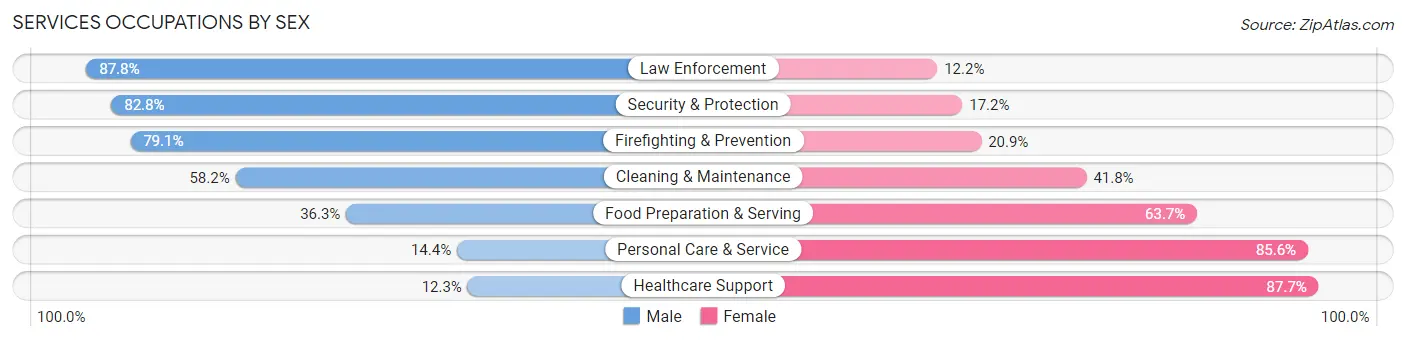
Services Occupations by Sex
Within the Services occupations in Vernon Parish, the most male-oriented occupations are Law Enforcement (87.8%), Security & Protection (82.8%), and Firefighting & Prevention (79.1%), while the most female-oriented occupations are Healthcare Support (87.7%), Personal Care & Service (85.6%), and Food Preparation & Serving (63.7%).
| Occupation | Male | Female |
| Healthcare Support | 70 (12.3%) | 501 (87.7%) |
| Security & Protection | 347 (82.8%) | 72 (17.2%) |
| Firefighting & Prevention | 189 (79.1%) | 50 (20.9%) |
| Law Enforcement | 158 (87.8%) | 22 (12.2%) |
| Food Preparation & Serving | 312 (36.3%) | 547 (63.7%) |
| Cleaning & Maintenance | 477 (58.2%) | 342 (41.8%) |
| Personal Care & Service | 46 (14.4%) | 274 (85.6%) |
| Total (Category) | 1,252 (41.9%) | 1,736 (58.1%) |
| Total (Overall) | 8,408 (52.9%) | 7,471 (47.0%) |
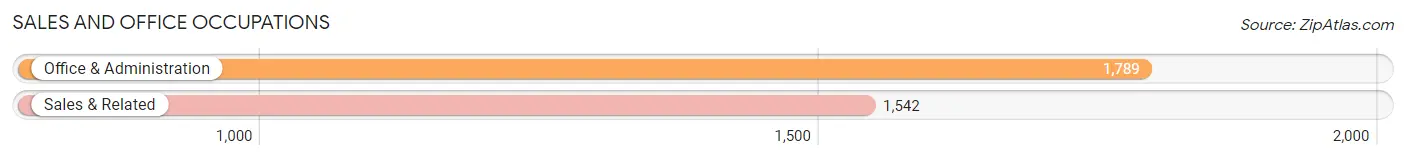
Sales and Office Occupations
The most common Sales and Office occupations in Vernon Parish are Office & Administration (1,789 | 11.3%), and Sales & Related (1,542 | 9.7%).
Sales and Office Occupations by Sex
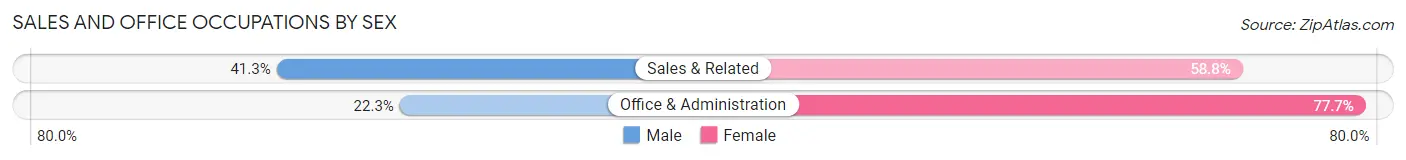
| Occupation | Male | Female |
| Sales & Related | 636 (41.2%) | 906 (58.8%) |
| Office & Administration | 399 (22.3%) | 1,390 (77.7%) |
| Total (Category) | 1,035 (31.1%) | 2,296 (68.9%) |
| Total (Overall) | 8,408 (52.9%) | 7,471 (47.0%) |
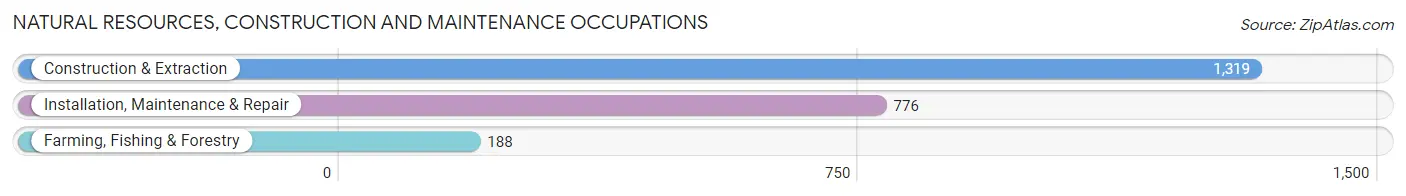
Natural Resources, Construction and Maintenance Occupations
The most common Natural Resources, Construction and Maintenance occupations in Vernon Parish are Construction & Extraction (1,319 | 8.3%), Installation, Maintenance & Repair (776 | 4.9%), and Farming, Fishing & Forestry (188 | 1.2%).
Natural Resources, Construction and Maintenance Occupations by Sex
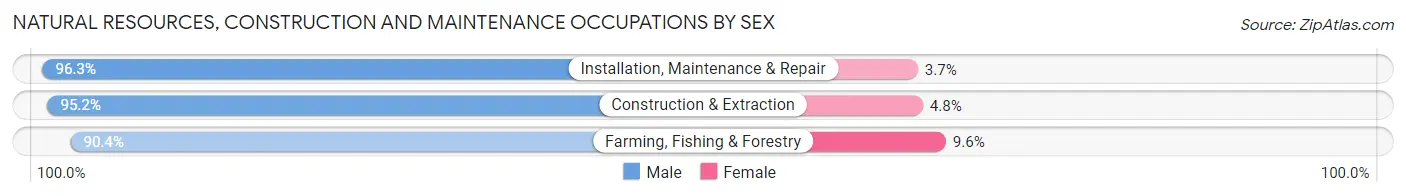
| Occupation | Male | Female |
| Farming, Fishing & Forestry | 170 (90.4%) | 18 (9.6%) |
| Construction & Extraction | 1,256 (95.2%) | 63 (4.8%) |
| Installation, Maintenance & Repair | 747 (96.3%) | 29 (3.7%) |
| Total (Category) | 2,173 (95.2%) | 110 (4.8%) |
| Total (Overall) | 8,408 (52.9%) | 7,471 (47.0%) |
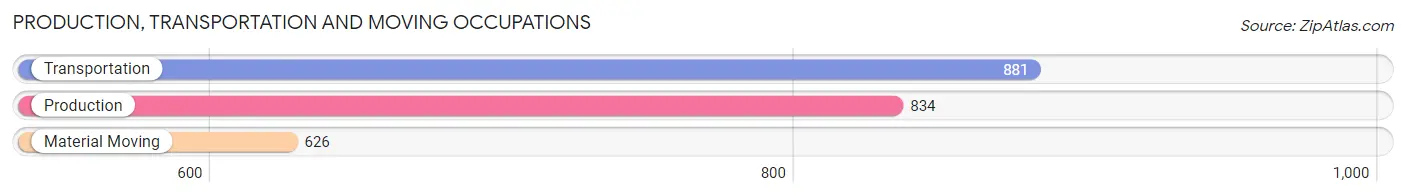
Production, Transportation and Moving Occupations
The most common Production, Transportation and Moving occupations in Vernon Parish are Transportation (881 | 5.6%), Production (834 | 5.2%), and Material Moving (626 | 3.9%).
Production, Transportation and Moving Occupations by Sex
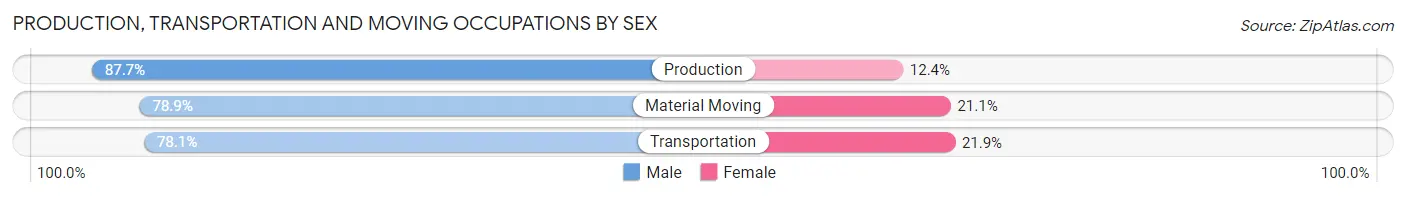
| Occupation | Male | Female |
| Production | 731 (87.6%) | 103 (12.3%) |
| Transportation | 688 (78.1%) | 193 (21.9%) |
| Material Moving | 494 (78.9%) | 132 (21.1%) |
| Total (Category) | 1,913 (81.7%) | 428 (18.3%) |
| Total (Overall) | 8,408 (52.9%) | 7,471 (47.0%) |
Employment Industries by Sex in Vernon Parish
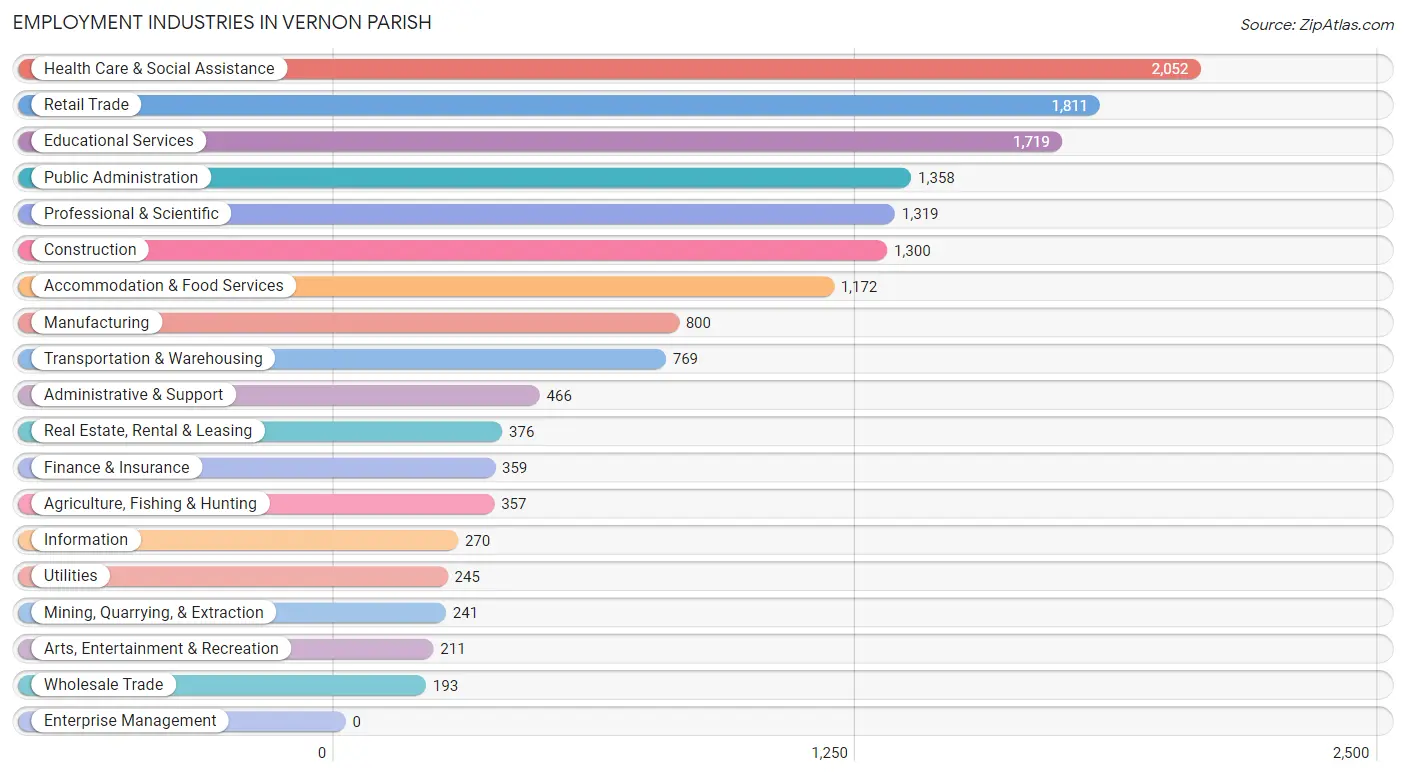
Employment Industries in Vernon Parish
The major employment industries in Vernon Parish include Health Care & Social Assistance (2,052 | 12.9%), Retail Trade (1,811 | 11.4%), Educational Services (1,719 | 10.8%), Public Administration (1,358 | 8.6%), and Professional & Scientific (1,319 | 8.3%).
Employment Industries by Sex in Vernon Parish
The Vernon Parish industries that see more men than women are Mining, Quarrying, & Extraction (97.1%), Wholesale Trade (93.8%), and Construction (90.6%), whereas the industries that tend to have a higher number of women are Health Care & Social Assistance (85.2%), Arts, Entertainment & Recreation (77.2%), and Real Estate, Rental & Leasing (72.3%).
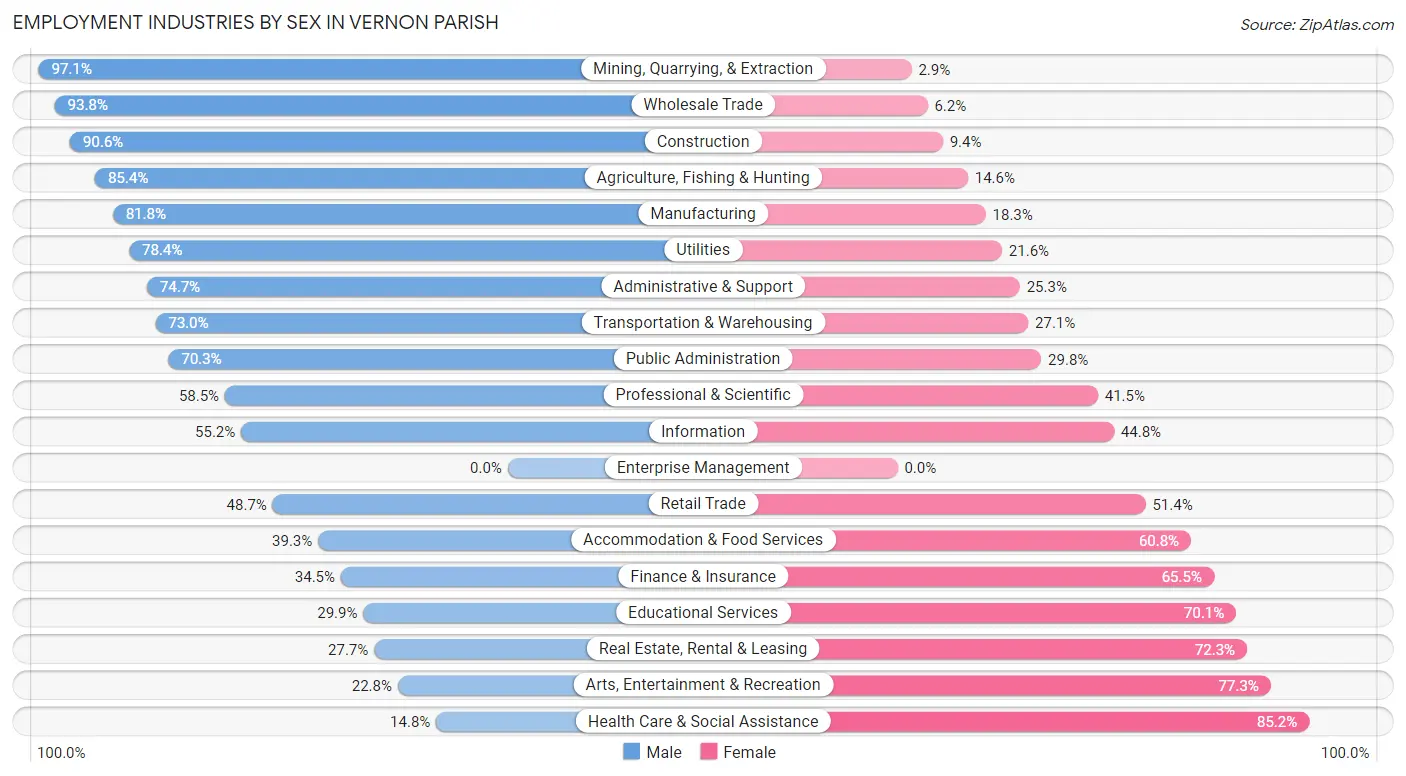
| Industry | Male | Female |
| Agriculture, Fishing & Hunting | 305 (85.4%) | 52 (14.6%) |
| Mining, Quarrying, & Extraction | 234 (97.1%) | 7 (2.9%) |
| Construction | 1,178 (90.6%) | 122 (9.4%) |
| Manufacturing | 654 (81.8%) | 146 (18.2%) |
| Wholesale Trade | 181 (93.8%) | 12 (6.2%) |
| Retail Trade | 881 (48.6%) | 930 (51.3%) |
| Transportation & Warehousing | 561 (73.0%) | 208 (27.1%) |
| Utilities | 192 (78.4%) | 53 (21.6%) |
| Information | 149 (55.2%) | 121 (44.8%) |
| Finance & Insurance | 124 (34.5%) | 235 (65.5%) |
| Real Estate, Rental & Leasing | 104 (27.7%) | 272 (72.3%) |
| Professional & Scientific | 772 (58.5%) | 547 (41.5%) |
| Enterprise Management | 0 (0.0%) | 0 (0.0%) |
| Administrative & Support | 348 (74.7%) | 118 (25.3%) |
| Educational Services | 514 (29.9%) | 1,205 (70.1%) |
| Health Care & Social Assistance | 304 (14.8%) | 1,748 (85.2%) |
| Arts, Entertainment & Recreation | 48 (22.8%) | 163 (77.2%) |
| Accommodation & Food Services | 460 (39.3%) | 712 (60.8%) |
| Public Administration | 954 (70.3%) | 404 (29.7%) |
| Total | 8,408 (52.9%) | 7,471 (47.0%) |
Education in Vernon Parish
School Enrollment in Vernon Parish
The most common levels of schooling among the 11,141 students in Vernon Parish are elementary school (2,807 | 25.2%), high school (2,461 | 22.1%), and middle school (2,384 | 21.4%).
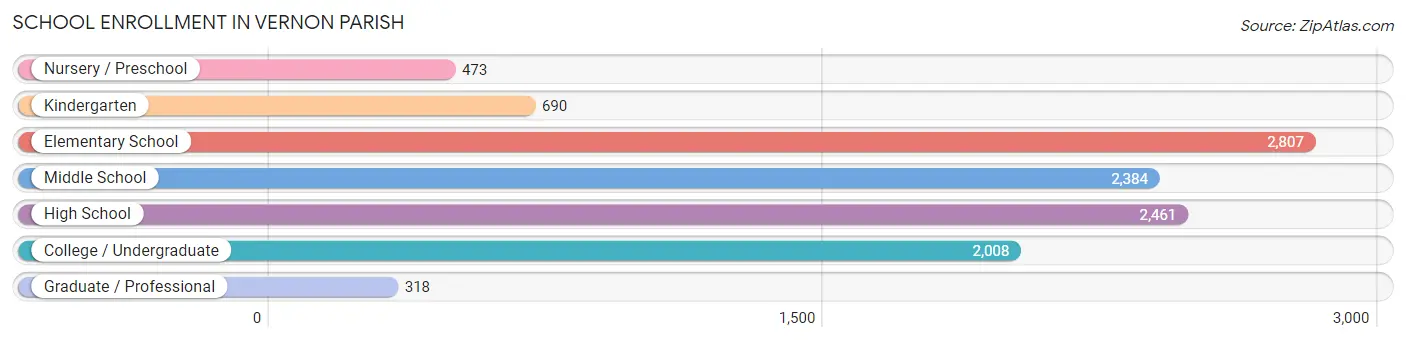
| School Level | # Students | % Students |
| Nursery / Preschool | 473 | 4.3% |
| Kindergarten | 690 | 6.2% |
| Elementary School | 2,807 | 25.2% |
| Middle School | 2,384 | 21.4% |
| High School | 2,461 | 22.1% |
| College / Undergraduate | 2,008 | 18.0% |
| Graduate / Professional | 318 | 2.9% |
| Total | 11,141 | 100.0% |
School Enrollment by Age by Funding Source in Vernon Parish
Out of a total of 11,141 students who are enrolled in schools in Vernon Parish, 1,270 (11.4%) attend a private institution, while the remaining 9,871 (88.6%) are enrolled in public schools. The age group of 3 to 4 year olds has the highest likelihood of being enrolled in private schools, with 116 (26.9% in the age bracket) enrolled. Conversely, the age group of 18 to 19 year olds has the lowest likelihood of being enrolled in a private school, with 660 (95.9% in the age bracket) attending a public institution.
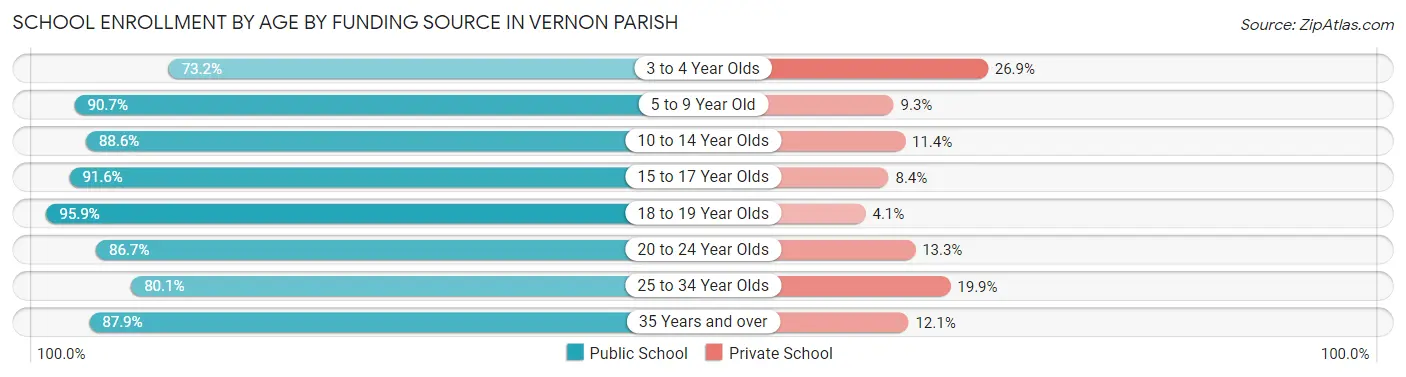
| Age Bracket | Public School | Private School |
| 3 to 4 Year Olds | 316 (73.2%) | 116 (26.9%) |
| 5 to 9 Year Old | 2,936 (90.7%) | 301 (9.3%) |
| 10 to 14 Year Olds | 2,773 (88.6%) | 358 (11.4%) |
| 15 to 17 Year Olds | 1,436 (91.6%) | 131 (8.4%) |
| 18 to 19 Year Olds | 660 (95.9%) | 28 (4.1%) |
| 20 to 24 Year Olds | 553 (86.7%) | 85 (13.3%) |
| 25 to 34 Year Olds | 742 (80.1%) | 184 (19.9%) |
| 35 Years and over | 459 (87.9%) | 63 (12.1%) |
| Total | 9,871 (88.6%) | 1,270 (11.4%) |
Educational Attainment by Field of Study in Vernon Parish
Business (1,043 | 17.3%), education (974 | 16.1%), science & technology (721 | 11.9%), arts & humanities (661 | 11.0%), and social sciences (468 | 7.7%) are the most common fields of study among 6,037 individuals in Vernon Parish who have obtained a bachelor's degree or higher.
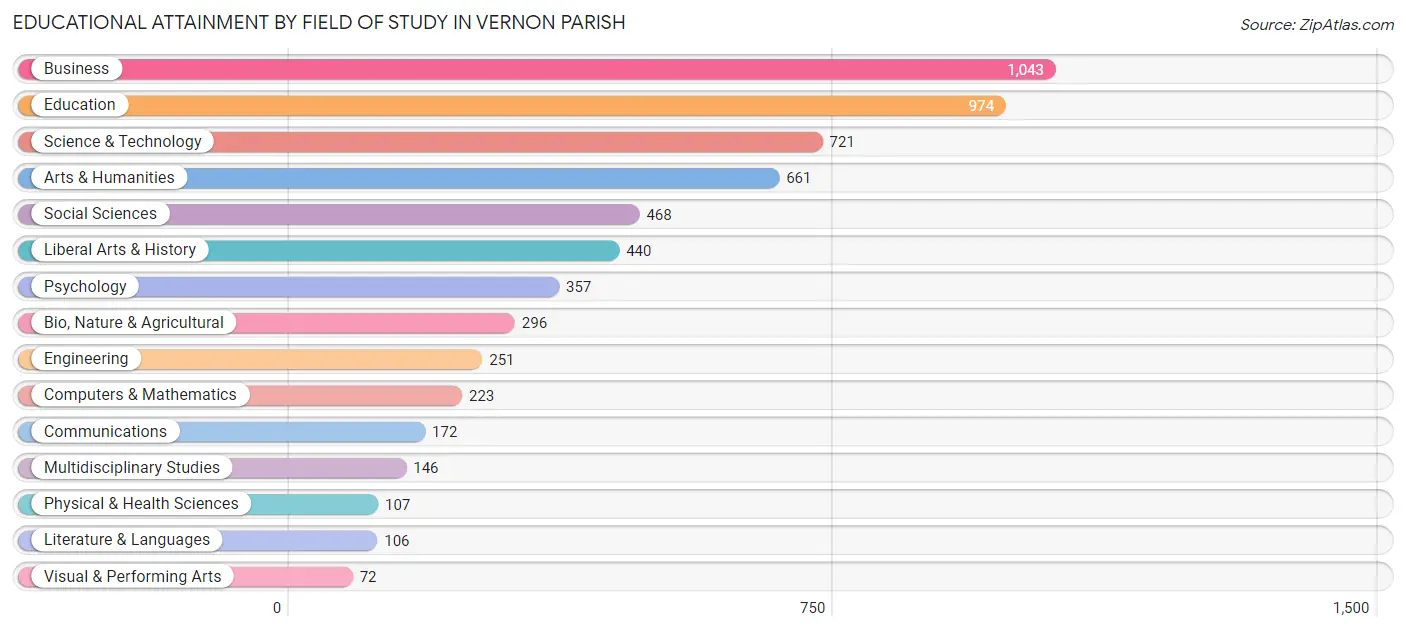
| Field of Study | # Graduates | % Graduates |
| Computers & Mathematics | 223 | 3.7% |
| Bio, Nature & Agricultural | 296 | 4.9% |
| Physical & Health Sciences | 107 | 1.8% |
| Psychology | 357 | 5.9% |
| Social Sciences | 468 | 7.7% |
| Engineering | 251 | 4.2% |
| Multidisciplinary Studies | 146 | 2.4% |
| Science & Technology | 721 | 11.9% |
| Business | 1,043 | 17.3% |
| Education | 974 | 16.1% |
| Literature & Languages | 106 | 1.8% |
| Liberal Arts & History | 440 | 7.3% |
| Visual & Performing Arts | 72 | 1.2% |
| Communications | 172 | 2.9% |
| Arts & Humanities | 661 | 11.0% |
| Total | 6,037 | 100.0% |
Transportation & Commute in Vernon Parish
Vehicle Availability by Sex in Vernon Parish
The most prevalent vehicle ownership categories in Vernon Parish are males with 2 vehicles (5,246, accounting for 44.7%) and females with 2 vehicles (2,942, making up 67.9%).
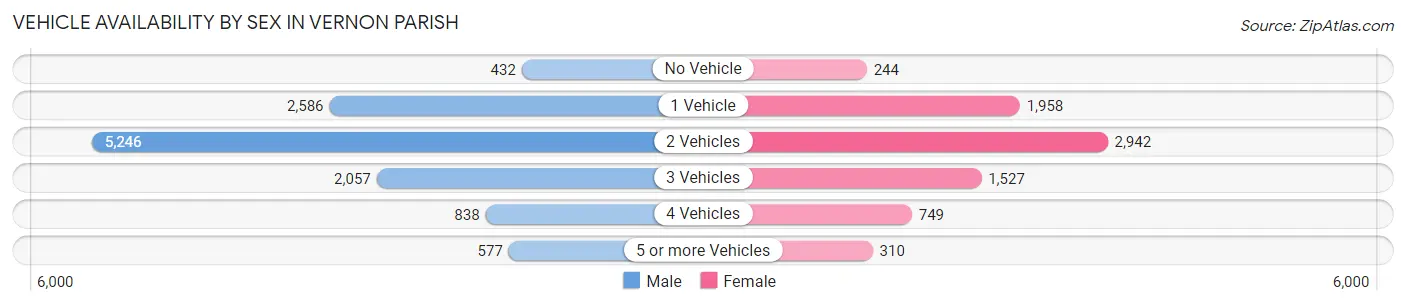
| Vehicles Available | Male | Female |
| No Vehicle | 432 (3.7%) | 244 (3.2%) |
| 1 Vehicle | 2,586 (22.0%) | 1,958 (25.3%) |
| 2 Vehicles | 5,246 (44.7%) | 2,942 (38.1%) |
| 3 Vehicles | 2,057 (17.5%) | 1,527 (19.8%) |
| 4 Vehicles | 838 (7.1%) | 749 (9.7%) |
| 5 or more Vehicles | 577 (4.9%) | 310 (4.0%) |
| Total | 11,736 (100.0%) | 7,730 (100.0%) |
Commute Time in Vernon Parish
The most frequently occuring commute durations in Vernon Parish are 15 to 19 minutes (4,369 commuters, 21.9%), 10 to 14 minutes (3,250 commuters, 16.3%), and 5 to 9 minutes (2,926 commuters, 14.6%).
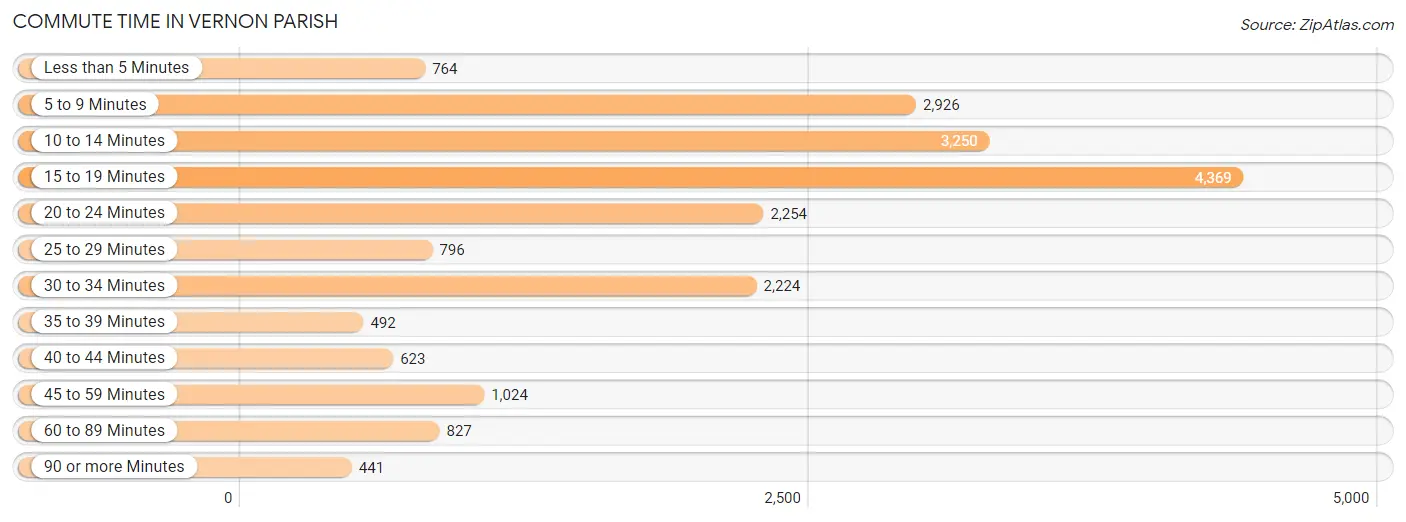
| Commute Time | # Commuters | % Commuters |
| Less than 5 Minutes | 764 | 3.8% |
| 5 to 9 Minutes | 2,926 | 14.6% |
| 10 to 14 Minutes | 3,250 | 16.3% |
| 15 to 19 Minutes | 4,369 | 21.9% |
| 20 to 24 Minutes | 2,254 | 11.3% |
| 25 to 29 Minutes | 796 | 4.0% |
| 30 to 34 Minutes | 2,224 | 11.1% |
| 35 to 39 Minutes | 492 | 2.5% |
| 40 to 44 Minutes | 623 | 3.1% |
| 45 to 59 Minutes | 1,024 | 5.1% |
| 60 to 89 Minutes | 827 | 4.1% |
| 90 or more Minutes | 441 | 2.2% |
Commute Time by Sex in Vernon Parish
The most common commute times in Vernon Parish are 15 to 19 minutes (2,563 commuters, 20.6%) for males and 15 to 19 minutes (1,806 commuters, 23.9%) for females.
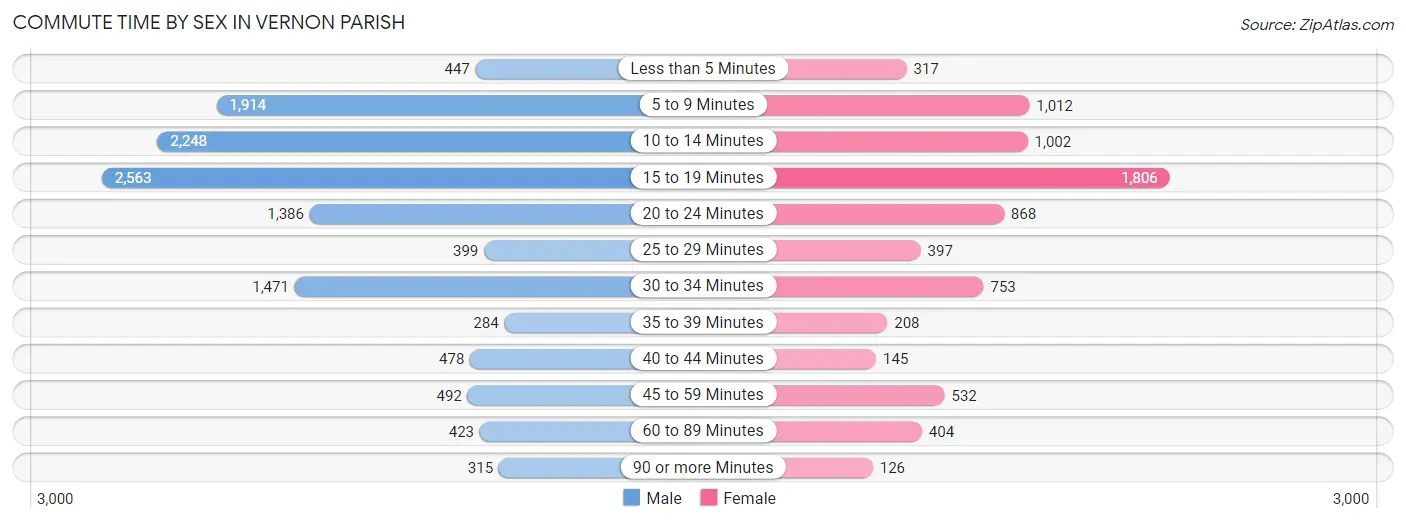
| Commute Time | Male | Female |
| Less than 5 Minutes | 447 (3.6%) | 317 (4.2%) |
| 5 to 9 Minutes | 1,914 (15.4%) | 1,012 (13.4%) |
| 10 to 14 Minutes | 2,248 (18.1%) | 1,002 (13.2%) |
| 15 to 19 Minutes | 2,563 (20.6%) | 1,806 (23.9%) |
| 20 to 24 Minutes | 1,386 (11.2%) | 868 (11.5%) |
| 25 to 29 Minutes | 399 (3.2%) | 397 (5.2%) |
| 30 to 34 Minutes | 1,471 (11.8%) | 753 (10.0%) |
| 35 to 39 Minutes | 284 (2.3%) | 208 (2.8%) |
| 40 to 44 Minutes | 478 (3.8%) | 145 (1.9%) |
| 45 to 59 Minutes | 492 (4.0%) | 532 (7.0%) |
| 60 to 89 Minutes | 423 (3.4%) | 404 (5.3%) |
| 90 or more Minutes | 315 (2.5%) | 126 (1.7%) |
Time of Departure to Work by Sex in Vernon Parish
The most frequent times of departure to work in Vernon Parish are 6:00 AM to 6:29 AM (2,427, 19.5%) for males and 7:00 AM to 7:29 AM (1,542, 20.4%) for females.
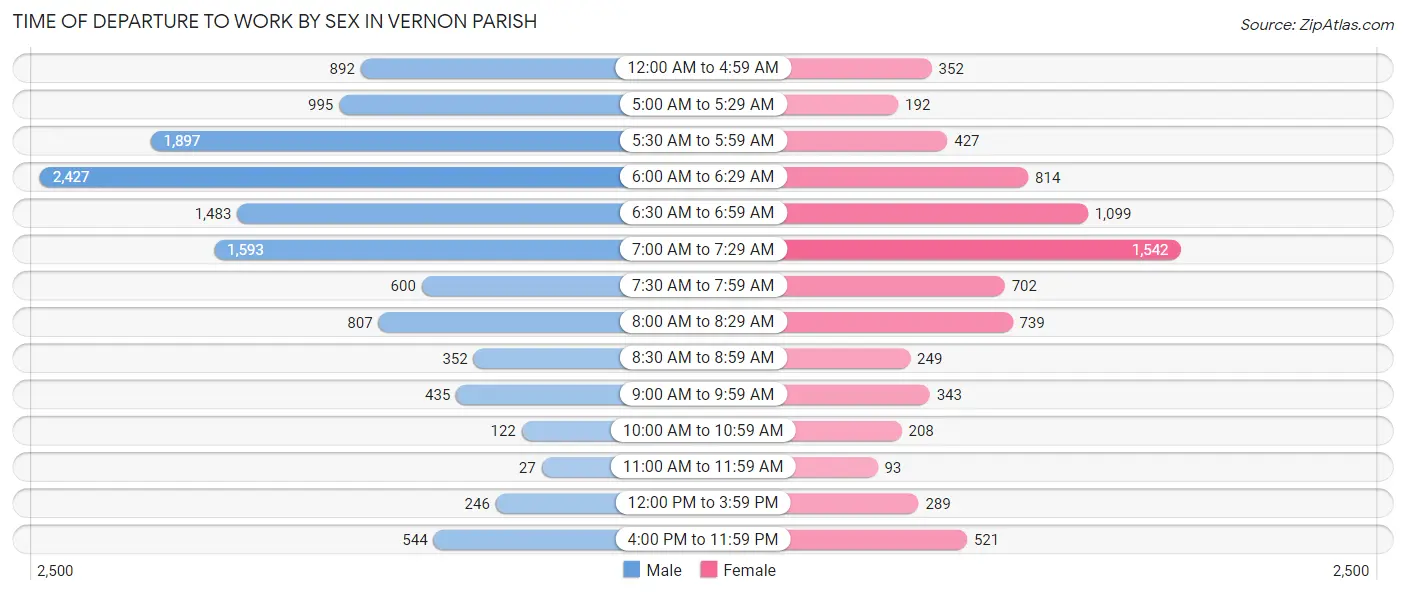
| Time of Departure | Male | Female |
| 12:00 AM to 4:59 AM | 892 (7.2%) | 352 (4.6%) |
| 5:00 AM to 5:29 AM | 995 (8.0%) | 192 (2.5%) |
| 5:30 AM to 5:59 AM | 1,897 (15.3%) | 427 (5.6%) |
| 6:00 AM to 6:29 AM | 2,427 (19.5%) | 814 (10.7%) |
| 6:30 AM to 6:59 AM | 1,483 (11.9%) | 1,099 (14.5%) |
| 7:00 AM to 7:29 AM | 1,593 (12.8%) | 1,542 (20.4%) |
| 7:30 AM to 7:59 AM | 600 (4.8%) | 702 (9.3%) |
| 8:00 AM to 8:29 AM | 807 (6.5%) | 739 (9.8%) |
| 8:30 AM to 8:59 AM | 352 (2.8%) | 249 (3.3%) |
| 9:00 AM to 9:59 AM | 435 (3.5%) | 343 (4.5%) |
| 10:00 AM to 10:59 AM | 122 (1.0%) | 208 (2.8%) |
| 11:00 AM to 11:59 AM | 27 (0.2%) | 93 (1.2%) |
| 12:00 PM to 3:59 PM | 246 (2.0%) | 289 (3.8%) |
| 4:00 PM to 11:59 PM | 544 (4.4%) | 521 (6.9%) |
| Total | 12,420 (100.0%) | 7,570 (100.0%) |
Housing Occupancy in Vernon Parish
Occupancy by Ownership in Vernon Parish
Of the total 17,726 dwellings in Vernon Parish, owner-occupied units account for 9,809 (55.3%), while renter-occupied units make up 7,917 (44.7%).
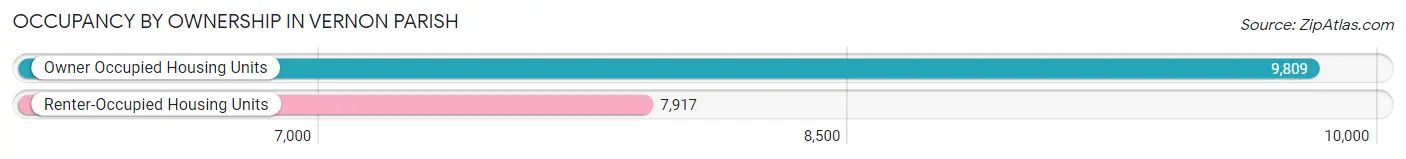
| Occupancy | # Housing Units | % Housing Units |
| Owner Occupied Housing Units | 9,809 | 55.3% |
| Renter-Occupied Housing Units | 7,917 | 44.7% |
| Total Occupied Housing Units | 17,726 | 100.0% |
Occupancy by Household Size in Vernon Parish
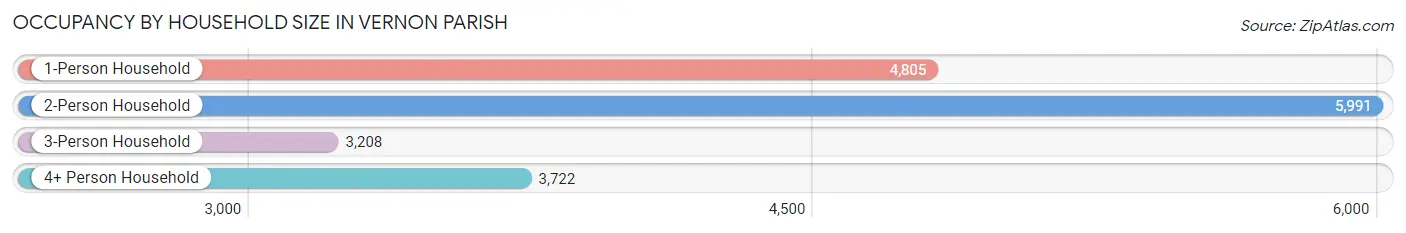
| Household Size | # Housing Units | % Housing Units |
| 1-Person Household | 4,805 | 27.1% |
| 2-Person Household | 5,991 | 33.8% |
| 3-Person Household | 3,208 | 18.1% |
| 4+ Person Household | 3,722 | 21.0% |
| Total Housing Units | 17,726 | 100.0% |
Occupancy by Ownership by Household Size in Vernon Parish
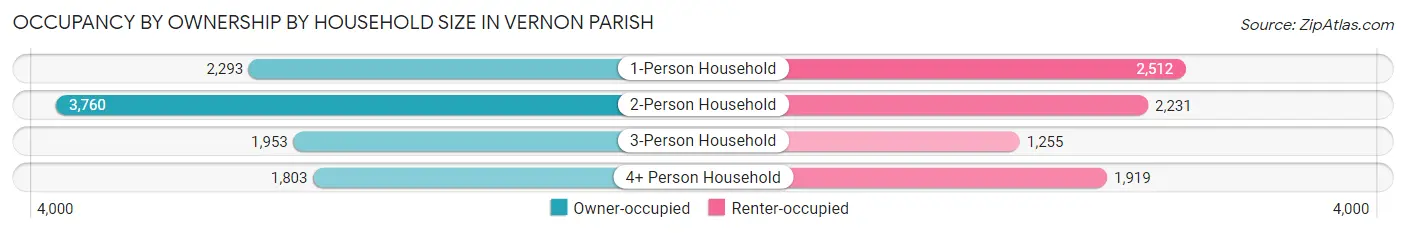
| Household Size | Owner-occupied | Renter-occupied |
| 1-Person Household | 2,293 (47.7%) | 2,512 (52.3%) |
| 2-Person Household | 3,760 (62.8%) | 2,231 (37.2%) |
| 3-Person Household | 1,953 (60.9%) | 1,255 (39.1%) |
| 4+ Person Household | 1,803 (48.4%) | 1,919 (51.6%) |
| Total Housing Units | 9,809 (55.3%) | 7,917 (44.7%) |
Occupancy by Educational Attainment in Vernon Parish
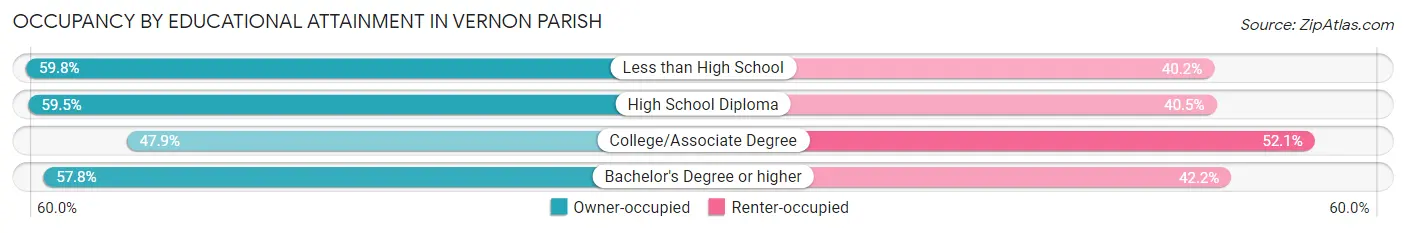
| Household Size | Owner-occupied | Renter-occupied |
| Less than High School | 1,073 (59.8%) | 721 (40.2%) |
| High School Diploma | 3,888 (59.5%) | 2,642 (40.5%) |
| College/Associate Degree | 2,819 (47.9%) | 3,071 (52.1%) |
| Bachelor's Degree or higher | 2,029 (57.8%) | 1,483 (42.2%) |
Occupancy by Age of Householder in Vernon Parish
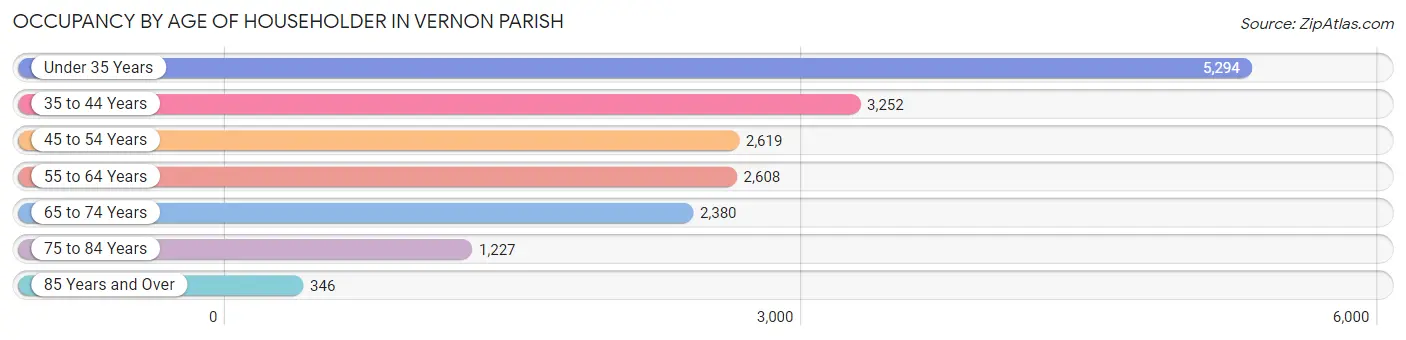
| Age Bracket | # Households | % Households |
| Under 35 Years | 5,294 | 29.9% |
| 35 to 44 Years | 3,252 | 18.3% |
| 45 to 54 Years | 2,619 | 14.8% |
| 55 to 64 Years | 2,608 | 14.7% |
| 65 to 74 Years | 2,380 | 13.4% |
| 75 to 84 Years | 1,227 | 6.9% |
| 85 Years and Over | 346 | 1.9% |
| Total | 17,726 | 100.0% |
Housing Finances in Vernon Parish
Median Income by Occupancy in Vernon Parish
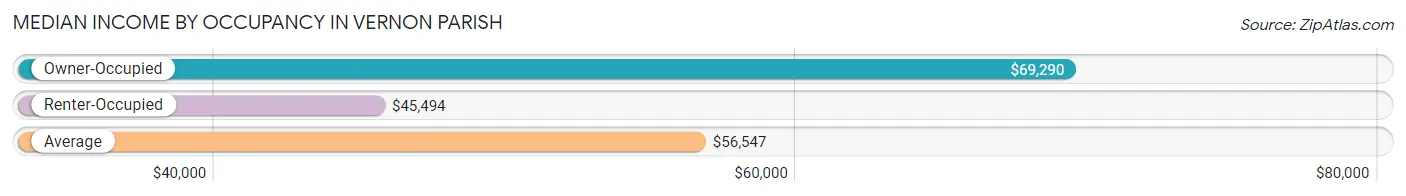
| Occupancy Type | # Households | Median Income |
| Owner-Occupied | 9,809 (55.3%) | $69,290 |
| Renter-Occupied | 7,917 (44.7%) | $45,494 |
| Average | 17,726 (100.0%) | $56,547 |
Occupancy by Householder Income Bracket in Vernon Parish
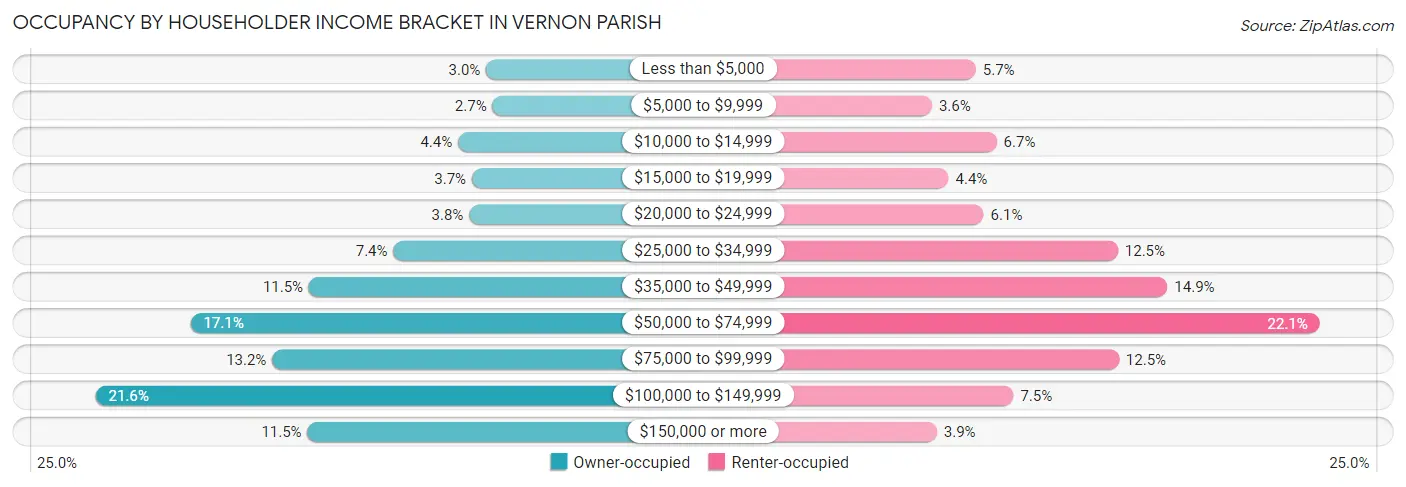
| Income Bracket | Owner-occupied | Renter-occupied |
| Less than $5,000 | 296 (3.0%) | 454 (5.7%) |
| $5,000 to $9,999 | 267 (2.7%) | 288 (3.6%) |
| $10,000 to $14,999 | 428 (4.4%) | 532 (6.7%) |
| $15,000 to $19,999 | 363 (3.7%) | 351 (4.4%) |
| $20,000 to $24,999 | 376 (3.8%) | 483 (6.1%) |
| $25,000 to $34,999 | 730 (7.4%) | 989 (12.5%) |
| $35,000 to $49,999 | 1,124 (11.5%) | 1,176 (14.8%) |
| $50,000 to $74,999 | 1,677 (17.1%) | 1,750 (22.1%) |
| $75,000 to $99,999 | 1,296 (13.2%) | 993 (12.5%) |
| $100,000 to $149,999 | 2,121 (21.6%) | 595 (7.5%) |
| $150,000 or more | 1,131 (11.5%) | 306 (3.9%) |
| Total | 9,809 (100.0%) | 7,917 (100.0%) |
Monthly Housing Cost Tiers in Vernon Parish
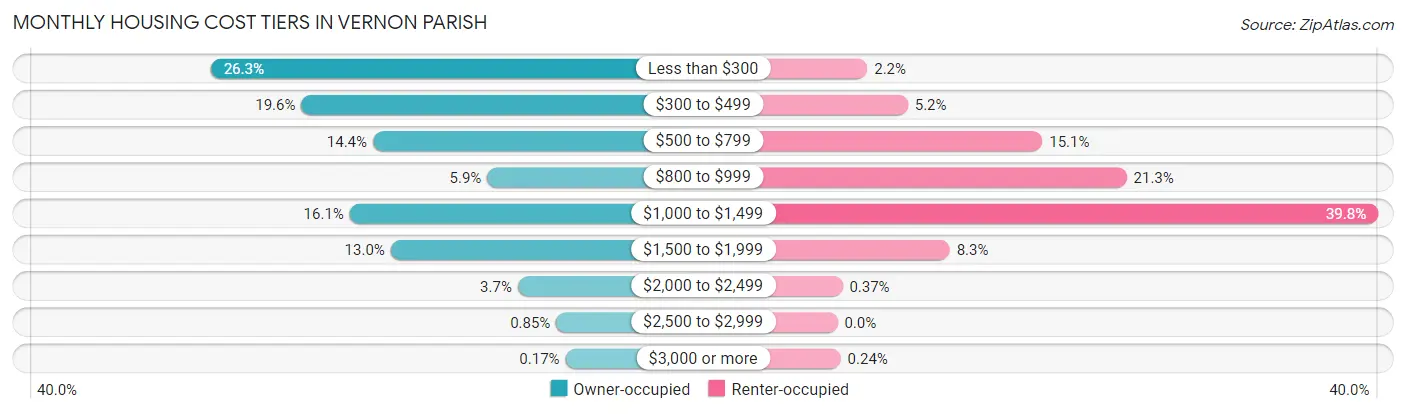
| Monthly Cost | Owner-occupied | Renter-occupied |
| Less than $300 | 2,579 (26.3%) | 174 (2.2%) |
| $300 to $499 | 1,925 (19.6%) | 410 (5.2%) |
| $500 to $799 | 1,408 (14.3%) | 1,195 (15.1%) |
| $800 to $999 | 582 (5.9%) | 1,686 (21.3%) |
| $1,000 to $1,499 | 1,575 (16.1%) | 3,152 (39.8%) |
| $1,500 to $1,999 | 1,279 (13.0%) | 655 (8.3%) |
| $2,000 to $2,499 | 361 (3.7%) | 29 (0.4%) |
| $2,500 to $2,999 | 83 (0.9%) | 0 (0.0%) |
| $3,000 or more | 17 (0.2%) | 19 (0.2%) |
| Total | 9,809 (100.0%) | 7,917 (100.0%) |
Physical Housing Characteristics in Vernon Parish
Housing Structures in Vernon Parish
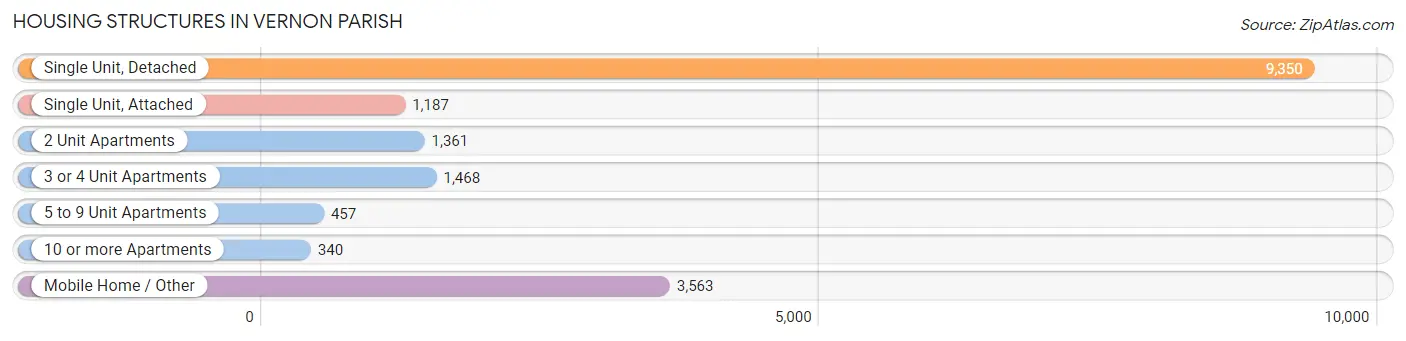
| Structure Type | # Housing Units | % Housing Units |
| Single Unit, Detached | 9,350 | 52.7% |
| Single Unit, Attached | 1,187 | 6.7% |
| 2 Unit Apartments | 1,361 | 7.7% |
| 3 or 4 Unit Apartments | 1,468 | 8.3% |
| 5 to 9 Unit Apartments | 457 | 2.6% |
| 10 or more Apartments | 340 | 1.9% |
| Mobile Home / Other | 3,563 | 20.1% |
| Total | 17,726 | 100.0% |
Housing Structures by Occupancy in Vernon Parish
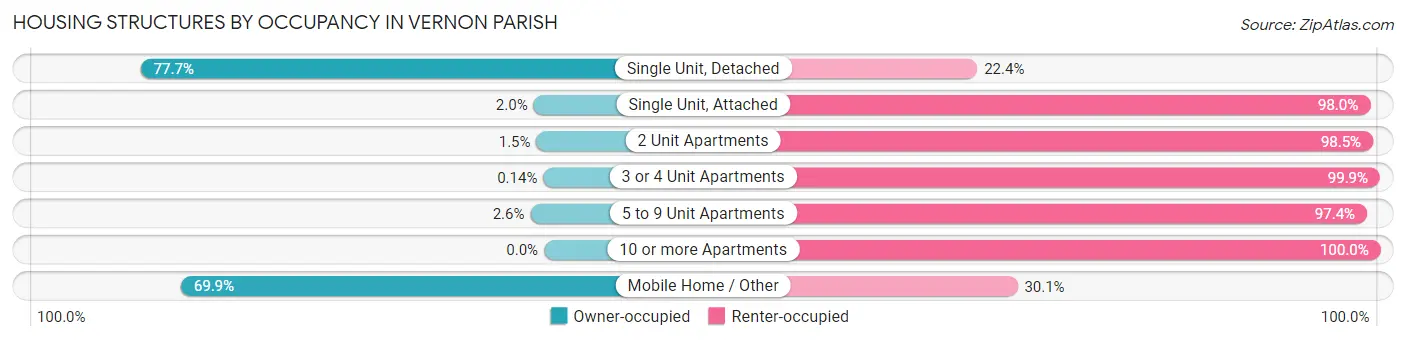
| Structure Type | Owner-occupied | Renter-occupied |
| Single Unit, Detached | 7,260 (77.6%) | 2,090 (22.4%) |
| Single Unit, Attached | 24 (2.0%) | 1,163 (98.0%) |
| 2 Unit Apartments | 20 (1.5%) | 1,341 (98.5%) |
| 3 or 4 Unit Apartments | 2 (0.1%) | 1,466 (99.9%) |
| 5 to 9 Unit Apartments | 12 (2.6%) | 445 (97.4%) |
| 10 or more Apartments | 0 (0.0%) | 340 (100.0%) |
| Mobile Home / Other | 2,491 (69.9%) | 1,072 (30.1%) |
| Total | 9,809 (55.3%) | 7,917 (44.7%) |
Housing Structures by Number of Rooms in Vernon Parish
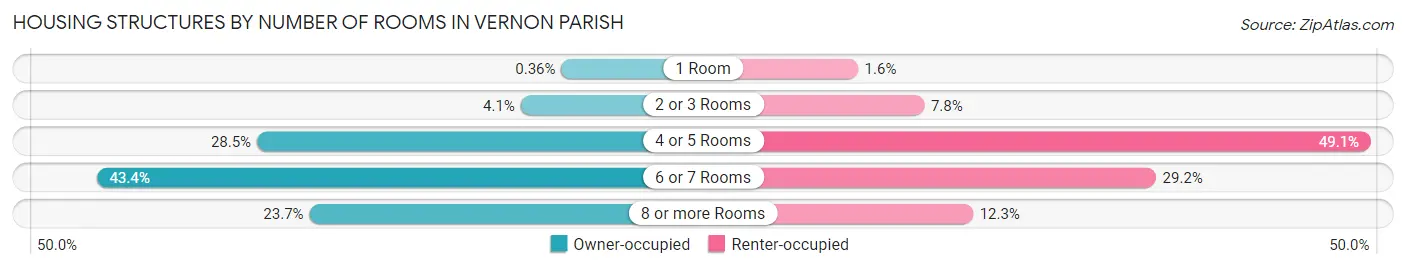
| Number of Rooms | Owner-occupied | Renter-occupied |
| 1 Room | 35 (0.4%) | 130 (1.6%) |
| 2 or 3 Rooms | 404 (4.1%) | 615 (7.8%) |
| 4 or 5 Rooms | 2,797 (28.5%) | 3,888 (49.1%) |
| 6 or 7 Rooms | 4,252 (43.3%) | 2,312 (29.2%) |
| 8 or more Rooms | 2,321 (23.7%) | 972 (12.3%) |
| Total | 9,809 (100.0%) | 7,917 (100.0%) |
Housing Structure by Heating Type in Vernon Parish
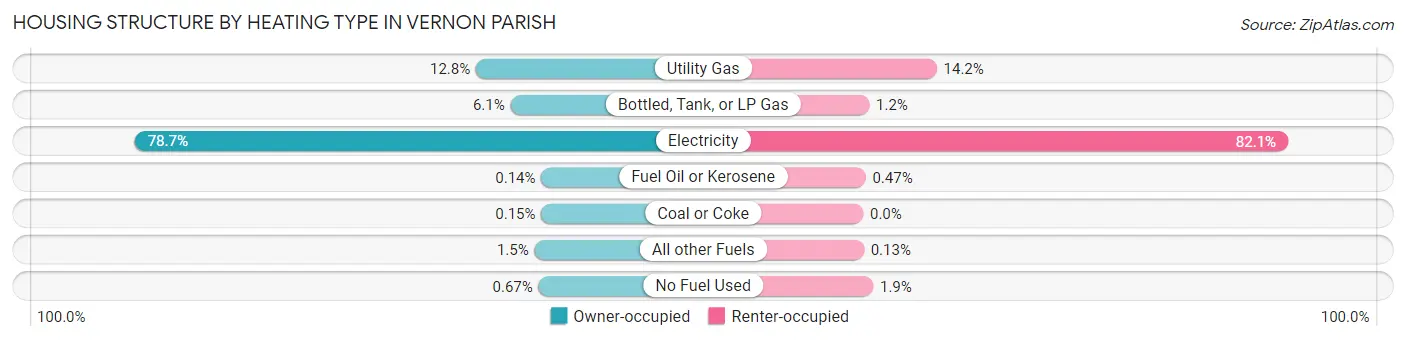
| Heating Type | Owner-occupied | Renter-occupied |
| Utility Gas | 1,253 (12.8%) | 1,125 (14.2%) |
| Bottled, Tank, or LP Gas | 597 (6.1%) | 93 (1.2%) |
| Electricity | 7,721 (78.7%) | 6,499 (82.1%) |
| Fuel Oil or Kerosene | 14 (0.1%) | 37 (0.5%) |
| Coal or Coke | 15 (0.2%) | 0 (0.0%) |
| All other Fuels | 143 (1.5%) | 10 (0.1%) |
| No Fuel Used | 66 (0.7%) | 153 (1.9%) |
| Total | 9,809 (100.0%) | 7,917 (100.0%) |
Household Vehicle Usage in Vernon Parish
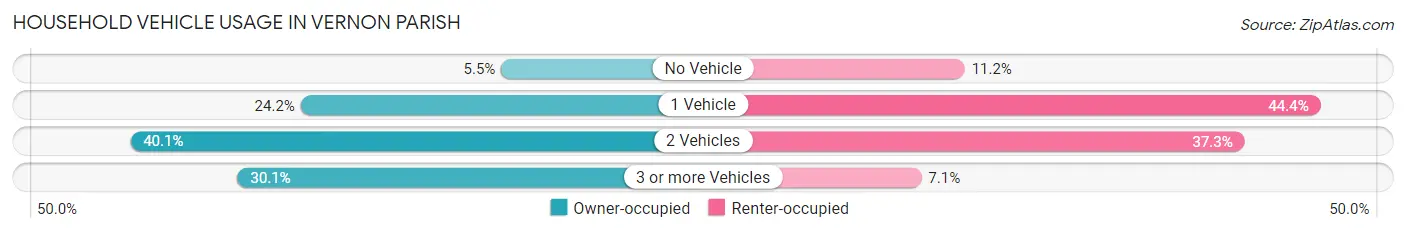
| Vehicles per Household | Owner-occupied | Renter-occupied |
| No Vehicle | 540 (5.5%) | 885 (11.2%) |
| 1 Vehicle | 2,377 (24.2%) | 3,514 (44.4%) |
| 2 Vehicles | 3,937 (40.1%) | 2,953 (37.3%) |
| 3 or more Vehicles | 2,955 (30.1%) | 565 (7.1%) |
| Total | 9,809 (100.0%) | 7,917 (100.0%) |
Real Estate & Mortgages in Vernon Parish
Real Estate and Mortgage Overview in Vernon Parish
| Characteristic | Without Mortgage | With Mortgage |
| Housing Units | 5,347 | 4,462 |
| Median Property Value | $98,500 | $190,500 |
| Median Household Income | $47,645 | $767 |
| Monthly Housing Costs | $312 | $13 |
| Real Estate Taxes | $351 | $1,986 |
Property Value by Mortgage Status in Vernon Parish
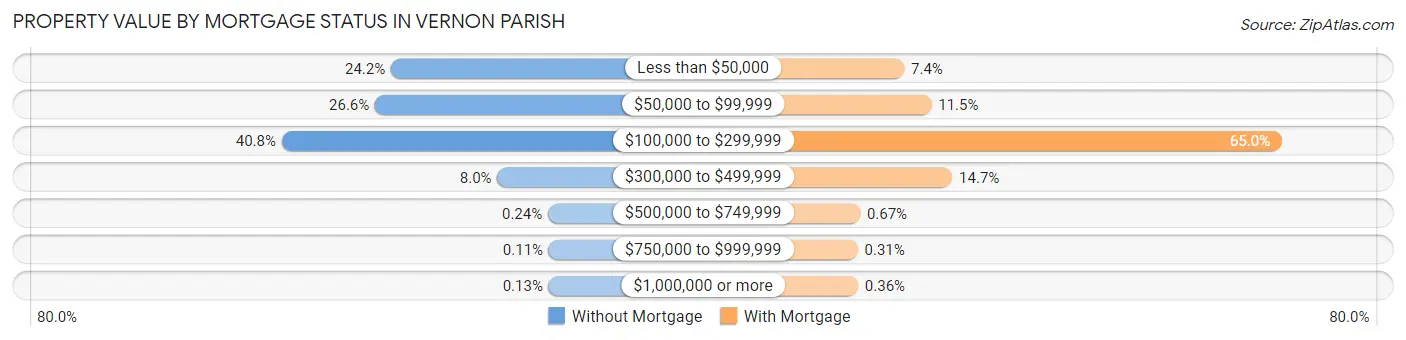
| Property Value | Without Mortgage | With Mortgage |
| Less than $50,000 | 1,292 (24.2%) | 330 (7.4%) |
| $50,000 to $99,999 | 1,422 (26.6%) | 515 (11.5%) |
| $100,000 to $299,999 | 2,182 (40.8%) | 2,900 (65.0%) |
| $300,000 to $499,999 | 425 (8.0%) | 657 (14.7%) |
| $500,000 to $749,999 | 13 (0.2%) | 30 (0.7%) |
| $750,000 to $999,999 | 6 (0.1%) | 14 (0.3%) |
| $1,000,000 or more | 7 (0.1%) | 16 (0.4%) |
| Total | 5,347 (100.0%) | 4,462 (100.0%) |
Household Income by Mortgage Status in Vernon Parish
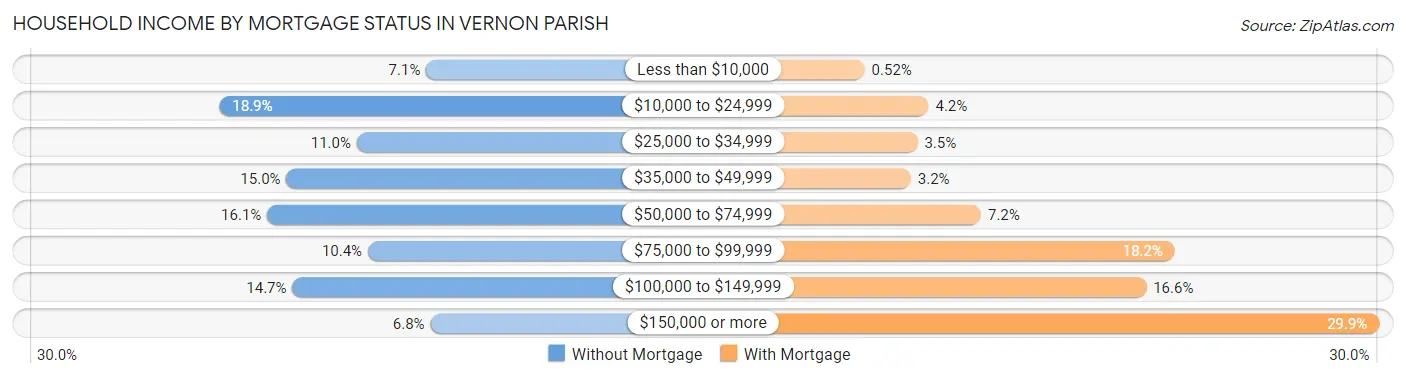
| Household Income | Without Mortgage | With Mortgage |
| Less than $10,000 | 377 (7.0%) | 23 (0.5%) |
| $10,000 to $24,999 | 1,009 (18.9%) | 186 (4.2%) |
| $25,000 to $34,999 | 589 (11.0%) | 158 (3.5%) |
| $35,000 to $49,999 | 804 (15.0%) | 141 (3.2%) |
| $50,000 to $74,999 | 863 (16.1%) | 320 (7.2%) |
| $75,000 to $99,999 | 555 (10.4%) | 814 (18.2%) |
| $100,000 to $149,999 | 786 (14.7%) | 741 (16.6%) |
| $150,000 or more | 364 (6.8%) | 1,335 (29.9%) |
| Total | 5,347 (100.0%) | 4,462 (100.0%) |
Property Value to Household Income Ratio in Vernon Parish
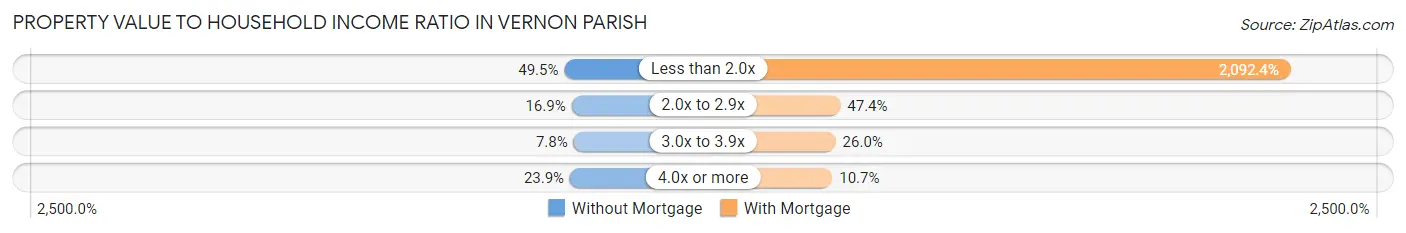
| Value-to-Income Ratio | Without Mortgage | With Mortgage |
| Less than 2.0x | 2,647 (49.5%) | 93,361 (2,092.4%) |
| 2.0x to 2.9x | 904 (16.9%) | 2,115 (47.4%) |
| 3.0x to 3.9x | 415 (7.8%) | 1,161 (26.0%) |
| 4.0x or more | 1,278 (23.9%) | 478 (10.7%) |
| Total | 5,347 (100.0%) | 4,462 (100.0%) |
Real Estate Taxes by Mortgage Status in Vernon Parish
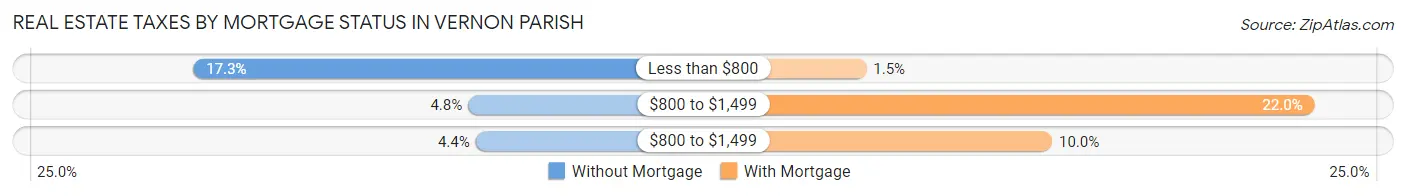
| Property Taxes | Without Mortgage | With Mortgage |
| Less than $800 | 925 (17.3%) | 68 (1.5%) |
| $800 to $1,499 | 254 (4.8%) | 981 (22.0%) |
| $800 to $1,499 | 236 (4.4%) | 446 (10.0%) |
| Total | 5,347 (100.0%) | 4,462 (100.0%) |
Health & Disability in Vernon Parish
Health Insurance Coverage by Age in Vernon Parish
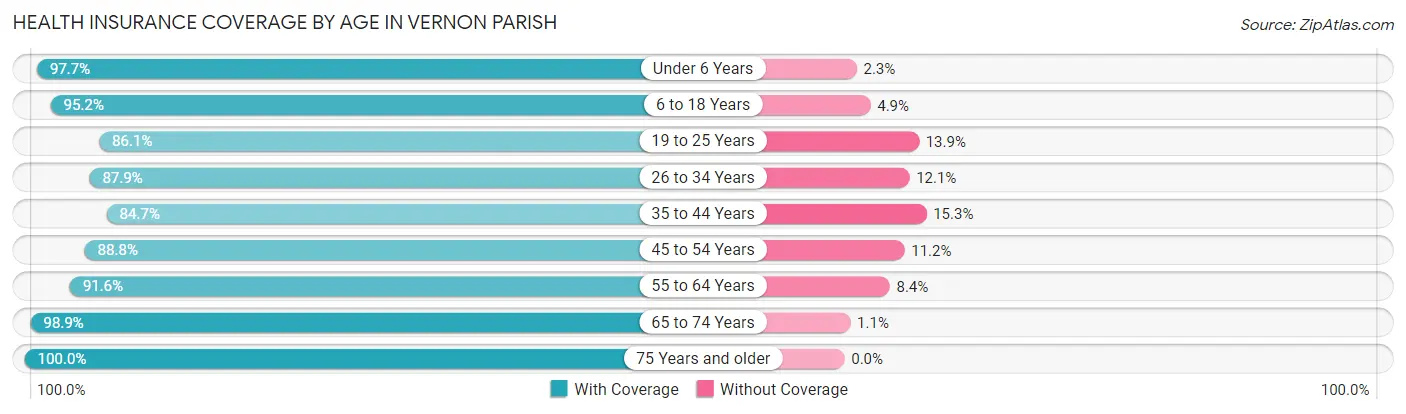
| Age Bracket | With Coverage | Without Coverage |
| Under 6 Years | 4,405 (97.7%) | 103 (2.3%) |
| 6 to 18 Years | 7,907 (95.2%) | 403 (4.9%) |
| 19 to 25 Years | 3,307 (86.1%) | 533 (13.9%) |
| 26 to 34 Years | 4,807 (87.9%) | 662 (12.1%) |
| 35 to 44 Years | 4,326 (84.7%) | 780 (15.3%) |
| 45 to 54 Years | 4,215 (88.8%) | 531 (11.2%) |
| 55 to 64 Years | 4,179 (91.6%) | 385 (8.4%) |
| 65 to 74 Years | 3,632 (98.9%) | 40 (1.1%) |
| 75 Years and older | 2,451 (100.0%) | 0 (0.0%) |
| Total | 39,229 (91.9%) | 3,437 (8.1%) |
Health Insurance Coverage by Citizenship Status in Vernon Parish
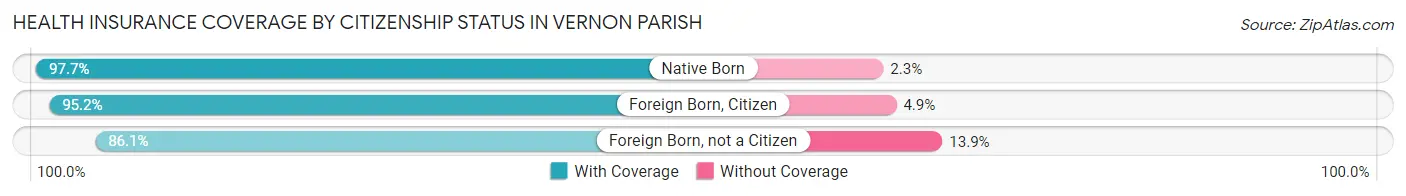
| Citizenship Status | With Coverage | Without Coverage |
| Native Born | 4,405 (97.7%) | 103 (2.3%) |
| Foreign Born, Citizen | 7,907 (95.2%) | 403 (4.9%) |
| Foreign Born, not a Citizen | 3,307 (86.1%) | 533 (13.9%) |
Health Insurance Coverage by Household Income in Vernon Parish
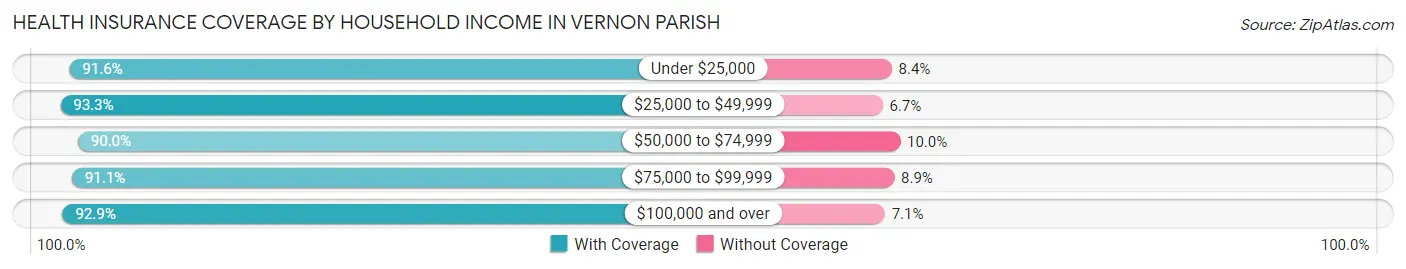
| Household Income | With Coverage | Without Coverage |
| Under $25,000 | 6,092 (91.6%) | 559 (8.4%) |
| $25,000 to $49,999 | 8,293 (93.3%) | 595 (6.7%) |
| $50,000 to $74,999 | 7,640 (90.0%) | 847 (10.0%) |
| $75,000 to $99,999 | 5,701 (91.1%) | 555 (8.9%) |
| $100,000 and over | 11,472 (92.9%) | 877 (7.1%) |
Public vs Private Health Insurance Coverage by Age in Vernon Parish
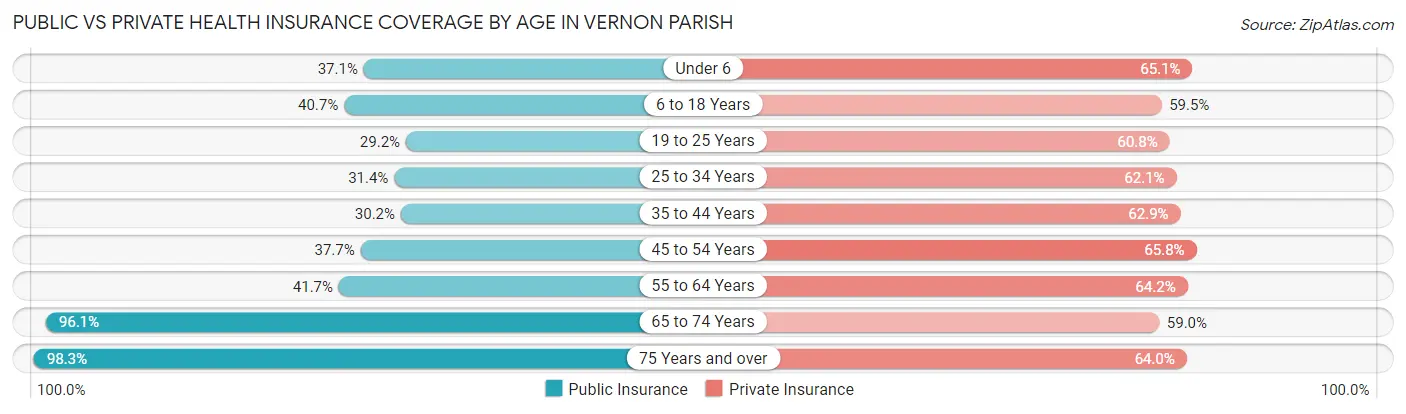
| Age Bracket | Public Insurance | Private Insurance |
| Under 6 | 1,670 (37.0%) | 2,934 (65.1%) |
| 6 to 18 Years | 3,382 (40.7%) | 4,942 (59.5%) |
| 19 to 25 Years | 1,122 (29.2%) | 2,336 (60.8%) |
| 25 to 34 Years | 1,717 (31.4%) | 3,397 (62.1%) |
| 35 to 44 Years | 1,540 (30.2%) | 3,209 (62.8%) |
| 45 to 54 Years | 1,787 (37.7%) | 3,124 (65.8%) |
| 55 to 64 Years | 1,902 (41.7%) | 2,929 (64.2%) |
| 65 to 74 Years | 3,527 (96.1%) | 2,168 (59.0%) |
| 75 Years and over | 2,409 (98.3%) | 1,569 (64.0%) |
| Total | 19,056 (44.7%) | 26,608 (62.4%) |
Disability Status by Sex by Age in Vernon Parish
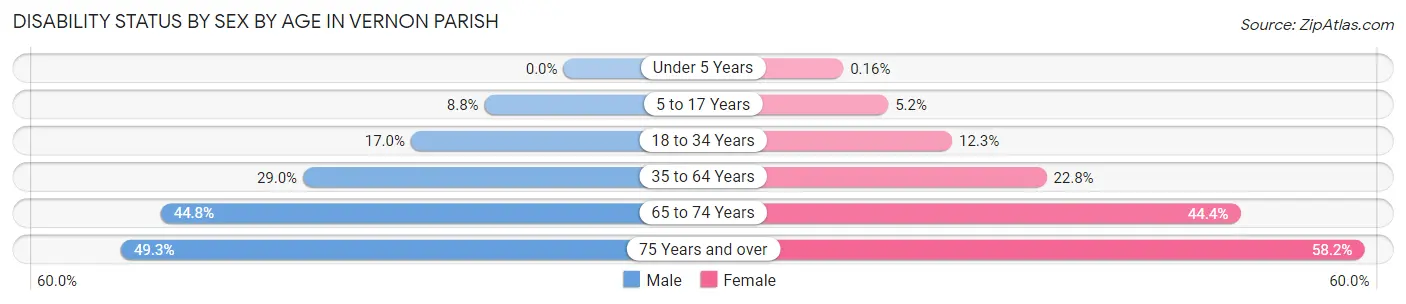
| Age Bracket | Male | Female |
| Under 5 Years | 0 (0.0%) | 3 (0.2%) |
| 5 to 17 Years | 371 (8.8%) | 213 (5.2%) |
| 18 to 34 Years | 731 (17.0%) | 686 (12.3%) |
| 35 to 64 Years | 2,042 (29.0%) | 1,681 (22.8%) |
| 65 to 74 Years | 772 (44.8%) | 865 (44.4%) |
| 75 Years and over | 496 (49.3%) | 840 (58.2%) |
Disability Class by Sex by Age in Vernon Parish
Disability Class: Hearing Difficulty
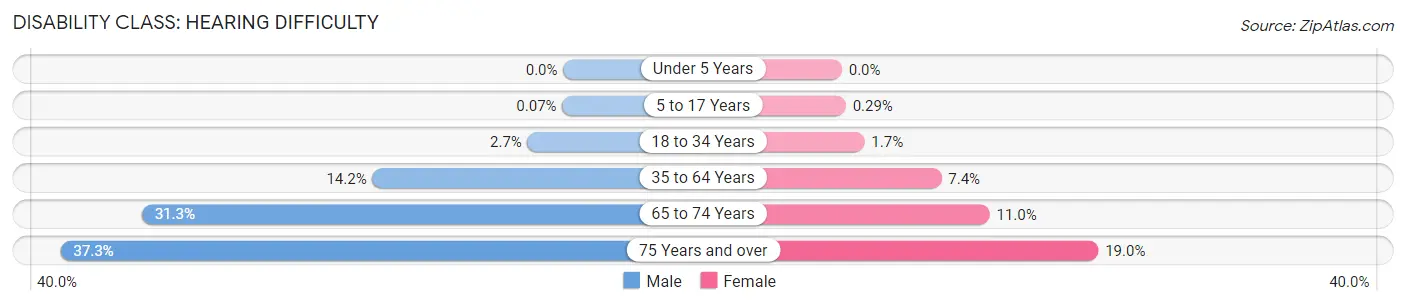
| Age Bracket | Male | Female |
| Under 5 Years | 0 (0.0%) | 0 (0.0%) |
| 5 to 17 Years | 3 (0.1%) | 12 (0.3%) |
| 18 to 34 Years | 114 (2.6%) | 94 (1.7%) |
| 35 to 64 Years | 998 (14.2%) | 545 (7.4%) |
| 65 to 74 Years | 539 (31.3%) | 214 (11.0%) |
| 75 Years and over | 376 (37.3%) | 275 (19.0%) |
Disability Class: Vision Difficulty
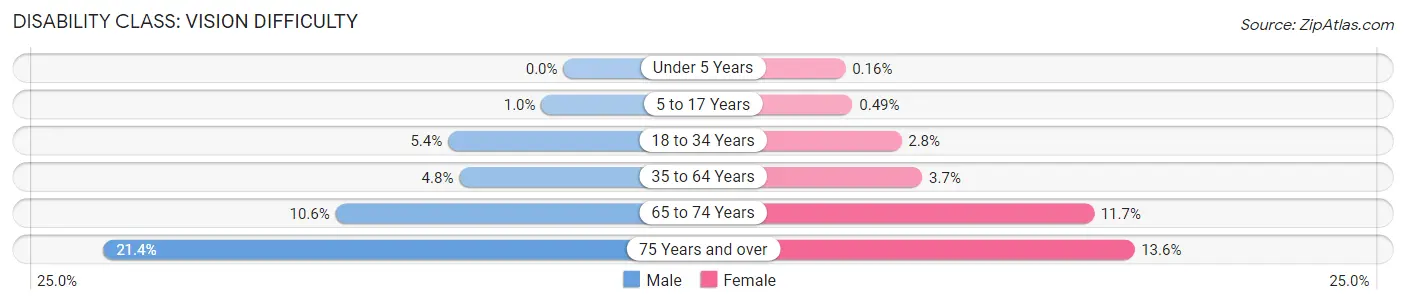
| Age Bracket | Male | Female |
| Under 5 Years | 0 (0.0%) | 3 (0.2%) |
| 5 to 17 Years | 43 (1.0%) | 20 (0.5%) |
| 18 to 34 Years | 230 (5.3%) | 154 (2.8%) |
| 35 to 64 Years | 340 (4.8%) | 275 (3.7%) |
| 65 to 74 Years | 182 (10.6%) | 228 (11.7%) |
| 75 Years and over | 215 (21.3%) | 196 (13.6%) |
Disability Class: Cognitive Difficulty
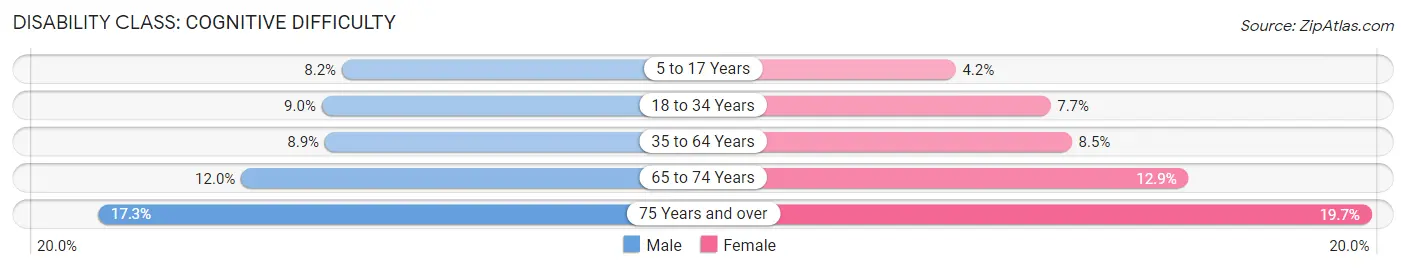
| Age Bracket | Male | Female |
| 5 to 17 Years | 347 (8.2%) | 174 (4.2%) |
| 18 to 34 Years | 386 (9.0%) | 432 (7.7%) |
| 35 to 64 Years | 623 (8.8%) | 629 (8.5%) |
| 65 to 74 Years | 206 (12.0%) | 251 (12.9%) |
| 75 Years and over | 174 (17.3%) | 284 (19.7%) |
Disability Class: Ambulatory Difficulty
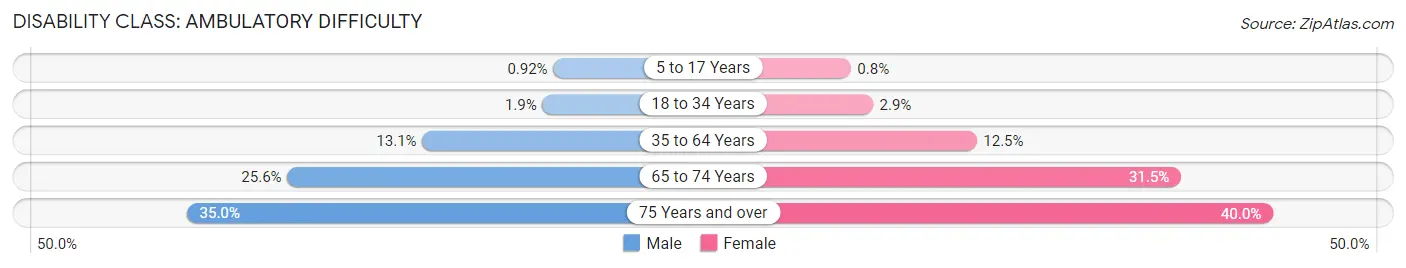
| Age Bracket | Male | Female |
| 5 to 17 Years | 39 (0.9%) | 33 (0.8%) |
| 18 to 34 Years | 83 (1.9%) | 160 (2.9%) |
| 35 to 64 Years | 921 (13.1%) | 921 (12.5%) |
| 65 to 74 Years | 441 (25.6%) | 614 (31.5%) |
| 75 Years and over | 352 (35.0%) | 578 (40.0%) |
Disability Class: Self-Care Difficulty
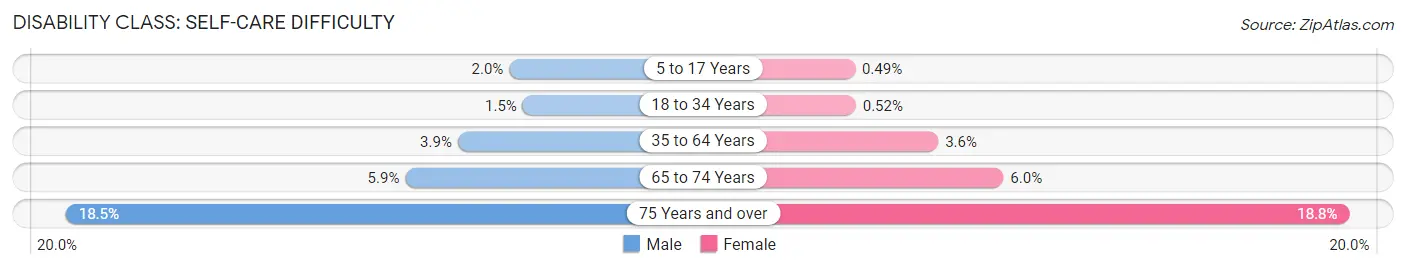
| Age Bracket | Male | Female |
| 5 to 17 Years | 85 (2.0%) | 20 (0.5%) |
| 18 to 34 Years | 65 (1.5%) | 29 (0.5%) |
| 35 to 64 Years | 276 (3.9%) | 264 (3.6%) |
| 65 to 74 Years | 101 (5.9%) | 117 (6.0%) |
| 75 Years and over | 186 (18.5%) | 272 (18.8%) |
Technology Access in Vernon Parish
Computing Device Access in Vernon Parish
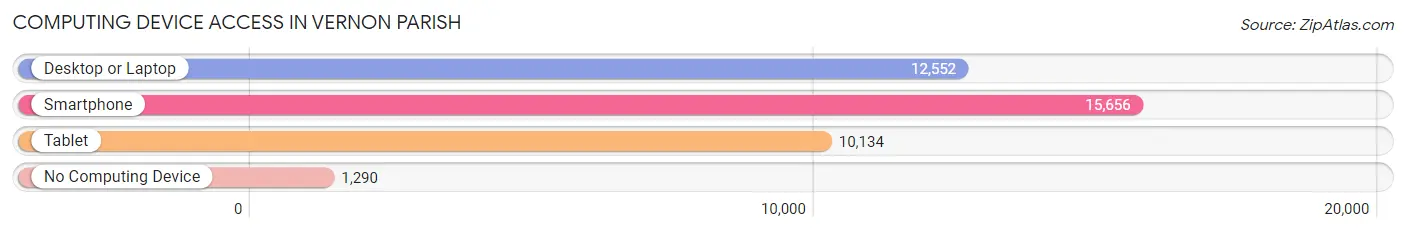
| Device Type | # Households | % Households |
| Desktop or Laptop | 12,552 | 70.8% |
| Smartphone | 15,656 | 88.3% |
| Tablet | 10,134 | 57.2% |
| No Computing Device | 1,290 | 7.3% |
| Total | 17,726 | 100.0% |
Internet Access in Vernon Parish
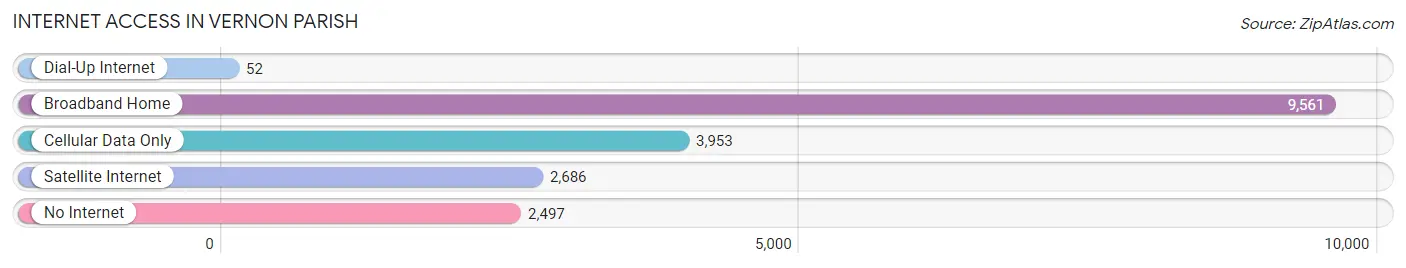
| Internet Type | # Households | % Households |
| Dial-Up Internet | 52 | 0.3% |
| Broadband Home | 9,561 | 53.9% |
| Cellular Data Only | 3,953 | 22.3% |
| Satellite Internet | 2,686 | 15.1% |
| No Internet | 2,497 | 14.1% |
| Total | 17,726 | 100.0% |
Vernon Parish Summary
Vernon Parish is a parish located in the state of Louisiana in the United States. It is located in the northwest corner of the state and is bordered by the states of Texas and Arkansas. The parish seat is Leesville. As of the 2010 census, the population was 52,334.
History
Vernon Parish was created in 1871 from the former Natchitoches Parish. It was named for Mount Vernon, the home of George Washington. The parish was originally part of the Neutral Strip, a disputed area between the United States and Spain. The Neutral Strip was eventually ceded to the United States in 1819.
Geography
Vernon Parish is located in the northwest corner of Louisiana and is bordered by the states of Texas and Arkansas. It is approximately 5,000 square miles in size and is divided into seven townships. The parish is mostly rural, with the majority of the population living in small towns and villages. The parish is home to the Kisatchie National Forest, which covers over 600,000 acres.
The parish is located in the Central Gulf Coastal Plain region of Louisiana. The terrain is mostly flat, with some rolling hills in the northern part of the parish. The climate is humid subtropical, with hot, humid summers and mild winters.
Economy
The economy of Vernon Parish is largely based on agriculture and forestry. The parish is home to several large timber companies, as well as numerous small farms. The parish is also home to several oil and gas production companies.
The parish is home to Fort Polk, a major U.S. Army installation. The base is home to the Joint Readiness Training Center and the Army's Air Assault School. The base is a major employer in the parish, providing jobs for thousands of people.
Demographics
As of the 2010 census, the population of Vernon Parish was 52,334. The population is mostly white (77.3%), with African Americans making up 19.3% of the population. The median household income is $37,845, and the median age is 37.
The parish is home to several Native American tribes, including the Choctaw, Chitimacha, and Coushatta. The parish is also home to a large Hispanic population, with Hispanics making up 8.3% of the population.
Conclusion
Vernon Parish is a rural parish located in the northwest corner of Louisiana. It is home to a diverse population and a strong economy based on agriculture and forestry. The parish is also home to Fort Polk, a major U.S. Army installation. Vernon Parish is a great place to live, work, and raise a family.
Common Questions
What is the Total Population of Vernon Parish?
Total Population of Vernon Parish is 48,452.
What is the Total Male Population of Vernon Parish?
Total Male Population of Vernon Parish is 25,336.
What is the Total Female Population of Vernon Parish?
Total Female Population of Vernon Parish is 23,116.
What is the Ratio of Males per 100 Females in Vernon Parish?
There are 109.60 Males per 100 Females in Vernon Parish.
What is the Ratio of Females per 100 Males in Vernon Parish?
There are 91.24 Females per 100 Males in Vernon Parish.
What is the Median Population Age in Vernon Parish?
Median Population Age in Vernon Parish is 31.5 Years.
What is the Average Family Size in Vernon Parish
Average Family Size in Vernon Parish is 3.2 People.
What is the Average Household Size in Vernon Parish
Average Household Size in Vernon Parish is 2.6 People.
What is Per Capita Income in Vernon Parish?
Per Capita income in Vernon Parish is $28,797.
What is the Median Family Income in Vernon Parish?
Median Family Income in Vernon Parish is $65,394.
What is the Median Household income in Vernon Parish?
Median Household Income in Vernon Parish is $56,547.
What is Income or Wage Gap in Vernon Parish?
Income or Wage Gap in Vernon Parish is 32.7%.
Women in Vernon Parish earn 67.3 cents for every dollar earned by a man.
What is Family Income Deficit in Vernon Parish?
Family Income Deficit in Vernon Parish is $9,998.
Families that are below poverty line in Vernon Parish earn $9,998 less on average than the poverty threshold level.
What is Inequality or Gini Index in Vernon Parish?
Inequality or Gini Index in Vernon Parish is 0.46.
How Large is the Labor Force in Vernon Parish?
There are 22,314 People in the Labor Forcein in Vernon Parish.
What is the Percentage of People in the Labor Force in Vernon Parish?
59.8% of People are in the Labor Force in Vernon Parish.
What is the Unemployment Rate in Vernon Parish?
Unemployment Rate in Vernon Parish is 6.1%.