Vermilion Parish, LA
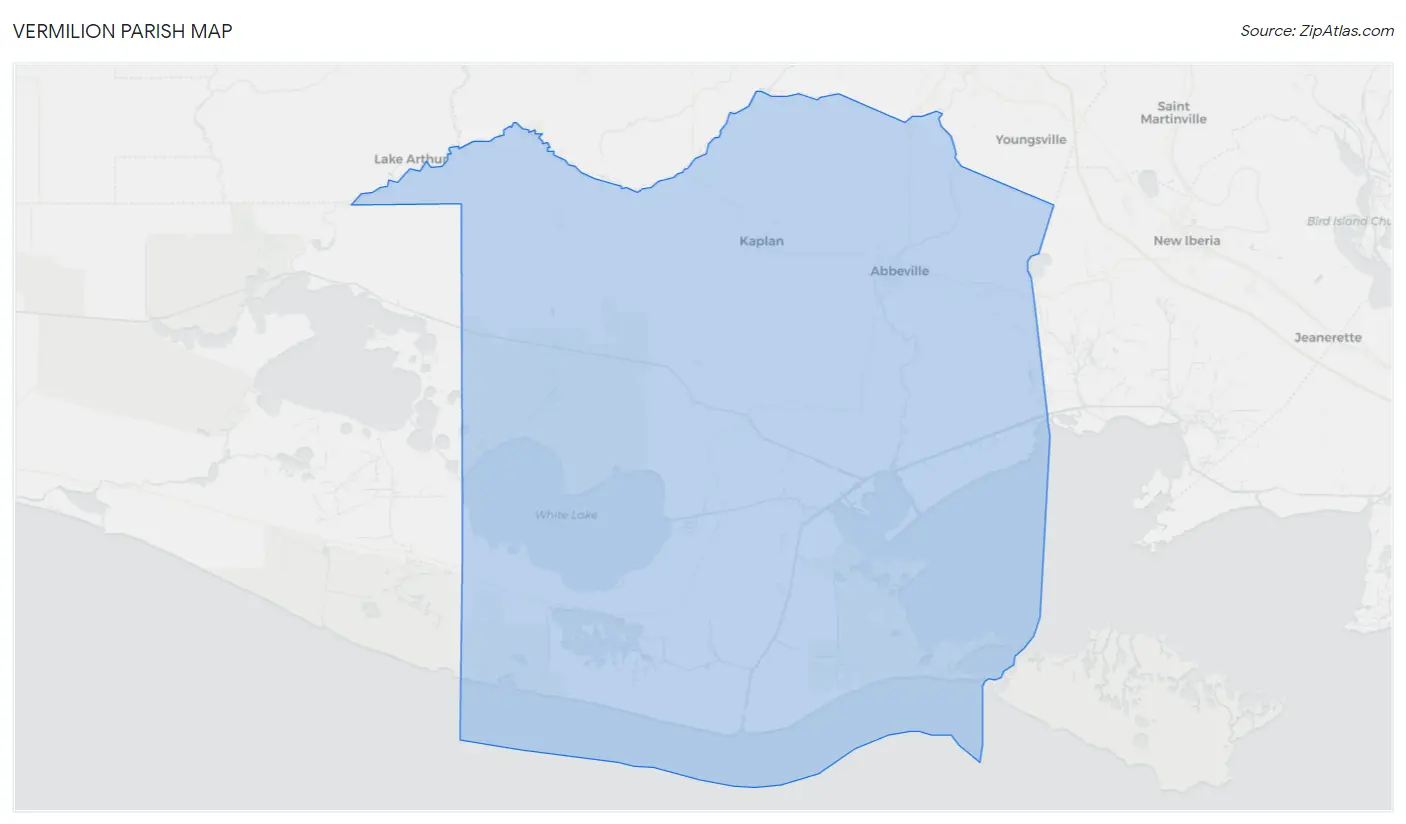
Vermilion Parish Map
Vermilion Parish Overview
57,202
TOTAL POPULATION
27,840
MALE POPULATION
29,362
FEMALE POPULATION
94.82
MALES / 100 FEMALES
105.47
FEMALES / 100 MALES
38.6
MEDIAN AGE
3.1
AVG FAMILY SIZE
2.6
AVG HOUSEHOLD SIZE
$29,293
PER CAPITA INCOME
$70,308
AVG FAMILY INCOME
$56,194
AVG HOUSEHOLD INCOME
49.7%
WAGE / INCOME GAP [ % ]
50.3¢/ $1
WAGE / INCOME GAP [ $ ]
$10,240
FAMILY INCOME DEFICIT
0.47
INEQUALITY / GINI INDEX
24,735
LABOR FORCE [ PEOPLE ]
55.6%
PERCENT IN LABOR FORCE
6.2%
UNEMPLOYMENT RATE
Vermilion Parish Area Codes
Race in Vermilion Parish
The most populous races in Vermilion Parish are White / Caucasian (45,074 | 78.8%), Black / African American (7,718 | 13.5%), and Two or more Races (2,812 | 4.9%).
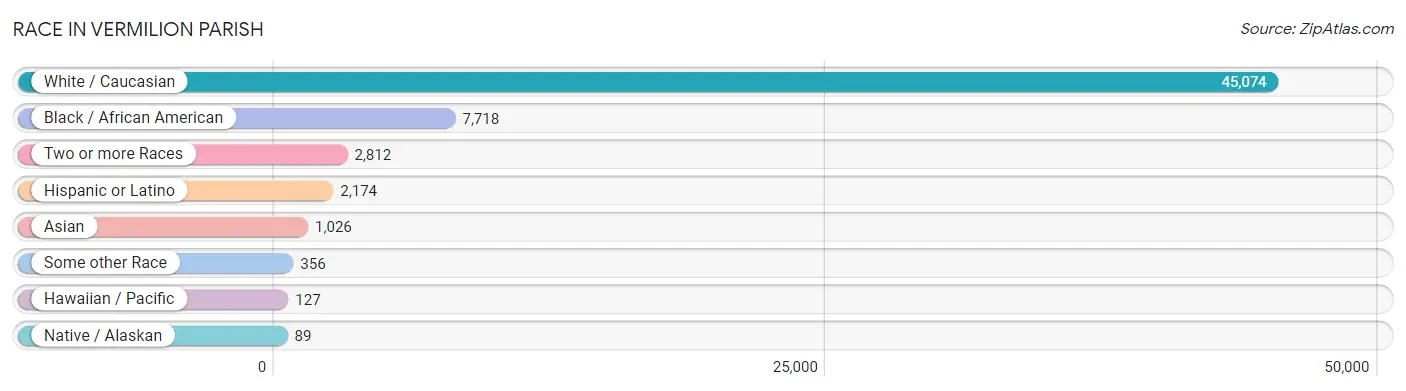
| Race | # Population | % Population |
| Asian | 1,026 | 1.8% |
| Black / African American | 7,718 | 13.5% |
| Hawaiian / Pacific | 127 | 0.2% |
| Hispanic or Latino | 2,174 | 3.8% |
| Native / Alaskan | 89 | 0.2% |
| White / Caucasian | 45,074 | 78.8% |
| Two or more Races | 2,812 | 4.9% |
| Some other Race | 356 | 0.6% |
| Total | 57,202 | 100.0% |
Ancestry in Vermilion Parish
The most populous ancestries reported in Vermilion Parish are French (9,494 | 16.6%), French Canadian (5,078 | 8.9%), American (4,853 | 8.5%), Cajun (3,866 | 6.8%), and German (3,622 | 6.3%), together accounting for 47.1% of all Vermilion Parish residents.
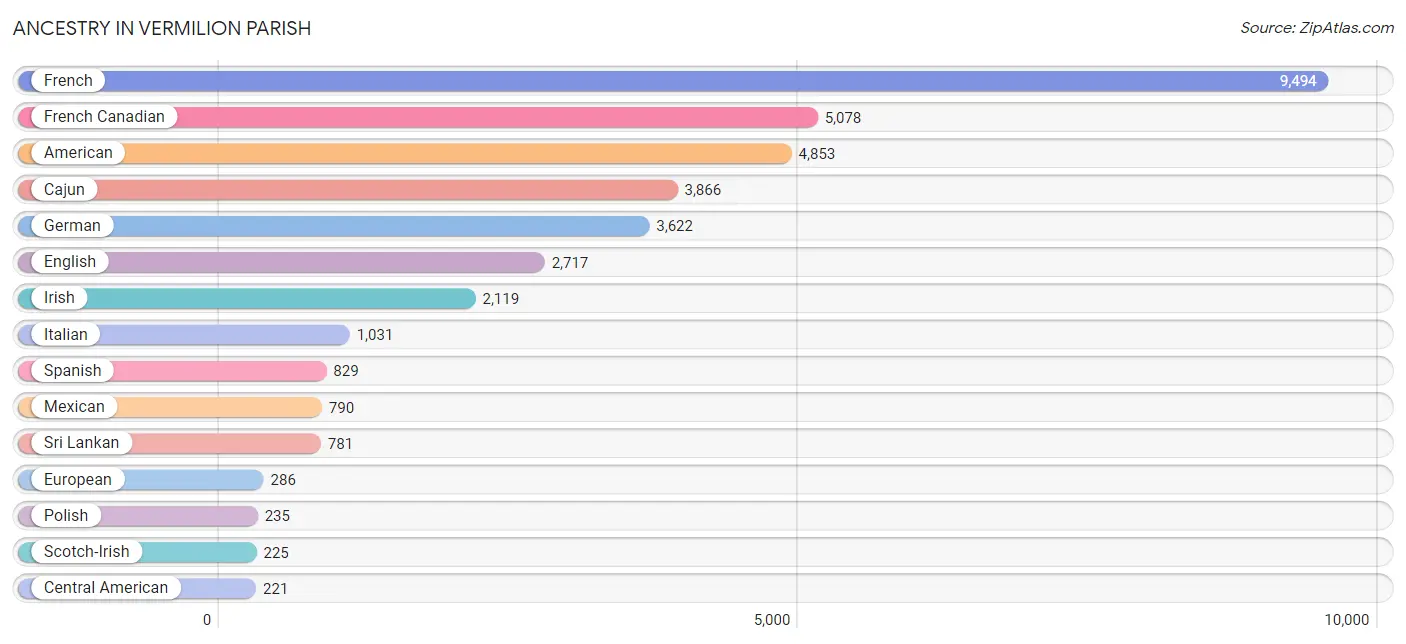
| Ancestry | # Population | % Population |
| African | 63 | 0.1% |
| American | 4,853 | 8.5% |
| Arab | 28 | 0.1% |
| Belgian | 1 | 0.0% |
| Belizean | 1 | 0.0% |
| Bhutanese | 44 | 0.1% |
| Blackfeet | 83 | 0.2% |
| Brazilian | 71 | 0.1% |
| British | 209 | 0.4% |
| Cajun | 3,866 | 6.8% |
| Canadian | 21 | 0.0% |
| Central American | 221 | 0.4% |
| Central American Indian | 17 | 0.0% |
| Cherokee | 59 | 0.1% |
| Chilean | 64 | 0.1% |
| Choctaw | 3 | 0.0% |
| Colombian | 28 | 0.1% |
| Croatian | 2 | 0.0% |
| Czech | 101 | 0.2% |
| Dutch | 73 | 0.1% |
| Eastern European | 11 | 0.0% |
| English | 2,717 | 4.8% |
| European | 286 | 0.5% |
| French | 9,494 | 16.6% |
| French Canadian | 5,078 | 8.9% |
| German | 3,622 | 6.3% |
| Greek | 15 | 0.0% |
| Guamanian / Chamorro | 36 | 0.1% |
| Honduran | 121 | 0.2% |
| Houma | 58 | 0.1% |
| Hungarian | 90 | 0.2% |
| Indian (Asian) | 159 | 0.3% |
| Iranian | 22 | 0.0% |
| Irish | 2,119 | 3.7% |
| Italian | 1,031 | 1.8% |
| Jamaican | 76 | 0.1% |
| Korean | 100 | 0.2% |
| Laotian | 50 | 0.1% |
| Lebanese | 28 | 0.1% |
| Mexican | 790 | 1.4% |
| Mexican American Indian | 1 | 0.0% |
| Nicaraguan | 20 | 0.0% |
| Northern European | 11 | 0.0% |
| Norwegian | 60 | 0.1% |
| Polish | 235 | 0.4% |
| Portuguese | 50 | 0.1% |
| Puerto Rican | 2 | 0.0% |
| Russian | 16 | 0.0% |
| Salvadoran | 80 | 0.1% |
| Samoan | 91 | 0.2% |
| Scandinavian | 40 | 0.1% |
| Scotch-Irish | 225 | 0.4% |
| Scottish | 92 | 0.2% |
| Sioux | 32 | 0.1% |
| South American | 92 | 0.2% |
| Spaniard | 201 | 0.4% |
| Spanish | 829 | 1.5% |
| Sri Lankan | 781 | 1.4% |
| Subsaharan African | 63 | 0.1% |
| Swiss | 6 | 0.0% |
| Thai | 185 | 0.3% |
| Trinidadian and Tobagonian | 10 | 0.0% |
| Welsh | 204 | 0.4% |
| West Indian | 2 | 0.0% | View All 64 Rows |
Immigrants in Vermilion Parish
The most numerous immigrant groups reported in Vermilion Parish came from Asia (871 | 1.5%), South Eastern Asia (688 | 1.2%), Vietnam (616 | 1.1%), Latin America (319 | 0.6%), and Central America (219 | 0.4%), together accounting for 4.7% of all Vermilion Parish residents.
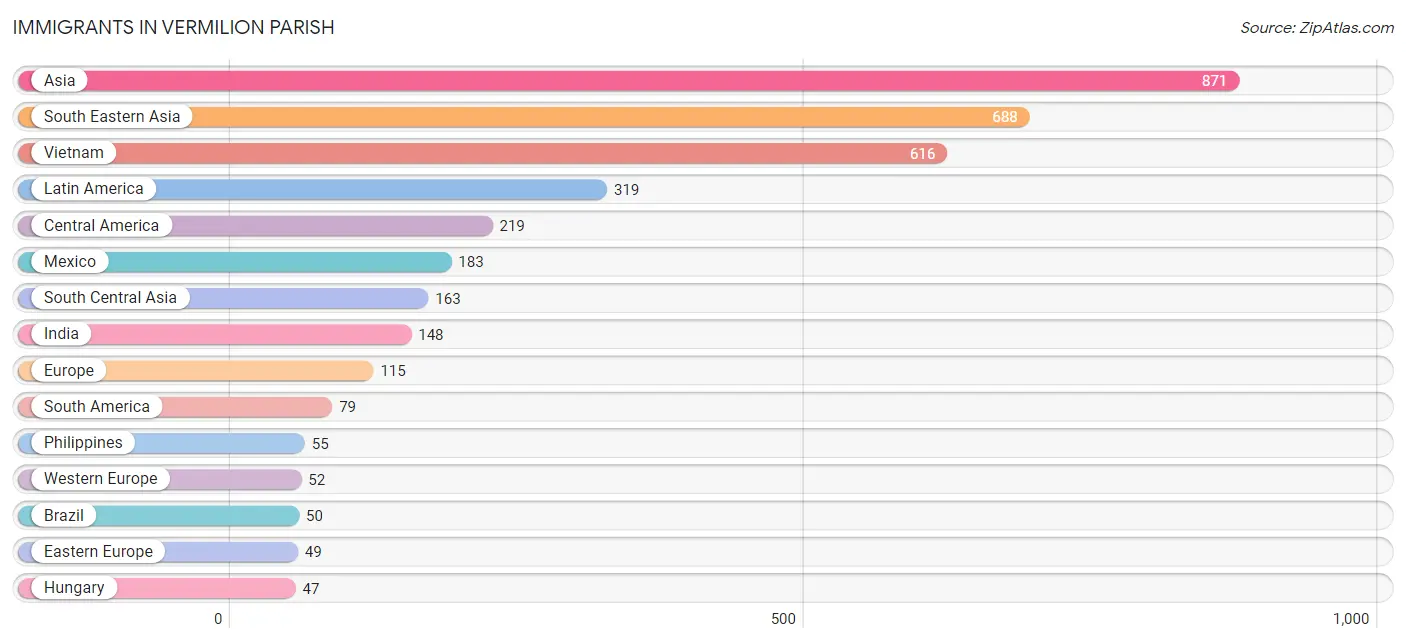
| Immigration Origin | # Population | % Population |
| Asia | 871 | 1.5% |
| Belize | 3 | 0.0% |
| Brazil | 50 | 0.1% |
| Canada | 33 | 0.1% |
| Caribbean | 21 | 0.0% |
| Central America | 219 | 0.4% |
| Chile | 1 | 0.0% |
| China | 14 | 0.0% |
| Colombia | 28 | 0.1% |
| Croatia | 2 | 0.0% |
| Eastern Asia | 20 | 0.0% |
| Eastern Europe | 49 | 0.1% |
| England | 12 | 0.0% |
| Europe | 115 | 0.2% |
| Germany | 43 | 0.1% |
| Honduras | 13 | 0.0% |
| Hungary | 47 | 0.1% |
| India | 148 | 0.3% |
| Indonesia | 17 | 0.0% |
| Iran | 15 | 0.0% |
| Ireland | 2 | 0.0% |
| Japan | 6 | 0.0% |
| Latin America | 319 | 0.6% |
| Mexico | 183 | 0.3% |
| Netherlands | 9 | 0.0% |
| Nicaragua | 20 | 0.0% |
| Northern Europe | 14 | 0.0% |
| Philippines | 55 | 0.1% |
| South America | 79 | 0.1% |
| South Central Asia | 163 | 0.3% |
| South Eastern Asia | 688 | 1.2% |
| Vietnam | 616 | 1.1% |
| Western Europe | 52 | 0.1% | View All 33 Rows |
Sex and Age in Vermilion Parish
Sex and Age in Vermilion Parish
The most populous age groups in Vermilion Parish are 5 to 9 Years (2,184 | 7.8%) for men and 5 to 9 Years (2,199 | 7.5%) for women.
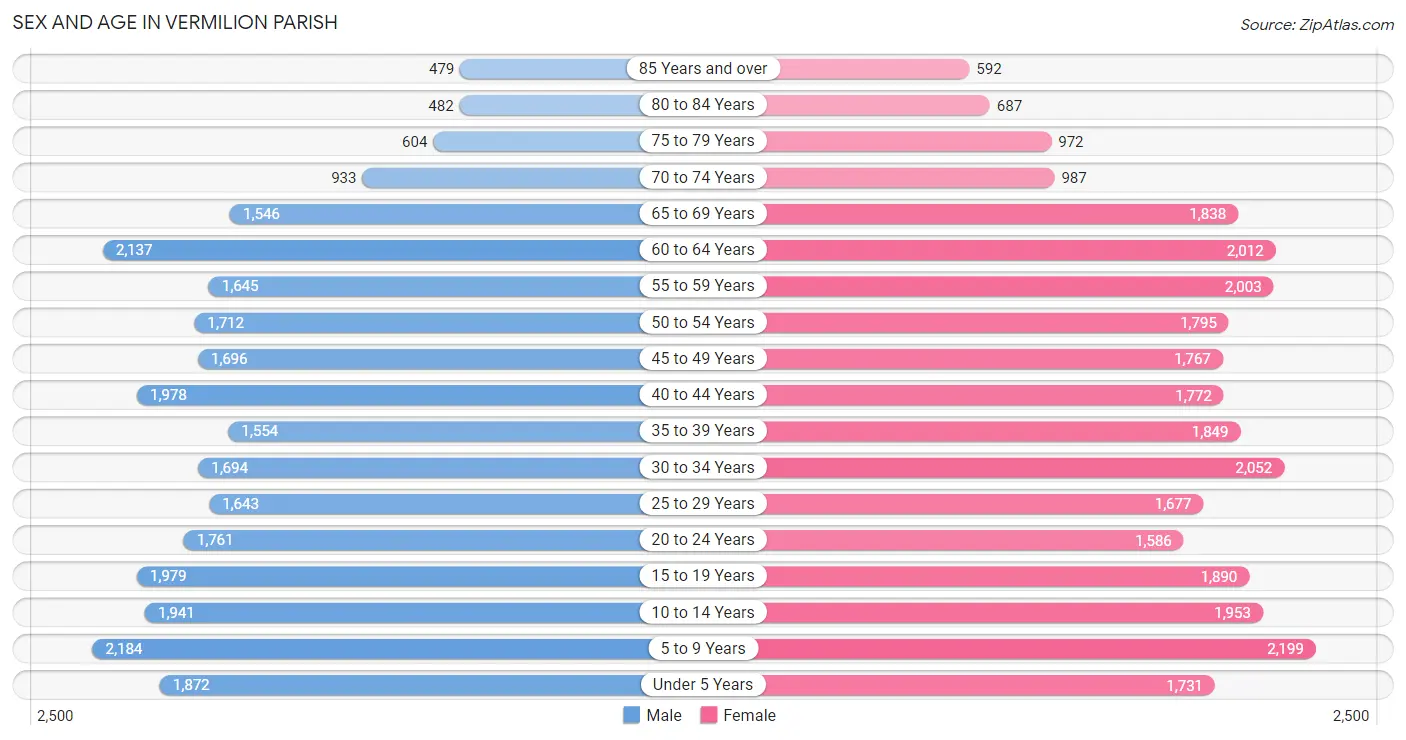
| Age Bracket | Male | Female |
| Under 5 Years | 1,872 (6.7%) | 1,731 (5.9%) |
| 5 to 9 Years | 2,184 (7.8%) | 2,199 (7.5%) |
| 10 to 14 Years | 1,941 (7.0%) | 1,953 (6.7%) |
| 15 to 19 Years | 1,979 (7.1%) | 1,890 (6.4%) |
| 20 to 24 Years | 1,761 (6.3%) | 1,586 (5.4%) |
| 25 to 29 Years | 1,643 (5.9%) | 1,677 (5.7%) |
| 30 to 34 Years | 1,694 (6.1%) | 2,052 (7.0%) |
| 35 to 39 Years | 1,554 (5.6%) | 1,849 (6.3%) |
| 40 to 44 Years | 1,978 (7.1%) | 1,772 (6.0%) |
| 45 to 49 Years | 1,696 (6.1%) | 1,767 (6.0%) |
| 50 to 54 Years | 1,712 (6.1%) | 1,795 (6.1%) |
| 55 to 59 Years | 1,645 (5.9%) | 2,003 (6.8%) |
| 60 to 64 Years | 2,137 (7.7%) | 2,012 (6.9%) |
| 65 to 69 Years | 1,546 (5.6%) | 1,838 (6.3%) |
| 70 to 74 Years | 933 (3.4%) | 987 (3.4%) |
| 75 to 79 Years | 604 (2.2%) | 972 (3.3%) |
| 80 to 84 Years | 482 (1.7%) | 687 (2.3%) |
| 85 Years and over | 479 (1.7%) | 592 (2.0%) |
| Total | 27,840 (100.0%) | 29,362 (100.0%) |
Families and Households in Vermilion Parish
Median Family Size in Vermilion Parish
The median family size in Vermilion Parish is 3.08 persons per family, with married-couple families (11,060 | 71.0%) accounting for the largest median family size of 3.23 persons per family. On the other hand, single male/father families (1,342 | 8.6%) represent the smallest median family size with 2.28 persons per family.
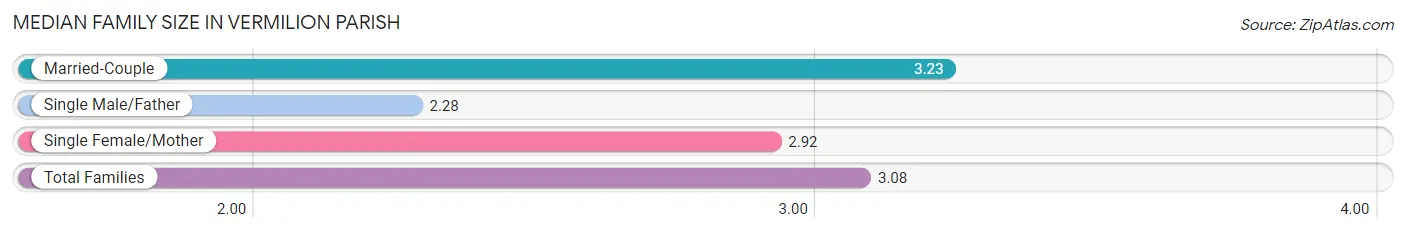
| Family Type | # Families | Family Size |
| Married-Couple | 11,060 (71.0%) | 3.23 |
| Single Male/Father | 1,342 (8.6%) | 2.28 |
| Single Female/Mother | 3,177 (20.4%) | 2.92 |
| Total Families | 15,579 (100.0%) | 3.08 |
Median Household Size in Vermilion Parish
The median household size in Vermilion Parish is 2.61 persons per household, with married-couple households (11,060 | 51.0%) accounting for the largest median household size of 3.25 persons per household. non-family households (6,125 | 28.2%) represent the smallest median household size with 1.23 persons per household.
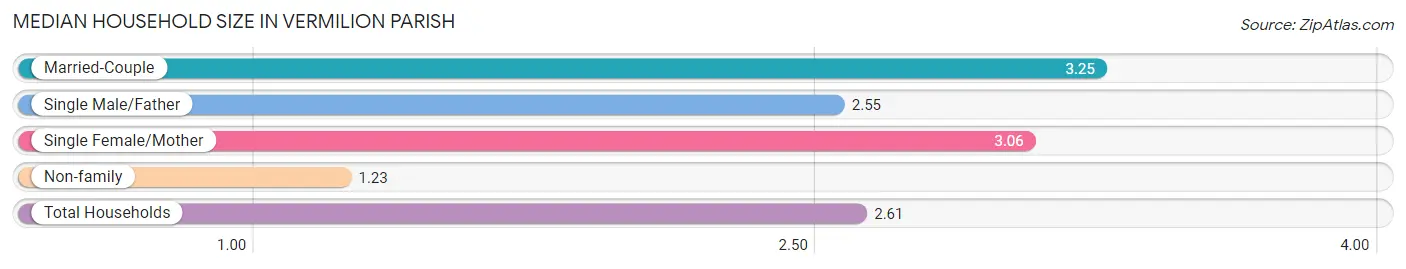
| Household Type | # Households | Household Size |
| Married-Couple | 11,060 (51.0%) | 3.25 |
| Single Male/Father | 1,342 (6.2%) | 2.55 |
| Single Female/Mother | 3,177 (14.6%) | 3.06 |
| Non-family | 6,125 (28.2%) | 1.23 |
| Total Households | 21,704 (100.0%) | 2.61 |
Household Size by Marriage Status in Vermilion Parish
Out of a total of 21,704 households in Vermilion Parish, 15,579 (71.8%) are family households, while 6,125 (28.2%) are nonfamily households. The most numerous type of family households are 2-person households, comprising 6,237, and the most common type of nonfamily households are 1-person households, comprising 4,831.
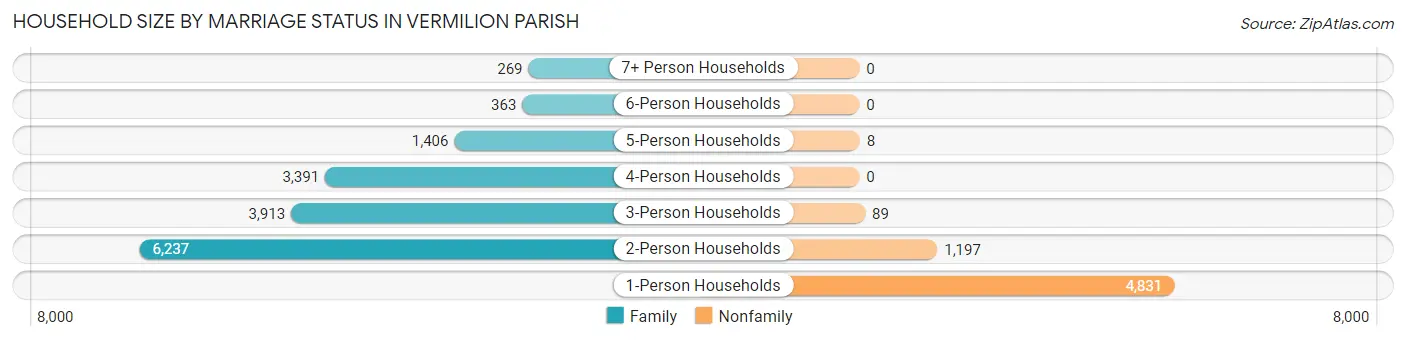
| Household Size | Family Households | Nonfamily Households |
| 1-Person Households | - | 4,831 (22.3%) |
| 2-Person Households | 6,237 (28.7%) | 1,197 (5.5%) |
| 3-Person Households | 3,913 (18.0%) | 89 (0.4%) |
| 4-Person Households | 3,391 (15.6%) | 0 (0.0%) |
| 5-Person Households | 1,406 (6.5%) | 8 (0.0%) |
| 6-Person Households | 363 (1.7%) | 0 (0.0%) |
| 7+ Person Households | 269 (1.2%) | 0 (0.0%) |
| Total | 15,579 (71.8%) | 6,125 (28.2%) |
Female Fertility in Vermilion Parish
Fertility by Age in Vermilion Parish
Average fertility rate in Vermilion Parish is 72.0 births per 1,000 women. Women in the age bracket of 20 to 34 years have the highest fertility rate with 154.0 births per 1,000 women. Women in the age bracket of 20 to 34 years acount for 89.3% of all women with births.
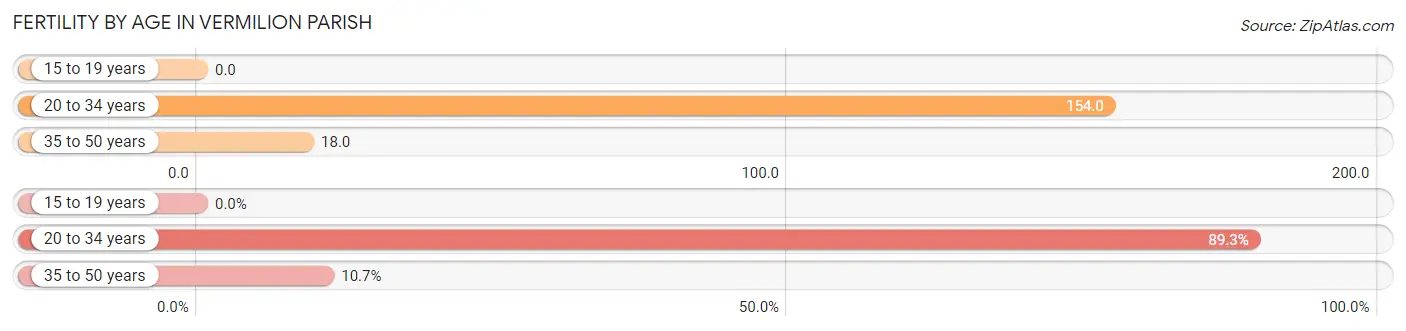
| Age Bracket | Women with Births | Births / 1,000 Women |
| 15 to 19 years | 0 (0.0%) | 0.0 |
| 20 to 34 years | 817 (89.3%) | 154.0 |
| 35 to 50 years | 98 (10.7%) | 18.0 |
| Total | 915 (100.0%) | 72.0 |
Fertility by Age by Marriage Status in Vermilion Parish
72.1% of women with births (915) in Vermilion Parish are married. The highest percentage of unmarried women with births falls into 20 to 34 years age bracket with 30.0% of them unmarried at the time of birth, while the lowest percentage of unmarried women with births belong to 35 to 50 years age bracket with 10.2% of them unmarried.
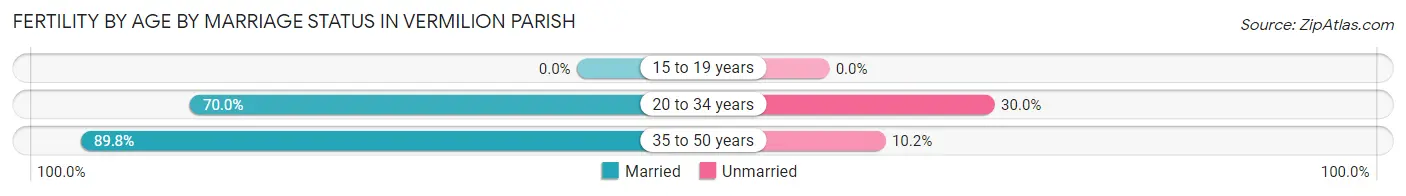
| Age Bracket | Married | Unmarried |
| 15 to 19 years | 0 (0.0%) | 0 (0.0%) |
| 20 to 34 years | 572 (70.0%) | 245 (30.0%) |
| 35 to 50 years | 88 (89.8%) | 10 (10.2%) |
| Total | 660 (72.1%) | 255 (27.9%) |
Fertility by Education in Vermilion Parish
Average fertility rate in Vermilion Parish is 72.0 births per 1,000 women. Women with the education attainment of college or associate's degree have the highest fertility rate of 84.0 births per 1,000 women, while women with the education attainment of less than high school have the lowest fertility at 29.0 births per 1,000 women. Women with the education attainment of high school diploma represent 34.7% of all women with births.
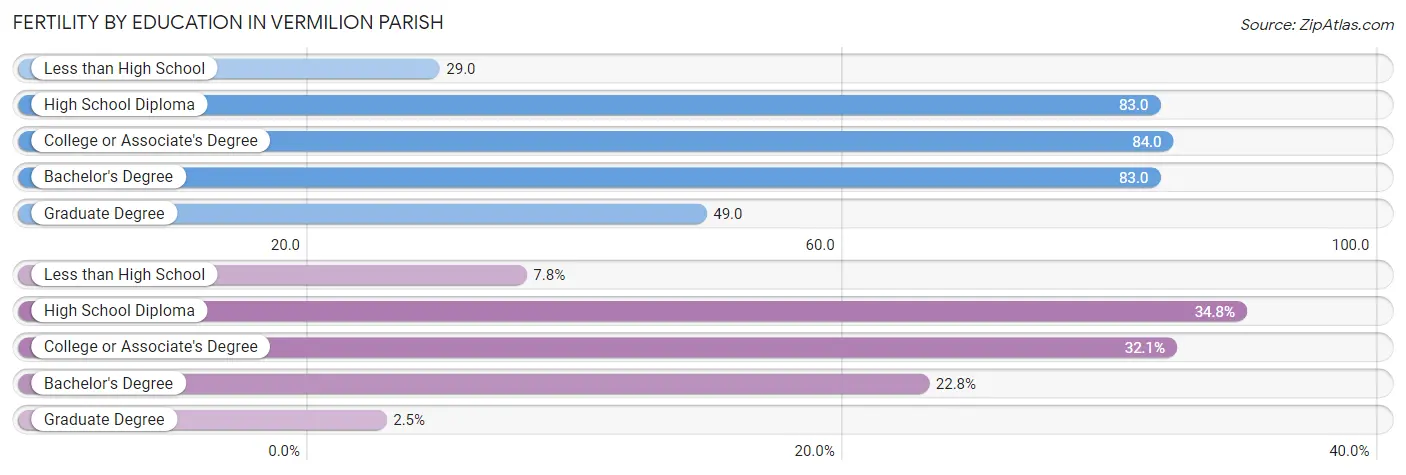
| Educational Attainment | Women with Births | Births / 1,000 Women |
| Less than High School | 71 (7.8%) | 29.0 |
| High School Diploma | 318 (34.7%) | 83.0 |
| College or Associate's Degree | 294 (32.1%) | 84.0 |
| Bachelor's Degree | 209 (22.8%) | 83.0 |
| Graduate Degree | 23 (2.5%) | 49.0 |
| Total | 915 (100.0%) | 72.0 |
Fertility by Education by Marriage Status in Vermilion Parish
27.9% of women with births in Vermilion Parish are unmarried. Women with the educational attainment of bachelor's degree are most likely to be married with 100.0% of them married at childbirth, while women with the educational attainment of high school diploma are least likely to be married with 56.3% of them unmarried at childbirth.
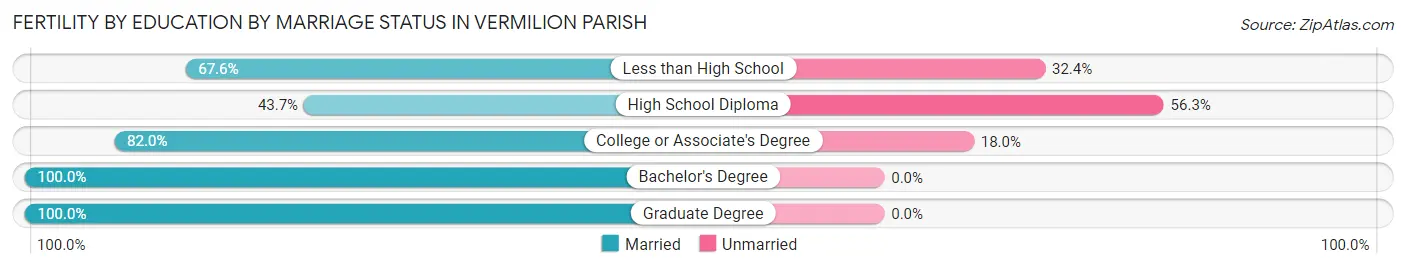
| Educational Attainment | Married | Unmarried |
| Less than High School | 48 (67.6%) | 23 (32.4%) |
| High School Diploma | 139 (43.7%) | 179 (56.3%) |
| College or Associate's Degree | 241 (82.0%) | 53 (18.0%) |
| Bachelor's Degree | 209 (100.0%) | 0 (0.0%) |
| Graduate Degree | 23 (100.0%) | 0 (0.0%) |
| Total | 660 (72.1%) | 255 (27.9%) |
Income in Vermilion Parish
Income Overview in Vermilion Parish
Per Capita Income in Vermilion Parish is $29,293, while median incomes of families and households are $70,308 and $56,194 respectively.
| Characteristic | Number | Measure |
| Per Capita Income | 57,202 | $29,293 |
| Median Family Income | 15,579 | $70,308 |
| Mean Family Income | 15,579 | $87,209 |
| Median Household Income | 21,704 | $56,194 |
| Mean Household Income | 21,704 | $74,911 |
| Income Deficit | 15,579 | $10,240 |
| Wage / Income Gap (%) | 57,202 | 49.70% |
| Wage / Income Gap ($) | 57,202 | 50.30¢ per $1 |
| Gini / Inequality Index | 57,202 | 0.47 |
Earnings by Sex in Vermilion Parish
Average Earnings in Vermilion Parish are $37,477, $52,473 for men and $26,392 for women, a difference of 49.7%.
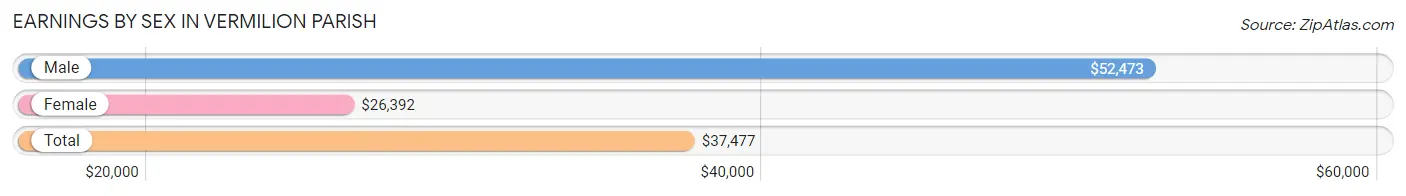
| Sex | Number | Average Earnings |
| Male | 14,354 (56.1%) | $52,473 |
| Female | 11,213 (43.9%) | $26,392 |
| Total | 25,567 (100.0%) | $37,477 |
Earnings by Sex by Income Bracket in Vermilion Parish
The most common earnings brackets in Vermilion Parish are $100,000+ for men (2,388 | 16.6%) and $25,000 to $29,999 for women (947 | 8.5%).
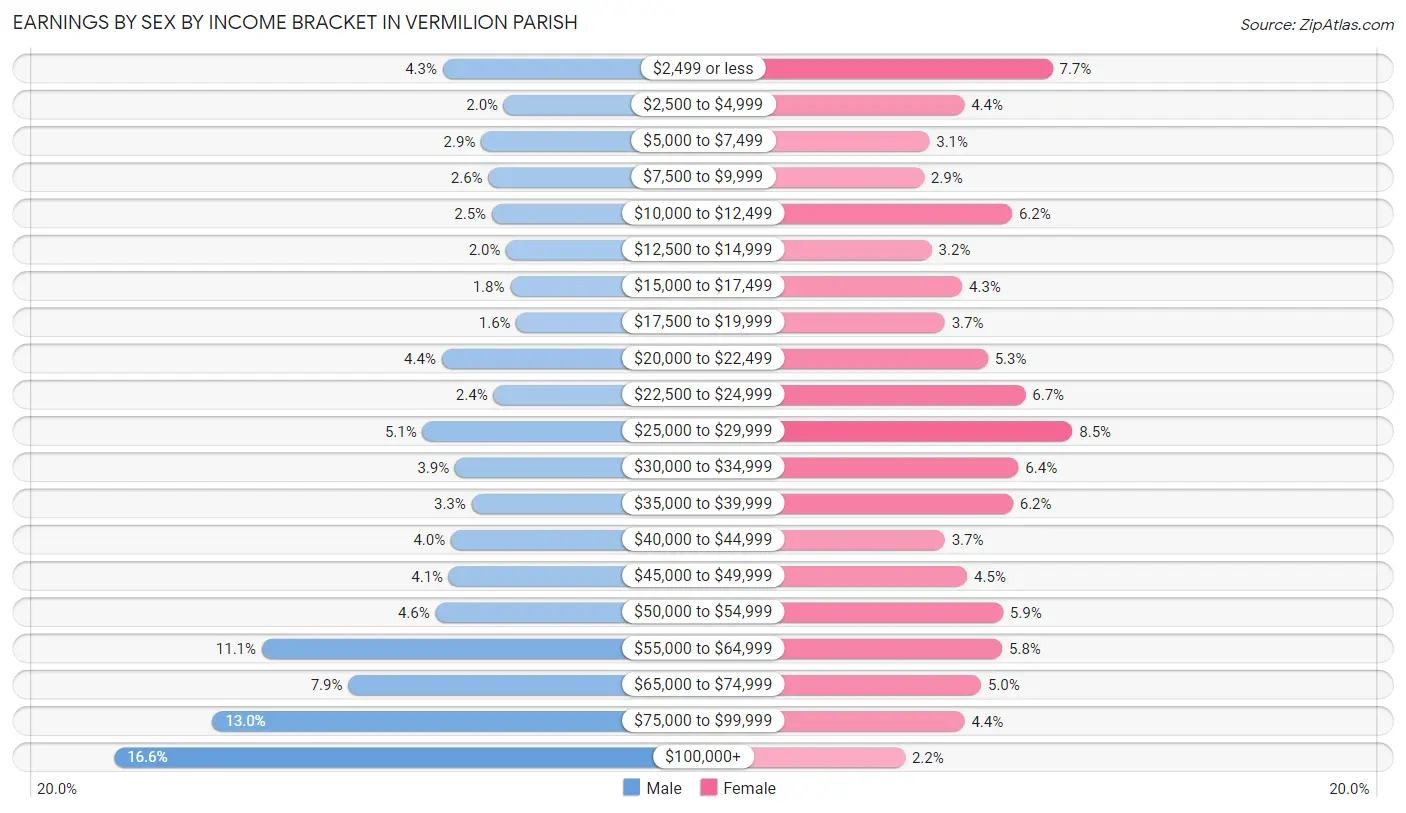
| Income | Male | Female |
| $2,499 or less | 621 (4.3%) | 865 (7.7%) |
| $2,500 to $4,999 | 293 (2.0%) | 493 (4.4%) |
| $5,000 to $7,499 | 415 (2.9%) | 347 (3.1%) |
| $7,500 to $9,999 | 376 (2.6%) | 324 (2.9%) |
| $10,000 to $12,499 | 357 (2.5%) | 694 (6.2%) |
| $12,500 to $14,999 | 280 (1.9%) | 357 (3.2%) |
| $15,000 to $17,499 | 259 (1.8%) | 484 (4.3%) |
| $17,500 to $19,999 | 226 (1.6%) | 411 (3.7%) |
| $20,000 to $22,499 | 627 (4.4%) | 592 (5.3%) |
| $22,500 to $24,999 | 349 (2.4%) | 750 (6.7%) |
| $25,000 to $29,999 | 731 (5.1%) | 947 (8.5%) |
| $30,000 to $34,999 | 555 (3.9%) | 721 (6.4%) |
| $35,000 to $39,999 | 466 (3.3%) | 698 (6.2%) |
| $40,000 to $44,999 | 577 (4.0%) | 412 (3.7%) |
| $45,000 to $49,999 | 588 (4.1%) | 506 (4.5%) |
| $50,000 to $54,999 | 661 (4.6%) | 656 (5.9%) |
| $55,000 to $64,999 | 1,595 (11.1%) | 653 (5.8%) |
| $65,000 to $74,999 | 1,130 (7.9%) | 564 (5.0%) |
| $75,000 to $99,999 | 1,860 (13.0%) | 495 (4.4%) |
| $100,000+ | 2,388 (16.6%) | 244 (2.2%) |
| Total | 14,354 (100.0%) | 11,213 (100.0%) |
Earnings by Sex by Educational Attainment in Vermilion Parish
Average earnings in Vermilion Parish are $59,095 for men and $29,289 for women, a difference of 50.4%. Men with an educational attainment of graduate degree enjoy the highest average annual earnings of $120,795, while those with less than high school education earn the least with $50,019. Women with an educational attainment of graduate degree earn the most with the average annual earnings of $70,680, while those with less than high school education have the smallest earnings of $20,721.
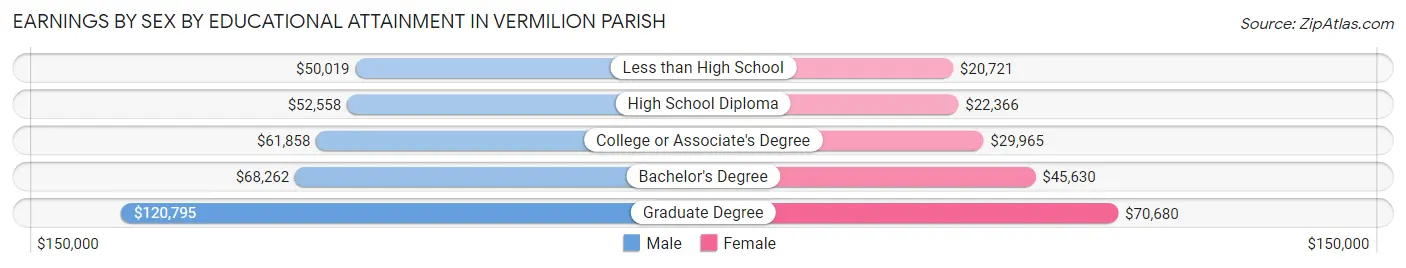
| Educational Attainment | Male Income | Female Income |
| Less than High School | $50,019 | $20,721 |
| High School Diploma | $52,558 | $22,366 |
| College or Associate's Degree | $61,858 | $29,965 |
| Bachelor's Degree | $68,262 | $45,630 |
| Graduate Degree | $120,795 | $70,680 |
| Total | $59,095 | $29,289 |
Family Income in Vermilion Parish
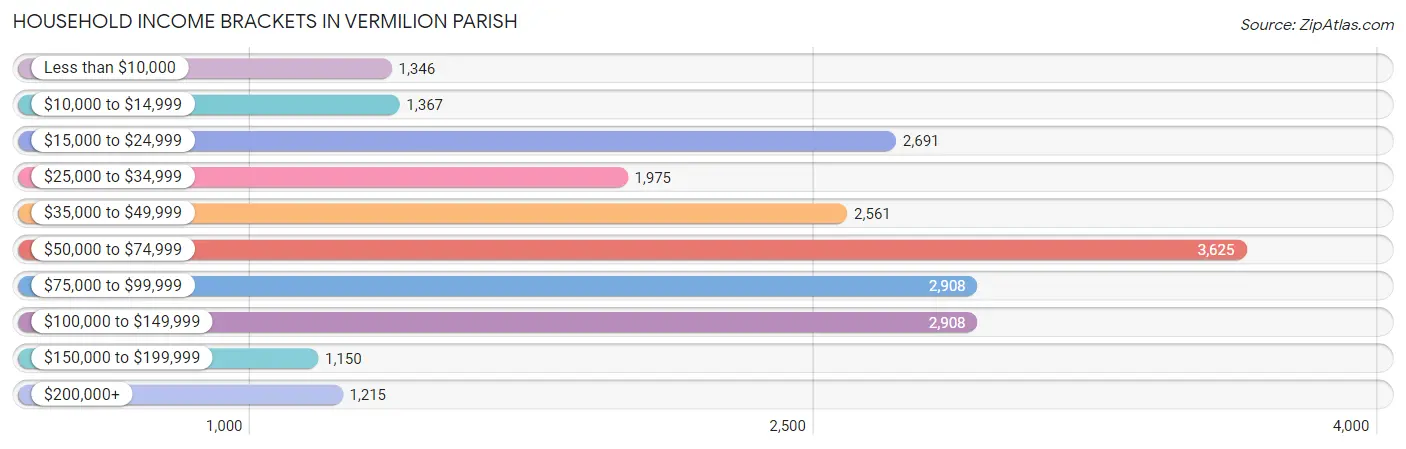
Family Income Brackets in Vermilion Parish
According to the Vermilion Parish family income data, there are 2,680 families falling into the $50,000 to $74,999 income range, which is the most common income bracket and makes up 17.2% of all families. Conversely, the $10,000 to $14,999 income bracket is the least frequent group with only 514 families (3.3%) belonging to this category.
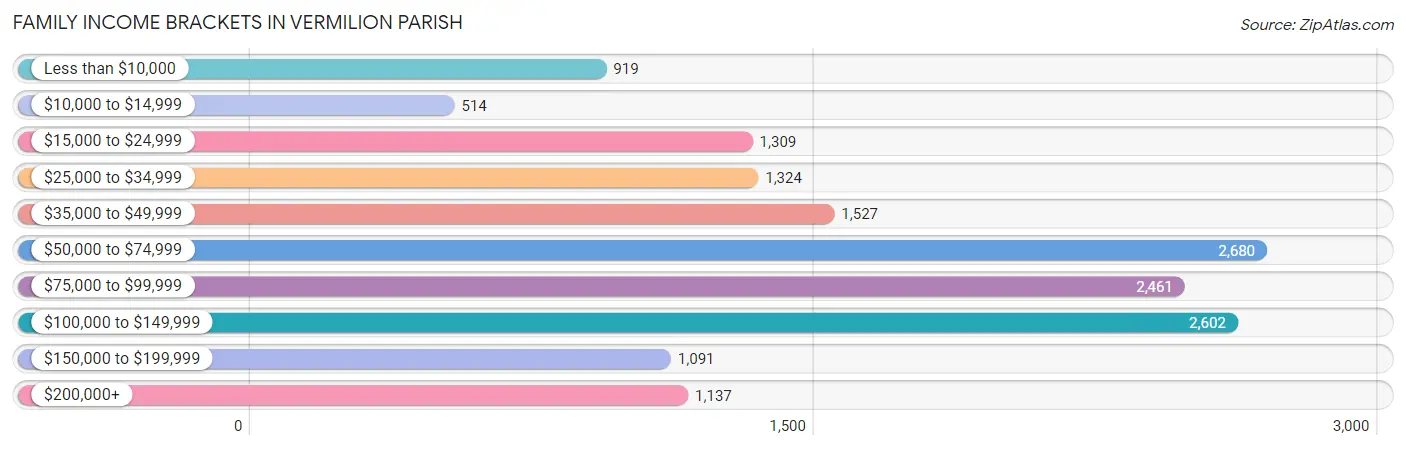
| Income Bracket | # Families | % Families |
| Less than $10,000 | 919 | 5.9% |
| $10,000 to $14,999 | 514 | 3.3% |
| $15,000 to $24,999 | 1,309 | 8.4% |
| $25,000 to $34,999 | 1,324 | 8.5% |
| $35,000 to $49,999 | 1,527 | 9.8% |
| $50,000 to $74,999 | 2,680 | 17.2% |
| $75,000 to $99,999 | 2,461 | 15.8% |
| $100,000 to $149,999 | 2,602 | 16.7% |
| $150,000 to $199,999 | 1,091 | 7.0% |
| $200,000+ | 1,137 | 7.3% |
Family Income by Famaliy Size in Vermilion Parish
7+ person families (244 | 1.6%) account for the highest median family income in Vermilion Parish with $145,417 per family, while 2-person families (6,704 | 43.0%) have the highest median income of $29,261 per family member.
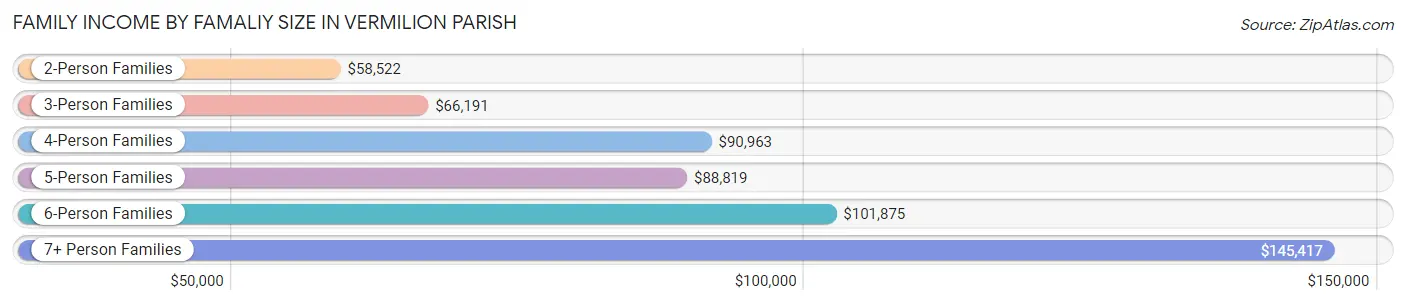
| Income Bracket | # Families | Median Income |
| 2-Person Families | 6,704 (43.0%) | $58,522 |
| 3-Person Families | 3,654 (23.4%) | $66,191 |
| 4-Person Families | 3,354 (21.5%) | $90,963 |
| 5-Person Families | 1,333 (8.6%) | $88,819 |
| 6-Person Families | 290 (1.9%) | $101,875 |
| 7+ Person Families | 244 (1.6%) | $145,417 |
| Total | 15,579 (100.0%) | $70,308 |
Family Income by Number of Earners in Vermilion Parish
The median family income in Vermilion Parish is $70,308, with families comprising 3+ earners (1,097) having the highest median family income of $119,256, while families with no earners (2,710) have the lowest median family income of $29,431, accounting for 7.0% and 17.4% of families, respectively.
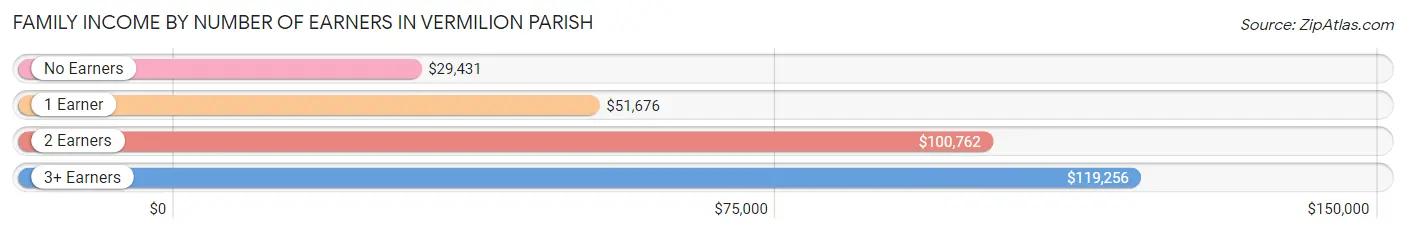
| Number of Earners | # Families | Median Income |
| No Earners | 2,710 (17.4%) | $29,431 |
| 1 Earner | 6,293 (40.4%) | $51,676 |
| 2 Earners | 5,479 (35.2%) | $100,762 |
| 3+ Earners | 1,097 (7.0%) | $119,256 |
| Total | 15,579 (100.0%) | $70,308 |
Household Income in Vermilion Parish
Household Income Brackets in Vermilion Parish
With 3,625 households falling in the category, the $50,000 to $74,999 income range is the most frequent in Vermilion Parish, accounting for 16.7% of all households. In contrast, only 1,150 households (5.3%) fall into the $150,000 to $199,999 income bracket, making it the least populous group.
| Income Bracket | # Households | % Households |
| Less than $10,000 | 1,346 | 6.2% |
| $10,000 to $14,999 | 1,367 | 6.3% |
| $15,000 to $24,999 | 2,691 | 12.4% |
| $25,000 to $34,999 | 1,975 | 9.1% |
| $35,000 to $49,999 | 2,561 | 11.8% |
| $50,000 to $74,999 | 3,625 | 16.7% |
| $75,000 to $99,999 | 2,908 | 13.4% |
| $100,000 to $149,999 | 2,908 | 13.4% |
| $150,000 to $199,999 | 1,150 | 5.3% |
| $200,000+ | 1,215 | 5.6% |
Household Income by Householder Age in Vermilion Parish
The median household income in Vermilion Parish is $56,194, with the highest median household income of $67,468 found in the 45 to 64 years age bracket for the primary householder. A total of 7,635 households (35.2%) fall into this category. Meanwhile, the 15 to 24 years age bracket for the primary householder has the lowest median household income of $23,386, with 1,144 households (5.3%) in this group.
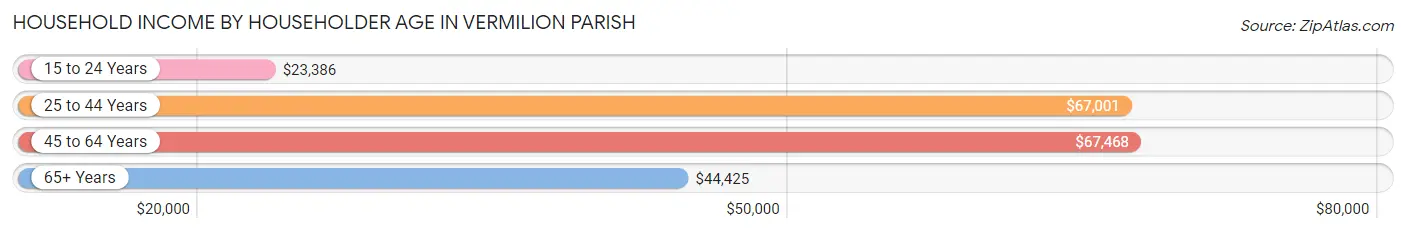
| Income Bracket | # Households | Median Income |
| 15 to 24 Years | 1,144 (5.3%) | $23,386 |
| 25 to 44 Years | 7,235 (33.3%) | $67,001 |
| 45 to 64 Years | 7,635 (35.2%) | $67,468 |
| 65+ Years | 5,690 (26.2%) | $44,425 |
| Total | 21,704 (100.0%) | $56,194 |
Poverty in Vermilion Parish
Income Below Poverty by Sex and Age in Vermilion Parish
With 16.1% poverty level for males and 22.4% for females among the residents of Vermilion Parish, 5 year old males and 6 to 11 year old females are the most vulnerable to poverty, with 111 males (30.9%) and 893 females (35.9%) in their respective age groups living below the poverty level.
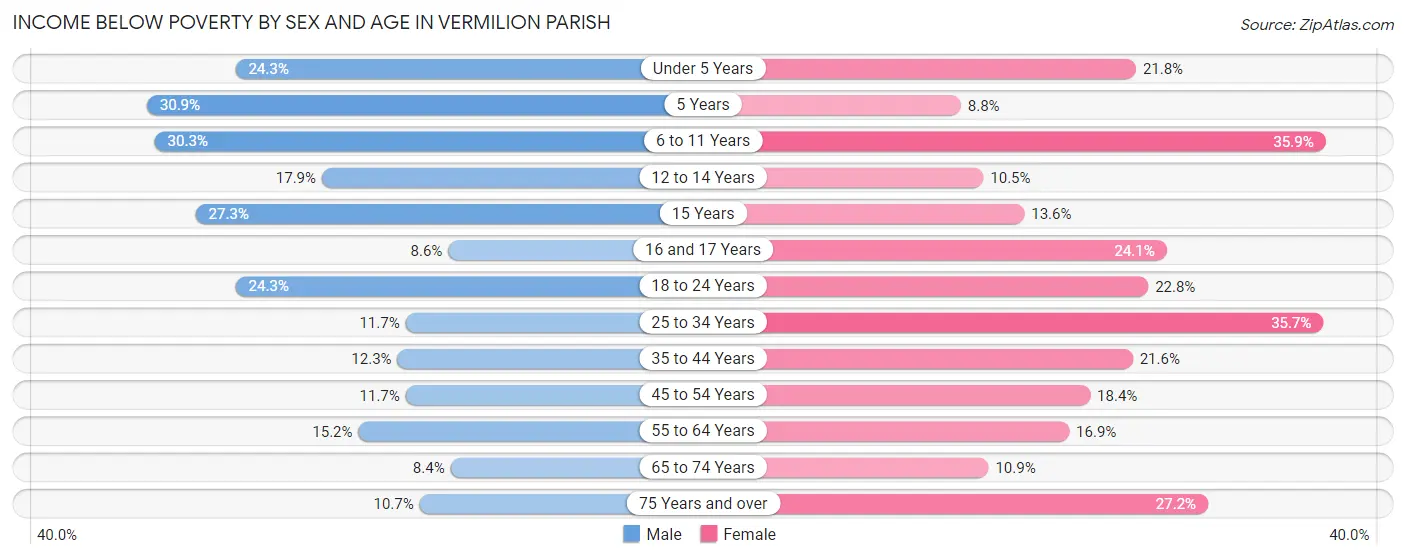
| Age Bracket | Male | Female |
| Under 5 Years | 444 (24.3%) | 378 (21.8%) |
| 5 Years | 111 (30.9%) | 32 (8.8%) |
| 6 to 11 Years | 669 (30.3%) | 893 (35.9%) |
| 12 to 14 Years | 261 (17.9%) | 137 (10.5%) |
| 15 Years | 101 (27.3%) | 63 (13.6%) |
| 16 and 17 Years | 79 (8.6%) | 177 (24.1%) |
| 18 to 24 Years | 595 (24.3%) | 518 (22.8%) |
| 25 to 34 Years | 390 (11.7%) | 1,330 (35.7%) |
| 35 to 44 Years | 433 (12.3%) | 782 (21.6%) |
| 45 to 54 Years | 399 (11.7%) | 653 (18.4%) |
| 55 to 64 Years | 571 (15.2%) | 673 (16.9%) |
| 65 to 74 Years | 202 (8.4%) | 302 (10.9%) |
| 75 Years and over | 158 (10.7%) | 558 (27.2%) |
| Total | 4,413 (16.1%) | 6,496 (22.4%) |
Income Above Poverty by Sex and Age in Vermilion Parish
According to the poverty statistics in Vermilion Parish, males aged 65 to 74 years and females aged 5 years are the age groups that are most secure financially, with 91.6% of males and 91.2% of females in these age groups living above the poverty line.
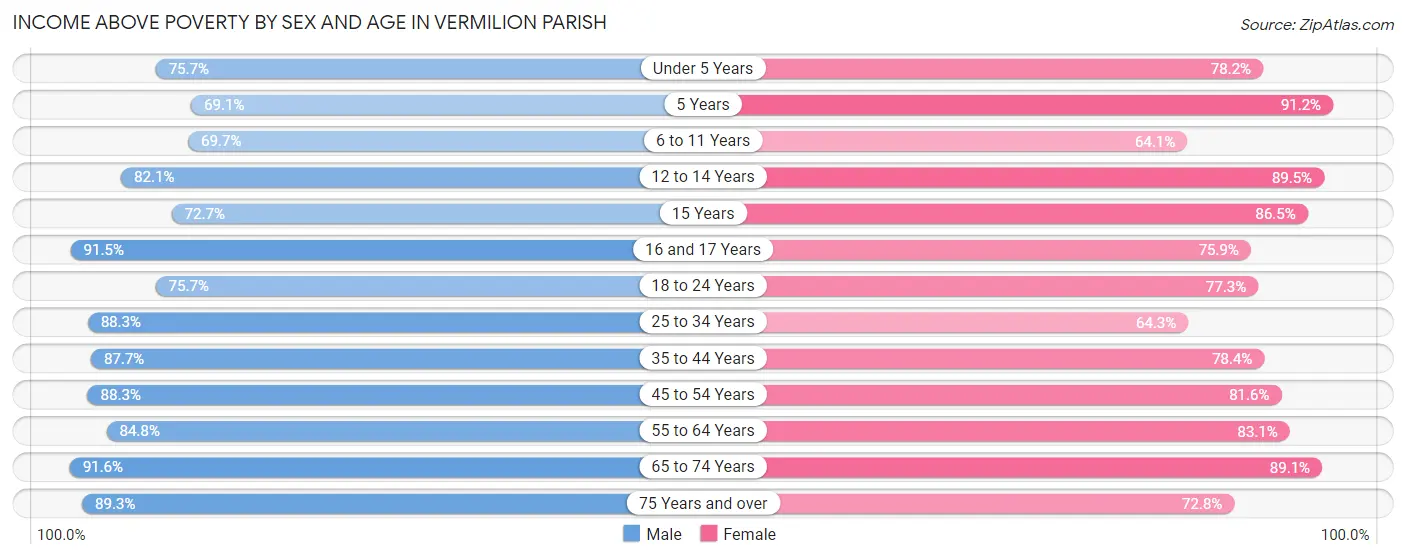
| Age Bracket | Male | Female |
| Under 5 Years | 1,380 (75.7%) | 1,353 (78.2%) |
| 5 Years | 248 (69.1%) | 330 (91.2%) |
| 6 to 11 Years | 1,536 (69.7%) | 1,594 (64.1%) |
| 12 to 14 Years | 1,195 (82.1%) | 1,166 (89.5%) |
| 15 Years | 269 (72.7%) | 402 (86.5%) |
| 16 and 17 Years | 845 (91.4%) | 557 (75.9%) |
| 18 to 24 Years | 1,851 (75.7%) | 1,759 (77.2%) |
| 25 to 34 Years | 2,938 (88.3%) | 2,391 (64.3%) |
| 35 to 44 Years | 3,083 (87.7%) | 2,839 (78.4%) |
| 45 to 54 Years | 3,009 (88.3%) | 2,888 (81.6%) |
| 55 to 64 Years | 3,180 (84.8%) | 3,314 (83.1%) |
| 65 to 74 Years | 2,208 (91.6%) | 2,470 (89.1%) |
| 75 Years and over | 1,322 (89.3%) | 1,495 (72.8%) |
| Total | 23,064 (83.9%) | 22,558 (77.6%) |
Income Below Poverty Among Married-Couple Families in Vermilion Parish
The poverty statistics for married-couple families in Vermilion Parish show that 8.6% or 946 of the total 11,060 families live below the poverty line. Families with 5 or more children have the highest poverty rate of 36.3%, comprising of 37 families. On the other hand, families with no children have the lowest poverty rate of 5.9%, which includes 333 families.
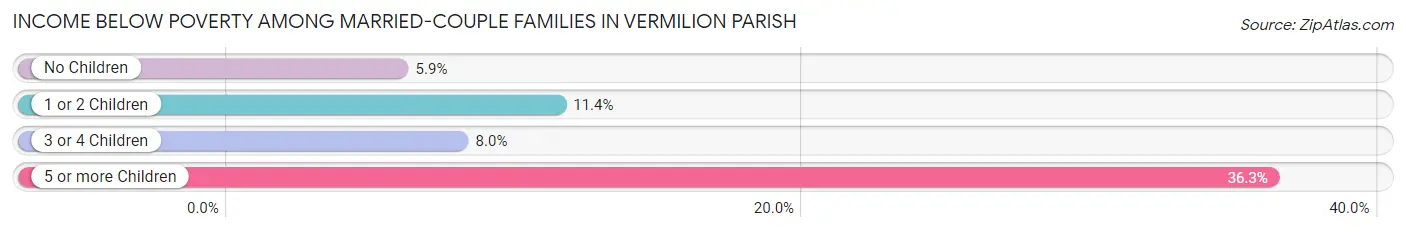
| Children | Above Poverty | Below Poverty |
| No Children | 5,272 (94.1%) | 333 (5.9%) |
| 1 or 2 Children | 3,803 (88.6%) | 491 (11.4%) |
| 3 or 4 Children | 974 (92.0%) | 85 (8.0%) |
| 5 or more Children | 65 (63.7%) | 37 (36.3%) |
| Total | 10,114 (91.4%) | 946 (8.6%) |
Income Below Poverty Among Single-Parent Households in Vermilion Parish
According to the poverty data in Vermilion Parish, 26.0% or 349 single-father households and 42.1% or 1,339 single-mother households are living below the poverty line. Among single-father households, those with no children have the highest poverty rate, with 263 households (37.7%) experiencing poverty. Likewise, among single-mother households, those with 3 or 4 children have the highest poverty rate, with 215 households (77.1%) falling below the poverty line.
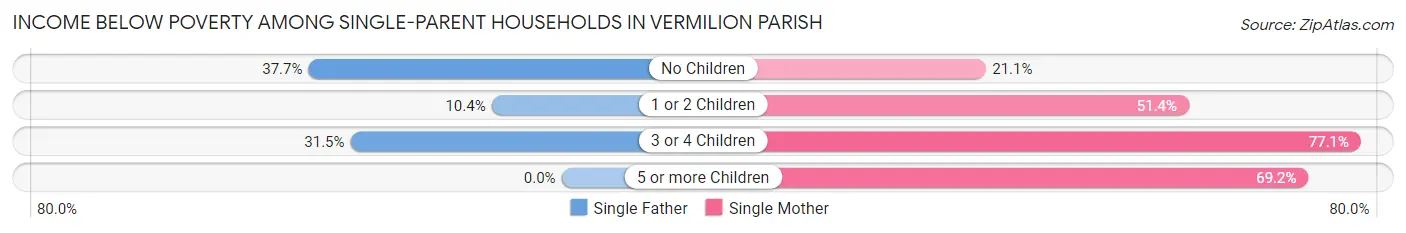
| Children | Single Father | Single Mother |
| No Children | 263 (37.7%) | 258 (21.1%) |
| 1 or 2 Children | 58 (10.4%) | 848 (51.4%) |
| 3 or 4 Children | 28 (31.5%) | 215 (77.1%) |
| 5 or more Children | 0 (0.0%) | 18 (69.2%) |
| Total | 349 (26.0%) | 1,339 (42.1%) |
Income Below Poverty Among Married-Couple vs Single-Parent Households in Vermilion Parish
The poverty data for Vermilion Parish shows that 946 of the married-couple family households (8.6%) and 1,688 of the single-parent households (37.3%) are living below the poverty level. Within the married-couple family households, those with 5 or more children have the highest poverty rate, with 37 households (36.3%) falling below the poverty line. Among the single-parent households, those with 5 or more children have the highest poverty rate, with 18 household (69.2%) living below poverty.
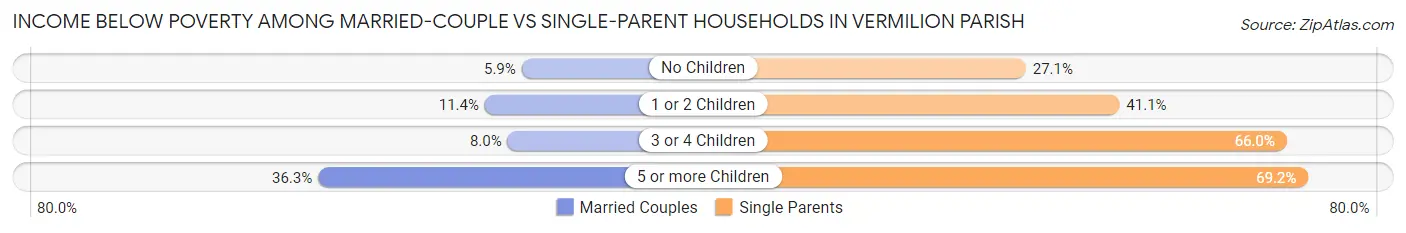
| Children | Married-Couple Families | Single-Parent Households |
| No Children | 333 (5.9%) | 521 (27.1%) |
| 1 or 2 Children | 491 (11.4%) | 906 (41.1%) |
| 3 or 4 Children | 85 (8.0%) | 243 (66.0%) |
| 5 or more Children | 37 (36.3%) | 18 (69.2%) |
| Total | 946 (8.6%) | 1,688 (37.3%) |
Employment Characteristics in Vermilion Parish
Employment by Class of Employer in Vermilion Parish
Among the 22,422 employed individuals in Vermilion Parish, private company employees (15,244 | 68.0%), local government employees (2,135 | 9.5%), and self-employed (not incorporated) (1,987 | 8.9%) make up the most common classes of employment.
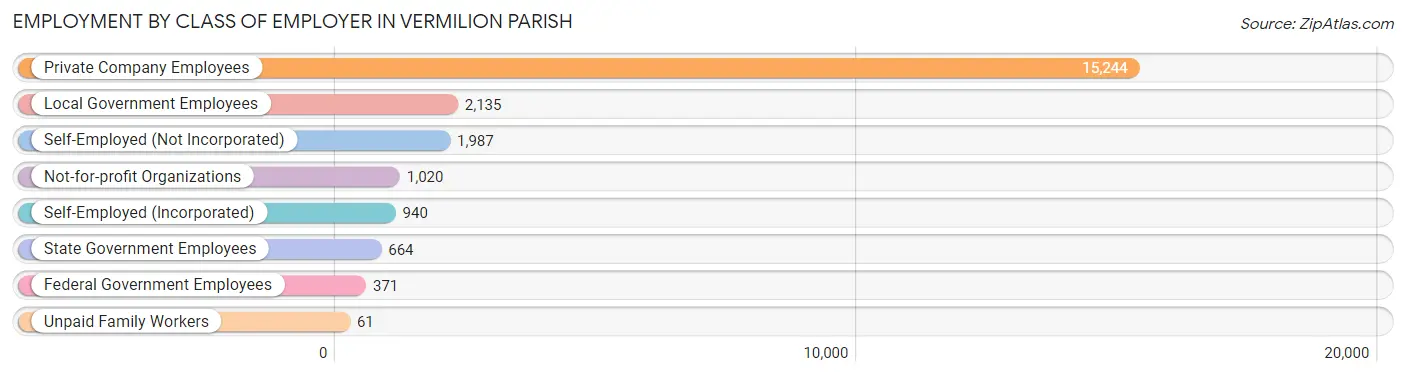
| Employer Class | # Employees | % Employees |
| Private Company Employees | 15,244 | 68.0% |
| Self-Employed (Incorporated) | 940 | 4.2% |
| Self-Employed (Not Incorporated) | 1,987 | 8.9% |
| Not-for-profit Organizations | 1,020 | 4.5% |
| Local Government Employees | 2,135 | 9.5% |
| State Government Employees | 664 | 3.0% |
| Federal Government Employees | 371 | 1.7% |
| Unpaid Family Workers | 61 | 0.3% |
| Total | 22,422 | 100.0% |
Employment Status by Age in Vermilion Parish
According to the labor force statistics for Vermilion Parish, out of the total population over 16 years of age (44,487), 55.6% or 24,735 individuals are in the labor force, with 6.2% or 1,534 of them unemployed. The age group with the highest labor force participation rate is 30 to 34 years, with 82.6% or 3,094 individuals in the labor force. Within the labor force, the 75 years and over age range has the highest percentage of unemployed individuals, with 18.7% or 49 of them being unemployed.
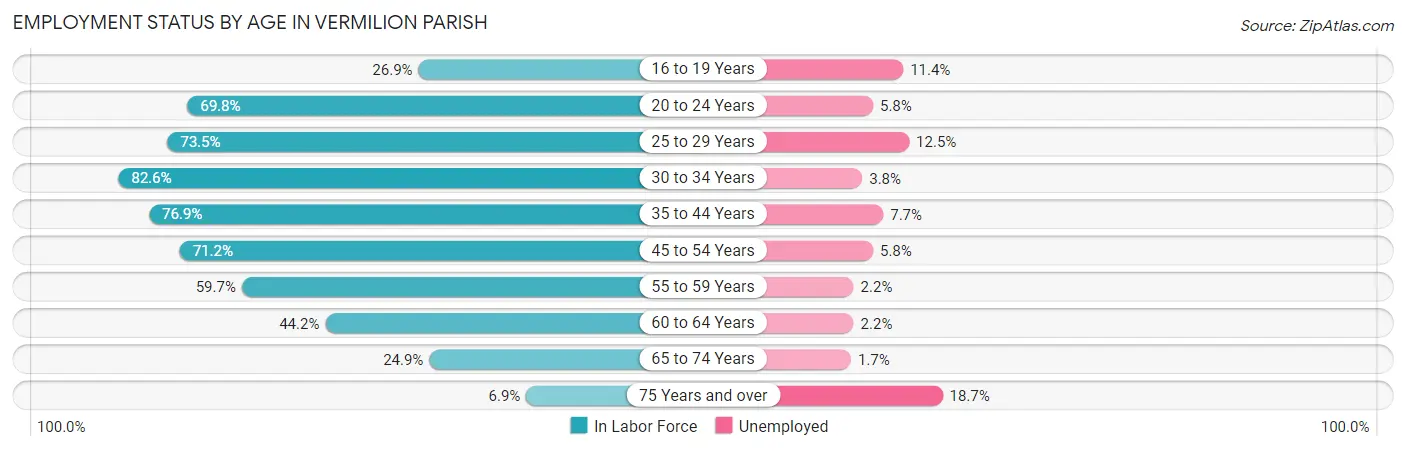
| Age Bracket | In Labor Force | Unemployed |
| 16 to 19 Years | 816 (26.9%) | 93 (11.4%) |
| 20 to 24 Years | 2,336 (69.8%) | 135 (5.8%) |
| 25 to 29 Years | 2,440 (73.5%) | 305 (12.5%) |
| 30 to 34 Years | 3,094 (82.6%) | 118 (3.8%) |
| 35 to 44 Years | 5,501 (76.9%) | 424 (7.7%) |
| 45 to 54 Years | 4,963 (71.2%) | 288 (5.8%) |
| 55 to 59 Years | 2,178 (59.7%) | 48 (2.2%) |
| 60 to 64 Years | 1,834 (44.2%) | 40 (2.2%) |
| 65 to 74 Years | 1,321 (24.9%) | 22 (1.7%) |
| 75 Years and over | 263 (6.9%) | 49 (18.7%) |
| Total | 24,735 (55.6%) | 1,534 (6.2%) |
Employment Status by Educational Attainment in Vermilion Parish
According to labor force statistics for Vermilion Parish, 69.0% of individuals (20,000) out of the total population between 25 and 64 years of age (28,986) are in the labor force, with 6.1% or 1,220 of them being unemployed. The group with the highest labor force participation rate are those with the educational attainment of bachelor's degree or higher, with 81.6% or 4,783 individuals in the labor force. Within the labor force, individuals with less than high school education have the highest percentage of unemployment, with 8.4% or 187 of them being unemployed.
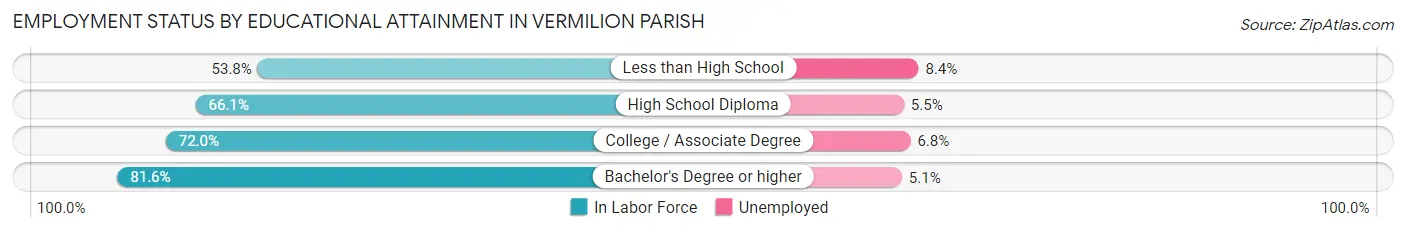
| Educational Attainment | In Labor Force | Unemployed |
| Less than High School | 2,227 (53.8%) | 348 (8.4%) |
| High School Diploma | 7,446 (66.1%) | 620 (5.5%) |
| College / Associate Degree | 5,559 (72.0%) | 525 (6.8%) |
| Bachelor's Degree or higher | 4,783 (81.6%) | 299 (5.1%) |
| Total | 20,000 (69.0%) | 1,768 (6.1%) |
Employment Occupations by Sex in Vermilion Parish
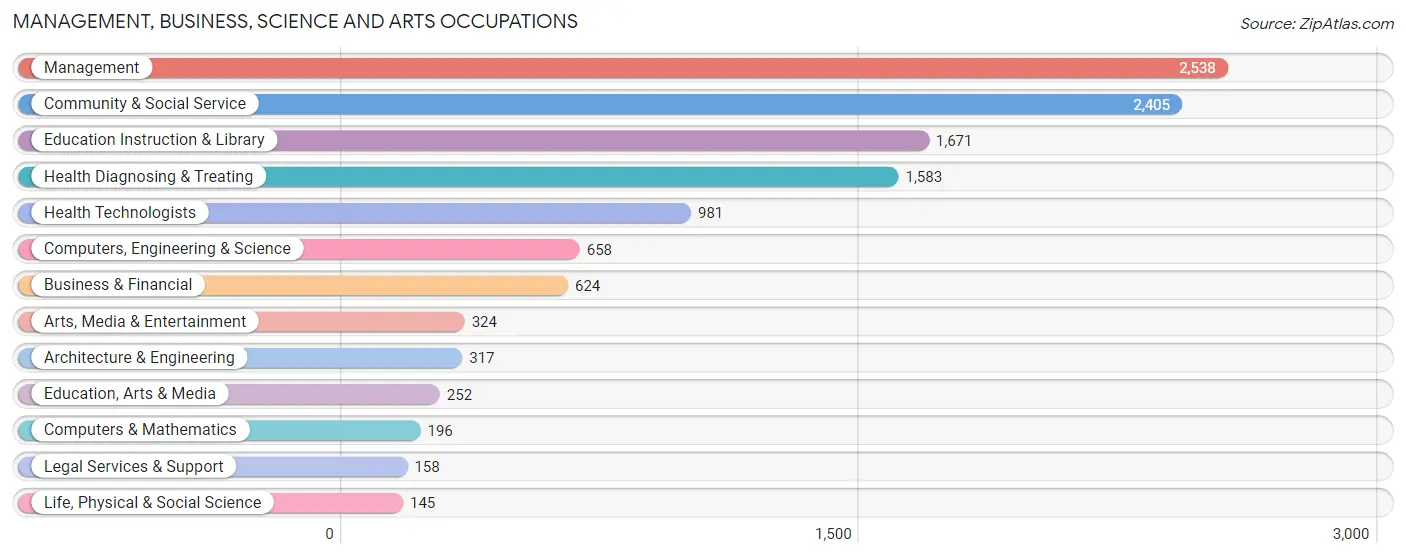
Management, Business, Science and Arts Occupations
The most common Management, Business, Science and Arts occupations in Vermilion Parish are Management (2,538 | 11.0%), Community & Social Service (2,405 | 10.4%), Education Instruction & Library (1,671 | 7.2%), Health Diagnosing & Treating (1,583 | 6.9%), and Health Technologists (981 | 4.3%).
Management, Business, Science and Arts Occupations by Sex
Within the Management, Business, Science and Arts occupations in Vermilion Parish, the most male-oriented occupations are Architecture & Engineering (88.3%), Life, Physical & Social Science (82.8%), and Computers, Engineering & Science (80.5%), while the most female-oriented occupations are Education Instruction & Library (79.3%), Community & Social Service (72.9%), and Health Diagnosing & Treating (67.9%).
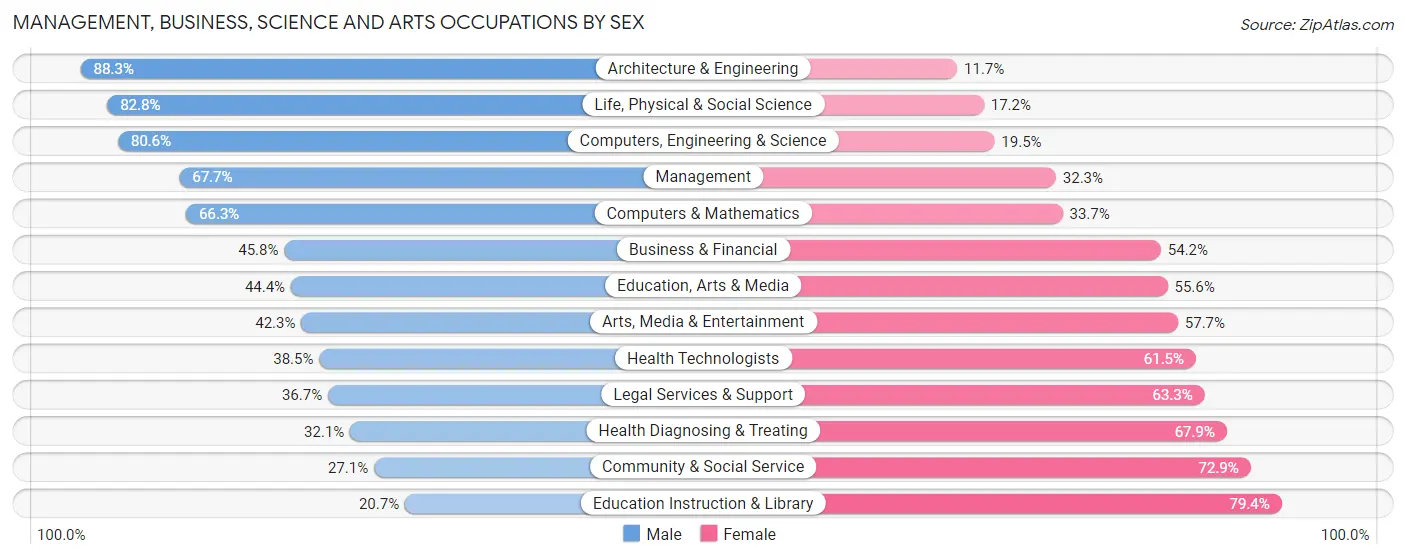
| Occupation | Male | Female |
| Management | 1,719 (67.7%) | 819 (32.3%) |
| Business & Financial | 286 (45.8%) | 338 (54.2%) |
| Computers, Engineering & Science | 530 (80.5%) | 128 (19.5%) |
| Computers & Mathematics | 130 (66.3%) | 66 (33.7%) |
| Architecture & Engineering | 280 (88.3%) | 37 (11.7%) |
| Life, Physical & Social Science | 120 (82.8%) | 25 (17.2%) |
| Community & Social Service | 652 (27.1%) | 1,753 (72.9%) |
| Education, Arts & Media | 112 (44.4%) | 140 (55.6%) |
| Legal Services & Support | 58 (36.7%) | 100 (63.3%) |
| Education Instruction & Library | 345 (20.6%) | 1,326 (79.3%) |
| Arts, Media & Entertainment | 137 (42.3%) | 187 (57.7%) |
| Health Diagnosing & Treating | 508 (32.1%) | 1,075 (67.9%) |
| Health Technologists | 378 (38.5%) | 603 (61.5%) |
| Total (Category) | 3,695 (47.3%) | 4,113 (52.7%) |
| Total (Overall) | 12,891 (55.9%) | 10,175 (44.1%) |
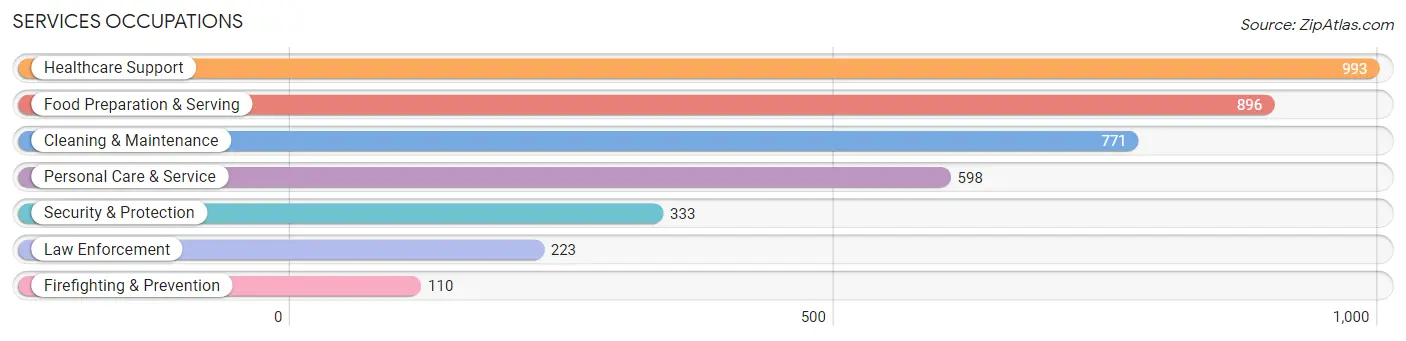
Services Occupations
The most common Services occupations in Vermilion Parish are Healthcare Support (993 | 4.3%), Food Preparation & Serving (896 | 3.9%), Cleaning & Maintenance (771 | 3.3%), Personal Care & Service (598 | 2.6%), and Security & Protection (333 | 1.4%).
Services Occupations by Sex
Within the Services occupations in Vermilion Parish, the most male-oriented occupations are Law Enforcement (93.3%), Security & Protection (91.0%), and Firefighting & Prevention (86.4%), while the most female-oriented occupations are Healthcare Support (99.2%), Personal Care & Service (83.1%), and Food Preparation & Serving (55.5%).
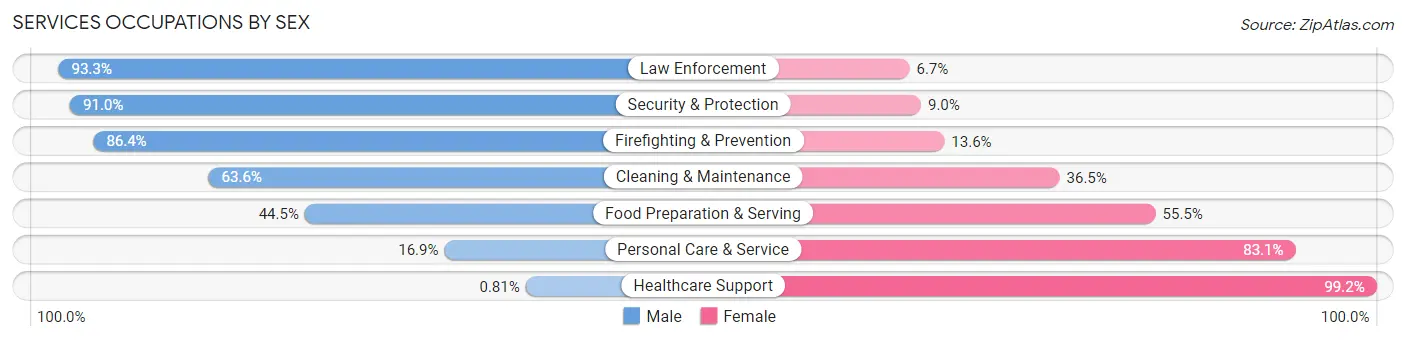
| Occupation | Male | Female |
| Healthcare Support | 8 (0.8%) | 985 (99.2%) |
| Security & Protection | 303 (91.0%) | 30 (9.0%) |
| Firefighting & Prevention | 95 (86.4%) | 15 (13.6%) |
| Law Enforcement | 208 (93.3%) | 15 (6.7%) |
| Food Preparation & Serving | 399 (44.5%) | 497 (55.5%) |
| Cleaning & Maintenance | 490 (63.5%) | 281 (36.4%) |
| Personal Care & Service | 101 (16.9%) | 497 (83.1%) |
| Total (Category) | 1,301 (36.2%) | 2,290 (63.8%) |
| Total (Overall) | 12,891 (55.9%) | 10,175 (44.1%) |
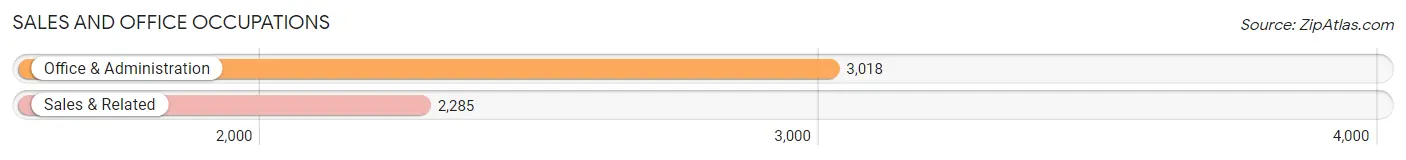
Sales and Office Occupations
The most common Sales and Office occupations in Vermilion Parish are Office & Administration (3,018 | 13.1%), and Sales & Related (2,285 | 9.9%).
Sales and Office Occupations by Sex
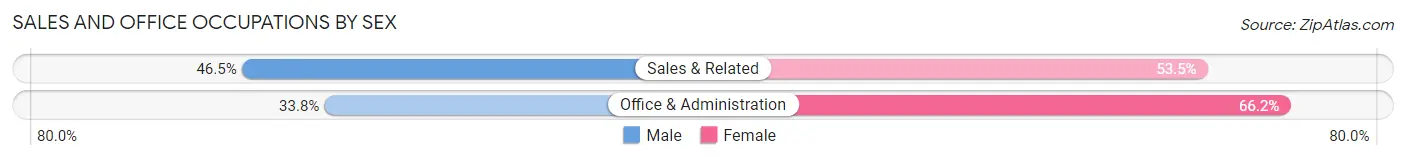
| Occupation | Male | Female |
| Sales & Related | 1,062 (46.5%) | 1,223 (53.5%) |
| Office & Administration | 1,019 (33.8%) | 1,999 (66.2%) |
| Total (Category) | 2,081 (39.2%) | 3,222 (60.8%) |
| Total (Overall) | 12,891 (55.9%) | 10,175 (44.1%) |
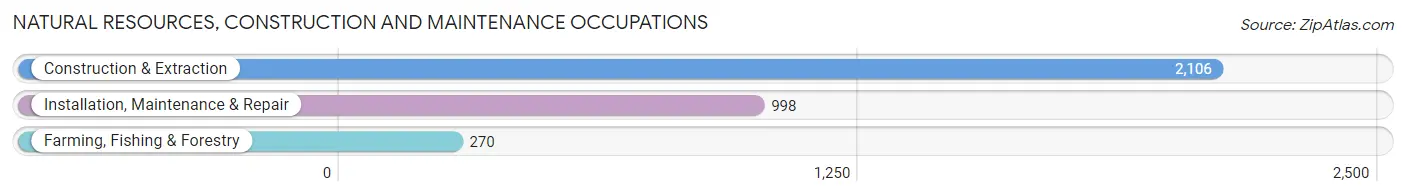
Natural Resources, Construction and Maintenance Occupations
The most common Natural Resources, Construction and Maintenance occupations in Vermilion Parish are Construction & Extraction (2,106 | 9.1%), Installation, Maintenance & Repair (998 | 4.3%), and Farming, Fishing & Forestry (270 | 1.2%).
Natural Resources, Construction and Maintenance Occupations by Sex
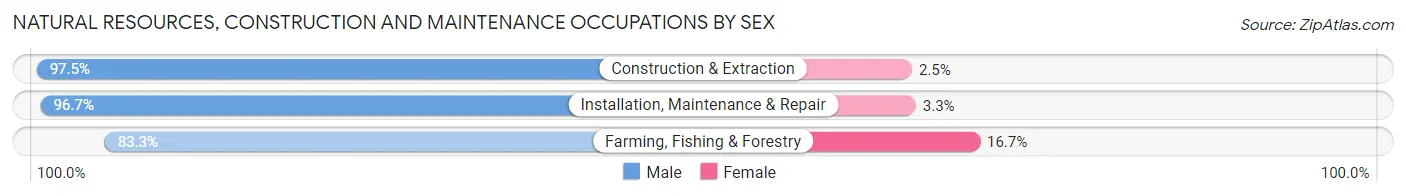
| Occupation | Male | Female |
| Farming, Fishing & Forestry | 225 (83.3%) | 45 (16.7%) |
| Construction & Extraction | 2,053 (97.5%) | 53 (2.5%) |
| Installation, Maintenance & Repair | 965 (96.7%) | 33 (3.3%) |
| Total (Category) | 3,243 (96.1%) | 131 (3.9%) |
| Total (Overall) | 12,891 (55.9%) | 10,175 (44.1%) |
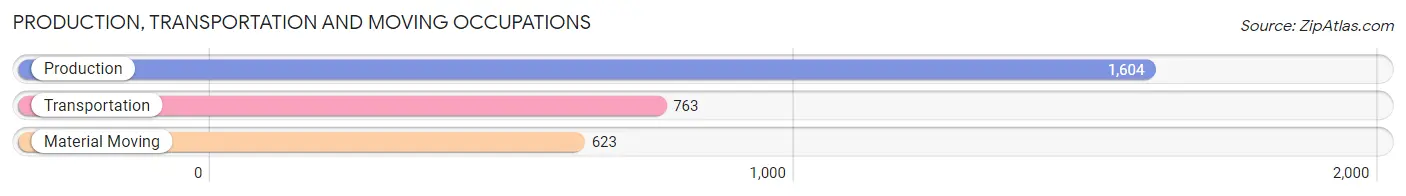
Production, Transportation and Moving Occupations
The most common Production, Transportation and Moving occupations in Vermilion Parish are Production (1,604 | 7.0%), Transportation (763 | 3.3%), and Material Moving (623 | 2.7%).
Production, Transportation and Moving Occupations by Sex
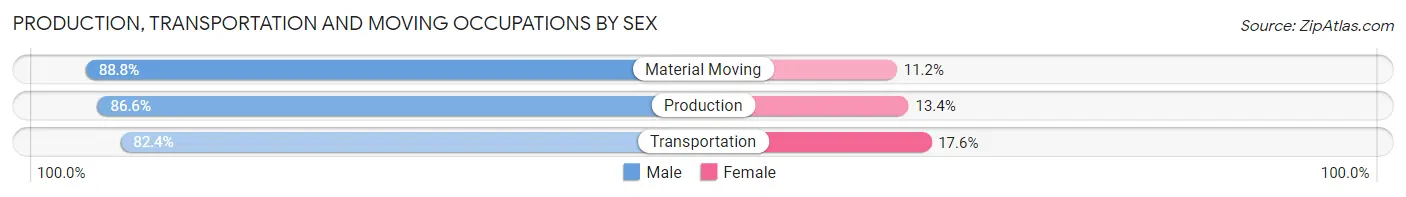
| Occupation | Male | Female |
| Production | 1,389 (86.6%) | 215 (13.4%) |
| Transportation | 629 (82.4%) | 134 (17.6%) |
| Material Moving | 553 (88.8%) | 70 (11.2%) |
| Total (Category) | 2,571 (86.0%) | 419 (14.0%) |
| Total (Overall) | 12,891 (55.9%) | 10,175 (44.1%) |
Employment Industries by Sex in Vermilion Parish
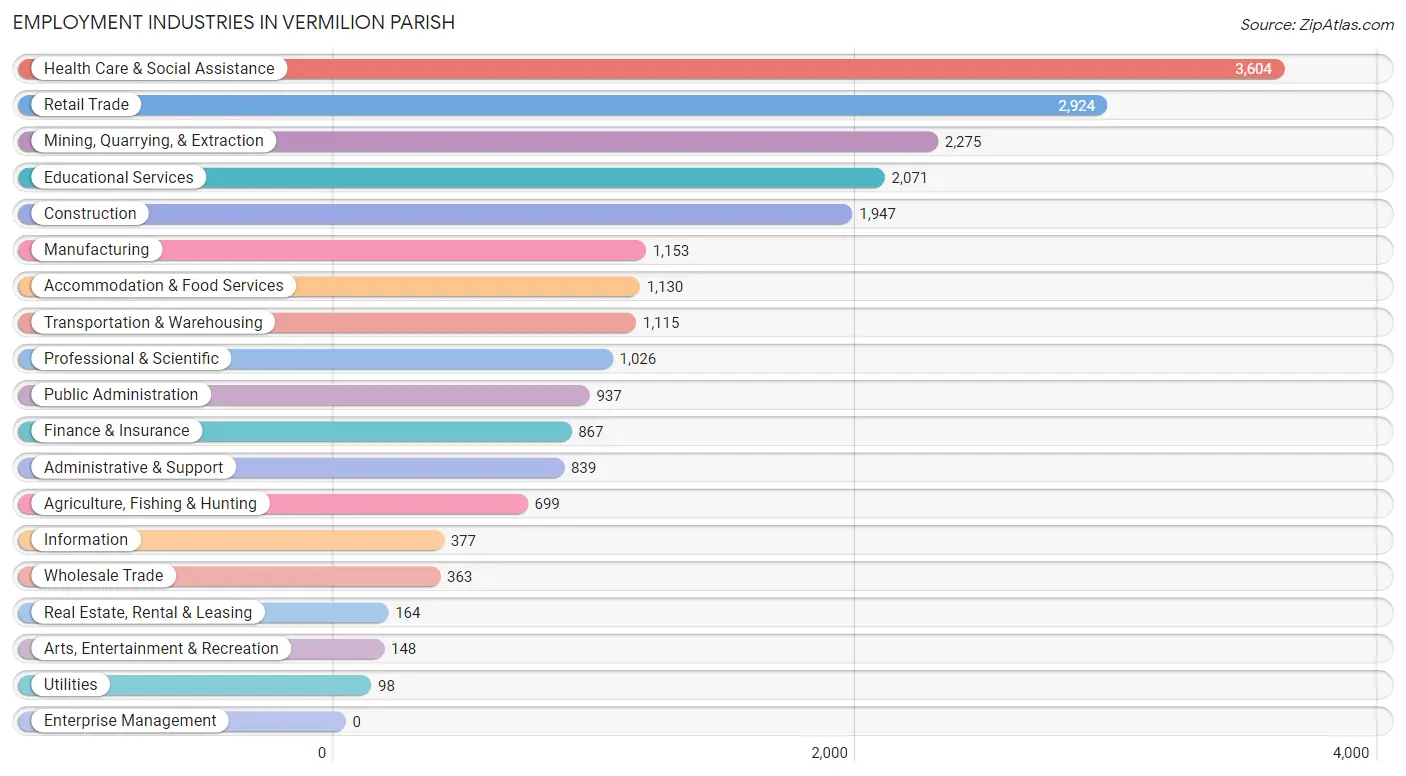
Employment Industries in Vermilion Parish
The major employment industries in Vermilion Parish include Health Care & Social Assistance (3,604 | 15.6%), Retail Trade (2,924 | 12.7%), Mining, Quarrying, & Extraction (2,275 | 9.9%), Educational Services (2,071 | 9.0%), and Construction (1,947 | 8.4%).
Employment Industries by Sex in Vermilion Parish
The Vermilion Parish industries that see more men than women are Mining, Quarrying, & Extraction (94.2%), Construction (91.8%), and Agriculture, Fishing & Hunting (82.6%), whereas the industries that tend to have a higher number of women are Educational Services (80.7%), Health Care & Social Assistance (77.7%), and Finance & Insurance (58.3%).
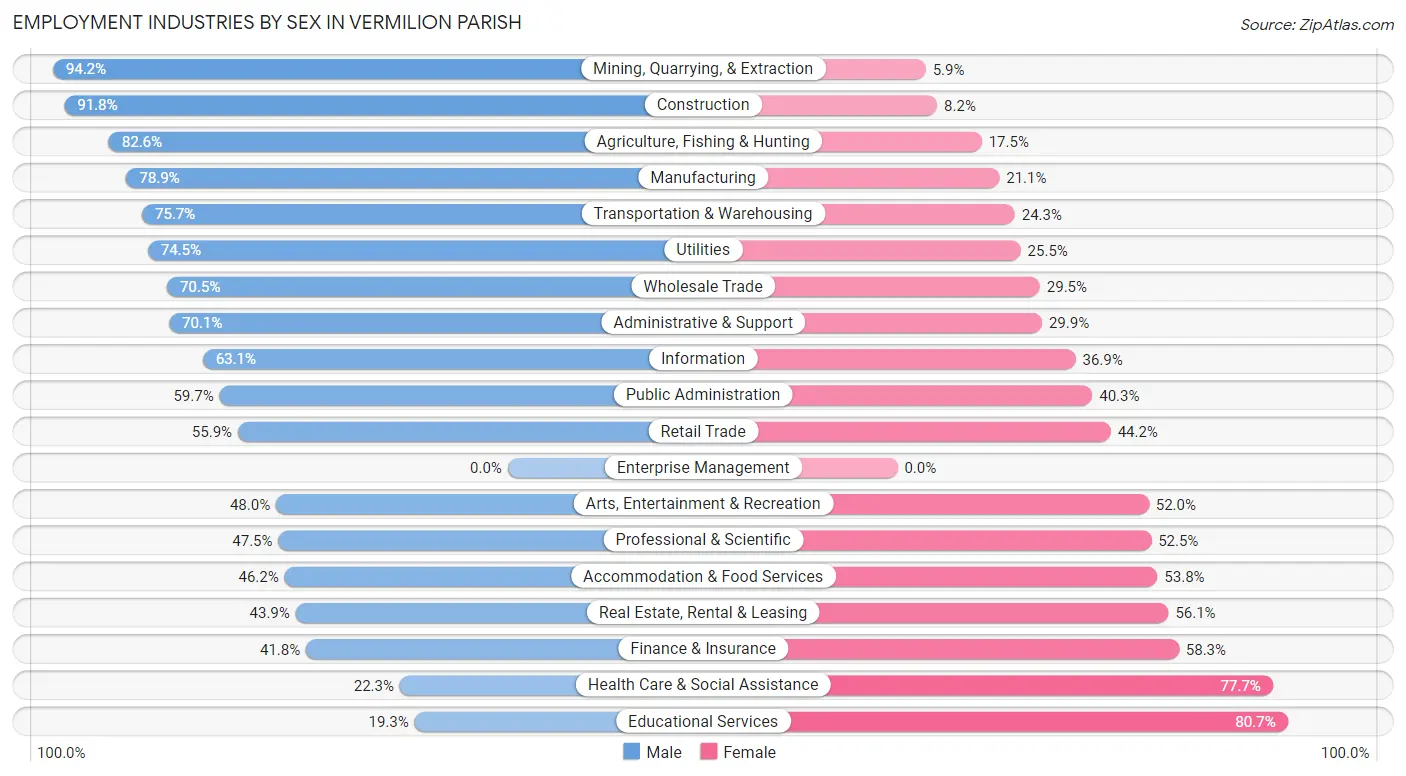
| Industry | Male | Female |
| Agriculture, Fishing & Hunting | 577 (82.6%) | 122 (17.4%) |
| Mining, Quarrying, & Extraction | 2,142 (94.2%) | 133 (5.9%) |
| Construction | 1,787 (91.8%) | 160 (8.2%) |
| Manufacturing | 910 (78.9%) | 243 (21.1%) |
| Wholesale Trade | 256 (70.5%) | 107 (29.5%) |
| Retail Trade | 1,633 (55.8%) | 1,291 (44.2%) |
| Transportation & Warehousing | 844 (75.7%) | 271 (24.3%) |
| Utilities | 73 (74.5%) | 25 (25.5%) |
| Information | 238 (63.1%) | 139 (36.9%) |
| Finance & Insurance | 362 (41.7%) | 505 (58.3%) |
| Real Estate, Rental & Leasing | 72 (43.9%) | 92 (56.1%) |
| Professional & Scientific | 487 (47.5%) | 539 (52.5%) |
| Enterprise Management | 0 (0.0%) | 0 (0.0%) |
| Administrative & Support | 588 (70.1%) | 251 (29.9%) |
| Educational Services | 399 (19.3%) | 1,672 (80.7%) |
| Health Care & Social Assistance | 805 (22.3%) | 2,799 (77.7%) |
| Arts, Entertainment & Recreation | 71 (48.0%) | 77 (52.0%) |
| Accommodation & Food Services | 522 (46.2%) | 608 (53.8%) |
| Public Administration | 559 (59.7%) | 378 (40.3%) |
| Total | 12,891 (55.9%) | 10,175 (44.1%) |
Education in Vermilion Parish
School Enrollment in Vermilion Parish
The most common levels of schooling among the 13,482 students in Vermilion Parish are elementary school (3,762 | 27.9%), high school (3,131 | 23.2%), and middle school (2,965 | 22.0%).
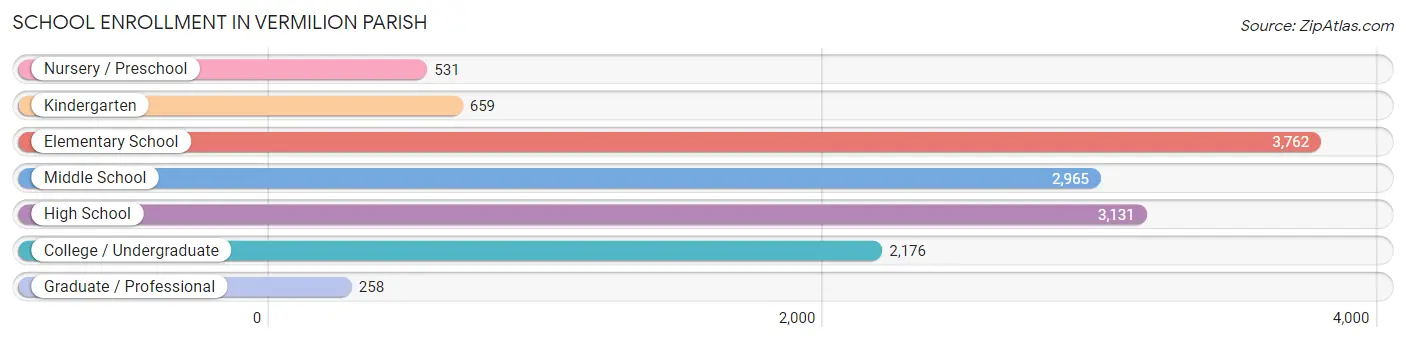
| School Level | # Students | % Students |
| Nursery / Preschool | 531 | 3.9% |
| Kindergarten | 659 | 4.9% |
| Elementary School | 3,762 | 27.9% |
| Middle School | 2,965 | 22.0% |
| High School | 3,131 | 23.2% |
| College / Undergraduate | 2,176 | 16.1% |
| Graduate / Professional | 258 | 1.9% |
| Total | 13,482 | 100.0% |
School Enrollment by Age by Funding Source in Vermilion Parish
Out of a total of 13,482 students who are enrolled in schools in Vermilion Parish, 2,036 (15.1%) attend a private institution, while the remaining 11,446 (84.9%) are enrolled in public schools. The age group of 3 to 4 year olds has the highest likelihood of being enrolled in private schools, with 150 (47.0% in the age bracket) enrolled. Conversely, the age group of 5 to 9 year old has the lowest likelihood of being enrolled in a private school, with 3,797 (90.1% in the age bracket) attending a public institution.
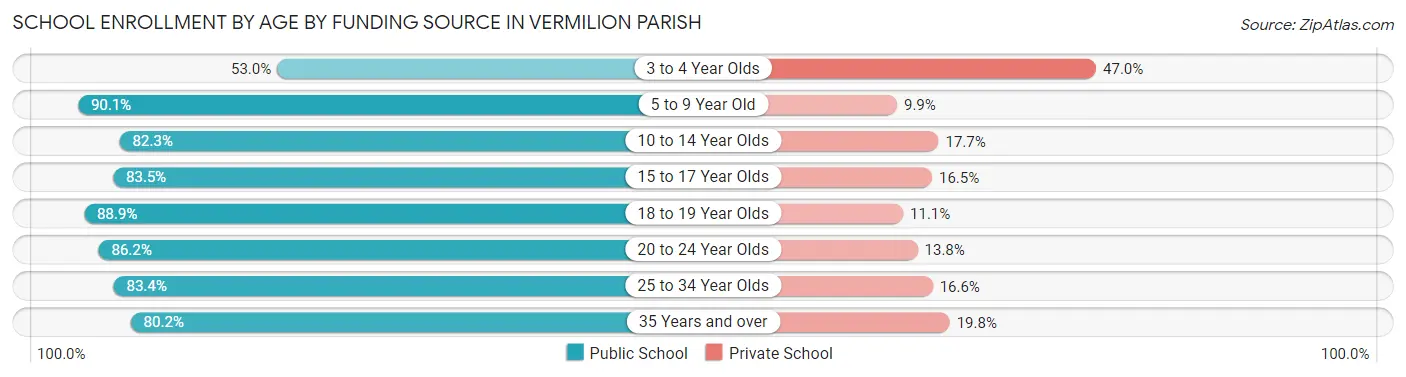
| Age Bracket | Public School | Private School |
| 3 to 4 Year Olds | 169 (53.0%) | 150 (47.0%) |
| 5 to 9 Year Old | 3,797 (90.1%) | 419 (9.9%) |
| 10 to 14 Year Olds | 3,190 (82.3%) | 685 (17.7%) |
| 15 to 17 Year Olds | 1,928 (83.5%) | 380 (16.5%) |
| 18 to 19 Year Olds | 795 (88.9%) | 99 (11.1%) |
| 20 to 24 Year Olds | 689 (86.2%) | 110 (13.8%) |
| 25 to 34 Year Olds | 332 (83.4%) | 66 (16.6%) |
| 35 Years and over | 540 (80.2%) | 133 (19.8%) |
| Total | 11,446 (84.9%) | 2,036 (15.1%) |
Educational Attainment by Field of Study in Vermilion Parish
Education (1,671 | 22.3%), science & technology (1,342 | 17.9%), business (1,100 | 14.7%), bio, nature & agricultural (545 | 7.3%), and liberal arts & history (531 | 7.1%) are the most common fields of study among 7,504 individuals in Vermilion Parish who have obtained a bachelor's degree or higher.
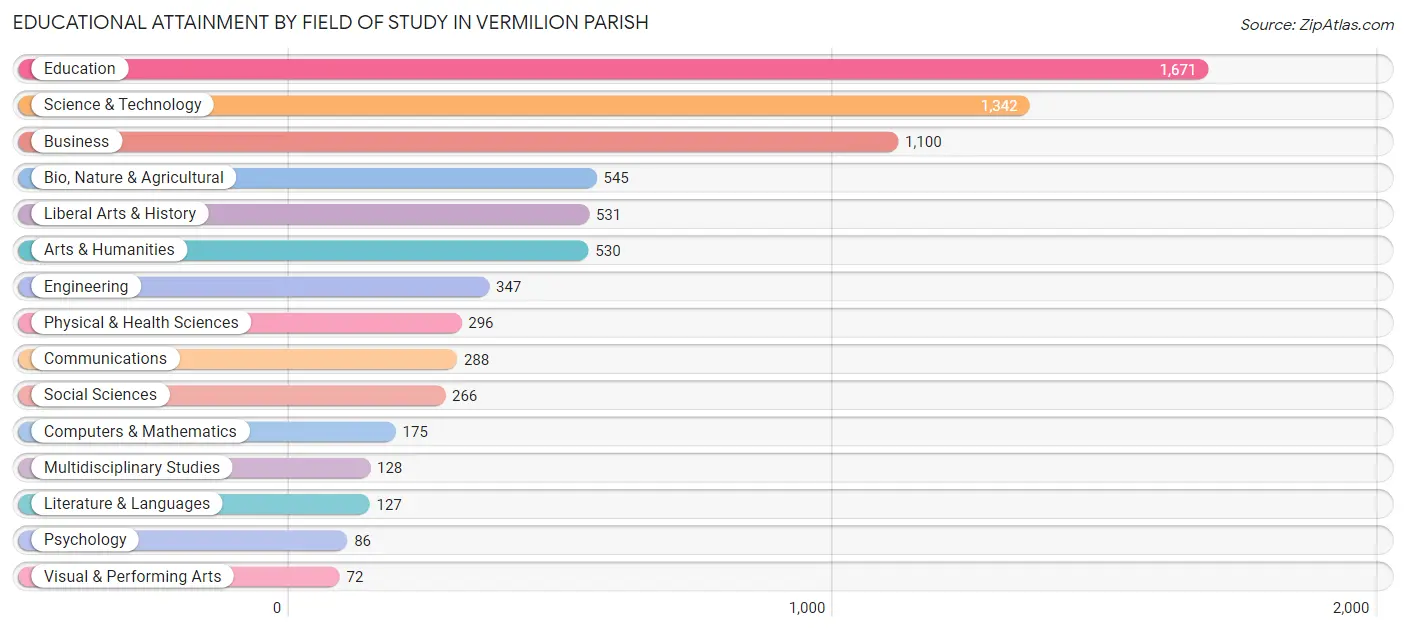
| Field of Study | # Graduates | % Graduates |
| Computers & Mathematics | 175 | 2.3% |
| Bio, Nature & Agricultural | 545 | 7.3% |
| Physical & Health Sciences | 296 | 3.9% |
| Psychology | 86 | 1.1% |
| Social Sciences | 266 | 3.5% |
| Engineering | 347 | 4.6% |
| Multidisciplinary Studies | 128 | 1.7% |
| Science & Technology | 1,342 | 17.9% |
| Business | 1,100 | 14.7% |
| Education | 1,671 | 22.3% |
| Literature & Languages | 127 | 1.7% |
| Liberal Arts & History | 531 | 7.1% |
| Visual & Performing Arts | 72 | 1.0% |
| Communications | 288 | 3.8% |
| Arts & Humanities | 530 | 7.1% |
| Total | 7,504 | 100.0% |
Transportation & Commute in Vermilion Parish
Vehicle Availability by Sex in Vermilion Parish
The most prevalent vehicle ownership categories in Vermilion Parish are males with 2 vehicles (6,454, accounting for 51.3%) and females with 2 vehicles (4,255, making up 65.5%).
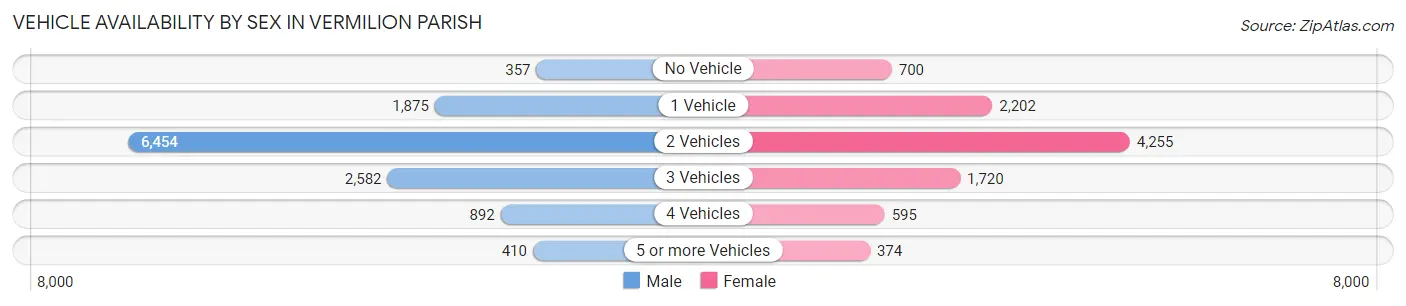
| Vehicles Available | Male | Female |
| No Vehicle | 357 (2.8%) | 700 (7.1%) |
| 1 Vehicle | 1,875 (14.9%) | 2,202 (22.4%) |
| 2 Vehicles | 6,454 (51.3%) | 4,255 (43.2%) |
| 3 Vehicles | 2,582 (20.5%) | 1,720 (17.5%) |
| 4 Vehicles | 892 (7.1%) | 595 (6.0%) |
| 5 or more Vehicles | 410 (3.3%) | 374 (3.8%) |
| Total | 12,570 (100.0%) | 9,846 (100.0%) |
Commute Time in Vermilion Parish
The most frequently occuring commute durations in Vermilion Parish are 30 to 34 minutes (3,322 commuters, 15.6%), 5 to 9 minutes (2,911 commuters, 13.6%), and 45 to 59 minutes (2,630 commuters, 12.3%).
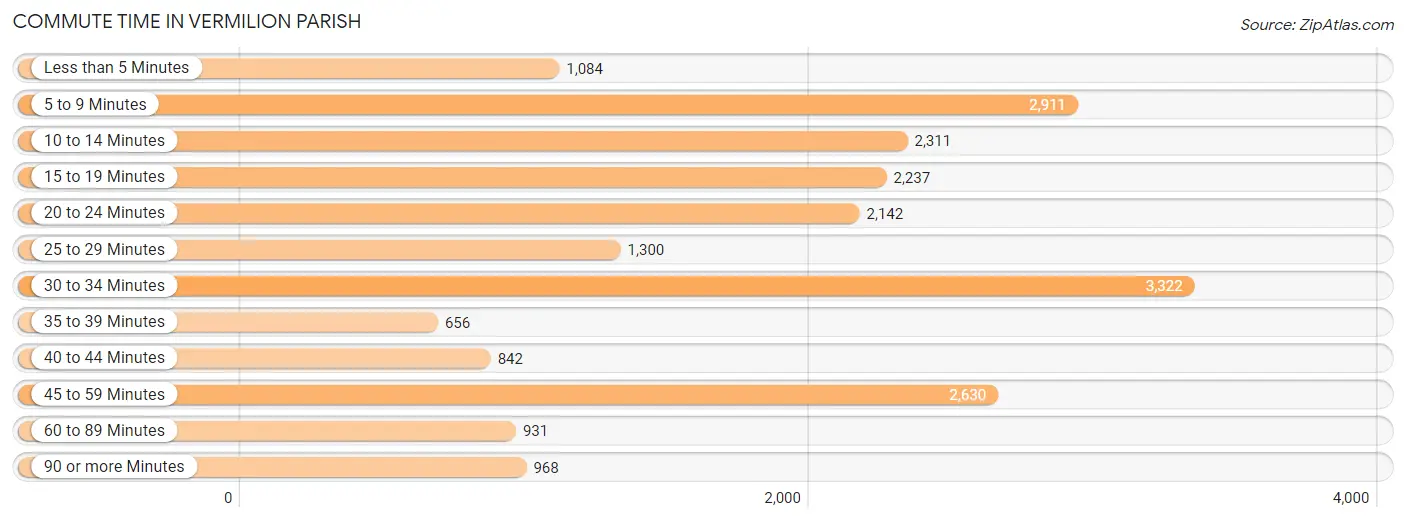
| Commute Time | # Commuters | % Commuters |
| Less than 5 Minutes | 1,084 | 5.1% |
| 5 to 9 Minutes | 2,911 | 13.6% |
| 10 to 14 Minutes | 2,311 | 10.8% |
| 15 to 19 Minutes | 2,237 | 10.5% |
| 20 to 24 Minutes | 2,142 | 10.0% |
| 25 to 29 Minutes | 1,300 | 6.1% |
| 30 to 34 Minutes | 3,322 | 15.6% |
| 35 to 39 Minutes | 656 | 3.1% |
| 40 to 44 Minutes | 842 | 4.0% |
| 45 to 59 Minutes | 2,630 | 12.3% |
| 60 to 89 Minutes | 931 | 4.4% |
| 90 or more Minutes | 968 | 4.5% |
Commute Time by Sex in Vermilion Parish
The most common commute times in Vermilion Parish are 30 to 34 minutes (2,113 commuters, 17.4%) for males and 5 to 9 minutes (1,675 commuters, 18.2%) for females.
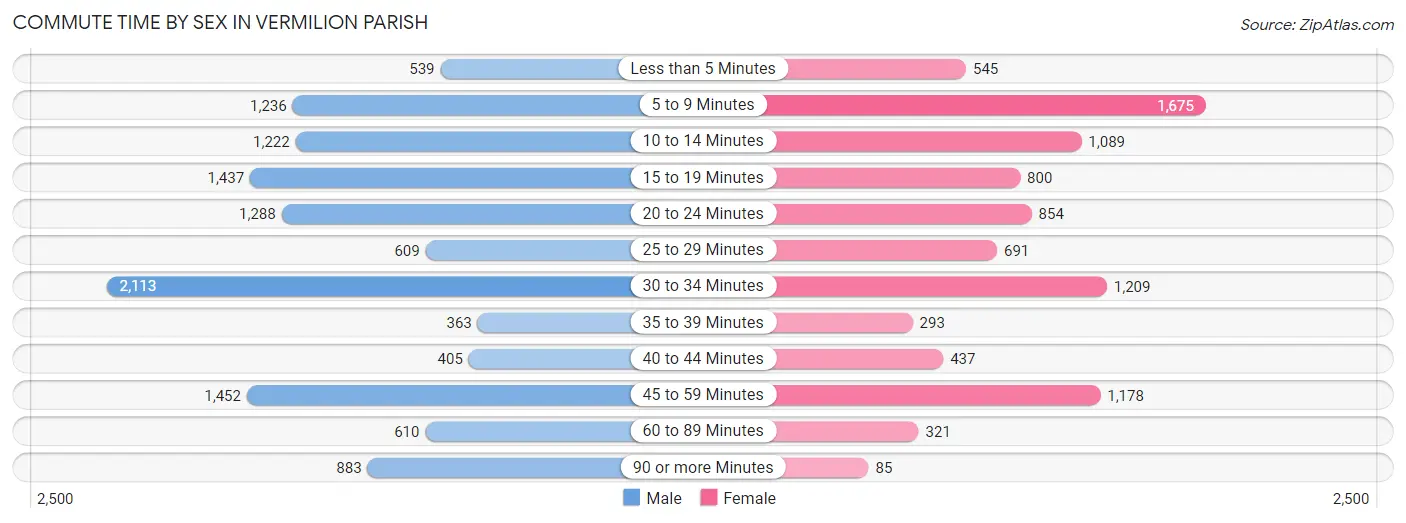
| Commute Time | Male | Female |
| Less than 5 Minutes | 539 (4.4%) | 545 (5.9%) |
| 5 to 9 Minutes | 1,236 (10.2%) | 1,675 (18.2%) |
| 10 to 14 Minutes | 1,222 (10.1%) | 1,089 (11.9%) |
| 15 to 19 Minutes | 1,437 (11.8%) | 800 (8.7%) |
| 20 to 24 Minutes | 1,288 (10.6%) | 854 (9.3%) |
| 25 to 29 Minutes | 609 (5.0%) | 691 (7.5%) |
| 30 to 34 Minutes | 2,113 (17.4%) | 1,209 (13.2%) |
| 35 to 39 Minutes | 363 (3.0%) | 293 (3.2%) |
| 40 to 44 Minutes | 405 (3.3%) | 437 (4.8%) |
| 45 to 59 Minutes | 1,452 (11.9%) | 1,178 (12.8%) |
| 60 to 89 Minutes | 610 (5.0%) | 321 (3.5%) |
| 90 or more Minutes | 883 (7.3%) | 85 (0.9%) |
Time of Departure to Work by Sex in Vermilion Parish
The most frequent times of departure to work in Vermilion Parish are 7:00 AM to 7:29 AM (1,902, 15.7%) for males and 7:00 AM to 7:29 AM (2,088, 22.8%) for females.
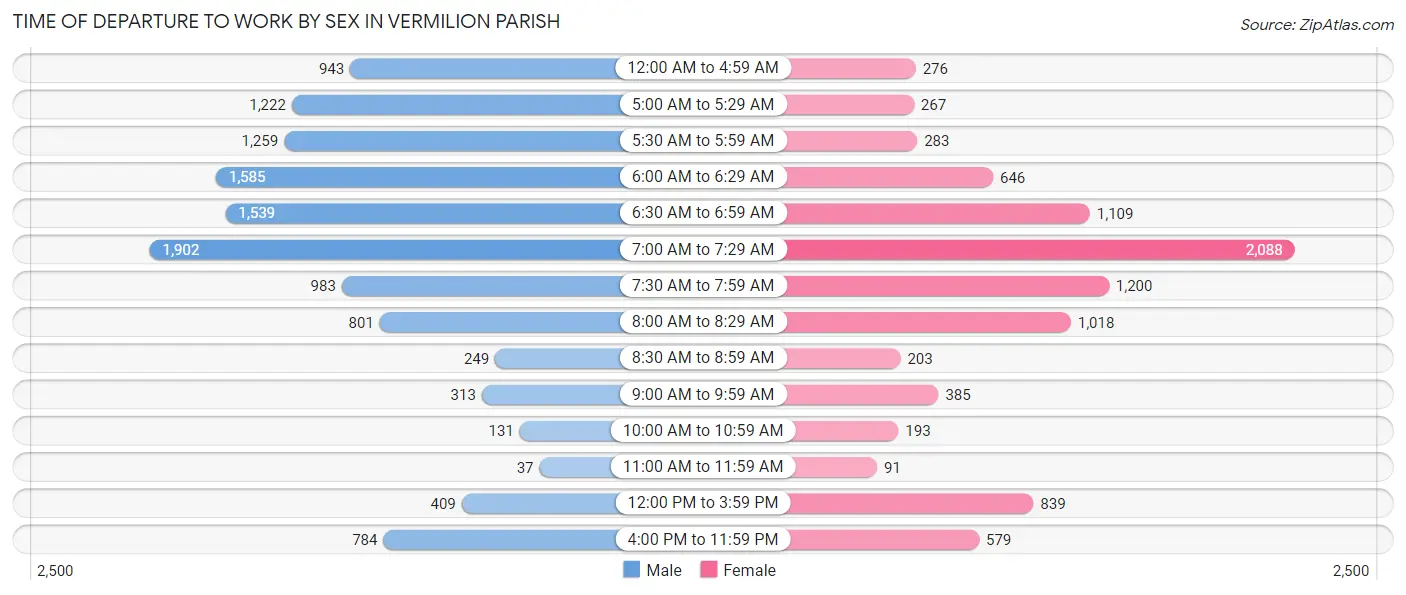
| Time of Departure | Male | Female |
| 12:00 AM to 4:59 AM | 943 (7.8%) | 276 (3.0%) |
| 5:00 AM to 5:29 AM | 1,222 (10.1%) | 267 (2.9%) |
| 5:30 AM to 5:59 AM | 1,259 (10.4%) | 283 (3.1%) |
| 6:00 AM to 6:29 AM | 1,585 (13.0%) | 646 (7.0%) |
| 6:30 AM to 6:59 AM | 1,539 (12.7%) | 1,109 (12.1%) |
| 7:00 AM to 7:29 AM | 1,902 (15.7%) | 2,088 (22.8%) |
| 7:30 AM to 7:59 AM | 983 (8.1%) | 1,200 (13.1%) |
| 8:00 AM to 8:29 AM | 801 (6.6%) | 1,018 (11.1%) |
| 8:30 AM to 8:59 AM | 249 (2.1%) | 203 (2.2%) |
| 9:00 AM to 9:59 AM | 313 (2.6%) | 385 (4.2%) |
| 10:00 AM to 10:59 AM | 131 (1.1%) | 193 (2.1%) |
| 11:00 AM to 11:59 AM | 37 (0.3%) | 91 (1.0%) |
| 12:00 PM to 3:59 PM | 409 (3.4%) | 839 (9.1%) |
| 4:00 PM to 11:59 PM | 784 (6.5%) | 579 (6.3%) |
| Total | 12,157 (100.0%) | 9,177 (100.0%) |
Housing Occupancy in Vermilion Parish
Occupancy by Ownership in Vermilion Parish
Of the total 21,704 dwellings in Vermilion Parish, owner-occupied units account for 16,603 (76.5%), while renter-occupied units make up 5,101 (23.5%).
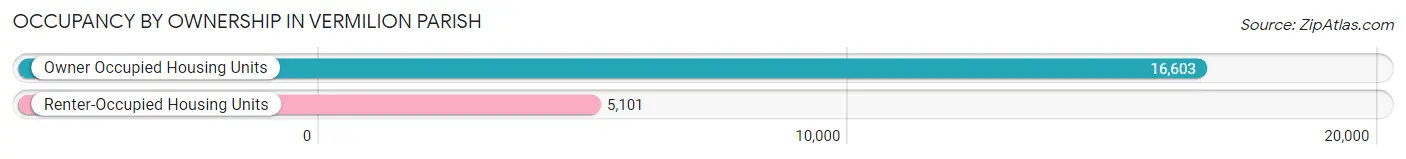
| Occupancy | # Housing Units | % Housing Units |
| Owner Occupied Housing Units | 16,603 | 76.5% |
| Renter-Occupied Housing Units | 5,101 | 23.5% |
| Total Occupied Housing Units | 21,704 | 100.0% |
Occupancy by Household Size in Vermilion Parish
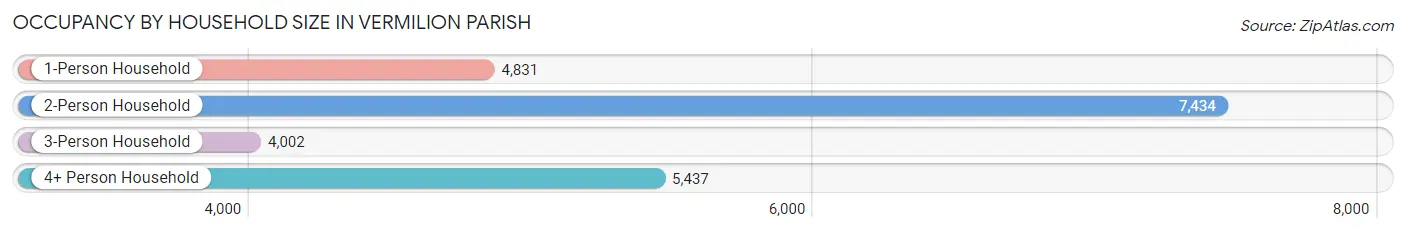
| Household Size | # Housing Units | % Housing Units |
| 1-Person Household | 4,831 | 22.3% |
| 2-Person Household | 7,434 | 34.3% |
| 3-Person Household | 4,002 | 18.4% |
| 4+ Person Household | 5,437 | 25.1% |
| Total Housing Units | 21,704 | 100.0% |
Occupancy by Ownership by Household Size in Vermilion Parish
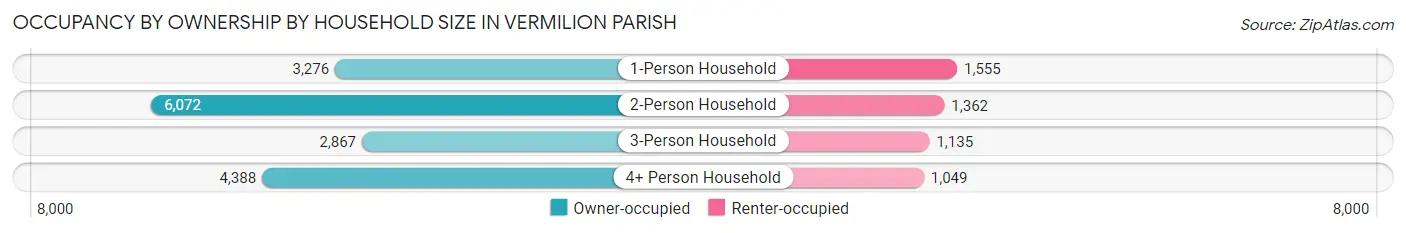
| Household Size | Owner-occupied | Renter-occupied |
| 1-Person Household | 3,276 (67.8%) | 1,555 (32.2%) |
| 2-Person Household | 6,072 (81.7%) | 1,362 (18.3%) |
| 3-Person Household | 2,867 (71.6%) | 1,135 (28.4%) |
| 4+ Person Household | 4,388 (80.7%) | 1,049 (19.3%) |
| Total Housing Units | 16,603 (76.5%) | 5,101 (23.5%) |
Occupancy by Educational Attainment in Vermilion Parish
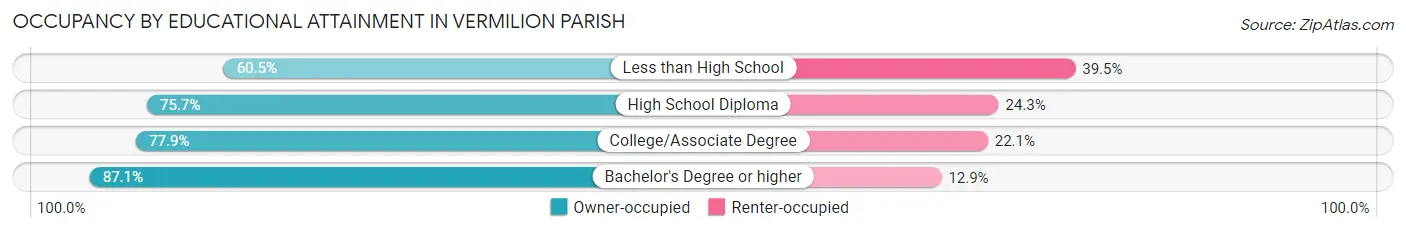
| Household Size | Owner-occupied | Renter-occupied |
| Less than High School | 1,752 (60.5%) | 1,143 (39.5%) |
| High School Diploma | 6,568 (75.7%) | 2,105 (24.3%) |
| College/Associate Degree | 4,588 (77.9%) | 1,304 (22.1%) |
| Bachelor's Degree or higher | 3,695 (87.1%) | 549 (12.9%) |
Occupancy by Age of Householder in Vermilion Parish
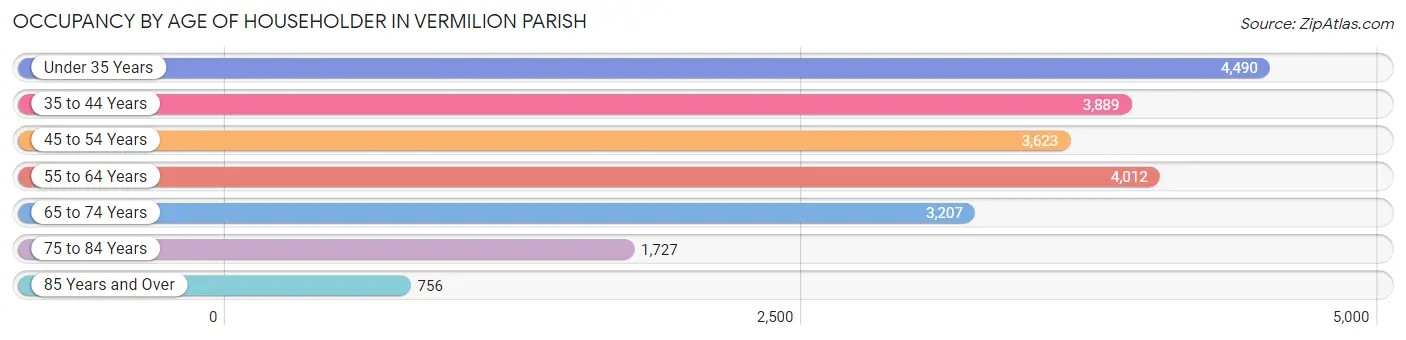
| Age Bracket | # Households | % Households |
| Under 35 Years | 4,490 | 20.7% |
| 35 to 44 Years | 3,889 | 17.9% |
| 45 to 54 Years | 3,623 | 16.7% |
| 55 to 64 Years | 4,012 | 18.5% |
| 65 to 74 Years | 3,207 | 14.8% |
| 75 to 84 Years | 1,727 | 8.0% |
| 85 Years and Over | 756 | 3.5% |
| Total | 21,704 | 100.0% |
Housing Finances in Vermilion Parish
Median Income by Occupancy in Vermilion Parish
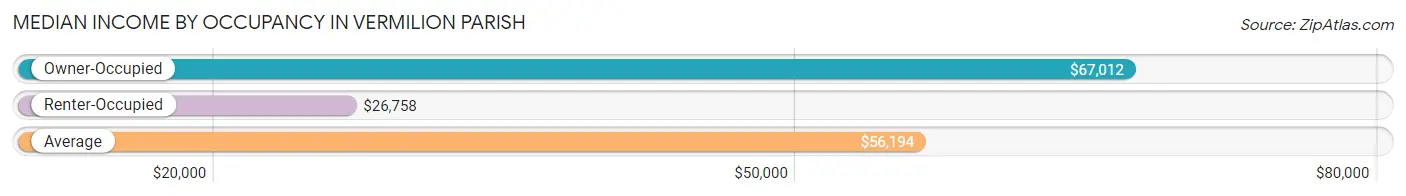
| Occupancy Type | # Households | Median Income |
| Owner-Occupied | 16,603 (76.5%) | $67,012 |
| Renter-Occupied | 5,101 (23.5%) | $26,758 |
| Average | 21,704 (100.0%) | $56,194 |
Occupancy by Householder Income Bracket in Vermilion Parish
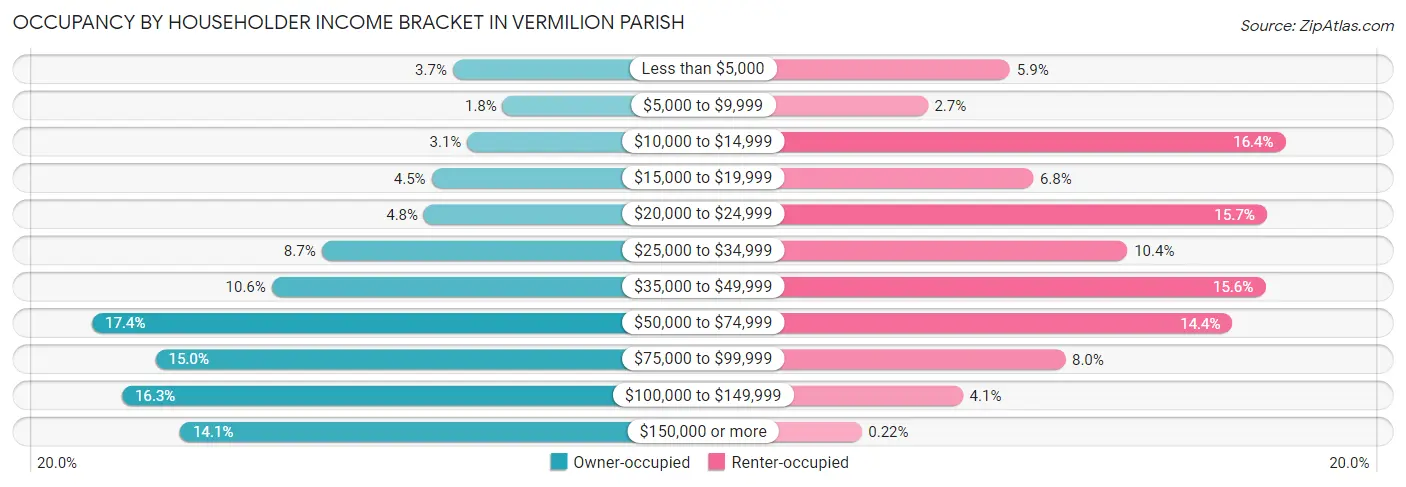
| Income Bracket | Owner-occupied | Renter-occupied |
| Less than $5,000 | 612 (3.7%) | 300 (5.9%) |
| $5,000 to $9,999 | 297 (1.8%) | 140 (2.7%) |
| $10,000 to $14,999 | 522 (3.1%) | 835 (16.4%) |
| $15,000 to $19,999 | 747 (4.5%) | 345 (6.8%) |
| $20,000 to $24,999 | 795 (4.8%) | 799 (15.7%) |
| $25,000 to $34,999 | 1,443 (8.7%) | 528 (10.3%) |
| $35,000 to $49,999 | 1,759 (10.6%) | 796 (15.6%) |
| $50,000 to $74,999 | 2,894 (17.4%) | 732 (14.3%) |
| $75,000 to $99,999 | 2,492 (15.0%) | 407 (8.0%) |
| $100,000 to $149,999 | 2,704 (16.3%) | 208 (4.1%) |
| $150,000 or more | 2,338 (14.1%) | 11 (0.2%) |
| Total | 16,603 (100.0%) | 5,101 (100.0%) |
Monthly Housing Cost Tiers in Vermilion Parish
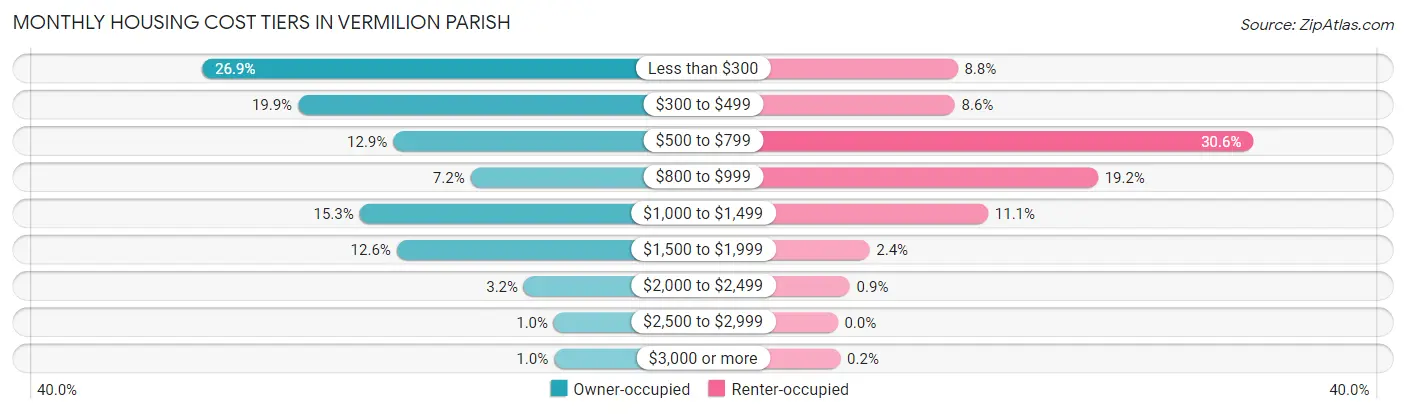
| Monthly Cost | Owner-occupied | Renter-occupied |
| Less than $300 | 4,471 (26.9%) | 451 (8.8%) |
| $300 to $499 | 3,299 (19.9%) | 440 (8.6%) |
| $500 to $799 | 2,135 (12.9%) | 1,562 (30.6%) |
| $800 to $999 | 1,188 (7.2%) | 978 (19.2%) |
| $1,000 to $1,499 | 2,545 (15.3%) | 565 (11.1%) |
| $1,500 to $1,999 | 2,092 (12.6%) | 120 (2.4%) |
| $2,000 to $2,499 | 536 (3.2%) | 46 (0.9%) |
| $2,500 to $2,999 | 170 (1.0%) | 0 (0.0%) |
| $3,000 or more | 167 (1.0%) | 10 (0.2%) |
| Total | 16,603 (100.0%) | 5,101 (100.0%) |
Physical Housing Characteristics in Vermilion Parish
Housing Structures in Vermilion Parish
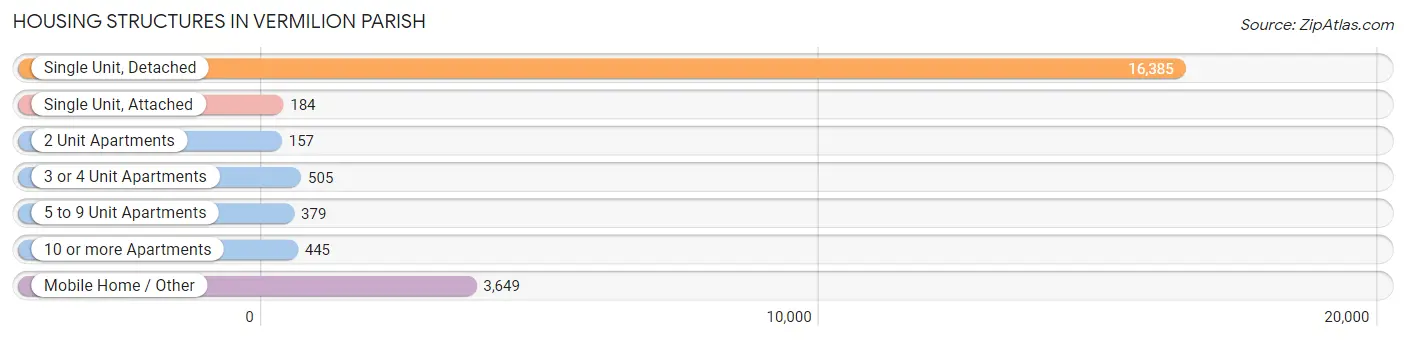
| Structure Type | # Housing Units | % Housing Units |
| Single Unit, Detached | 16,385 | 75.5% |
| Single Unit, Attached | 184 | 0.9% |
| 2 Unit Apartments | 157 | 0.7% |
| 3 or 4 Unit Apartments | 505 | 2.3% |
| 5 to 9 Unit Apartments | 379 | 1.8% |
| 10 or more Apartments | 445 | 2.1% |
| Mobile Home / Other | 3,649 | 16.8% |
| Total | 21,704 | 100.0% |
Housing Structures by Occupancy in Vermilion Parish
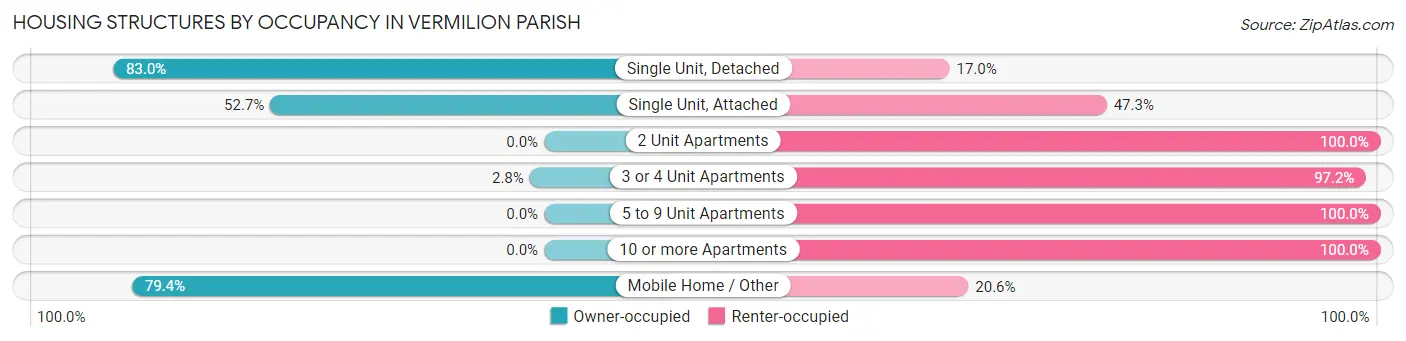
| Structure Type | Owner-occupied | Renter-occupied |
| Single Unit, Detached | 13,596 (83.0%) | 2,789 (17.0%) |
| Single Unit, Attached | 97 (52.7%) | 87 (47.3%) |
| 2 Unit Apartments | 0 (0.0%) | 157 (100.0%) |
| 3 or 4 Unit Apartments | 14 (2.8%) | 491 (97.2%) |
| 5 to 9 Unit Apartments | 0 (0.0%) | 379 (100.0%) |
| 10 or more Apartments | 0 (0.0%) | 445 (100.0%) |
| Mobile Home / Other | 2,896 (79.4%) | 753 (20.6%) |
| Total | 16,603 (76.5%) | 5,101 (23.5%) |
Housing Structures by Number of Rooms in Vermilion Parish
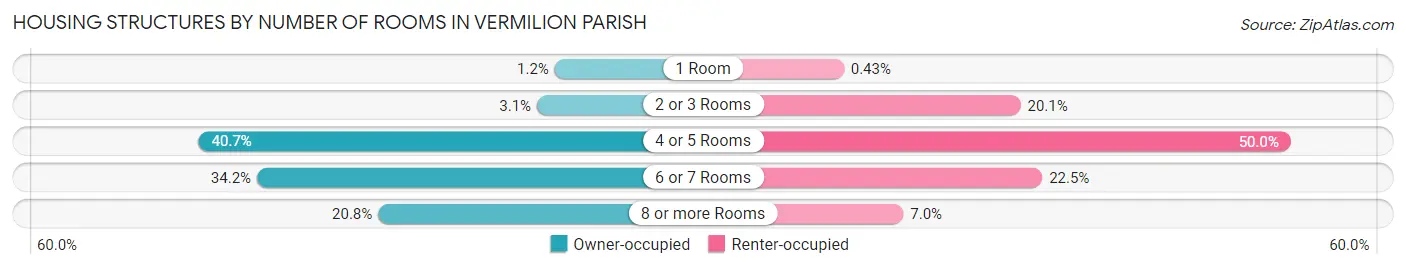
| Number of Rooms | Owner-occupied | Renter-occupied |
| 1 Room | 195 (1.2%) | 22 (0.4%) |
| 2 or 3 Rooms | 521 (3.1%) | 1,023 (20.1%) |
| 4 or 5 Rooms | 6,757 (40.7%) | 2,552 (50.0%) |
| 6 or 7 Rooms | 5,682 (34.2%) | 1,145 (22.5%) |
| 8 or more Rooms | 3,448 (20.8%) | 359 (7.0%) |
| Total | 16,603 (100.0%) | 5,101 (100.0%) |
Housing Structure by Heating Type in Vermilion Parish
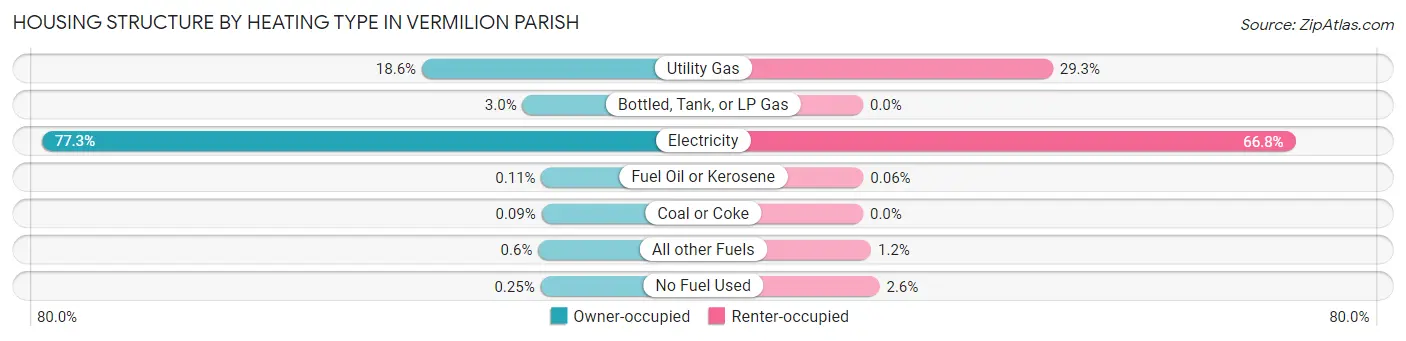
| Heating Type | Owner-occupied | Renter-occupied |
| Utility Gas | 3,085 (18.6%) | 1,496 (29.3%) |
| Bottled, Tank, or LP Gas | 503 (3.0%) | 0 (0.0%) |
| Electricity | 12,841 (77.3%) | 3,409 (66.8%) |
| Fuel Oil or Kerosene | 18 (0.1%) | 3 (0.1%) |
| Coal or Coke | 15 (0.1%) | 0 (0.0%) |
| All other Fuels | 100 (0.6%) | 63 (1.2%) |
| No Fuel Used | 41 (0.3%) | 130 (2.5%) |
| Total | 16,603 (100.0%) | 5,101 (100.0%) |
Household Vehicle Usage in Vermilion Parish
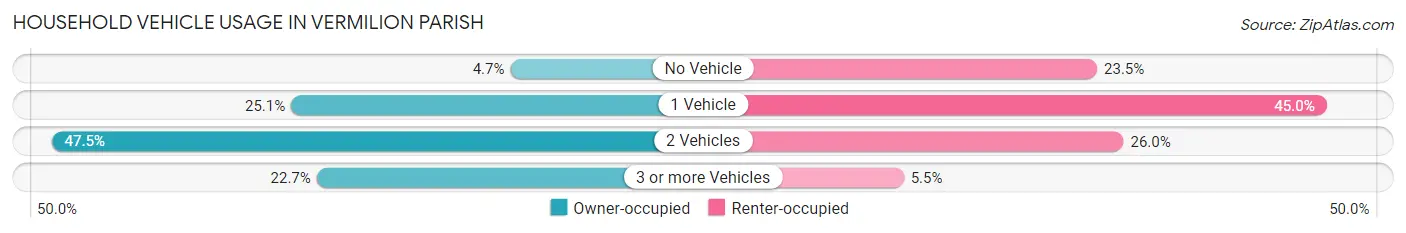
| Vehicles per Household | Owner-occupied | Renter-occupied |
| No Vehicle | 774 (4.7%) | 1,201 (23.5%) |
| 1 Vehicle | 4,172 (25.1%) | 2,293 (45.0%) |
| 2 Vehicles | 7,882 (47.5%) | 1,327 (26.0%) |
| 3 or more Vehicles | 3,775 (22.7%) | 280 (5.5%) |
| Total | 16,603 (100.0%) | 5,101 (100.0%) |
Real Estate & Mortgages in Vermilion Parish
Real Estate and Mortgage Overview in Vermilion Parish
| Characteristic | Without Mortgage | With Mortgage |
| Housing Units | 9,852 | 6,751 |
| Median Property Value | $109,800 | $205,400 |
| Median Household Income | $53,352 | $1,222 |
| Monthly Housing Costs | $319 | $158 |
| Real Estate Taxes | $303 | $1,250 |
Property Value by Mortgage Status in Vermilion Parish
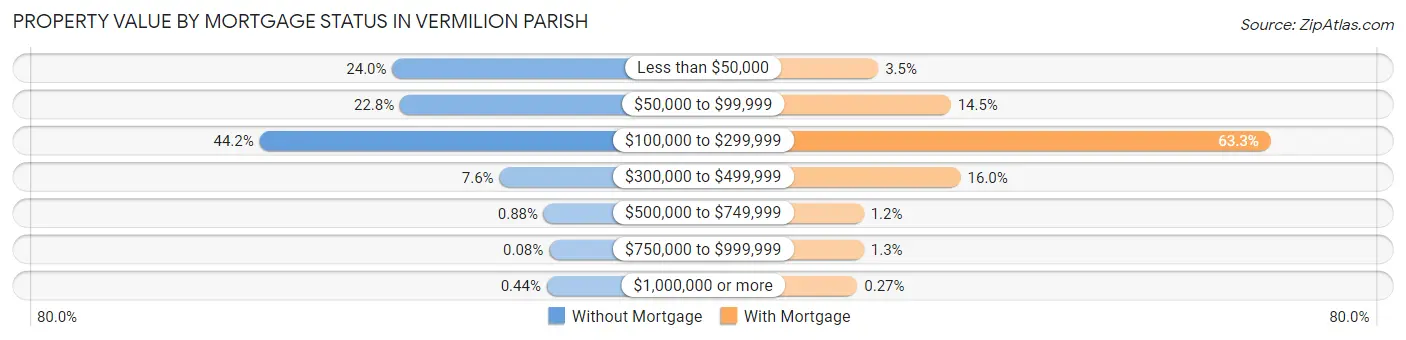
| Property Value | Without Mortgage | With Mortgage |
| Less than $50,000 | 2,361 (24.0%) | 233 (3.5%) |
| $50,000 to $99,999 | 2,245 (22.8%) | 979 (14.5%) |
| $100,000 to $299,999 | 4,355 (44.2%) | 4,270 (63.2%) |
| $300,000 to $499,999 | 753 (7.6%) | 1,081 (16.0%) |
| $500,000 to $749,999 | 87 (0.9%) | 84 (1.2%) |
| $750,000 to $999,999 | 8 (0.1%) | 86 (1.3%) |
| $1,000,000 or more | 43 (0.4%) | 18 (0.3%) |
| Total | 9,852 (100.0%) | 6,751 (100.0%) |
Household Income by Mortgage Status in Vermilion Parish
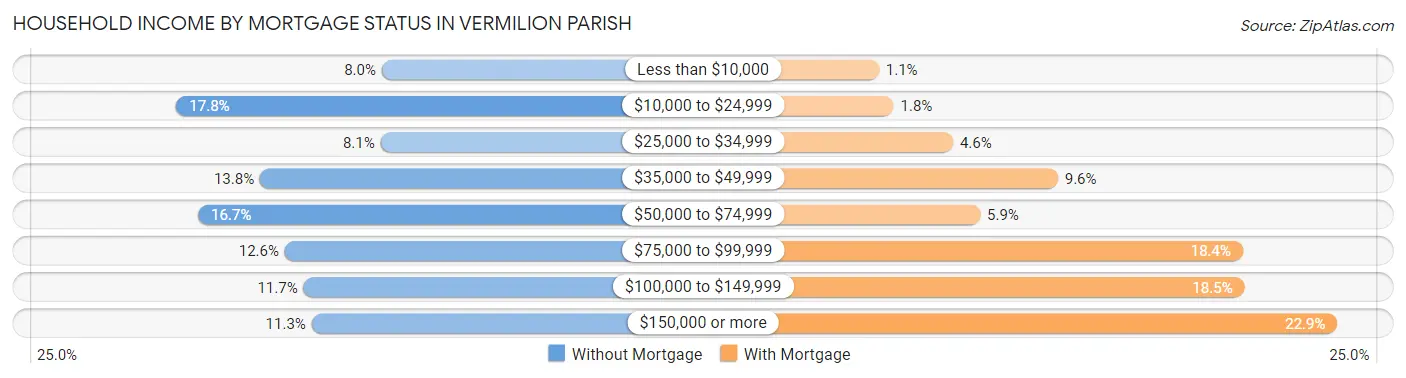
| Household Income | Without Mortgage | With Mortgage |
| Less than $10,000 | 787 (8.0%) | 75 (1.1%) |
| $10,000 to $24,999 | 1,751 (17.8%) | 122 (1.8%) |
| $25,000 to $34,999 | 793 (8.1%) | 313 (4.6%) |
| $35,000 to $49,999 | 1,359 (13.8%) | 650 (9.6%) |
| $50,000 to $74,999 | 1,649 (16.7%) | 400 (5.9%) |
| $75,000 to $99,999 | 1,242 (12.6%) | 1,245 (18.4%) |
| $100,000 to $149,999 | 1,155 (11.7%) | 1,250 (18.5%) |
| $150,000 or more | 1,116 (11.3%) | 1,549 (22.9%) |
| Total | 9,852 (100.0%) | 6,751 (100.0%) |
Property Value to Household Income Ratio in Vermilion Parish
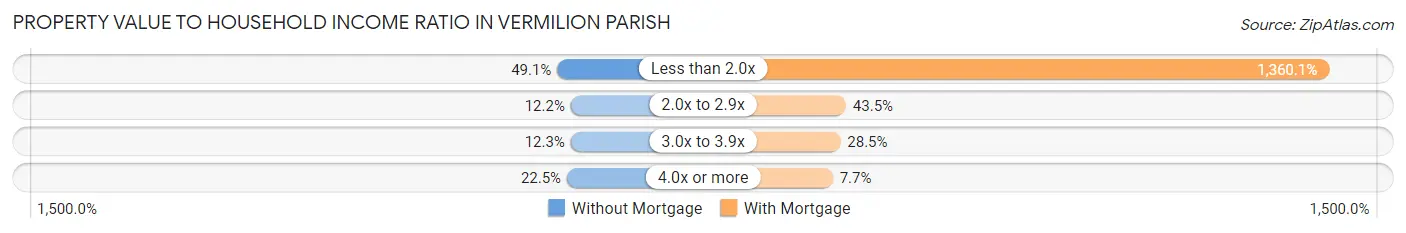
| Value-to-Income Ratio | Without Mortgage | With Mortgage |
| Less than 2.0x | 4,834 (49.1%) | 91,821 (1,360.1%) |
| 2.0x to 2.9x | 1,205 (12.2%) | 2,936 (43.5%) |
| 3.0x to 3.9x | 1,215 (12.3%) | 1,925 (28.5%) |
| 4.0x or more | 2,219 (22.5%) | 520 (7.7%) |
| Total | 9,852 (100.0%) | 6,751 (100.0%) |
Real Estate Taxes by Mortgage Status in Vermilion Parish
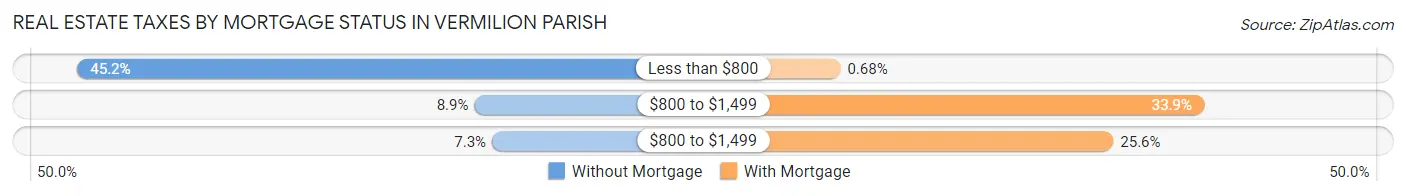
| Property Taxes | Without Mortgage | With Mortgage |
| Less than $800 | 4,451 (45.2%) | 46 (0.7%) |
| $800 to $1,499 | 880 (8.9%) | 2,286 (33.9%) |
| $800 to $1,499 | 721 (7.3%) | 1,728 (25.6%) |
| Total | 9,852 (100.0%) | 6,751 (100.0%) |
Health & Disability in Vermilion Parish
Health Insurance Coverage by Age in Vermilion Parish
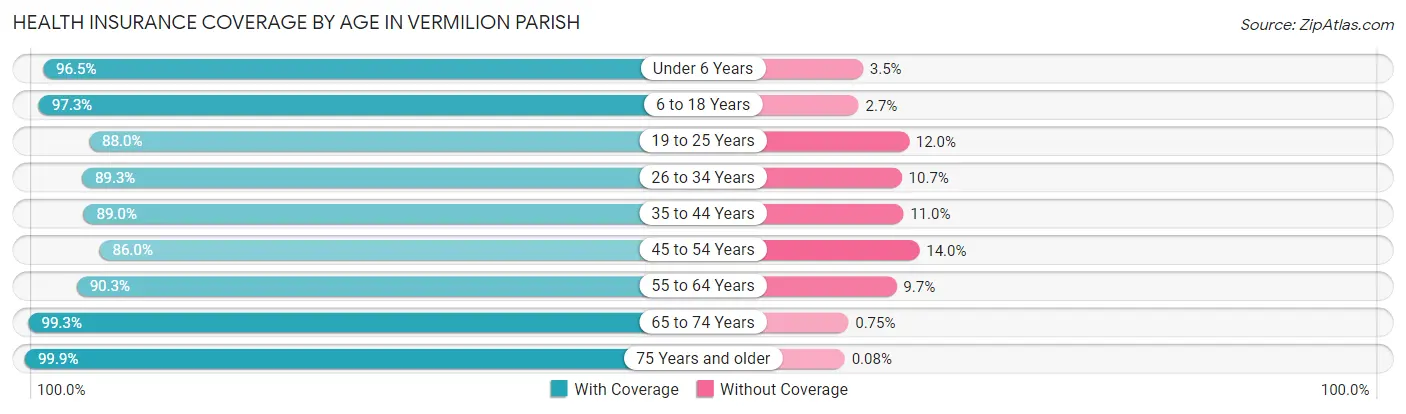
| Age Bracket | With Coverage | Without Coverage |
| Under 6 Years | 4,182 (96.5%) | 150 (3.5%) |
| 6 to 18 Years | 10,413 (97.3%) | 286 (2.7%) |
| 19 to 25 Years | 4,013 (88.0%) | 549 (12.0%) |
| 26 to 34 Years | 5,774 (89.3%) | 692 (10.7%) |
| 35 to 44 Years | 6,334 (89.0%) | 783 (11.0%) |
| 45 to 54 Years | 5,927 (86.0%) | 963 (14.0%) |
| 55 to 64 Years | 6,986 (90.3%) | 752 (9.7%) |
| 65 to 74 Years | 5,143 (99.3%) | 39 (0.7%) |
| 75 Years and older | 3,530 (99.9%) | 3 (0.1%) |
| Total | 52,302 (92.5%) | 4,217 (7.5%) |
Health Insurance Coverage by Citizenship Status in Vermilion Parish
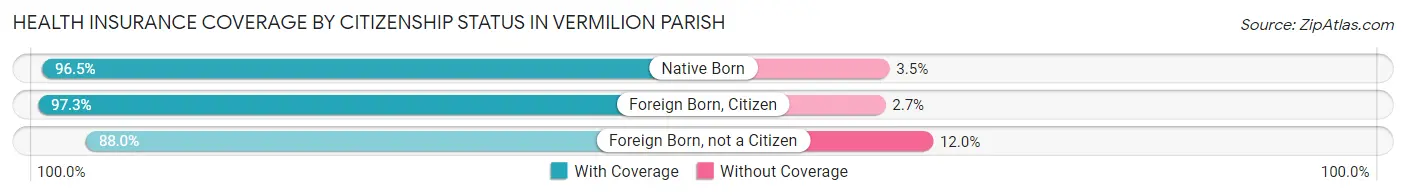
| Citizenship Status | With Coverage | Without Coverage |
| Native Born | 4,182 (96.5%) | 150 (3.5%) |
| Foreign Born, Citizen | 10,413 (97.3%) | 286 (2.7%) |
| Foreign Born, not a Citizen | 4,013 (88.0%) | 549 (12.0%) |
Health Insurance Coverage by Household Income in Vermilion Parish
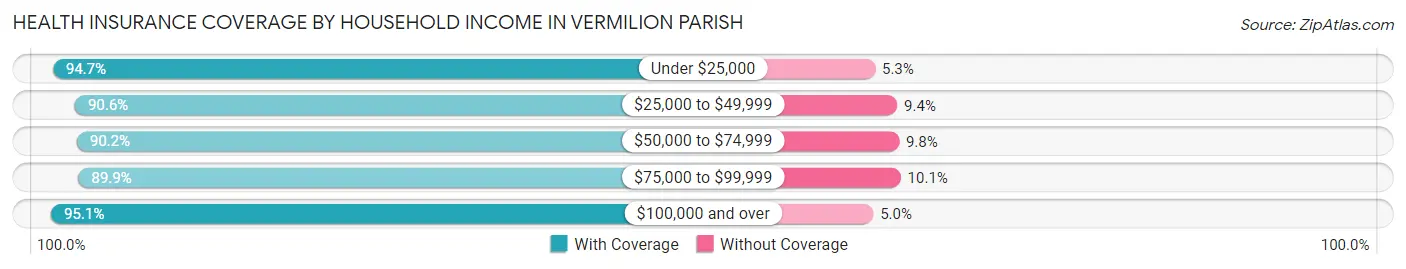
| Household Income | With Coverage | Without Coverage |
| Under $25,000 | 9,695 (94.7%) | 542 (5.3%) |
| $25,000 to $49,999 | 10,254 (90.6%) | 1,069 (9.4%) |
| $50,000 to $74,999 | 8,467 (90.2%) | 918 (9.8%) |
| $75,000 to $99,999 | 7,412 (89.9%) | 832 (10.1%) |
| $100,000 and over | 16,418 (95.1%) | 855 (5.0%) |
Public vs Private Health Insurance Coverage by Age in Vermilion Parish
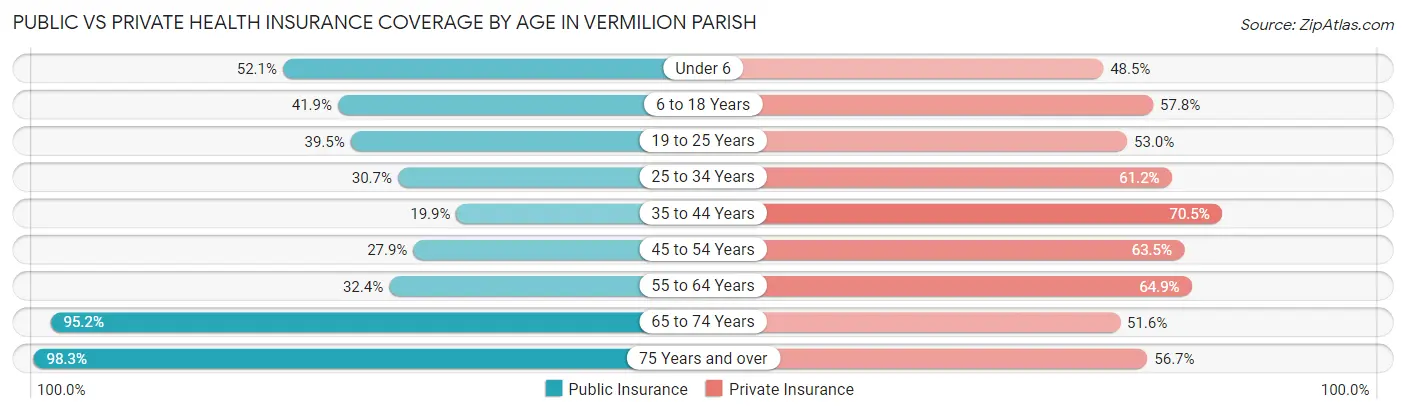
| Age Bracket | Public Insurance | Private Insurance |
| Under 6 | 2,256 (52.1%) | 2,102 (48.5%) |
| 6 to 18 Years | 4,480 (41.9%) | 6,183 (57.8%) |
| 19 to 25 Years | 1,802 (39.5%) | 2,416 (53.0%) |
| 25 to 34 Years | 1,987 (30.7%) | 3,955 (61.2%) |
| 35 to 44 Years | 1,414 (19.9%) | 5,016 (70.5%) |
| 45 to 54 Years | 1,920 (27.9%) | 4,373 (63.5%) |
| 55 to 64 Years | 2,504 (32.4%) | 5,021 (64.9%) |
| 65 to 74 Years | 4,933 (95.2%) | 2,676 (51.6%) |
| 75 Years and over | 3,474 (98.3%) | 2,004 (56.7%) |
| Total | 24,770 (43.8%) | 33,746 (59.7%) |
Disability Status by Sex by Age in Vermilion Parish
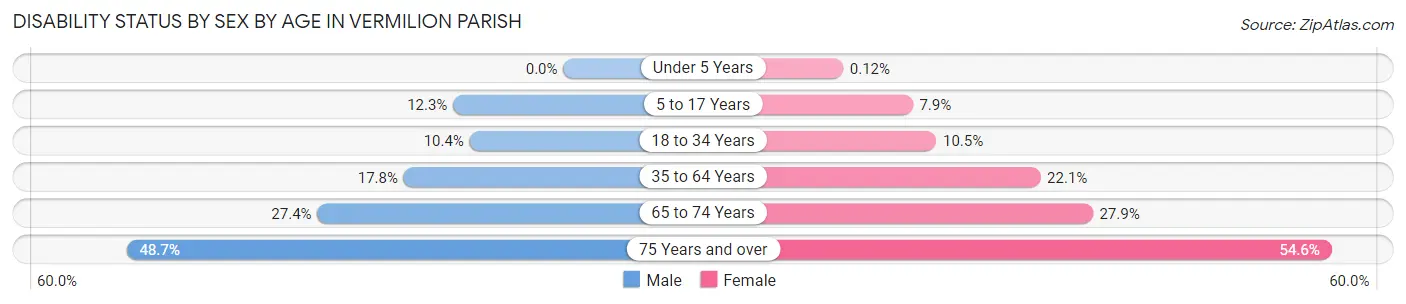
| Age Bracket | Male | Female |
| Under 5 Years | 0 (0.0%) | 2 (0.1%) |
| 5 to 17 Years | 665 (12.3%) | 421 (7.9%) |
| 18 to 34 Years | 593 (10.4%) | 630 (10.5%) |
| 35 to 64 Years | 1,883 (17.8%) | 2,463 (22.1%) |
| 65 to 74 Years | 660 (27.4%) | 774 (27.9%) |
| 75 Years and over | 720 (48.6%) | 1,120 (54.5%) |
Disability Class by Sex by Age in Vermilion Parish
Disability Class: Hearing Difficulty
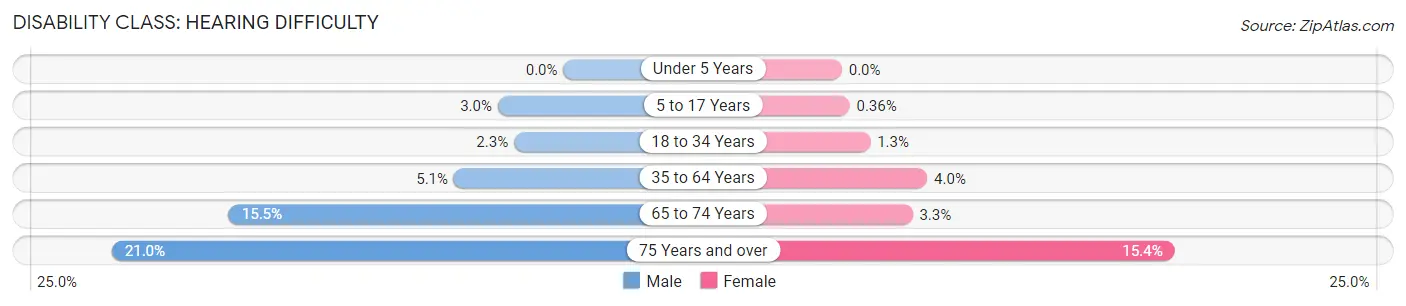
| Age Bracket | Male | Female |
| Under 5 Years | 0 (0.0%) | 0 (0.0%) |
| 5 to 17 Years | 165 (3.0%) | 19 (0.4%) |
| 18 to 34 Years | 130 (2.3%) | 79 (1.3%) |
| 35 to 64 Years | 538 (5.1%) | 442 (4.0%) |
| 65 to 74 Years | 374 (15.5%) | 91 (3.3%) |
| 75 Years and over | 310 (20.9%) | 317 (15.4%) |
Disability Class: Vision Difficulty
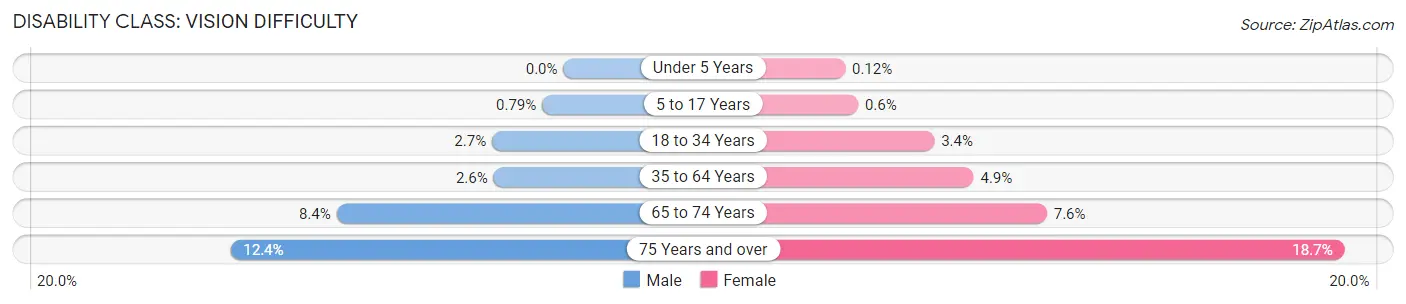
| Age Bracket | Male | Female |
| Under 5 Years | 0 (0.0%) | 2 (0.1%) |
| 5 to 17 Years | 43 (0.8%) | 32 (0.6%) |
| 18 to 34 Years | 151 (2.6%) | 206 (3.4%) |
| 35 to 64 Years | 274 (2.6%) | 545 (4.9%) |
| 65 to 74 Years | 203 (8.4%) | 211 (7.6%) |
| 75 Years and over | 183 (12.4%) | 383 (18.7%) |
Disability Class: Cognitive Difficulty
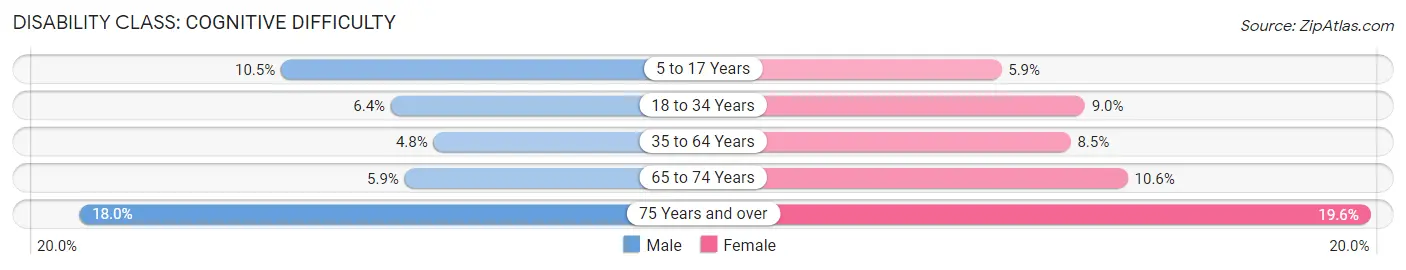
| Age Bracket | Male | Female |
| 5 to 17 Years | 568 (10.5%) | 317 (5.9%) |
| 18 to 34 Years | 364 (6.4%) | 541 (9.0%) |
| 35 to 64 Years | 511 (4.8%) | 946 (8.5%) |
| 65 to 74 Years | 142 (5.9%) | 294 (10.6%) |
| 75 Years and over | 266 (18.0%) | 403 (19.6%) |
Disability Class: Ambulatory Difficulty
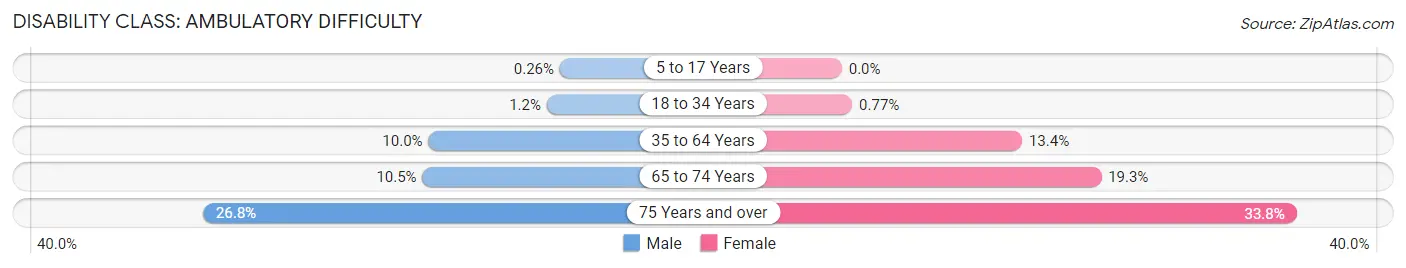
| Age Bracket | Male | Female |
| 5 to 17 Years | 14 (0.3%) | 0 (0.0%) |
| 18 to 34 Years | 70 (1.2%) | 46 (0.8%) |
| 35 to 64 Years | 1,062 (10.0%) | 1,492 (13.4%) |
| 65 to 74 Years | 252 (10.5%) | 534 (19.3%) |
| 75 Years and over | 396 (26.8%) | 693 (33.8%) |
Disability Class: Self-Care Difficulty
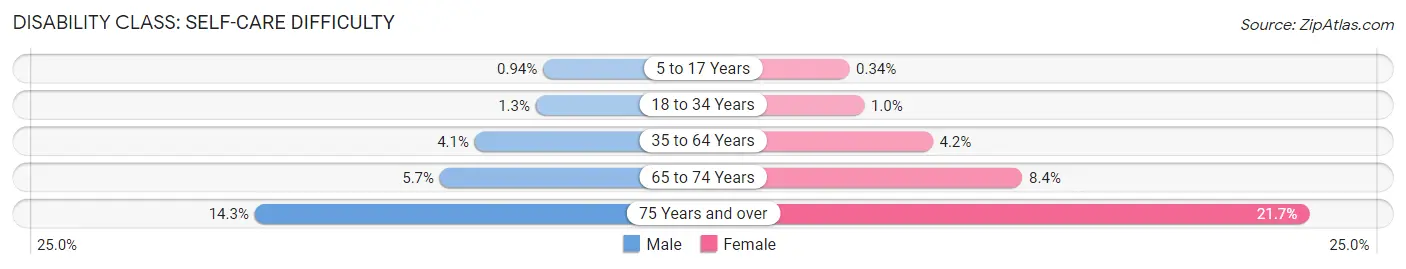
| Age Bracket | Male | Female |
| 5 to 17 Years | 51 (0.9%) | 18 (0.3%) |
| 18 to 34 Years | 73 (1.3%) | 62 (1.0%) |
| 35 to 64 Years | 436 (4.1%) | 469 (4.2%) |
| 65 to 74 Years | 138 (5.7%) | 232 (8.4%) |
| 75 Years and over | 212 (14.3%) | 445 (21.7%) |
Technology Access in Vermilion Parish
Computing Device Access in Vermilion Parish
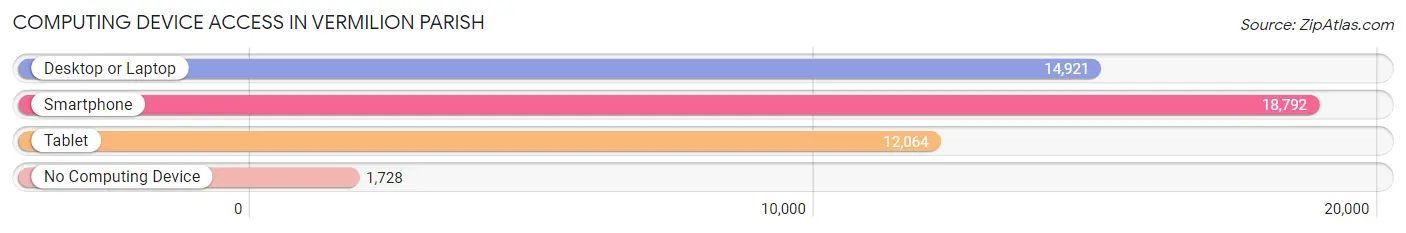
| Device Type | # Households | % Households |
| Desktop or Laptop | 14,921 | 68.8% |
| Smartphone | 18,792 | 86.6% |
| Tablet | 12,064 | 55.6% |
| No Computing Device | 1,728 | 8.0% |
| Total | 21,704 | 100.0% |
Internet Access in Vermilion Parish
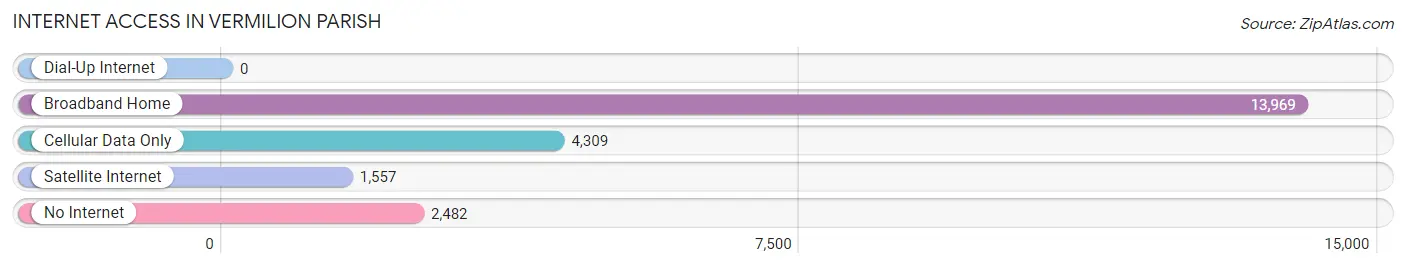
| Internet Type | # Households | % Households |
| Dial-Up Internet | 0 | 0.0% |
| Broadband Home | 13,969 | 64.4% |
| Cellular Data Only | 4,309 | 19.9% |
| Satellite Internet | 1,557 | 7.2% |
| No Internet | 2,482 | 11.4% |
| Total | 21,704 | 100.0% |
Vermilion Parish Summary
Vermilion Parish is a parish located in the southwestern part of the state of Louisiana. It is bordered by the parishes of Acadia, Iberia, St. Martin, Lafayette, and Cameron. The parish seat is Abbeville, and the largest city is Lafayette. The population of Vermilion Parish was 57,999 in the 2010 census, making it the fourth most populous parish in Louisiana.
Geography
Vermilion Parish is located in the southwestern part of Louisiana, and is bordered by the parishes of Acadia, Iberia, St. Martin, Lafayette, and Cameron. The parish covers an area of 1,541 square miles, making it the fifth largest parish in the state. The terrain is mostly flat, with some rolling hills in the northern part of the parish. The Vermilion River runs through the parish, and is a major source of recreation and fishing.
The climate of Vermilion Parish is humid subtropical, with hot, humid summers and mild winters. The average annual temperature is 68°F, and the average annual precipitation is 56 inches.
Demographics
As of the 2010 census, there were 57,999 people, 20,845 households, and 15,072 families residing in Vermilion Parish. The population density was 38.2 people per square mile. The racial makeup of the parish was 79.2% White, 17.7% African American, 0.5% Native American, 0.7% Asian, 0.1% Pacific Islander, 0.7% from other races, and 1.2% from two or more races. Hispanic or Latino of any race were 2.7% of the population.
The median income for a household in Vermilion Parish was $41,945, and the median income for a family was $50,945. The per capita income for the parish was $20,845. About 17.2% of families and 20.7% of the population were below the poverty line, including 28.2% of those under age 18 and 14.2% of those age 65 or over.
Economy
Vermilion Parish has a diverse economy, with a mix of agriculture, manufacturing, and services. The largest industries in the parish are oil and gas, manufacturing, and tourism.
Agriculture is a major part of the economy in Vermilion Parish. The parish is home to a variety of crops, including rice, soybeans, corn, and sugarcane. The parish is also home to a large number of cattle and poultry farms.
Manufacturing is also an important part of the economy in Vermilion Parish. The parish is home to a number of manufacturing plants, including oil and gas refineries, chemical plants, and food processing plants.
Tourism is also an important part of the economy in Vermilion Parish. The parish is home to a number of attractions, including the Vermilionville Living History Museum, the Tabasco Factory, and the Jean Lafitte National Historical Park and Preserve.
Conclusion
Vermilion Parish is a parish located in the southwestern part of the state of Louisiana. It is bordered by the parishes of Acadia, Iberia, St. Martin, Lafayette, and Cameron. The parish has a population of 57,999, and has a diverse economy, with a mix of agriculture, manufacturing, and services. The largest industries in the parish are oil and gas, manufacturing, and tourism. The parish is also home to a number of attractions, including the Vermilionville Living History Museum, the Tabasco Factory, and the Jean Lafitte National Historical Park and Preserve.
Common Questions
What is the Total Population of Vermilion Parish?
Total Population of Vermilion Parish is 57,202.
What is the Total Male Population of Vermilion Parish?
Total Male Population of Vermilion Parish is 27,840.
What is the Total Female Population of Vermilion Parish?
Total Female Population of Vermilion Parish is 29,362.
What is the Ratio of Males per 100 Females in Vermilion Parish?
There are 94.82 Males per 100 Females in Vermilion Parish.
What is the Ratio of Females per 100 Males in Vermilion Parish?
There are 105.47 Females per 100 Males in Vermilion Parish.
What is the Median Population Age in Vermilion Parish?
Median Population Age in Vermilion Parish is 38.6 Years.
What is the Average Family Size in Vermilion Parish
Average Family Size in Vermilion Parish is 3.1 People.
What is the Average Household Size in Vermilion Parish
Average Household Size in Vermilion Parish is 2.6 People.
What is Per Capita Income in Vermilion Parish?
Per Capita income in Vermilion Parish is $29,293.
What is the Median Family Income in Vermilion Parish?
Median Family Income in Vermilion Parish is $70,308.
What is the Median Household income in Vermilion Parish?
Median Household Income in Vermilion Parish is $56,194.
What is Income or Wage Gap in Vermilion Parish?
Income or Wage Gap in Vermilion Parish is 49.7%.
Women in Vermilion Parish earn 50.3 cents for every dollar earned by a man.
What is Family Income Deficit in Vermilion Parish?
Family Income Deficit in Vermilion Parish is $10,240.
Families that are below poverty line in Vermilion Parish earn $10,240 less on average than the poverty threshold level.
What is Inequality or Gini Index in Vermilion Parish?
Inequality or Gini Index in Vermilion Parish is 0.47.
How Large is the Labor Force in Vermilion Parish?
There are 24,735 People in the Labor Forcein in Vermilion Parish.
What is the Percentage of People in the Labor Force in Vermilion Parish?
55.6% of People are in the Labor Force in Vermilion Parish.
What is the Unemployment Rate in Vermilion Parish?
Unemployment Rate in Vermilion Parish is 6.2%.