Terrebonne Parish, LA
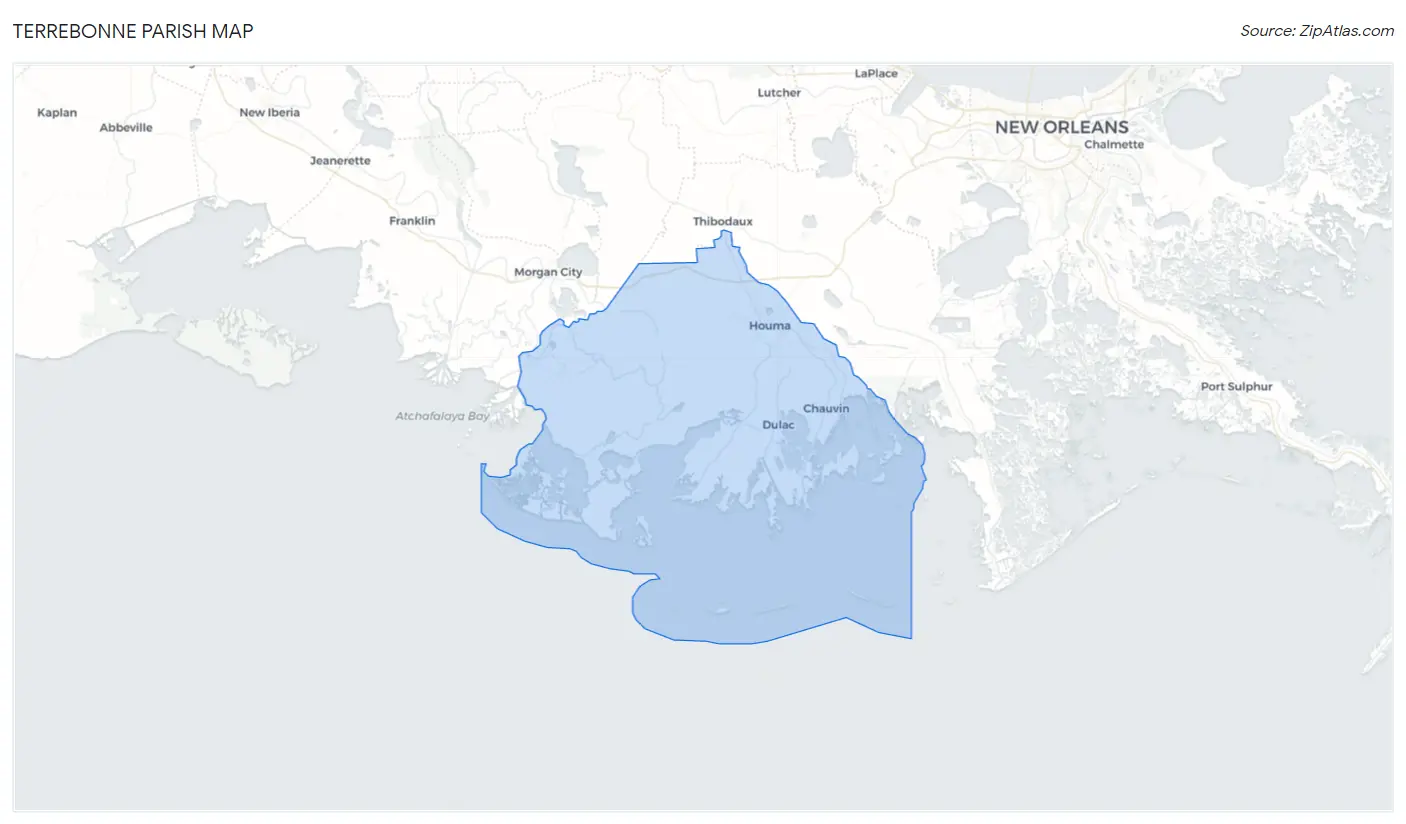
Terrebonne Parish Map
Terrebonne Parish Overview
108,862
TOTAL POPULATION
53,934
MALE POPULATION
54,928
FEMALE POPULATION
98.19
MALES / 100 FEMALES
101.84
FEMALES / 100 MALES
36.9
MEDIAN AGE
3.1
AVG FAMILY SIZE
2.6
AVG HOUSEHOLD SIZE
$32,143
PER CAPITA INCOME
$72,340
AVG FAMILY INCOME
$63,088
AVG HOUSEHOLD INCOME
48.6%
WAGE / INCOME GAP [ % ]
51.4¢/ $1
WAGE / INCOME GAP [ $ ]
$9,041
FAMILY INCOME DEFICIT
0.47
INEQUALITY / GINI INDEX
50,267
LABOR FORCE [ PEOPLE ]
59.3%
PERCENT IN LABOR FORCE
5.9%
UNEMPLOYMENT RATE
Terrebonne Parish Area Codes
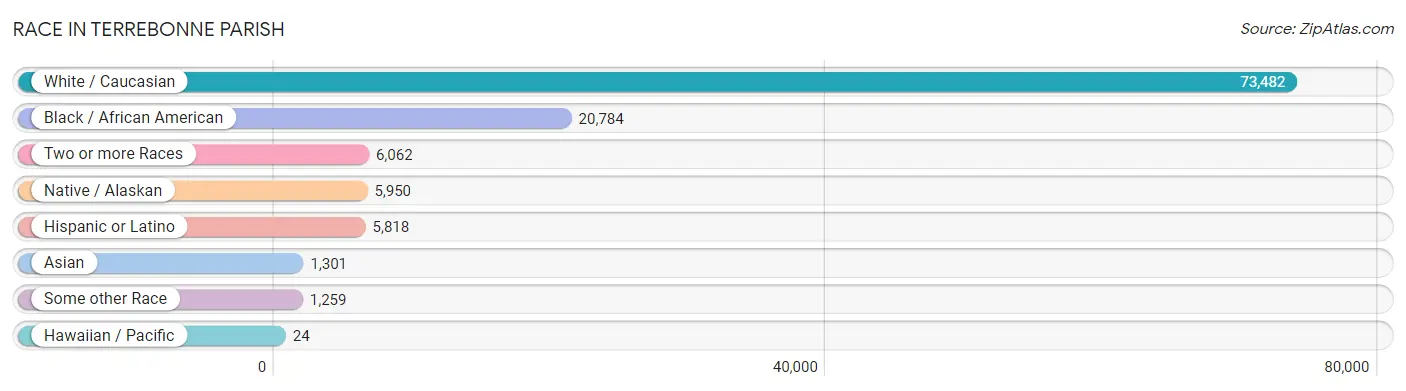
Race in Terrebonne Parish
The most populous races in Terrebonne Parish are White / Caucasian (73,482 | 67.5%), Black / African American (20,784 | 19.1%), and Two or more Races (6,062 | 5.6%).
| Race | # Population | % Population |
| Asian | 1,301 | 1.2% |
| Black / African American | 20,784 | 19.1% |
| Hawaiian / Pacific | 24 | 0.0% |
| Hispanic or Latino | 5,818 | 5.3% |
| Native / Alaskan | 5,950 | 5.5% |
| White / Caucasian | 73,482 | 67.5% |
| Two or more Races | 6,062 | 5.6% |
| Some other Race | 1,259 | 1.2% |
| Total | 108,862 | 100.0% |
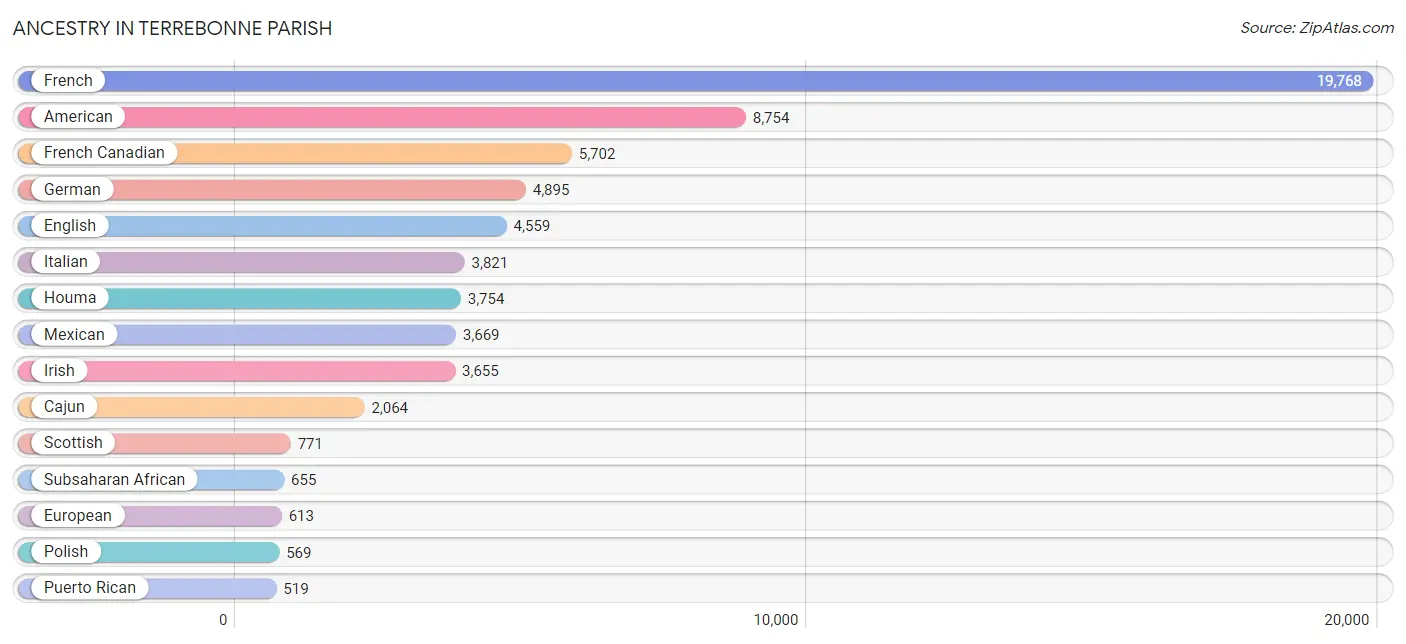
Ancestry in Terrebonne Parish
The most populous ancestries reported in Terrebonne Parish are French (19,768 | 18.2%), American (8,754 | 8.0%), French Canadian (5,702 | 5.2%), German (4,895 | 4.5%), and English (4,559 | 4.2%), together accounting for 40.1% of all Terrebonne Parish residents.
| Ancestry | # Population | % Population |
| African | 479 | 0.4% |
| Albanian | 29 | 0.0% |
| American | 8,754 | 8.0% |
| Arab | 317 | 0.3% |
| Armenian | 17 | 0.0% |
| Australian | 44 | 0.0% |
| Austrian | 19 | 0.0% |
| Belgian | 33 | 0.0% |
| Bhutanese | 69 | 0.1% |
| Blackfeet | 23 | 0.0% |
| Brazilian | 146 | 0.1% |
| British | 196 | 0.2% |
| Burmese | 125 | 0.1% |
| Cajun | 2,064 | 1.9% |
| Canadian | 138 | 0.1% |
| Central American | 500 | 0.5% |
| Central American Indian | 160 | 0.2% |
| Cherokee | 66 | 0.1% |
| Choctaw | 152 | 0.1% |
| Colombian | 11 | 0.0% |
| Costa Rican | 45 | 0.0% |
| Creek | 24 | 0.0% |
| Croatian | 66 | 0.1% |
| Cuban | 62 | 0.1% |
| Czech | 41 | 0.0% |
| Czechoslovakian | 155 | 0.1% |
| Danish | 39 | 0.0% |
| Dominican | 40 | 0.0% |
| Dutch | 78 | 0.1% |
| Eastern European | 118 | 0.1% |
| Ecuadorian | 40 | 0.0% |
| English | 4,559 | 4.2% |
| European | 613 | 0.6% |
| French | 19,768 | 18.2% |
| French American Indian | 50 | 0.1% |
| French Canadian | 5,702 | 5.2% |
| German | 4,895 | 4.5% |
| Greek | 53 | 0.1% |
| Guamanian / Chamorro | 6 | 0.0% |
| Guatemalan | 126 | 0.1% |
| Honduran | 131 | 0.1% |
| Houma | 3,754 | 3.5% |
| Hungarian | 10 | 0.0% |
| Indian (Asian) | 447 | 0.4% |
| Iranian | 68 | 0.1% |
| Irish | 3,655 | 3.4% |
| Italian | 3,821 | 3.5% |
| Jamaican | 81 | 0.1% |
| Jordanian | 268 | 0.3% |
| Kenyan | 122 | 0.1% |
| Korean | 223 | 0.2% |
| Laotian | 8 | 0.0% |
| Lebanese | 36 | 0.0% |
| Lithuanian | 12 | 0.0% |
| Mexican | 3,669 | 3.4% |
| Mexican American Indian | 167 | 0.2% |
| Native Hawaiian | 18 | 0.0% |
| Navajo | 67 | 0.1% |
| Nicaraguan | 97 | 0.1% |
| Northern European | 72 | 0.1% |
| Norwegian | 201 | 0.2% |
| Pakistani | 83 | 0.1% |
| Peruvian | 23 | 0.0% |
| Polish | 569 | 0.5% |
| Portuguese | 76 | 0.1% |
| Puerto Rican | 519 | 0.5% |
| Russian | 54 | 0.1% |
| Salvadoran | 101 | 0.1% |
| Scandinavian | 88 | 0.1% |
| Scotch-Irish | 412 | 0.4% |
| Scottish | 771 | 0.7% |
| Sioux | 17 | 0.0% |
| Slovene | 14 | 0.0% |
| South American | 100 | 0.1% |
| Spaniard | 233 | 0.2% |
| Spanish | 445 | 0.4% |
| Spanish American | 49 | 0.1% |
| Sri Lankan | 287 | 0.3% |
| Subsaharan African | 655 | 0.6% |
| Swedish | 89 | 0.1% |
| Swiss | 10 | 0.0% |
| Thai | 215 | 0.2% |
| Ukrainian | 18 | 0.0% |
| Uruguayan | 2 | 0.0% |
| Venezuelan | 24 | 0.0% |
| Welsh | 41 | 0.0% | View All 86 Rows |
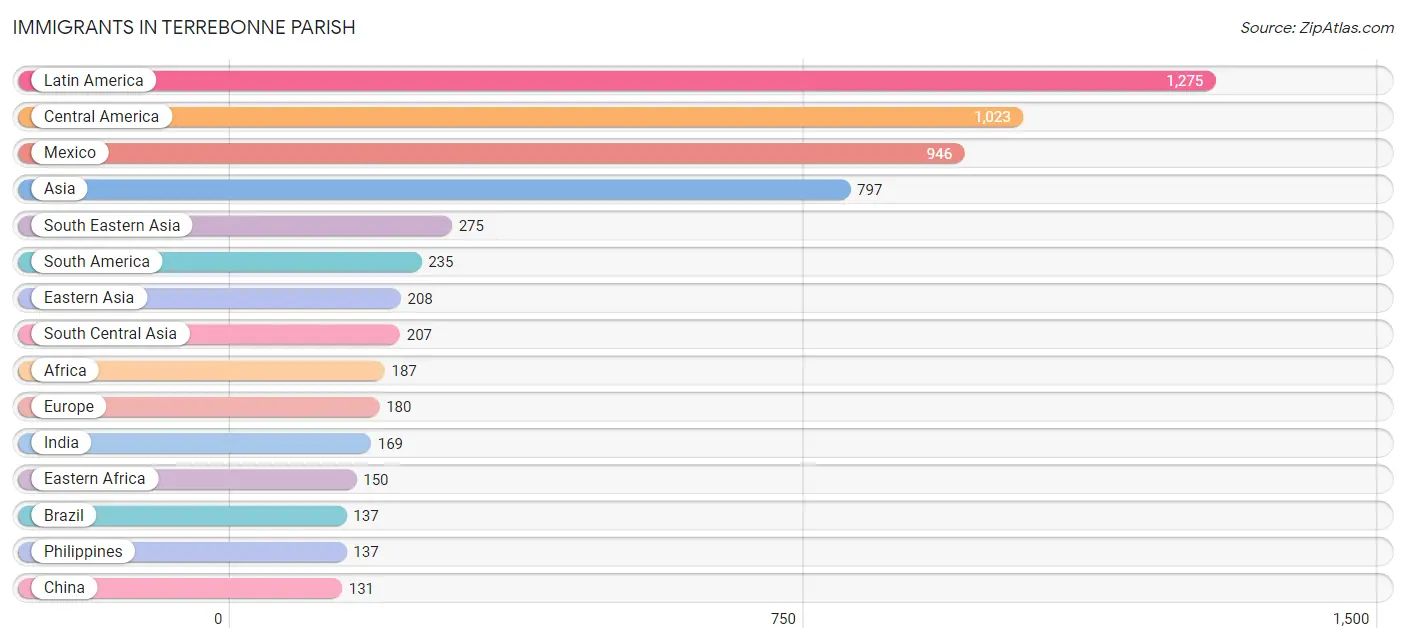
Immigrants in Terrebonne Parish
The most numerous immigrant groups reported in Terrebonne Parish came from Latin America (1,275 | 1.2%), Central America (1,023 | 0.9%), Mexico (946 | 0.9%), Asia (797 | 0.7%), and South Eastern Asia (275 | 0.3%), together accounting for 4.0% of all Terrebonne Parish residents.
| Immigration Origin | # Population | % Population |
| Africa | 187 | 0.2% |
| Asia | 797 | 0.7% |
| Brazil | 137 | 0.1% |
| Canada | 38 | 0.0% |
| Caribbean | 17 | 0.0% |
| Central America | 1,023 | 0.9% |
| China | 131 | 0.1% |
| Colombia | 35 | 0.0% |
| Cuba | 17 | 0.0% |
| Eastern Africa | 150 | 0.1% |
| Eastern Asia | 208 | 0.2% |
| Eastern Europe | 38 | 0.0% |
| Ecuador | 40 | 0.0% |
| England | 16 | 0.0% |
| Europe | 180 | 0.2% |
| France | 19 | 0.0% |
| Germany | 21 | 0.0% |
| Guatemala | 40 | 0.0% |
| Honduras | 12 | 0.0% |
| India | 169 | 0.2% |
| Indonesia | 8 | 0.0% |
| Ireland | 12 | 0.0% |
| Japan | 74 | 0.1% |
| Jordan | 87 | 0.1% |
| Kazakhstan | 10 | 0.0% |
| Kenya | 127 | 0.1% |
| Korea | 3 | 0.0% |
| Latin America | 1,275 | 1.2% |
| Mexico | 946 | 0.9% |
| Netherlands | 21 | 0.0% |
| Nicaragua | 25 | 0.0% |
| Northern Europe | 81 | 0.1% |
| Pakistan | 28 | 0.0% |
| Peru | 10 | 0.0% |
| Philippines | 137 | 0.1% |
| Saudi Arabia | 20 | 0.0% |
| Scotland | 30 | 0.0% |
| South America | 235 | 0.2% |
| South Central Asia | 207 | 0.2% |
| South Eastern Asia | 275 | 0.3% |
| Uganda | 23 | 0.0% |
| Uruguay | 2 | 0.0% |
| Venezuela | 11 | 0.0% |
| Vietnam | 130 | 0.1% |
| Western Africa | 37 | 0.0% |
| Western Asia | 107 | 0.1% |
| Western Europe | 61 | 0.1% | View All 47 Rows |
Sex and Age in Terrebonne Parish
Sex and Age in Terrebonne Parish
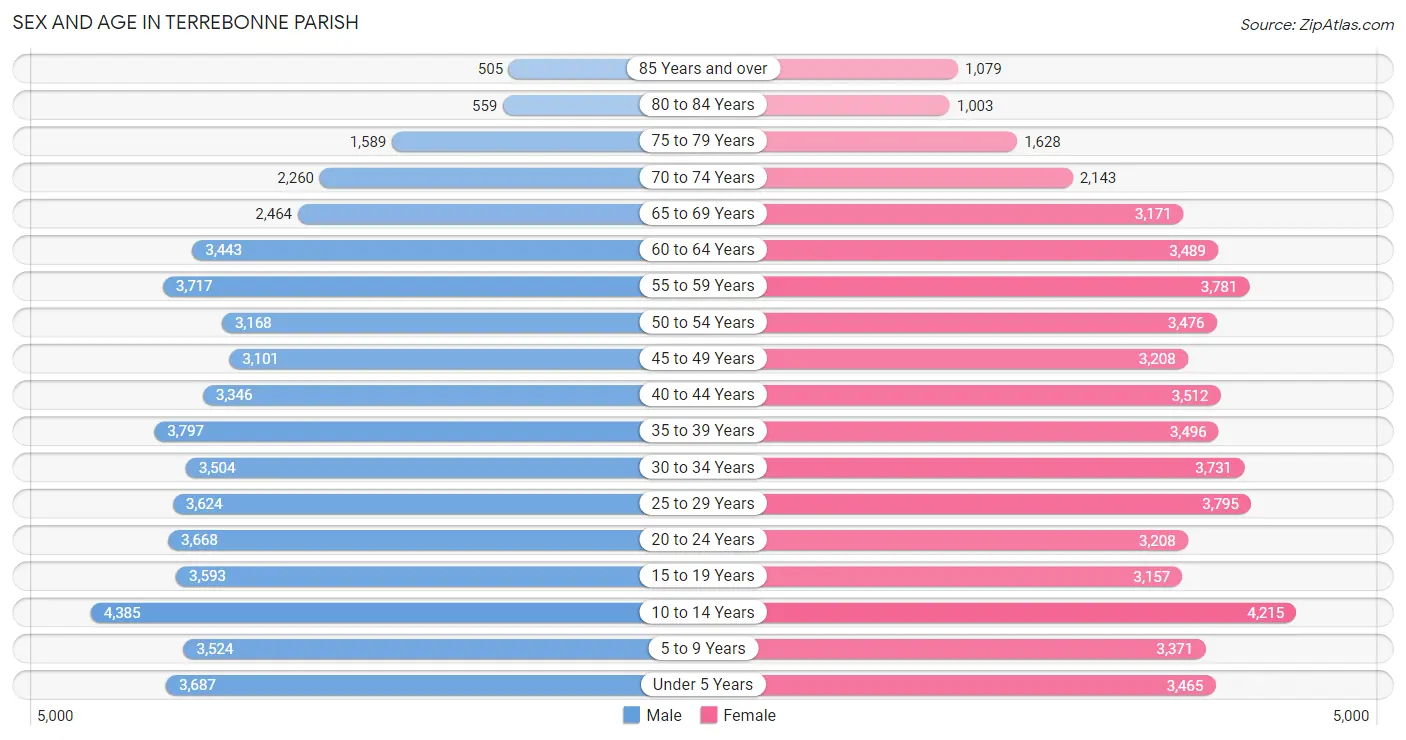
The most populous age groups in Terrebonne Parish are 10 to 14 Years (4,385 | 8.1%) for men and 10 to 14 Years (4,215 | 7.7%) for women.
| Age Bracket | Male | Female |
| Under 5 Years | 3,687 (6.8%) | 3,465 (6.3%) |
| 5 to 9 Years | 3,524 (6.5%) | 3,371 (6.1%) |
| 10 to 14 Years | 4,385 (8.1%) | 4,215 (7.7%) |
| 15 to 19 Years | 3,593 (6.7%) | 3,157 (5.8%) |
| 20 to 24 Years | 3,668 (6.8%) | 3,208 (5.8%) |
| 25 to 29 Years | 3,624 (6.7%) | 3,795 (6.9%) |
| 30 to 34 Years | 3,504 (6.5%) | 3,731 (6.8%) |
| 35 to 39 Years | 3,797 (7.0%) | 3,496 (6.4%) |
| 40 to 44 Years | 3,346 (6.2%) | 3,512 (6.4%) |
| 45 to 49 Years | 3,101 (5.8%) | 3,208 (5.8%) |
| 50 to 54 Years | 3,168 (5.9%) | 3,476 (6.3%) |
| 55 to 59 Years | 3,717 (6.9%) | 3,781 (6.9%) |
| 60 to 64 Years | 3,443 (6.4%) | 3,489 (6.4%) |
| 65 to 69 Years | 2,464 (4.6%) | 3,171 (5.8%) |
| 70 to 74 Years | 2,260 (4.2%) | 2,143 (3.9%) |
| 75 to 79 Years | 1,589 (2.9%) | 1,628 (3.0%) |
| 80 to 84 Years | 559 (1.0%) | 1,003 (1.8%) |
| 85 Years and over | 505 (0.9%) | 1,079 (2.0%) |
| Total | 53,934 (100.0%) | 54,928 (100.0%) |
Families and Households in Terrebonne Parish
Median Family Size in Terrebonne Parish
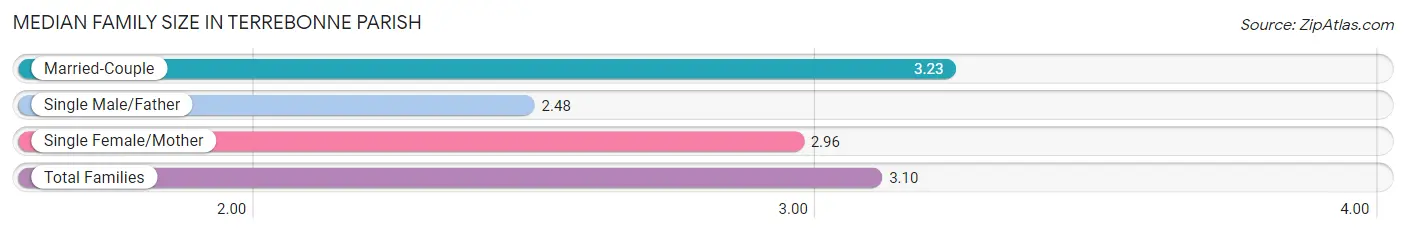
The median family size in Terrebonne Parish is 3.10 persons per family, with married-couple families (19,610 | 69.0%) accounting for the largest median family size of 3.23 persons per family. On the other hand, single male/father families (2,633 | 9.3%) represent the smallest median family size with 2.48 persons per family.
| Family Type | # Families | Family Size |
| Married-Couple | 19,610 (69.0%) | 3.23 |
| Single Male/Father | 2,633 (9.3%) | 2.48 |
| Single Female/Mother | 6,169 (21.7%) | 2.96 |
| Total Families | 28,412 (100.0%) | 3.10 |
Median Household Size in Terrebonne Parish
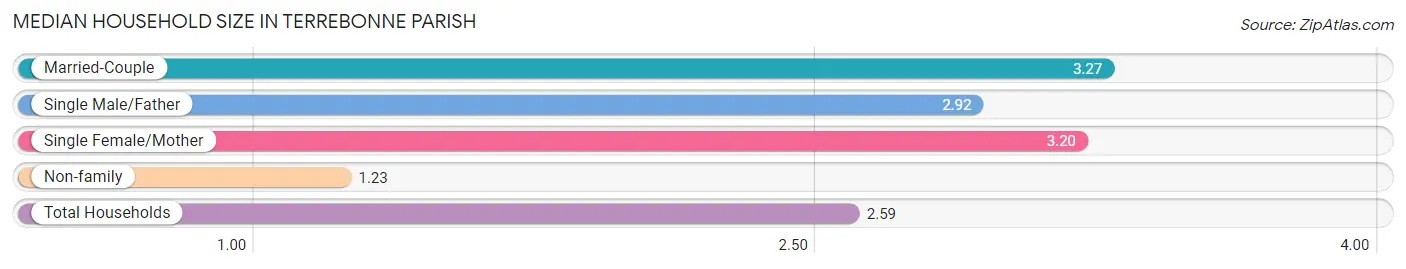
The median household size in Terrebonne Parish is 2.59 persons per household, with married-couple households (19,610 | 47.2%) accounting for the largest median household size of 3.27 persons per household. non-family households (13,093 | 31.6%) represent the smallest median household size with 1.23 persons per household.
| Household Type | # Households | Household Size |
| Married-Couple | 19,610 (47.2%) | 3.27 |
| Single Male/Father | 2,633 (6.3%) | 2.92 |
| Single Female/Mother | 6,169 (14.9%) | 3.20 |
| Non-family | 13,093 (31.6%) | 1.23 |
| Total Households | 41,505 (100.0%) | 2.59 |
Household Size by Marriage Status in Terrebonne Parish
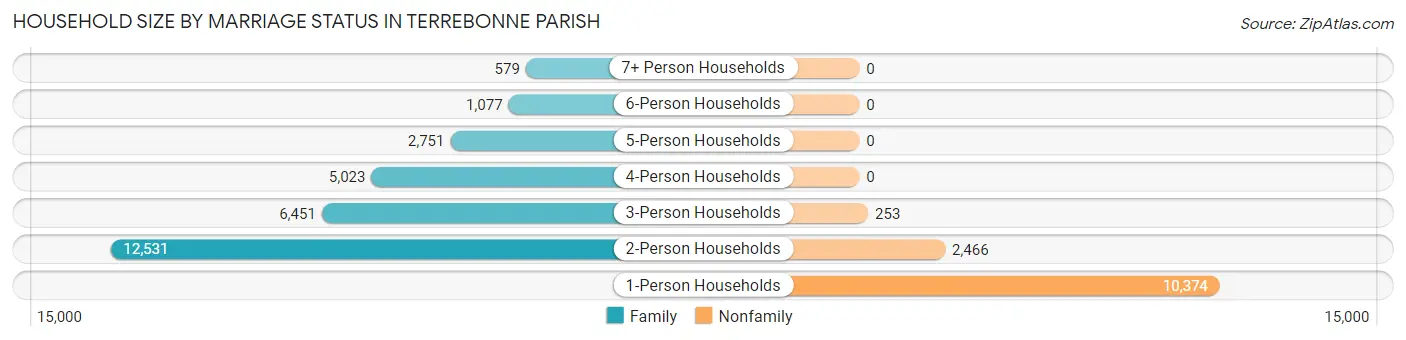
Out of a total of 41,505 households in Terrebonne Parish, 28,412 (68.4%) are family households, while 13,093 (31.6%) are nonfamily households. The most numerous type of family households are 2-person households, comprising 12,531, and the most common type of nonfamily households are 1-person households, comprising 10,374.
| Household Size | Family Households | Nonfamily Households |
| 1-Person Households | - | 10,374 (25.0%) |
| 2-Person Households | 12,531 (30.2%) | 2,466 (5.9%) |
| 3-Person Households | 6,451 (15.5%) | 253 (0.6%) |
| 4-Person Households | 5,023 (12.1%) | 0 (0.0%) |
| 5-Person Households | 2,751 (6.6%) | 0 (0.0%) |
| 6-Person Households | 1,077 (2.6%) | 0 (0.0%) |
| 7+ Person Households | 579 (1.4%) | 0 (0.0%) |
| Total | 28,412 (68.4%) | 13,093 (31.6%) |
Female Fertility in Terrebonne Parish
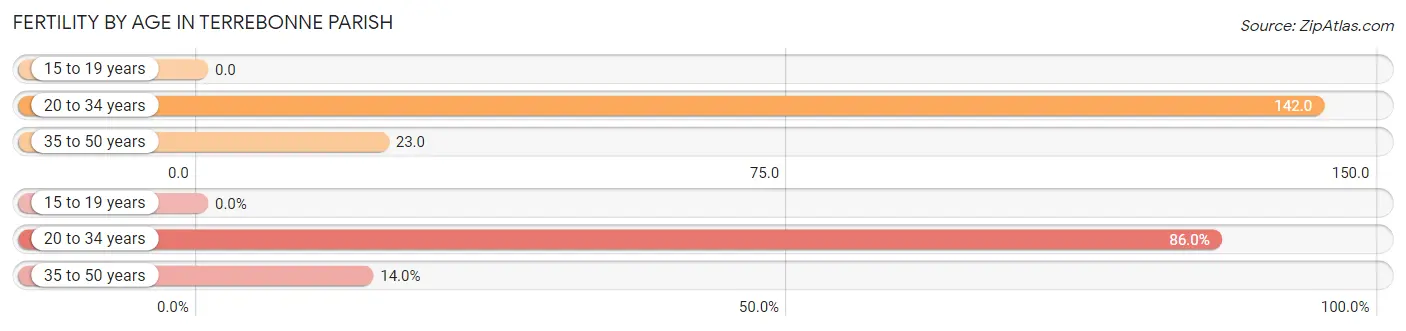
Fertility by Age in Terrebonne Parish
Average fertility rate in Terrebonne Parish is 72.0 births per 1,000 women. Women in the age bracket of 20 to 34 years have the highest fertility rate with 142.0 births per 1,000 women. Women in the age bracket of 20 to 34 years acount for 86.0% of all women with births.
| Age Bracket | Women with Births | Births / 1,000 Women |
| 15 to 19 years | 0 (0.0%) | 0.0 |
| 20 to 34 years | 1,521 (86.0%) | 142.0 |
| 35 to 50 years | 248 (14.0%) | 23.0 |
| Total | 1,769 (100.0%) | 72.0 |
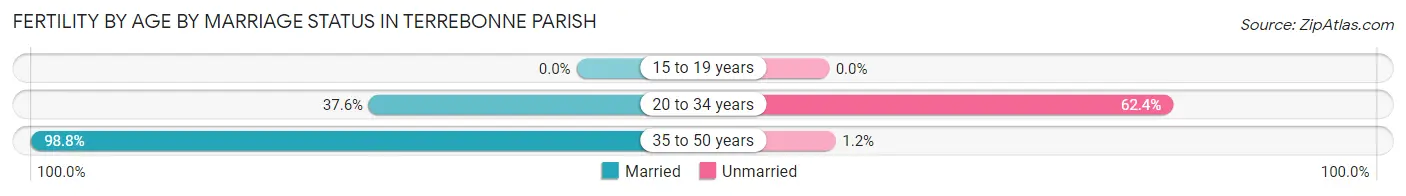
Fertility by Age by Marriage Status in Terrebonne Parish
46.2% of women with births (1,769) in Terrebonne Parish are married. The highest percentage of unmarried women with births falls into 20 to 34 years age bracket with 62.4% of them unmarried at the time of birth, while the lowest percentage of unmarried women with births belong to 35 to 50 years age bracket with 1.2% of them unmarried.
| Age Bracket | Married | Unmarried |
| 15 to 19 years | 0 (0.0%) | 0 (0.0%) |
| 20 to 34 years | 572 (37.6%) | 949 (62.4%) |
| 35 to 50 years | 245 (98.8%) | 3 (1.2%) |
| Total | 817 (46.2%) | 952 (53.8%) |
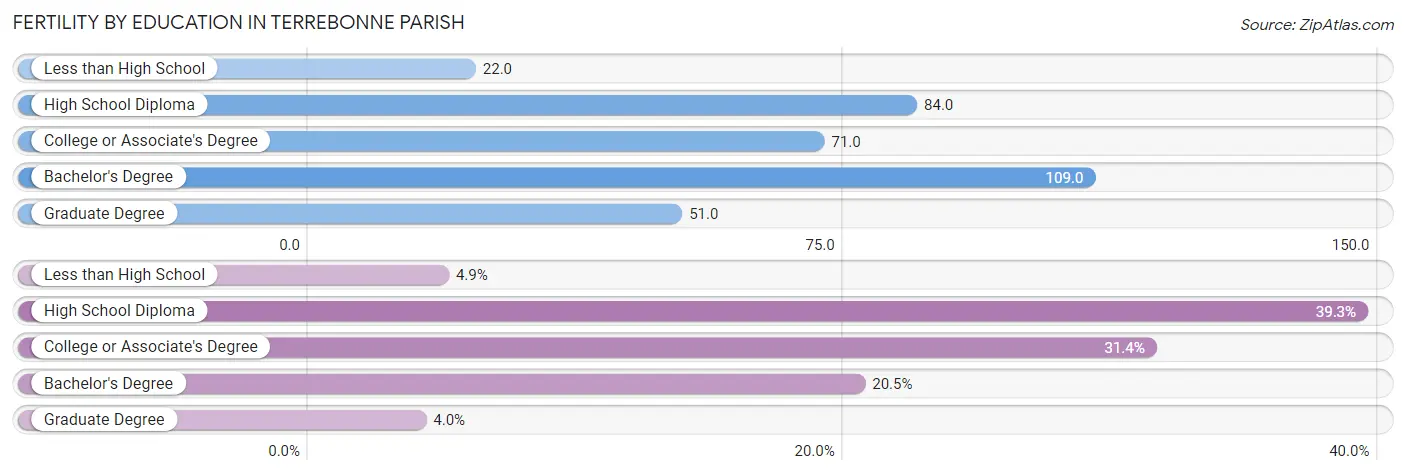
Fertility by Education in Terrebonne Parish
Average fertility rate in Terrebonne Parish is 72.0 births per 1,000 women. Women with the education attainment of bachelor's degree have the highest fertility rate of 109.0 births per 1,000 women, while women with the education attainment of less than high school have the lowest fertility at 22.0 births per 1,000 women. Women with the education attainment of high school diploma represent 39.3% of all women with births.
| Educational Attainment | Women with Births | Births / 1,000 Women |
| Less than High School | 86 (4.9%) | 22.0 |
| High School Diploma | 695 (39.3%) | 84.0 |
| College or Associate's Degree | 555 (31.4%) | 71.0 |
| Bachelor's Degree | 362 (20.5%) | 109.0 |
| Graduate Degree | 71 (4.0%) | 51.0 |
| Total | 1,769 (100.0%) | 72.0 |
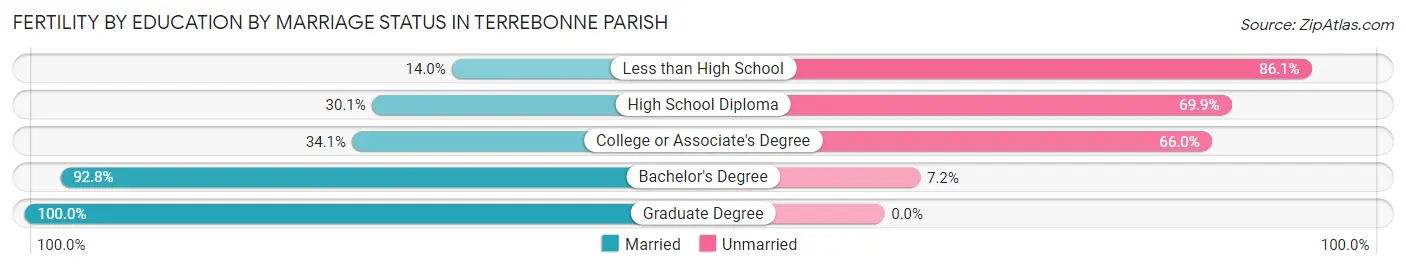
Fertility by Education by Marriage Status in Terrebonne Parish
53.8% of women with births in Terrebonne Parish are unmarried. Women with the educational attainment of graduate degree are most likely to be married with 100.0% of them married at childbirth, while women with the educational attainment of less than high school are least likely to be married with 86.1% of them unmarried at childbirth.
| Educational Attainment | Married | Unmarried |
| Less than High School | 12 (14.0%) | 74 (86.1%) |
| High School Diploma | 209 (30.1%) | 486 (69.9%) |
| College or Associate's Degree | 189 (34.1%) | 366 (65.9%) |
| Bachelor's Degree | 336 (92.8%) | 26 (7.2%) |
| Graduate Degree | 71 (100.0%) | 0 (0.0%) |
| Total | 817 (46.2%) | 952 (53.8%) |
Income in Terrebonne Parish
Income Overview in Terrebonne Parish
Per Capita Income in Terrebonne Parish is $32,143, while median incomes of families and households are $72,340 and $63,088 respectively.
| Characteristic | Number | Measure |
| Per Capita Income | 108,862 | $32,143 |
| Median Family Income | 28,412 | $72,340 |
| Mean Family Income | 28,412 | $93,053 |
| Median Household Income | 41,505 | $63,088 |
| Mean Household Income | 41,505 | $83,074 |
| Income Deficit | 28,412 | $9,041 |
| Wage / Income Gap (%) | 108,862 | 48.58% |
| Wage / Income Gap ($) | 108,862 | 51.42¢ per $1 |
| Gini / Inequality Index | 108,862 | 0.47 |
Earnings by Sex in Terrebonne Parish
Average Earnings in Terrebonne Parish are $37,956, $55,326 for men and $28,446 for women, a difference of 48.6%.
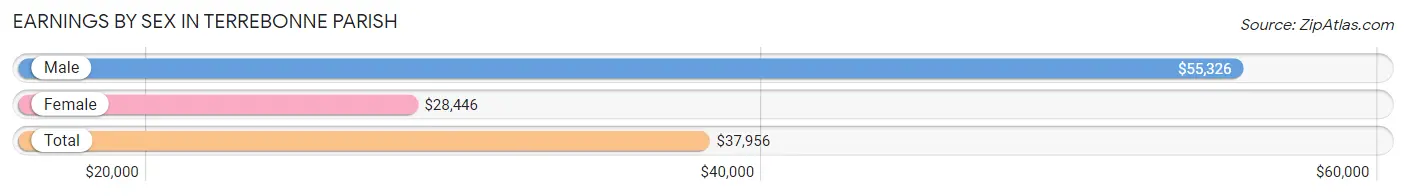
| Sex | Number | Average Earnings |
| Male | 27,154 (52.5%) | $55,326 |
| Female | 24,573 (47.5%) | $28,446 |
| Total | 51,727 (100.0%) | $37,956 |
Earnings by Sex by Income Bracket in Terrebonne Parish
The most common earnings brackets in Terrebonne Parish are $100,000+ for men (5,506 | 20.3%) and $25,000 to $29,999 for women (2,260 | 9.2%).
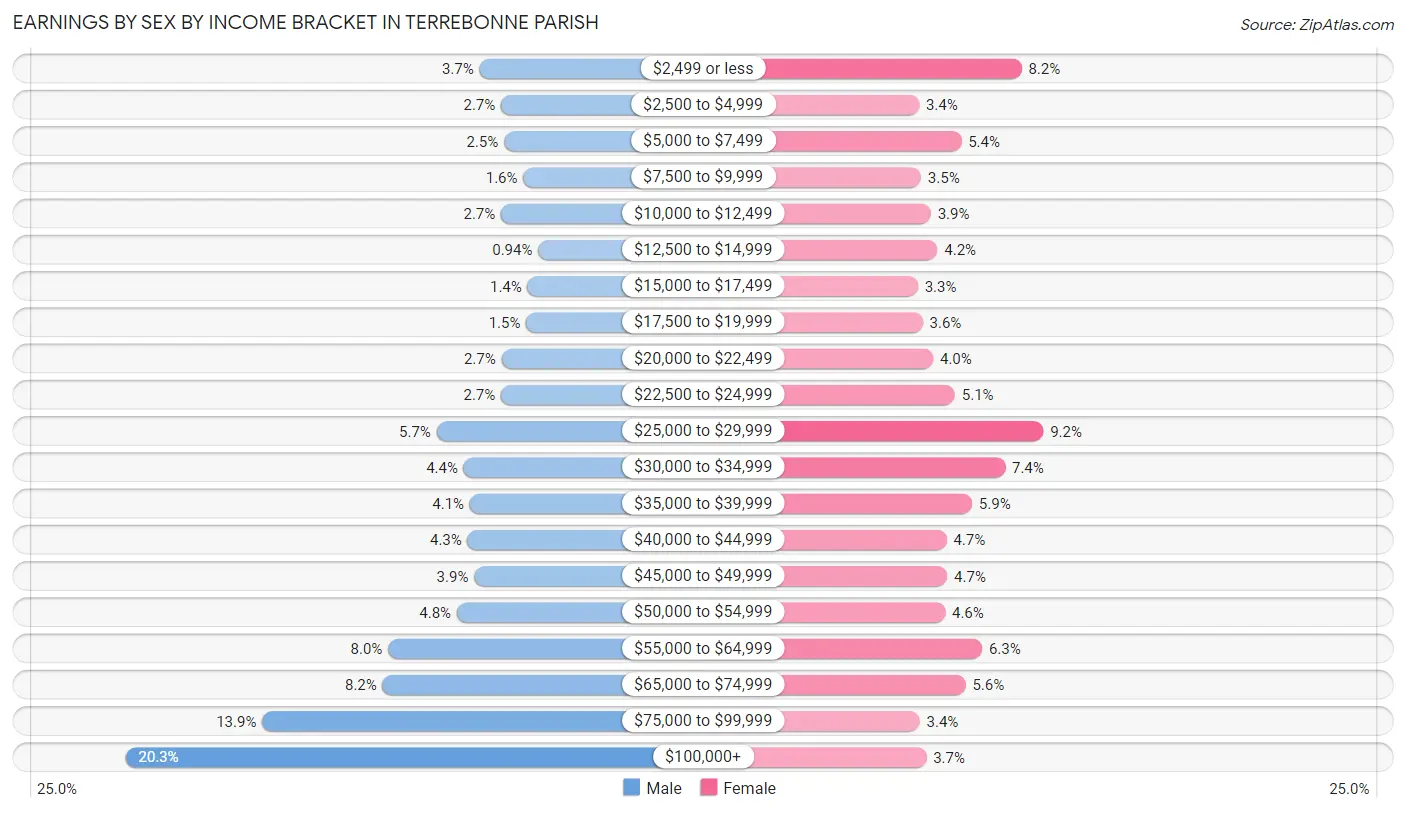
| Income | Male | Female |
| $2,499 or less | 1,002 (3.7%) | 2,010 (8.2%) |
| $2,500 to $4,999 | 728 (2.7%) | 831 (3.4%) |
| $5,000 to $7,499 | 690 (2.5%) | 1,317 (5.4%) |
| $7,500 to $9,999 | 444 (1.6%) | 852 (3.5%) |
| $10,000 to $12,499 | 729 (2.7%) | 966 (3.9%) |
| $12,500 to $14,999 | 254 (0.9%) | 1,041 (4.2%) |
| $15,000 to $17,499 | 392 (1.4%) | 816 (3.3%) |
| $17,500 to $19,999 | 406 (1.5%) | 872 (3.5%) |
| $20,000 to $22,499 | 721 (2.7%) | 992 (4.0%) |
| $22,500 to $24,999 | 727 (2.7%) | 1,244 (5.1%) |
| $25,000 to $29,999 | 1,547 (5.7%) | 2,260 (9.2%) |
| $30,000 to $34,999 | 1,202 (4.4%) | 1,822 (7.4%) |
| $35,000 to $39,999 | 1,125 (4.1%) | 1,441 (5.9%) |
| $40,000 to $44,999 | 1,155 (4.3%) | 1,147 (4.7%) |
| $45,000 to $49,999 | 1,070 (3.9%) | 1,156 (4.7%) |
| $50,000 to $54,999 | 1,291 (4.8%) | 1,131 (4.6%) |
| $55,000 to $64,999 | 2,163 (8.0%) | 1,556 (6.3%) |
| $65,000 to $74,999 | 2,236 (8.2%) | 1,367 (5.6%) |
| $75,000 to $99,999 | 3,766 (13.9%) | 839 (3.4%) |
| $100,000+ | 5,506 (20.3%) | 913 (3.7%) |
| Total | 27,154 (100.0%) | 24,573 (100.0%) |
Earnings by Sex by Educational Attainment in Terrebonne Parish
Average earnings in Terrebonne Parish are $63,068 for men and $32,262 for women, a difference of 48.8%. Men with an educational attainment of graduate degree enjoy the highest average annual earnings of $83,795, while those with less than high school education earn the least with $54,097. Women with an educational attainment of graduate degree earn the most with the average annual earnings of $53,418, while those with less than high school education have the smallest earnings of $22,250.
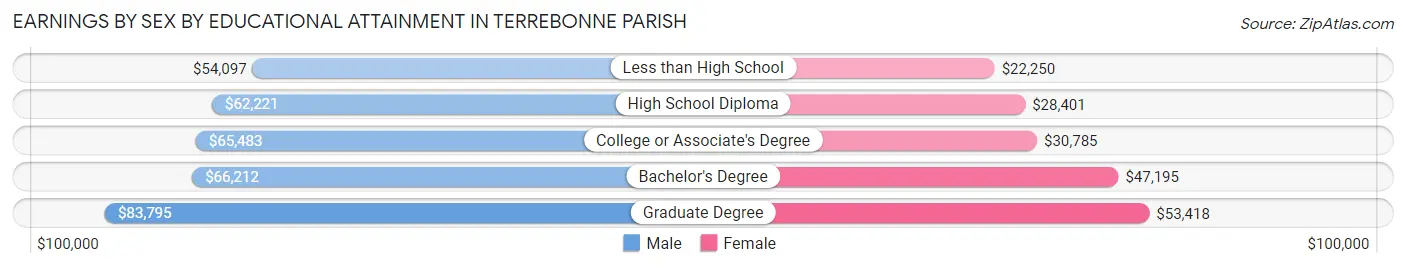
| Educational Attainment | Male Income | Female Income |
| Less than High School | $54,097 | $22,250 |
| High School Diploma | $62,221 | $28,401 |
| College or Associate's Degree | $65,483 | $30,785 |
| Bachelor's Degree | $66,212 | $47,195 |
| Graduate Degree | $83,795 | $53,418 |
| Total | $63,068 | $32,262 |
Family Income in Terrebonne Parish
Family Income Brackets in Terrebonne Parish
According to the Terrebonne Parish family income data, there are 5,086 families falling into the $50,000 to $74,999 income range, which is the most common income bracket and makes up 17.9% of all families. Conversely, the $10,000 to $14,999 income bracket is the least frequent group with only 653 families (2.3%) belonging to this category.
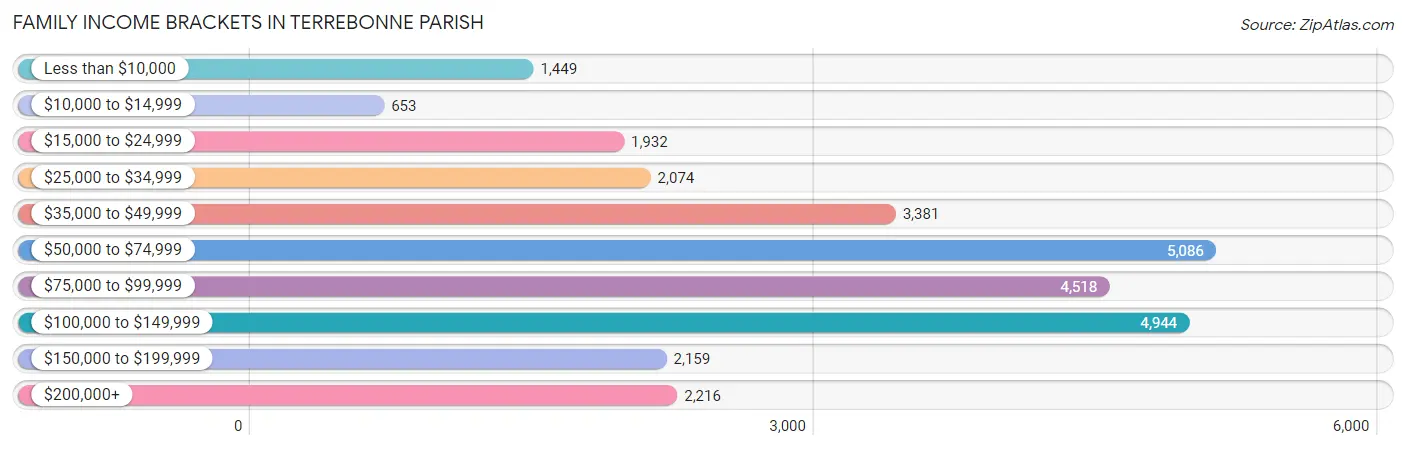
| Income Bracket | # Families | % Families |
| Less than $10,000 | 1,449 | 5.1% |
| $10,000 to $14,999 | 653 | 2.3% |
| $15,000 to $24,999 | 1,932 | 6.8% |
| $25,000 to $34,999 | 2,074 | 7.3% |
| $35,000 to $49,999 | 3,381 | 11.9% |
| $50,000 to $74,999 | 5,086 | 17.9% |
| $75,000 to $99,999 | 4,518 | 15.9% |
| $100,000 to $149,999 | 4,944 | 17.4% |
| $150,000 to $199,999 | 2,159 | 7.6% |
| $200,000+ | 2,216 | 7.8% |
Family Income by Famaliy Size in Terrebonne Parish
6-person families (980 | 3.5%) account for the highest median family income in Terrebonne Parish with $113,436 per family, while 2-person families (13,745 | 48.4%) have the highest median income of $28,064 per family member.
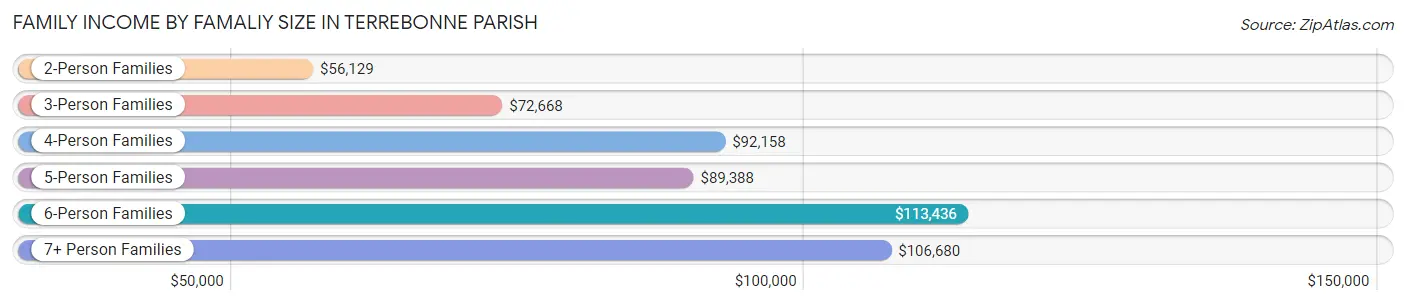
| Income Bracket | # Families | Median Income |
| 2-Person Families | 13,745 (48.4%) | $56,129 |
| 3-Person Families | 6,141 (21.6%) | $72,668 |
| 4-Person Families | 4,616 (16.3%) | $92,158 |
| 5-Person Families | 2,484 (8.7%) | $89,388 |
| 6-Person Families | 980 (3.5%) | $113,436 |
| 7+ Person Families | 446 (1.6%) | $106,680 |
| Total | 28,412 (100.0%) | $72,340 |
Family Income by Number of Earners in Terrebonne Parish
The median family income in Terrebonne Parish is $72,340, with families comprising 3+ earners (2,237) having the highest median family income of $130,239, while families with no earners (4,915) have the lowest median family income of $35,354, accounting for 7.9% and 17.3% of families, respectively.
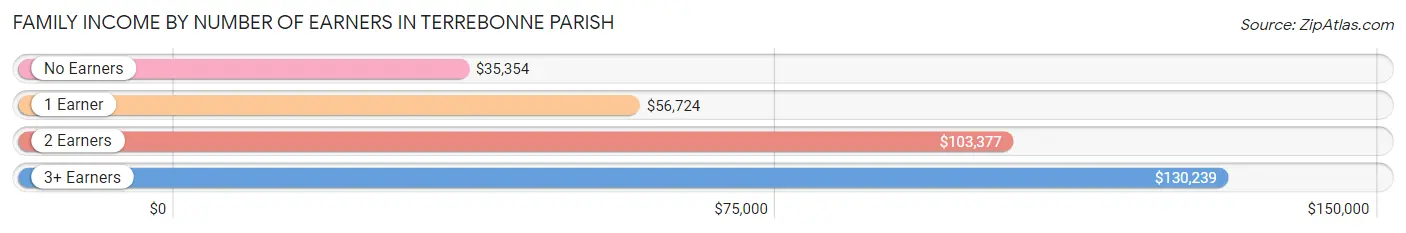
| Number of Earners | # Families | Median Income |
| No Earners | 4,915 (17.3%) | $35,354 |
| 1 Earner | 11,423 (40.2%) | $56,724 |
| 2 Earners | 9,837 (34.6%) | $103,377 |
| 3+ Earners | 2,237 (7.9%) | $130,239 |
| Total | 28,412 (100.0%) | $72,340 |
Household Income in Terrebonne Parish
Household Income Brackets in Terrebonne Parish
With 6,848 households falling in the category, the $50,000 to $74,999 income range is the most frequent in Terrebonne Parish, accounting for 16.5% of all households. In contrast, only 1,619 households (3.9%) fall into the $10,000 to $14,999 income bracket, making it the least populous group.
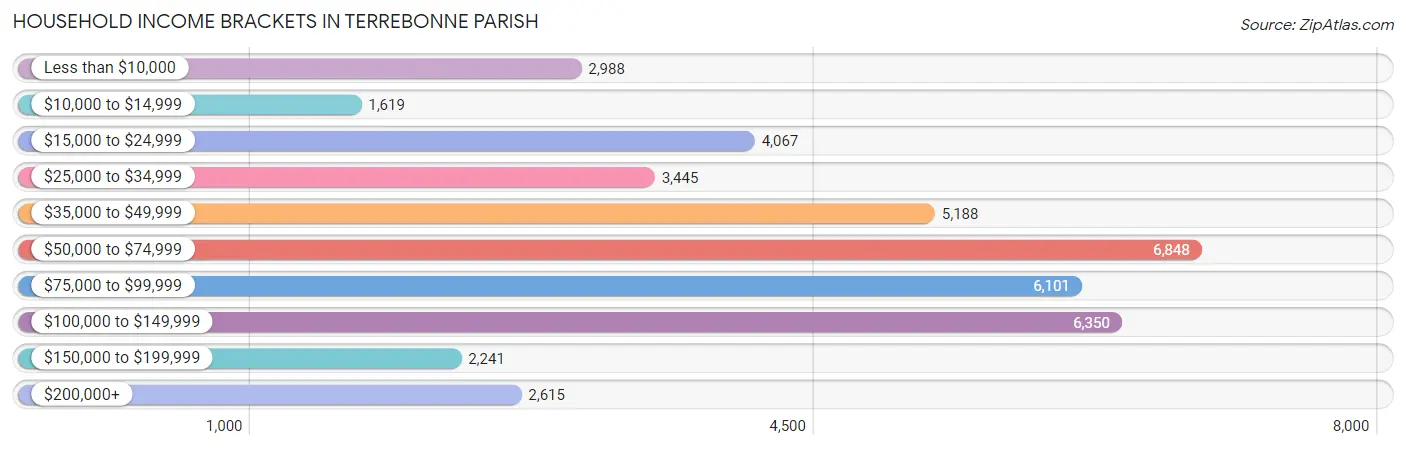
| Income Bracket | # Households | % Households |
| Less than $10,000 | 2,988 | 7.2% |
| $10,000 to $14,999 | 1,619 | 3.9% |
| $15,000 to $24,999 | 4,067 | 9.8% |
| $25,000 to $34,999 | 3,445 | 8.3% |
| $35,000 to $49,999 | 5,188 | 12.5% |
| $50,000 to $74,999 | 6,848 | 16.5% |
| $75,000 to $99,999 | 6,101 | 14.7% |
| $100,000 to $149,999 | 6,350 | 15.3% |
| $150,000 to $199,999 | 2,241 | 5.4% |
| $200,000+ | 2,615 | 6.3% |
Household Income by Householder Age in Terrebonne Parish
The median household income in Terrebonne Parish is $63,088, with the highest median household income of $75,691 found in the 25 to 44 years age bracket for the primary householder. A total of 13,896 households (33.5%) fall into this category. Meanwhile, the 15 to 24 years age bracket for the primary householder has the lowest median household income of $36,884, with 1,576 households (3.8%) in this group.
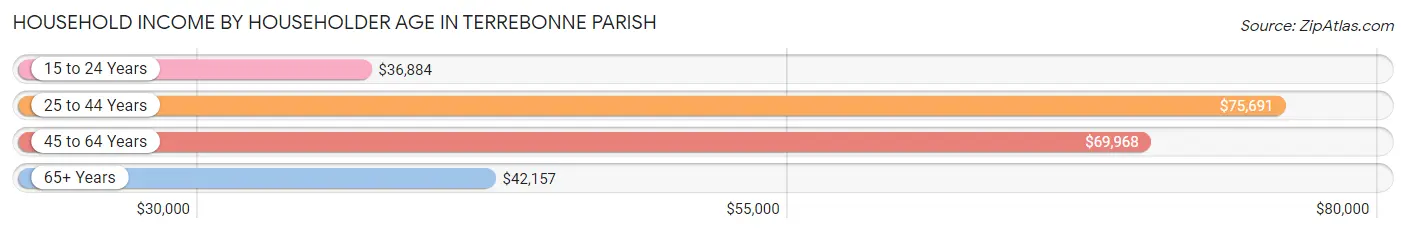
| Income Bracket | # Households | Median Income |
| 15 to 24 Years | 1,576 (3.8%) | $36,884 |
| 25 to 44 Years | 13,896 (33.5%) | $75,691 |
| 45 to 64 Years | 15,459 (37.2%) | $69,968 |
| 65+ Years | 10,574 (25.5%) | $42,157 |
| Total | 41,505 (100.0%) | $63,088 |
Poverty in Terrebonne Parish
Income Below Poverty by Sex and Age in Terrebonne Parish
With 14.7% poverty level for males and 18.0% for females among the residents of Terrebonne Parish, 15 year old males and 15 year old females are the most vulnerable to poverty, with 286 males (35.2%) and 267 females (42.1%) in their respective age groups living below the poverty level.
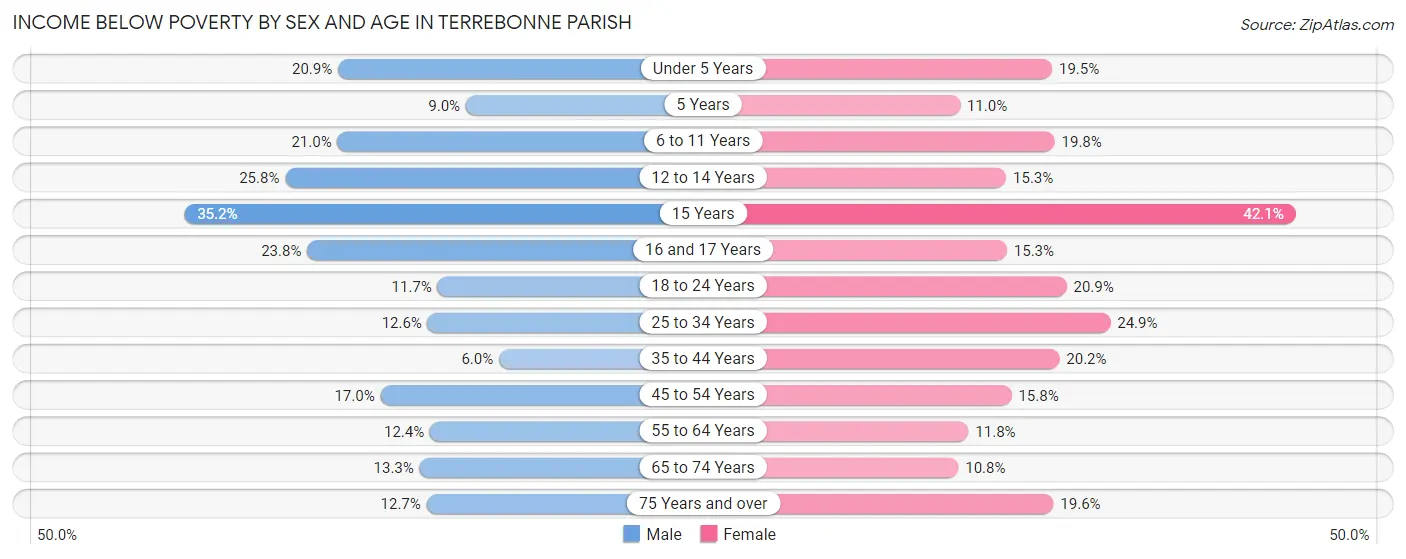
| Age Bracket | Male | Female |
| Under 5 Years | 737 (20.9%) | 676 (19.5%) |
| 5 Years | 65 (9.0%) | 87 (11.0%) |
| 6 to 11 Years | 1,052 (21.0%) | 757 (19.8%) |
| 12 to 14 Years | 552 (25.8%) | 391 (15.2%) |
| 15 Years | 286 (35.2%) | 267 (42.1%) |
| 16 and 17 Years | 395 (23.8%) | 238 (15.3%) |
| 18 to 24 Years | 544 (11.7%) | 869 (20.9%) |
| 25 to 34 Years | 876 (12.6%) | 1,867 (24.9%) |
| 35 to 44 Years | 419 (6.0%) | 1,411 (20.2%) |
| 45 to 54 Years | 1,047 (17.0%) | 1,051 (15.8%) |
| 55 to 64 Years | 875 (12.4%) | 845 (11.7%) |
| 65 to 74 Years | 620 (13.3%) | 568 (10.8%) |
| 75 Years and over | 326 (12.7%) | 711 (19.6%) |
| Total | 7,794 (14.7%) | 9,738 (18.0%) |
Income Above Poverty by Sex and Age in Terrebonne Parish
According to the poverty statistics in Terrebonne Parish, males aged 35 to 44 years and females aged 65 to 74 years are the age groups that are most secure financially, with 94.0% of males and 89.2% of females in these age groups living above the poverty line.
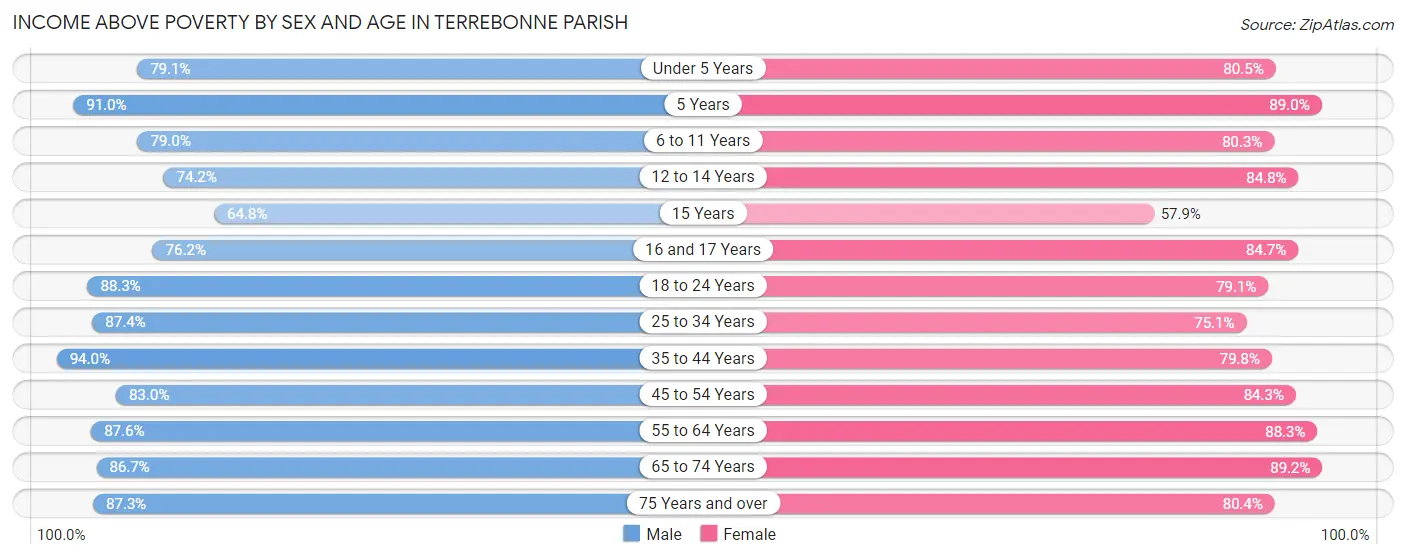
| Age Bracket | Male | Female |
| Under 5 Years | 2,788 (79.1%) | 2,789 (80.5%) |
| 5 Years | 654 (91.0%) | 706 (89.0%) |
| 6 to 11 Years | 3,967 (79.0%) | 3,076 (80.2%) |
| 12 to 14 Years | 1,587 (74.2%) | 2,173 (84.8%) |
| 15 Years | 527 (64.8%) | 367 (57.9%) |
| 16 and 17 Years | 1,267 (76.2%) | 1,316 (84.7%) |
| 18 to 24 Years | 4,117 (88.3%) | 3,296 (79.1%) |
| 25 to 34 Years | 6,083 (87.4%) | 5,626 (75.1%) |
| 35 to 44 Years | 6,599 (94.0%) | 5,576 (79.8%) |
| 45 to 54 Years | 5,122 (83.0%) | 5,623 (84.3%) |
| 55 to 64 Years | 6,201 (87.6%) | 6,346 (88.2%) |
| 65 to 74 Years | 4,026 (86.7%) | 4,687 (89.2%) |
| 75 Years and over | 2,243 (87.3%) | 2,909 (80.4%) |
| Total | 45,181 (85.3%) | 44,490 (82.0%) |
Income Below Poverty Among Married-Couple Families in Terrebonne Parish
The poverty statistics for married-couple families in Terrebonne Parish show that 5.5% or 1,076 of the total 19,610 families live below the poverty line. Families with 5 or more children have the highest poverty rate of 60.8%, comprising of 62 families. On the other hand, families with 3 or 4 children have the lowest poverty rate of 2.5%, which includes 55 families.
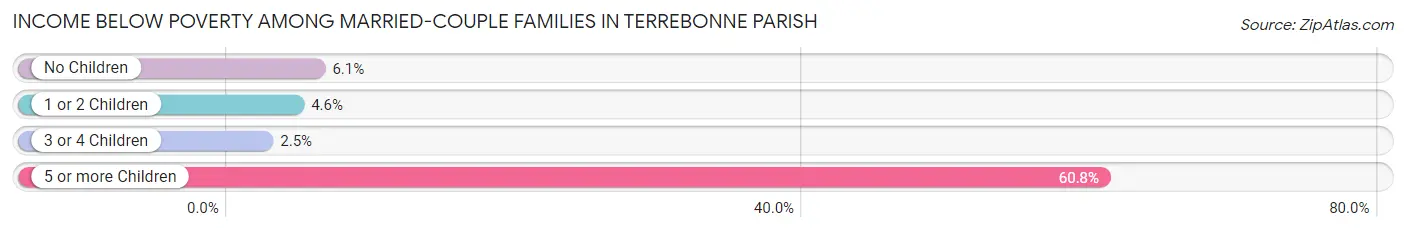
| Children | Above Poverty | Below Poverty |
| No Children | 10,353 (93.9%) | 671 (6.1%) |
| 1 or 2 Children | 5,961 (95.4%) | 288 (4.6%) |
| 3 or 4 Children | 2,180 (97.5%) | 55 (2.5%) |
| 5 or more Children | 40 (39.2%) | 62 (60.8%) |
| Total | 18,534 (94.5%) | 1,076 (5.5%) |
Income Below Poverty Among Single-Parent Households in Terrebonne Parish
According to the poverty data in Terrebonne Parish, 22.4% or 590 single-father households and 36.5% or 2,251 single-mother households are living below the poverty line. Among single-father households, those with 3 or 4 children have the highest poverty rate, with 48 households (38.7%) experiencing poverty. Likewise, among single-mother households, those with 3 or 4 children have the highest poverty rate, with 430 households (66.0%) falling below the poverty line.
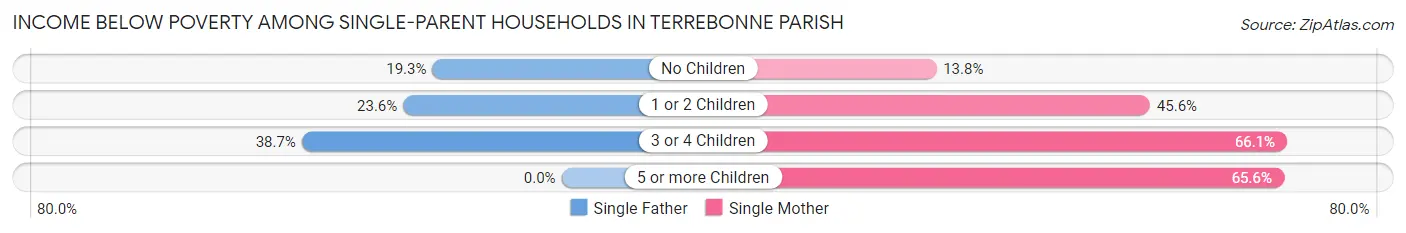
| Children | Single Father | Single Mother |
| No Children | 201 (19.3%) | 307 (13.8%) |
| 1 or 2 Children | 341 (23.6%) | 1,474 (45.6%) |
| 3 or 4 Children | 48 (38.7%) | 430 (66.0%) |
| 5 or more Children | 0 (0.0%) | 40 (65.6%) |
| Total | 590 (22.4%) | 2,251 (36.5%) |
Income Below Poverty Among Married-Couple vs Single-Parent Households in Terrebonne Parish
The poverty data for Terrebonne Parish shows that 1,076 of the married-couple family households (5.5%) and 2,841 of the single-parent households (32.3%) are living below the poverty level. Within the married-couple family households, those with 5 or more children have the highest poverty rate, with 62 households (60.8%) falling below the poverty line. Among the single-parent households, those with 3 or 4 children have the highest poverty rate, with 478 household (61.7%) living below poverty.
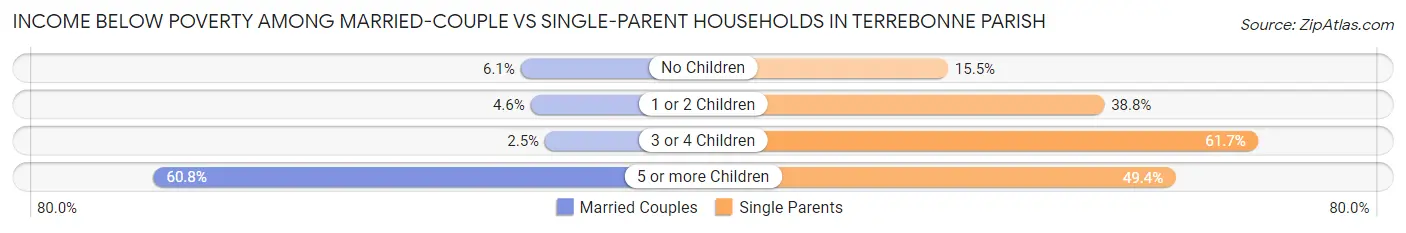
| Children | Married-Couple Families | Single-Parent Households |
| No Children | 671 (6.1%) | 508 (15.5%) |
| 1 or 2 Children | 288 (4.6%) | 1,815 (38.8%) |
| 3 or 4 Children | 55 (2.5%) | 478 (61.7%) |
| 5 or more Children | 62 (60.8%) | 40 (49.4%) |
| Total | 1,076 (5.5%) | 2,841 (32.3%) |
Employment Characteristics in Terrebonne Parish
Employment by Class of Employer in Terrebonne Parish
Among the 46,254 employed individuals in Terrebonne Parish, private company employees (33,976 | 73.5%), local government employees (3,125 | 6.8%), and not-for-profit organizations (2,952 | 6.4%) make up the most common classes of employment.
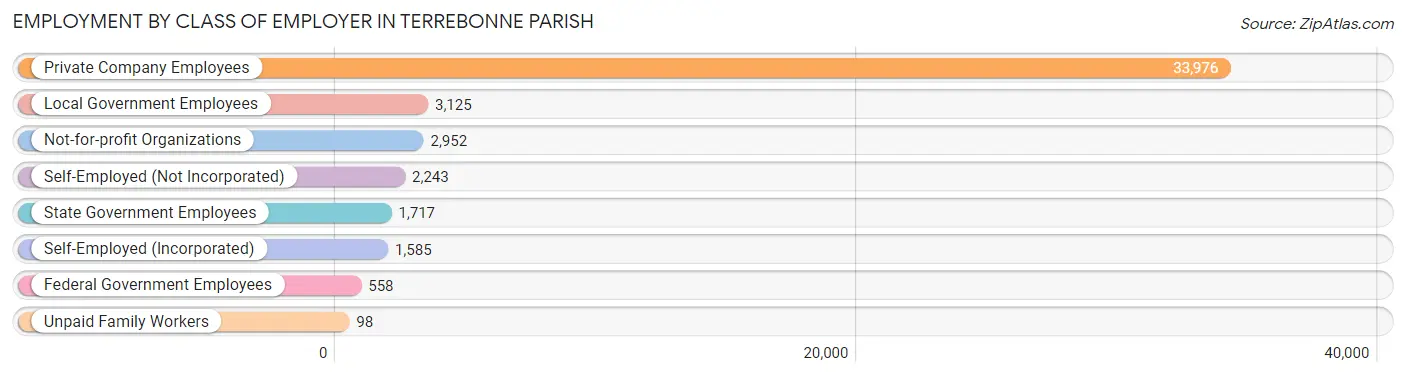
| Employer Class | # Employees | % Employees |
| Private Company Employees | 33,976 | 73.5% |
| Self-Employed (Incorporated) | 1,585 | 3.4% |
| Self-Employed (Not Incorporated) | 2,243 | 4.9% |
| Not-for-profit Organizations | 2,952 | 6.4% |
| Local Government Employees | 3,125 | 6.8% |
| State Government Employees | 1,717 | 3.7% |
| Federal Government Employees | 558 | 1.2% |
| Unpaid Family Workers | 98 | 0.2% |
| Total | 46,254 | 100.0% |
Employment Status by Age in Terrebonne Parish
According to the labor force statistics for Terrebonne Parish, out of the total population over 16 years of age (84,768), 59.3% or 50,267 individuals are in the labor force, with 5.9% or 2,966 of them unemployed. The age group with the highest labor force participation rate is 30 to 34 years, with 84.7% or 6,128 individuals in the labor force. Within the labor force, the 16 to 19 years age range has the highest percentage of unemployed individuals, with 13.3% or 243 of them being unemployed.
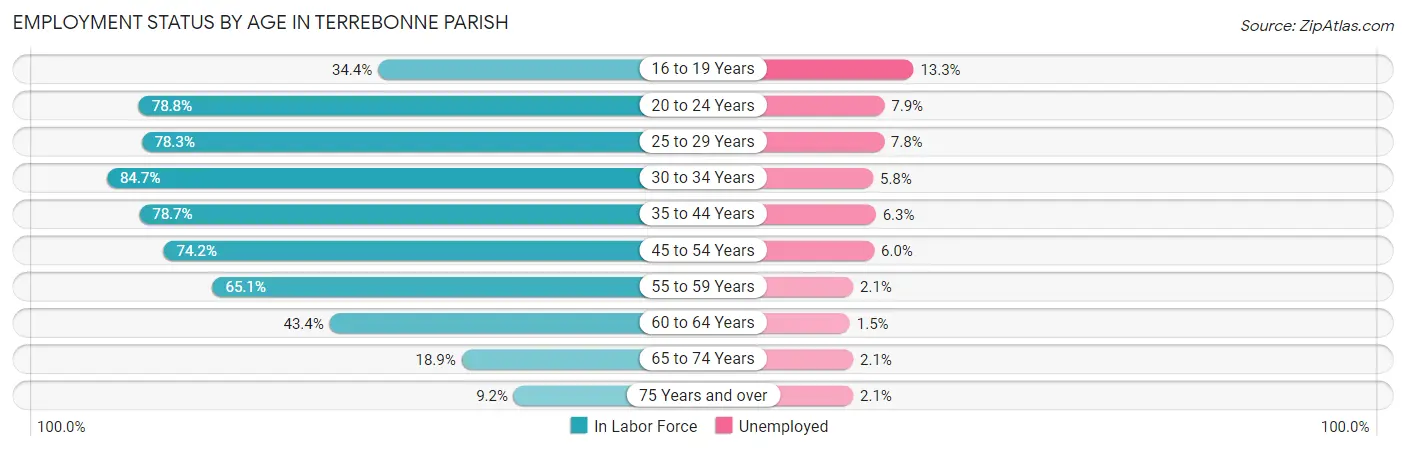
| Age Bracket | In Labor Force | Unemployed |
| 16 to 19 Years | 1,824 (34.4%) | 243 (13.3%) |
| 20 to 24 Years | 5,418 (78.8%) | 428 (7.9%) |
| 25 to 29 Years | 5,809 (78.3%) | 453 (7.8%) |
| 30 to 34 Years | 6,128 (84.7%) | 355 (5.8%) |
| 35 to 44 Years | 11,137 (78.7%) | 702 (6.3%) |
| 45 to 54 Years | 9,611 (74.2%) | 577 (6.0%) |
| 55 to 59 Years | 4,881 (65.1%) | 103 (2.1%) |
| 60 to 64 Years | 3,008 (43.4%) | 45 (1.5%) |
| 65 to 74 Years | 1,897 (18.9%) | 40 (2.1%) |
| 75 Years and over | 585 (9.2%) | 12 (2.1%) |
| Total | 50,267 (59.3%) | 2,966 (5.9%) |
Employment Status by Educational Attainment in Terrebonne Parish
According to labor force statistics for Terrebonne Parish, 72.2% of individuals (40,568) out of the total population between 25 and 64 years of age (56,188) are in the labor force, with 5.5% or 2,231 of them being unemployed. The group with the highest labor force participation rate are those with the educational attainment of bachelor's degree or higher, with 84.6% or 8,488 individuals in the labor force. Within the labor force, individuals with less than high school education have the highest percentage of unemployment, with 10.4% or 472 of them being unemployed.
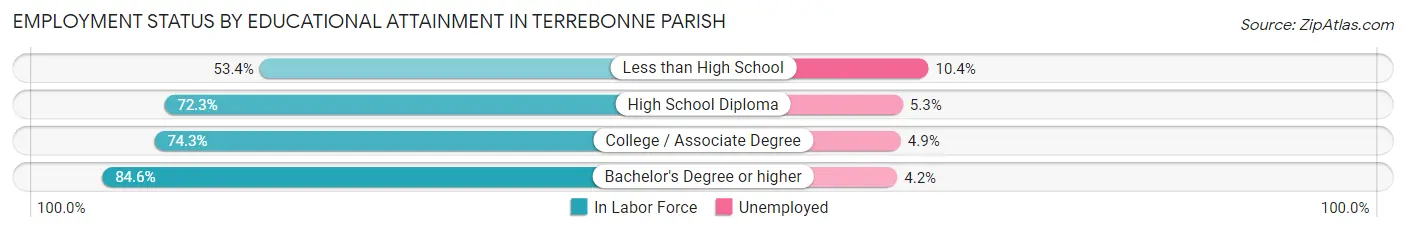
| Educational Attainment | In Labor Force | Unemployed |
| Less than High School | 4,535 (53.4%) | 883 (10.4%) |
| High School Diploma | 15,736 (72.3%) | 1,154 (5.3%) |
| College / Associate Degree | 11,811 (74.3%) | 779 (4.9%) |
| Bachelor's Degree or higher | 8,488 (84.6%) | 421 (4.2%) |
| Total | 40,568 (72.2%) | 3,090 (5.5%) |
Employment Occupations by Sex in Terrebonne Parish
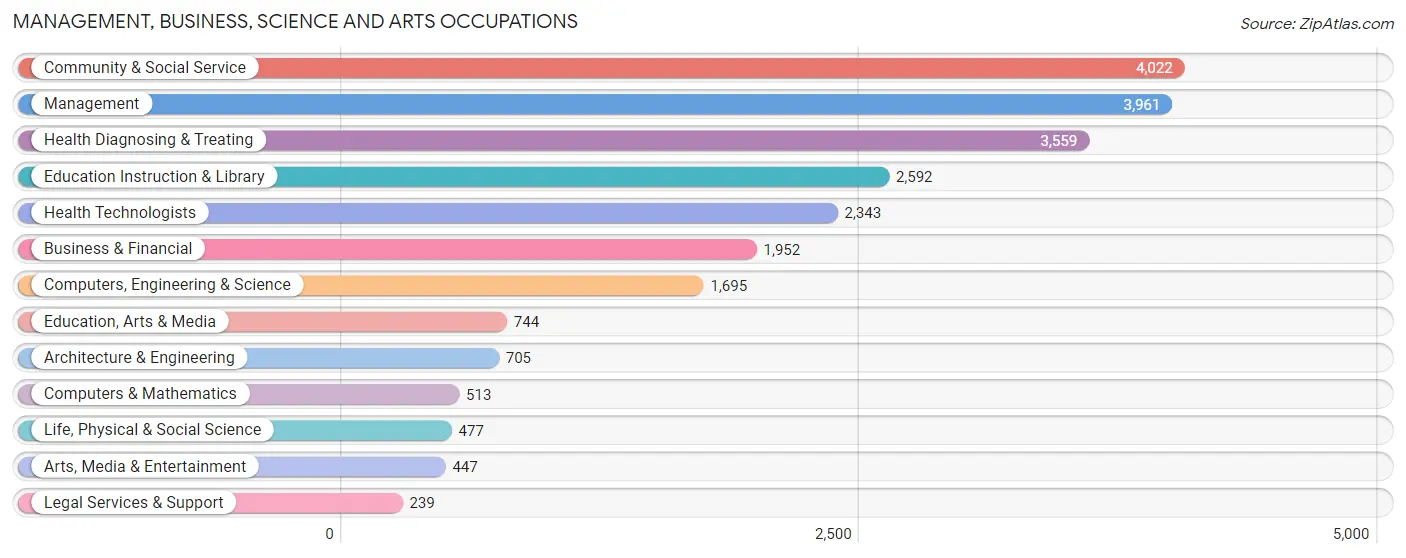
Management, Business, Science and Arts Occupations
The most common Management, Business, Science and Arts occupations in Terrebonne Parish are Community & Social Service (4,022 | 8.5%), Management (3,961 | 8.4%), Health Diagnosing & Treating (3,559 | 7.5%), Education Instruction & Library (2,592 | 5.5%), and Health Technologists (2,343 | 5.0%).
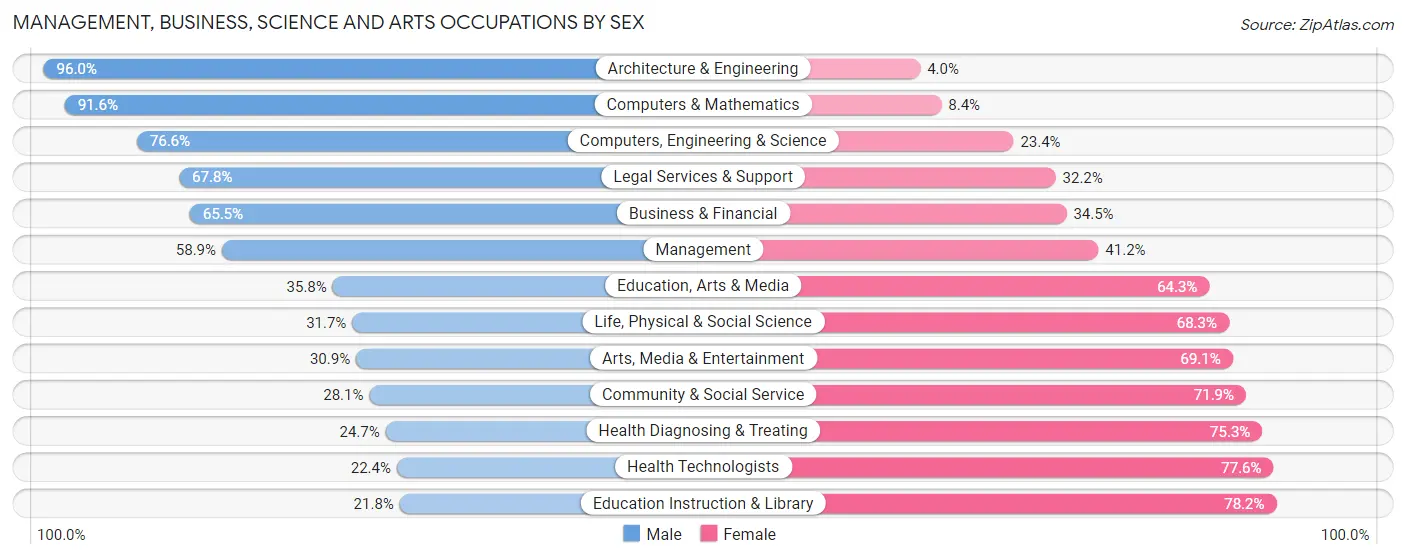
Management, Business, Science and Arts Occupations by Sex
Within the Management, Business, Science and Arts occupations in Terrebonne Parish, the most male-oriented occupations are Architecture & Engineering (96.0%), Computers & Mathematics (91.6%), and Computers, Engineering & Science (76.6%), while the most female-oriented occupations are Education Instruction & Library (78.2%), Health Technologists (77.6%), and Health Diagnosing & Treating (75.3%).
| Occupation | Male | Female |
| Management | 2,331 (58.9%) | 1,630 (41.1%) |
| Business & Financial | 1,279 (65.5%) | 673 (34.5%) |
| Computers, Engineering & Science | 1,298 (76.6%) | 397 (23.4%) |
| Computers & Mathematics | 470 (91.6%) | 43 (8.4%) |
| Architecture & Engineering | 677 (96.0%) | 28 (4.0%) |
| Life, Physical & Social Science | 151 (31.7%) | 326 (68.3%) |
| Community & Social Service | 1,130 (28.1%) | 2,892 (71.9%) |
| Education, Arts & Media | 266 (35.7%) | 478 (64.2%) |
| Legal Services & Support | 162 (67.8%) | 77 (32.2%) |
| Education Instruction & Library | 564 (21.8%) | 2,028 (78.2%) |
| Arts, Media & Entertainment | 138 (30.9%) | 309 (69.1%) |
| Health Diagnosing & Treating | 879 (24.7%) | 2,680 (75.3%) |
| Health Technologists | 524 (22.4%) | 1,819 (77.6%) |
| Total (Category) | 6,917 (45.5%) | 8,272 (54.5%) |
| Total (Overall) | 25,004 (53.1%) | 22,122 (46.9%) |
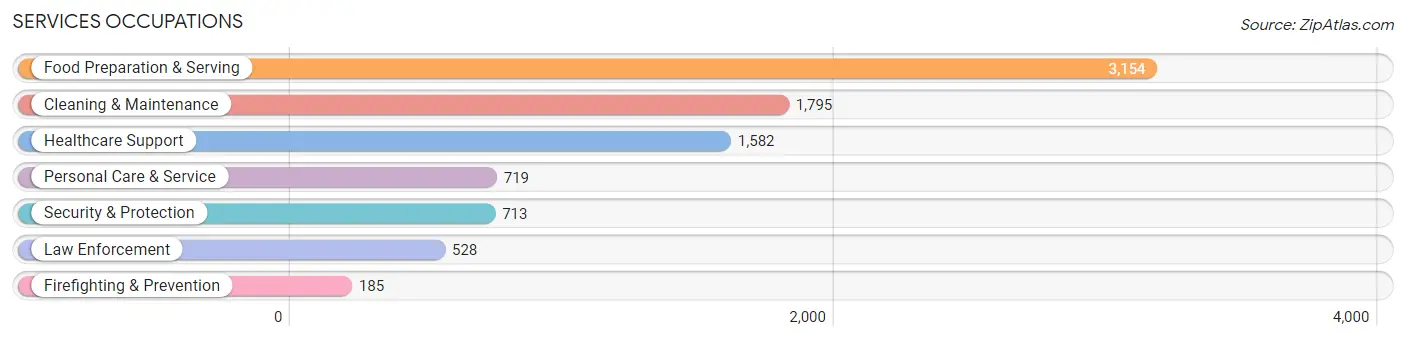
Services Occupations
The most common Services occupations in Terrebonne Parish are Food Preparation & Serving (3,154 | 6.7%), Cleaning & Maintenance (1,795 | 3.8%), Healthcare Support (1,582 | 3.4%), Personal Care & Service (719 | 1.5%), and Security & Protection (713 | 1.5%).
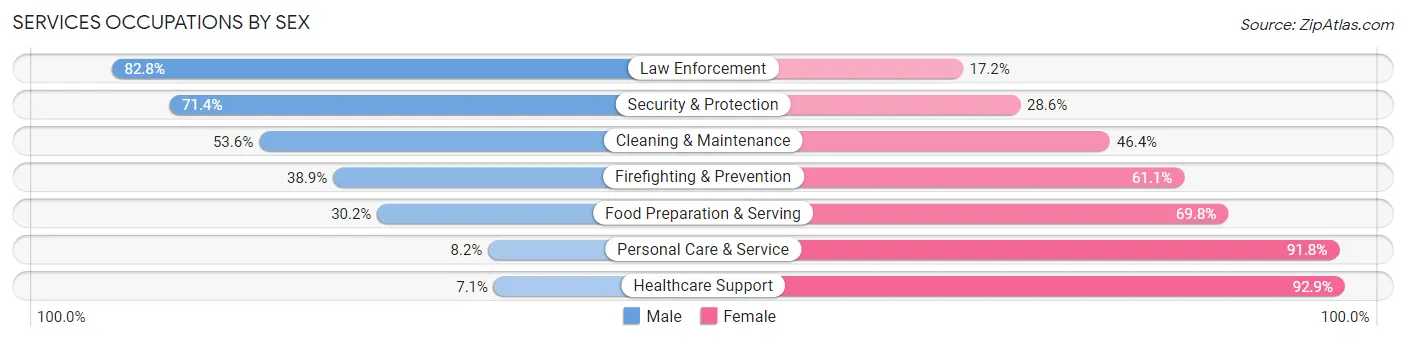
Services Occupations by Sex
Within the Services occupations in Terrebonne Parish, the most male-oriented occupations are Law Enforcement (82.8%), Security & Protection (71.4%), and Cleaning & Maintenance (53.6%), while the most female-oriented occupations are Healthcare Support (92.9%), Personal Care & Service (91.8%), and Food Preparation & Serving (69.8%).
| Occupation | Male | Female |
| Healthcare Support | 112 (7.1%) | 1,470 (92.9%) |
| Security & Protection | 509 (71.4%) | 204 (28.6%) |
| Firefighting & Prevention | 72 (38.9%) | 113 (61.1%) |
| Law Enforcement | 437 (82.8%) | 91 (17.2%) |
| Food Preparation & Serving | 952 (30.2%) | 2,202 (69.8%) |
| Cleaning & Maintenance | 962 (53.6%) | 833 (46.4%) |
| Personal Care & Service | 59 (8.2%) | 660 (91.8%) |
| Total (Category) | 2,594 (32.6%) | 5,369 (67.4%) |
| Total (Overall) | 25,004 (53.1%) | 22,122 (46.9%) |
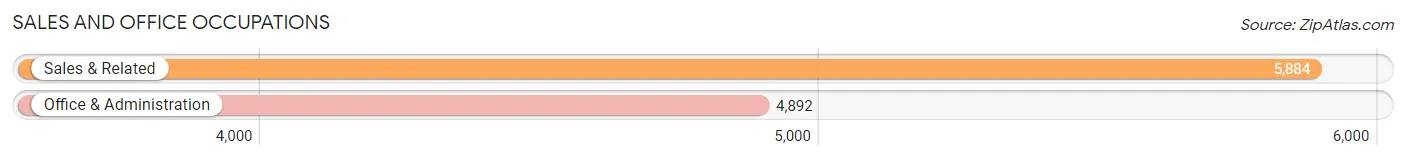
Sales and Office Occupations
The most common Sales and Office occupations in Terrebonne Parish are Sales & Related (5,884 | 12.5%), and Office & Administration (4,892 | 10.4%).
Sales and Office Occupations by Sex
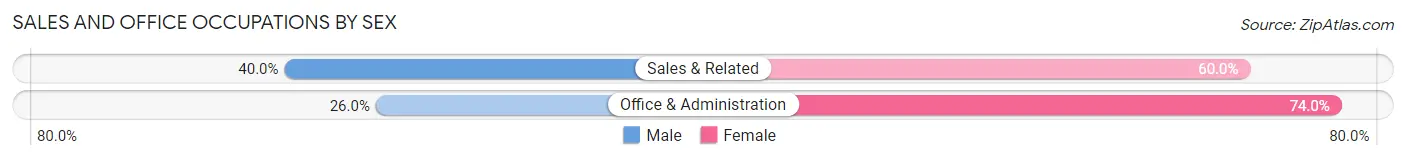
| Occupation | Male | Female |
| Sales & Related | 2,356 (40.0%) | 3,528 (60.0%) |
| Office & Administration | 1,271 (26.0%) | 3,621 (74.0%) |
| Total (Category) | 3,627 (33.7%) | 7,149 (66.3%) |
| Total (Overall) | 25,004 (53.1%) | 22,122 (46.9%) |
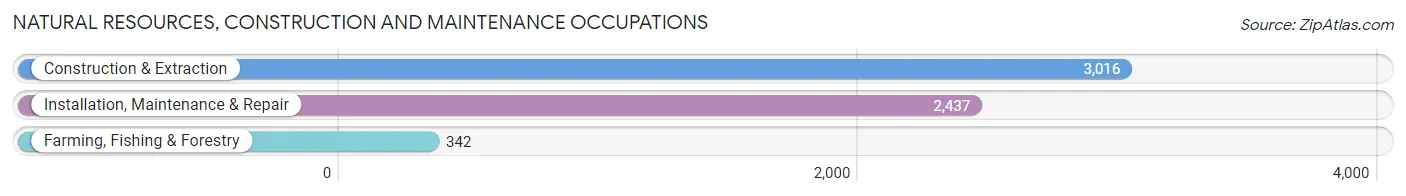
Natural Resources, Construction and Maintenance Occupations
The most common Natural Resources, Construction and Maintenance occupations in Terrebonne Parish are Construction & Extraction (3,016 | 6.4%), Installation, Maintenance & Repair (2,437 | 5.2%), and Farming, Fishing & Forestry (342 | 0.7%).
Natural Resources, Construction and Maintenance Occupations by Sex
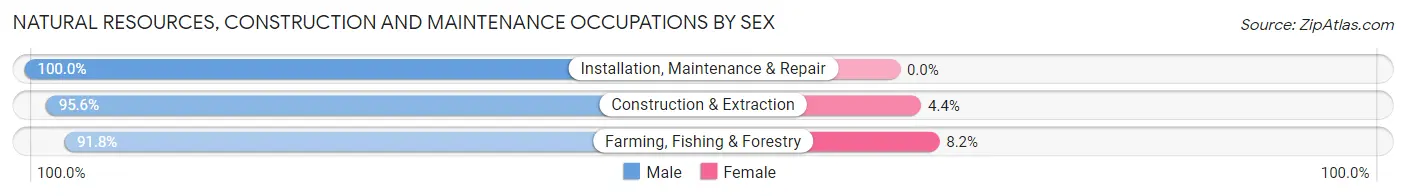
| Occupation | Male | Female |
| Farming, Fishing & Forestry | 314 (91.8%) | 28 (8.2%) |
| Construction & Extraction | 2,883 (95.6%) | 133 (4.4%) |
| Installation, Maintenance & Repair | 2,437 (100.0%) | 0 (0.0%) |
| Total (Category) | 5,634 (97.2%) | 161 (2.8%) |
| Total (Overall) | 25,004 (53.1%) | 22,122 (46.9%) |
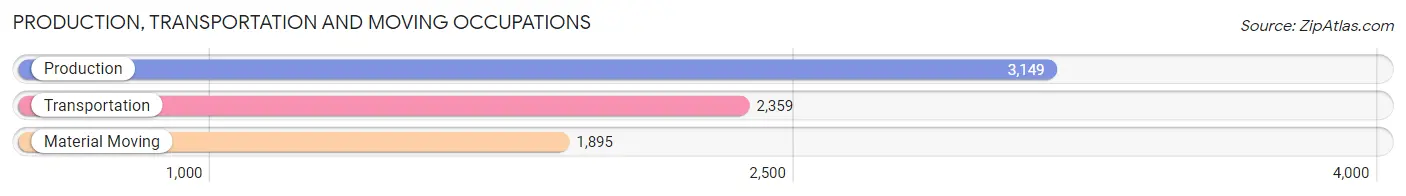
Production, Transportation and Moving Occupations
The most common Production, Transportation and Moving occupations in Terrebonne Parish are Production (3,149 | 6.7%), Transportation (2,359 | 5.0%), and Material Moving (1,895 | 4.0%).
Production, Transportation and Moving Occupations by Sex
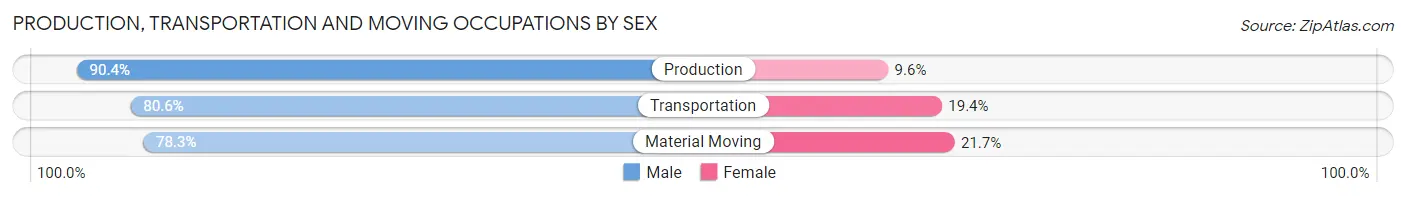
| Occupation | Male | Female |
| Production | 2,848 (90.4%) | 301 (9.6%) |
| Transportation | 1,901 (80.6%) | 458 (19.4%) |
| Material Moving | 1,483 (78.3%) | 412 (21.7%) |
| Total (Category) | 6,232 (84.2%) | 1,171 (15.8%) |
| Total (Overall) | 25,004 (53.1%) | 22,122 (46.9%) |
Employment Industries by Sex in Terrebonne Parish
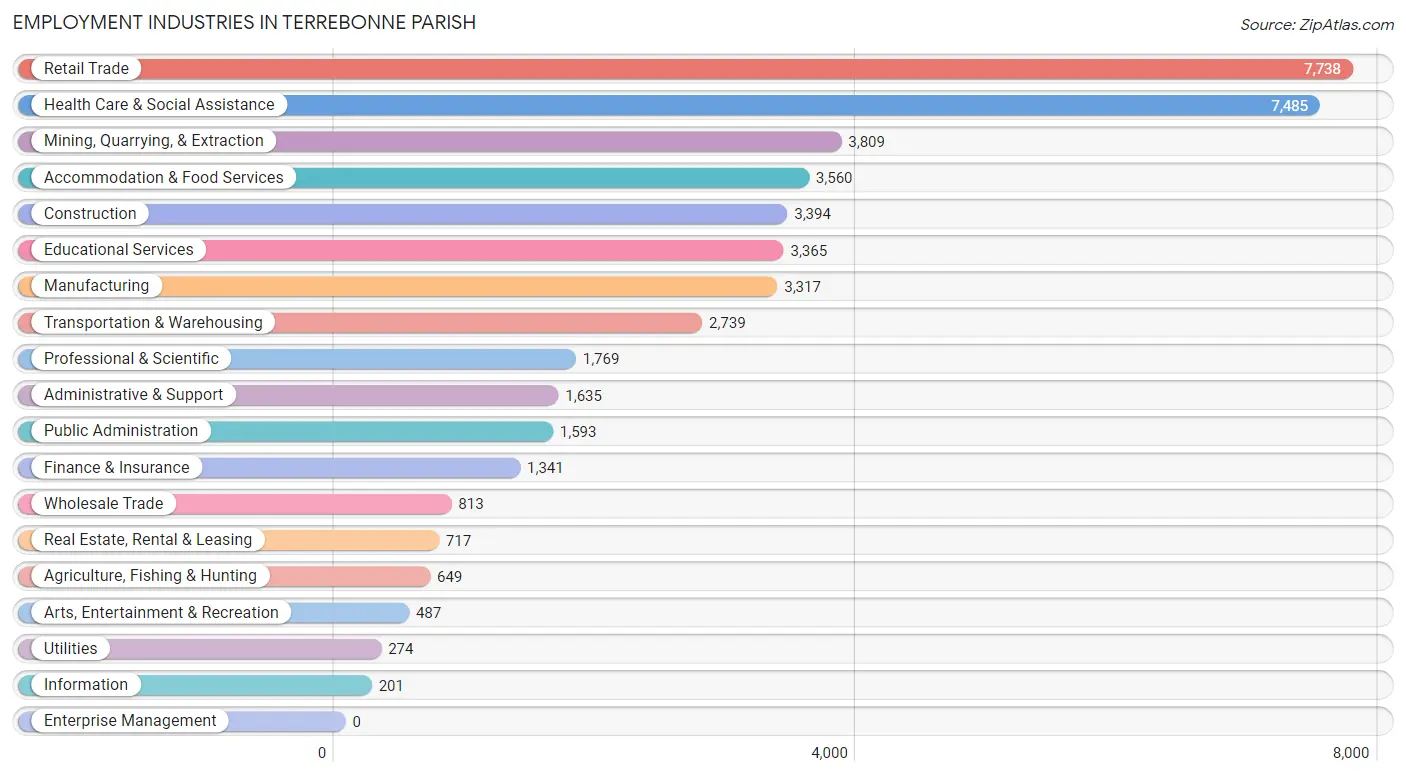
Employment Industries in Terrebonne Parish
The major employment industries in Terrebonne Parish include Retail Trade (7,738 | 16.4%), Health Care & Social Assistance (7,485 | 15.9%), Mining, Quarrying, & Extraction (3,809 | 8.1%), Accommodation & Food Services (3,560 | 7.5%), and Construction (3,394 | 7.2%).
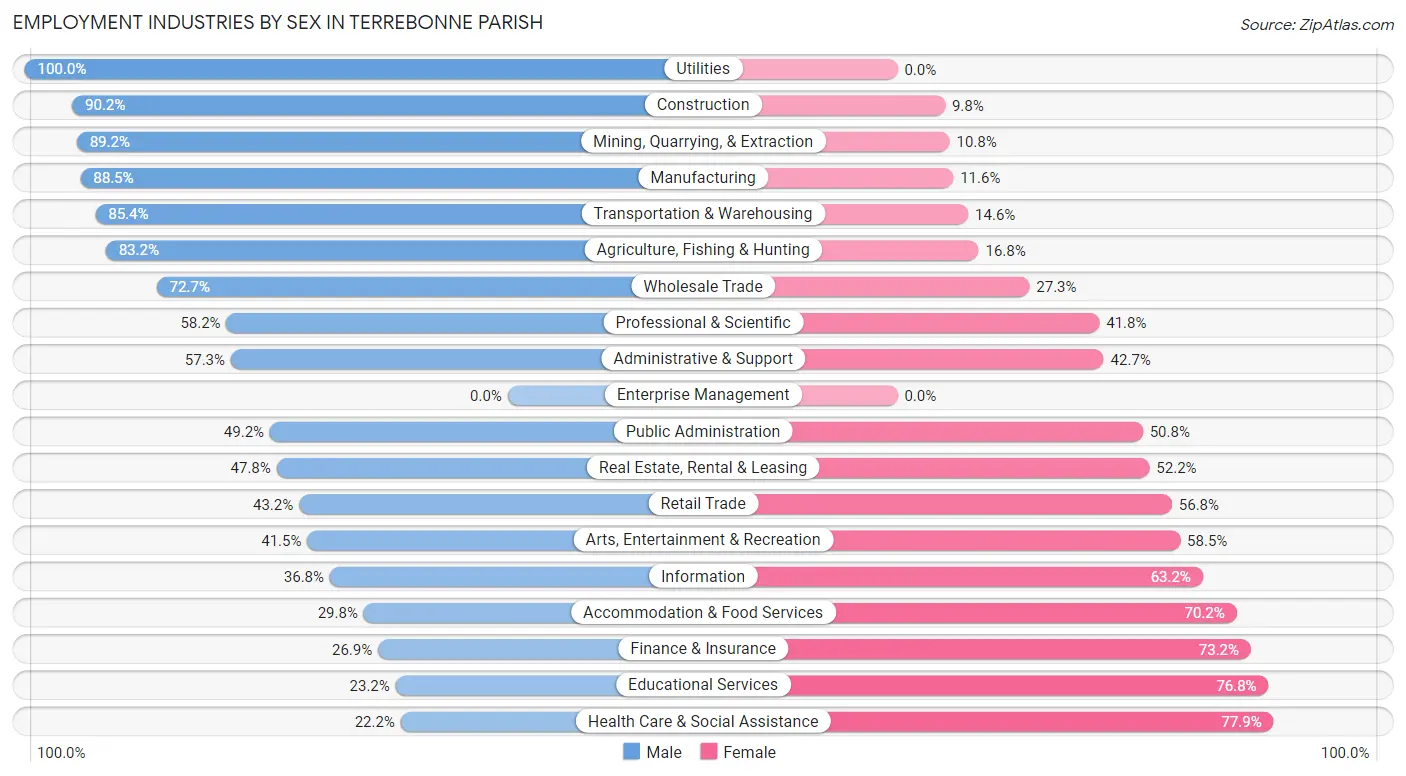
Employment Industries by Sex in Terrebonne Parish
The Terrebonne Parish industries that see more men than women are Utilities (100.0%), Construction (90.2%), and Mining, Quarrying, & Extraction (89.2%), whereas the industries that tend to have a higher number of women are Health Care & Social Assistance (77.8%), Educational Services (76.8%), and Finance & Insurance (73.2%).
| Industry | Male | Female |
| Agriculture, Fishing & Hunting | 540 (83.2%) | 109 (16.8%) |
| Mining, Quarrying, & Extraction | 3,398 (89.2%) | 411 (10.8%) |
| Construction | 3,060 (90.2%) | 334 (9.8%) |
| Manufacturing | 2,934 (88.4%) | 383 (11.6%) |
| Wholesale Trade | 591 (72.7%) | 222 (27.3%) |
| Retail Trade | 3,342 (43.2%) | 4,396 (56.8%) |
| Transportation & Warehousing | 2,338 (85.4%) | 401 (14.6%) |
| Utilities | 274 (100.0%) | 0 (0.0%) |
| Information | 74 (36.8%) | 127 (63.2%) |
| Finance & Insurance | 360 (26.9%) | 981 (73.2%) |
| Real Estate, Rental & Leasing | 343 (47.8%) | 374 (52.2%) |
| Professional & Scientific | 1,030 (58.2%) | 739 (41.8%) |
| Enterprise Management | 0 (0.0%) | 0 (0.0%) |
| Administrative & Support | 937 (57.3%) | 698 (42.7%) |
| Educational Services | 781 (23.2%) | 2,584 (76.8%) |
| Health Care & Social Assistance | 1,658 (22.2%) | 5,827 (77.8%) |
| Arts, Entertainment & Recreation | 202 (41.5%) | 285 (58.5%) |
| Accommodation & Food Services | 1,061 (29.8%) | 2,499 (70.2%) |
| Public Administration | 784 (49.2%) | 809 (50.8%) |
| Total | 25,004 (53.1%) | 22,122 (46.9%) |
Education in Terrebonne Parish
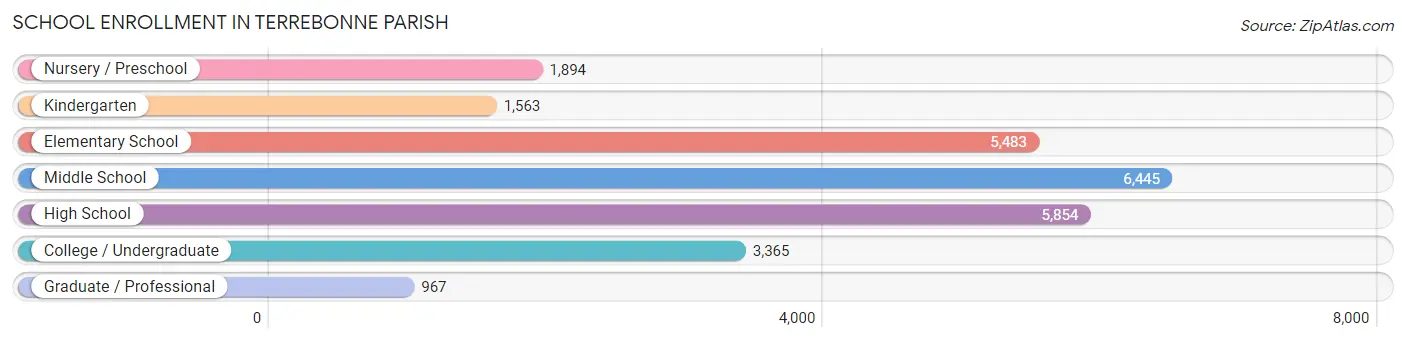
School Enrollment in Terrebonne Parish
The most common levels of schooling among the 25,571 students in Terrebonne Parish are middle school (6,445 | 25.2%), high school (5,854 | 22.9%), and elementary school (5,483 | 21.4%).
| School Level | # Students | % Students |
| Nursery / Preschool | 1,894 | 7.4% |
| Kindergarten | 1,563 | 6.1% |
| Elementary School | 5,483 | 21.4% |
| Middle School | 6,445 | 25.2% |
| High School | 5,854 | 22.9% |
| College / Undergraduate | 3,365 | 13.2% |
| Graduate / Professional | 967 | 3.8% |
| Total | 25,571 | 100.0% |
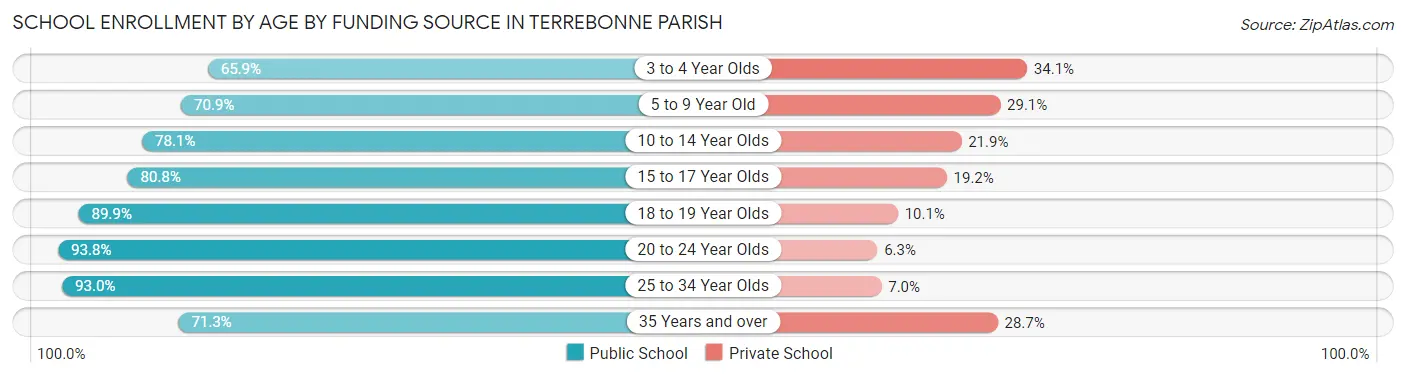
School Enrollment by Age by Funding Source in Terrebonne Parish
Out of a total of 25,571 students who are enrolled in schools in Terrebonne Parish, 5,702 (22.3%) attend a private institution, while the remaining 19,869 (77.7%) are enrolled in public schools. The age group of 3 to 4 year olds has the highest likelihood of being enrolled in private schools, with 529 (34.1% in the age bracket) enrolled. Conversely, the age group of 20 to 24 year olds has the lowest likelihood of being enrolled in a private school, with 870 (93.8% in the age bracket) attending a public institution.
| Age Bracket | Public School | Private School |
| 3 to 4 Year Olds | 1,021 (65.9%) | 529 (34.1%) |
| 5 to 9 Year Old | 4,638 (70.9%) | 1,907 (29.1%) |
| 10 to 14 Year Olds | 6,266 (78.1%) | 1,757 (21.9%) |
| 15 to 17 Year Olds | 3,566 (80.8%) | 846 (19.2%) |
| 18 to 19 Year Olds | 1,394 (89.9%) | 156 (10.1%) |
| 20 to 24 Year Olds | 870 (93.8%) | 58 (6.2%) |
| 25 to 34 Year Olds | 1,222 (93.0%) | 92 (7.0%) |
| 35 Years and over | 891 (71.3%) | 358 (28.7%) |
| Total | 19,869 (77.7%) | 5,702 (22.3%) |
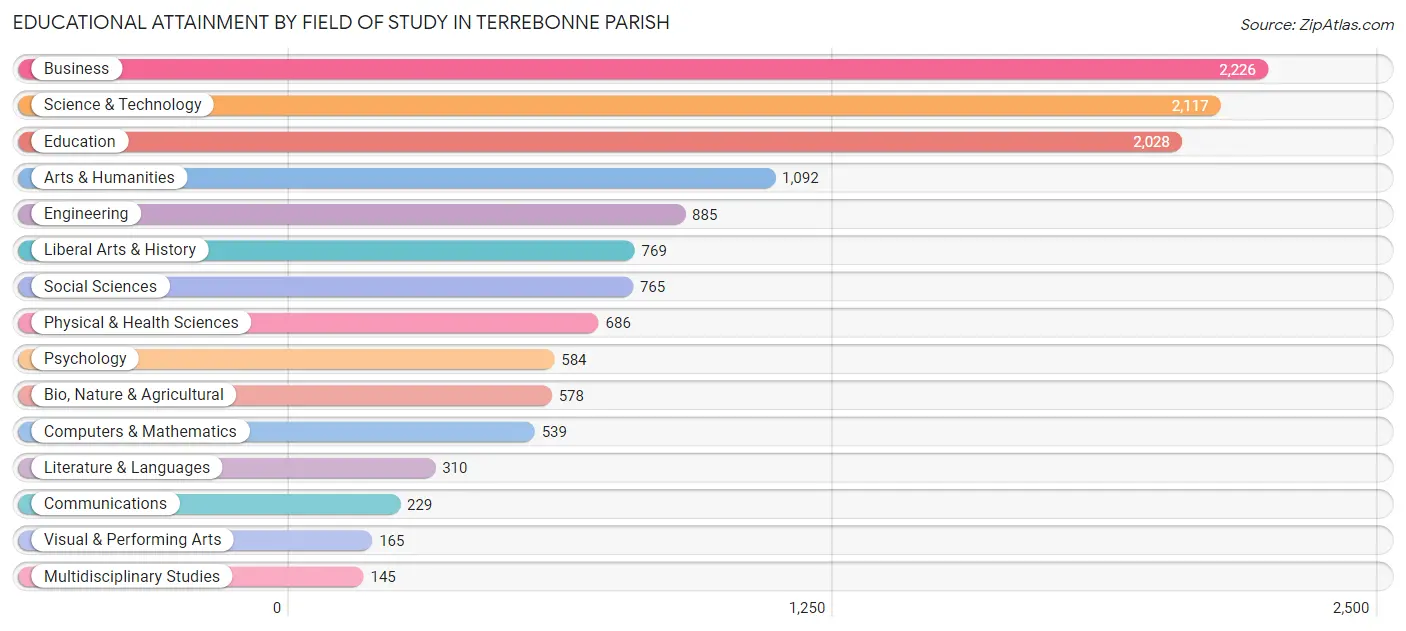
Educational Attainment by Field of Study in Terrebonne Parish
Business (2,226 | 17.0%), science & technology (2,117 | 16.1%), education (2,028 | 15.5%), arts & humanities (1,092 | 8.3%), and engineering (885 | 6.8%) are the most common fields of study among 13,118 individuals in Terrebonne Parish who have obtained a bachelor's degree or higher.
| Field of Study | # Graduates | % Graduates |
| Computers & Mathematics | 539 | 4.1% |
| Bio, Nature & Agricultural | 578 | 4.4% |
| Physical & Health Sciences | 686 | 5.2% |
| Psychology | 584 | 4.4% |
| Social Sciences | 765 | 5.8% |
| Engineering | 885 | 6.8% |
| Multidisciplinary Studies | 145 | 1.1% |
| Science & Technology | 2,117 | 16.1% |
| Business | 2,226 | 17.0% |
| Education | 2,028 | 15.5% |
| Literature & Languages | 310 | 2.4% |
| Liberal Arts & History | 769 | 5.9% |
| Visual & Performing Arts | 165 | 1.3% |
| Communications | 229 | 1.8% |
| Arts & Humanities | 1,092 | 8.3% |
| Total | 13,118 | 100.0% |
Transportation & Commute in Terrebonne Parish
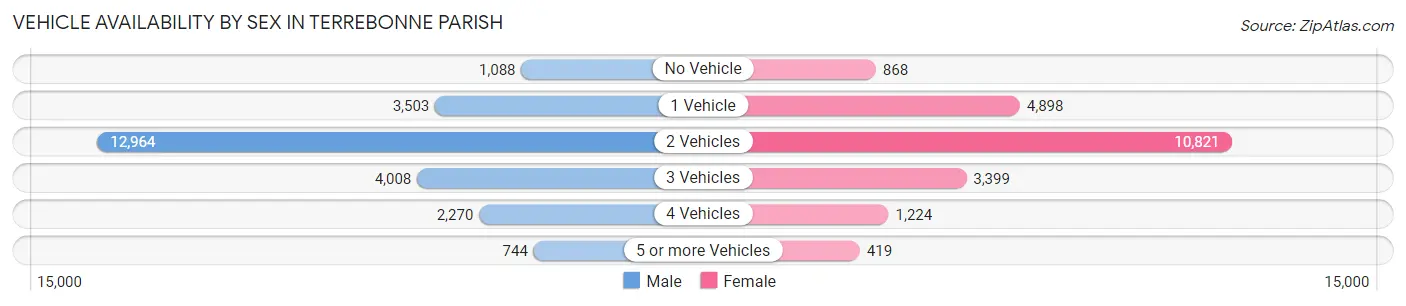
Vehicle Availability by Sex in Terrebonne Parish
The most prevalent vehicle ownership categories in Terrebonne Parish are males with 2 vehicles (12,964, accounting for 52.7%) and females with 2 vehicles (10,821, making up 59.9%).
| Vehicles Available | Male | Female |
| No Vehicle | 1,088 (4.4%) | 868 (4.0%) |
| 1 Vehicle | 3,503 (14.2%) | 4,898 (22.7%) |
| 2 Vehicles | 12,964 (52.7%) | 10,821 (50.0%) |
| 3 Vehicles | 4,008 (16.3%) | 3,399 (15.7%) |
| 4 Vehicles | 2,270 (9.2%) | 1,224 (5.7%) |
| 5 or more Vehicles | 744 (3.0%) | 419 (1.9%) |
| Total | 24,577 (100.0%) | 21,629 (100.0%) |
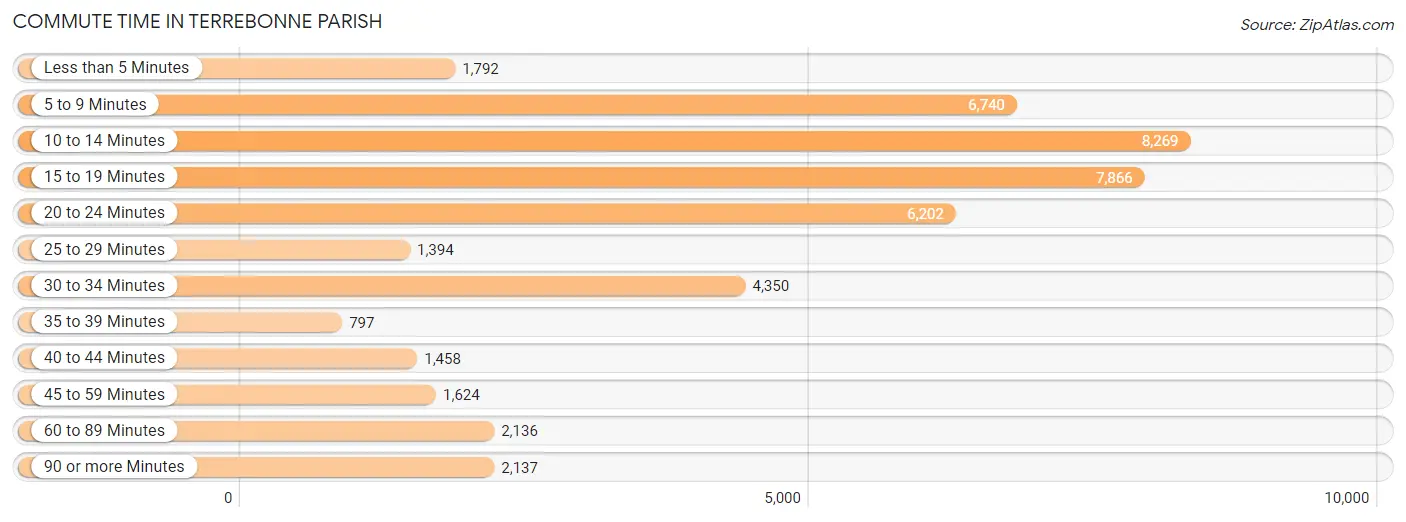
Commute Time in Terrebonne Parish
The most frequently occuring commute durations in Terrebonne Parish are 10 to 14 minutes (8,269 commuters, 18.5%), 15 to 19 minutes (7,866 commuters, 17.6%), and 5 to 9 minutes (6,740 commuters, 15.1%).
| Commute Time | # Commuters | % Commuters |
| Less than 5 Minutes | 1,792 | 4.0% |
| 5 to 9 Minutes | 6,740 | 15.1% |
| 10 to 14 Minutes | 8,269 | 18.5% |
| 15 to 19 Minutes | 7,866 | 17.6% |
| 20 to 24 Minutes | 6,202 | 13.9% |
| 25 to 29 Minutes | 1,394 | 3.1% |
| 30 to 34 Minutes | 4,350 | 9.7% |
| 35 to 39 Minutes | 797 | 1.8% |
| 40 to 44 Minutes | 1,458 | 3.3% |
| 45 to 59 Minutes | 1,624 | 3.6% |
| 60 to 89 Minutes | 2,136 | 4.8% |
| 90 or more Minutes | 2,137 | 4.8% |
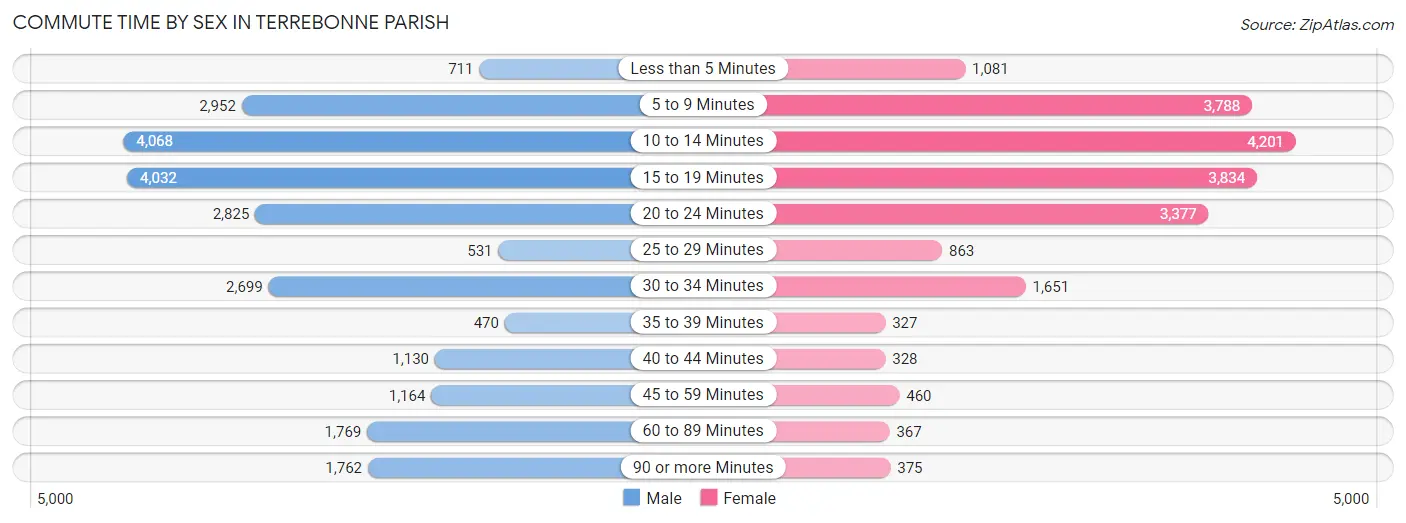
Commute Time by Sex in Terrebonne Parish
The most common commute times in Terrebonne Parish are 10 to 14 minutes (4,068 commuters, 16.9%) for males and 10 to 14 minutes (4,201 commuters, 20.3%) for females.
| Commute Time | Male | Female |
| Less than 5 Minutes | 711 (2.9%) | 1,081 (5.2%) |
| 5 to 9 Minutes | 2,952 (12.2%) | 3,788 (18.3%) |
| 10 to 14 Minutes | 4,068 (16.9%) | 4,201 (20.3%) |
| 15 to 19 Minutes | 4,032 (16.7%) | 3,834 (18.6%) |
| 20 to 24 Minutes | 2,825 (11.7%) | 3,377 (16.4%) |
| 25 to 29 Minutes | 531 (2.2%) | 863 (4.2%) |
| 30 to 34 Minutes | 2,699 (11.2%) | 1,651 (8.0%) |
| 35 to 39 Minutes | 470 (1.9%) | 327 (1.6%) |
| 40 to 44 Minutes | 1,130 (4.7%) | 328 (1.6%) |
| 45 to 59 Minutes | 1,164 (4.8%) | 460 (2.2%) |
| 60 to 89 Minutes | 1,769 (7.3%) | 367 (1.8%) |
| 90 or more Minutes | 1,762 (7.3%) | 375 (1.8%) |
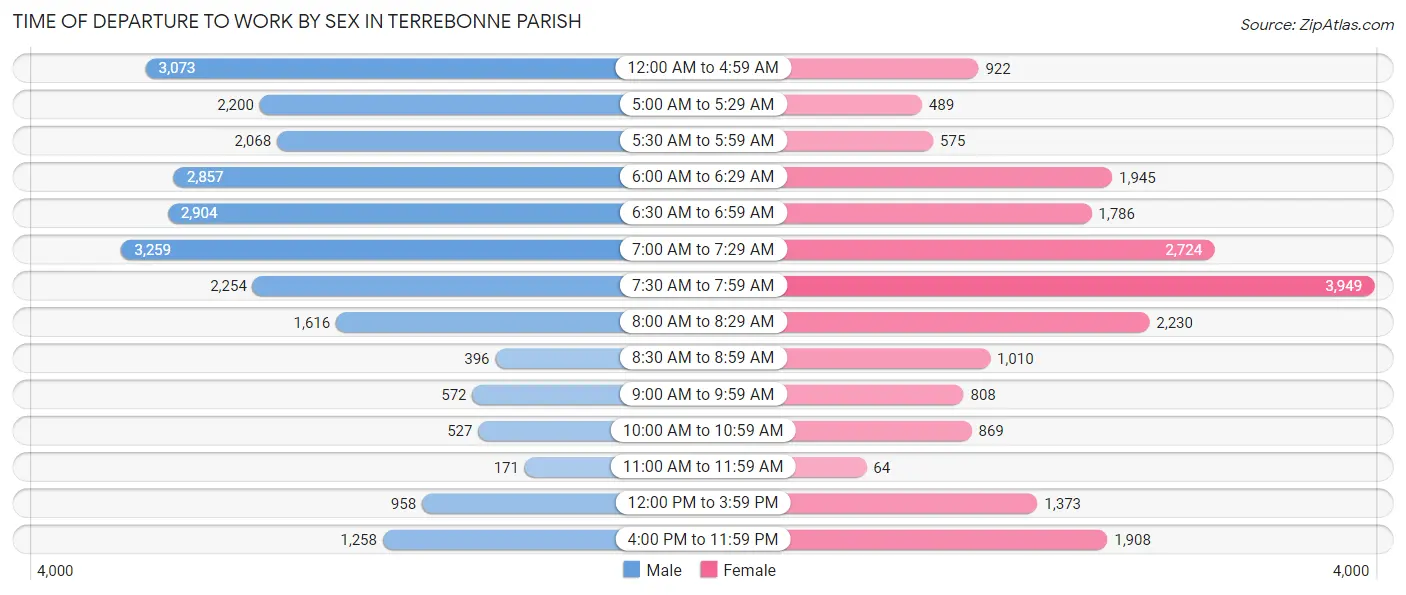
Time of Departure to Work by Sex in Terrebonne Parish
The most frequent times of departure to work in Terrebonne Parish are 7:00 AM to 7:29 AM (3,259, 13.5%) for males and 7:30 AM to 7:59 AM (3,949, 19.1%) for females.
| Time of Departure | Male | Female |
| 12:00 AM to 4:59 AM | 3,073 (12.7%) | 922 (4.5%) |
| 5:00 AM to 5:29 AM | 2,200 (9.1%) | 489 (2.4%) |
| 5:30 AM to 5:59 AM | 2,068 (8.6%) | 575 (2.8%) |
| 6:00 AM to 6:29 AM | 2,857 (11.8%) | 1,945 (9.4%) |
| 6:30 AM to 6:59 AM | 2,904 (12.0%) | 1,786 (8.6%) |
| 7:00 AM to 7:29 AM | 3,259 (13.5%) | 2,724 (13.2%) |
| 7:30 AM to 7:59 AM | 2,254 (9.3%) | 3,949 (19.1%) |
| 8:00 AM to 8:29 AM | 1,616 (6.7%) | 2,230 (10.8%) |
| 8:30 AM to 8:59 AM | 396 (1.6%) | 1,010 (4.9%) |
| 9:00 AM to 9:59 AM | 572 (2.4%) | 808 (3.9%) |
| 10:00 AM to 10:59 AM | 527 (2.2%) | 869 (4.2%) |
| 11:00 AM to 11:59 AM | 171 (0.7%) | 64 (0.3%) |
| 12:00 PM to 3:59 PM | 958 (4.0%) | 1,373 (6.7%) |
| 4:00 PM to 11:59 PM | 1,258 (5.2%) | 1,908 (9.2%) |
| Total | 24,113 (100.0%) | 20,652 (100.0%) |
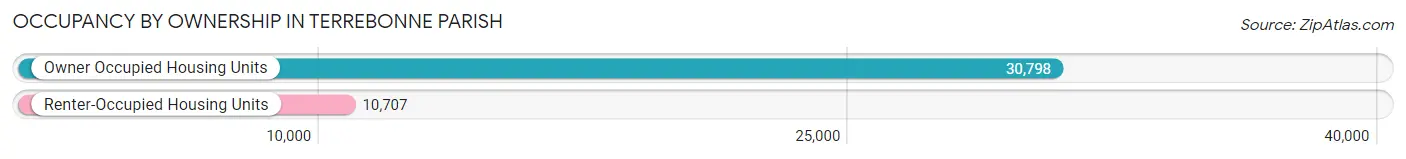
Housing Occupancy in Terrebonne Parish
Occupancy by Ownership in Terrebonne Parish
Of the total 41,505 dwellings in Terrebonne Parish, owner-occupied units account for 30,798 (74.2%), while renter-occupied units make up 10,707 (25.8%).
| Occupancy | # Housing Units | % Housing Units |
| Owner Occupied Housing Units | 30,798 | 74.2% |
| Renter-Occupied Housing Units | 10,707 | 25.8% |
| Total Occupied Housing Units | 41,505 | 100.0% |
Occupancy by Household Size in Terrebonne Parish
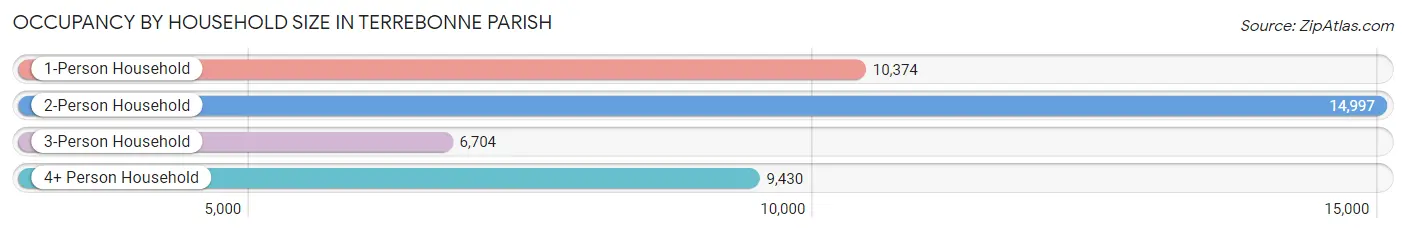
| Household Size | # Housing Units | % Housing Units |
| 1-Person Household | 10,374 | 25.0% |
| 2-Person Household | 14,997 | 36.1% |
| 3-Person Household | 6,704 | 16.2% |
| 4+ Person Household | 9,430 | 22.7% |
| Total Housing Units | 41,505 | 100.0% |
Occupancy by Ownership by Household Size in Terrebonne Parish
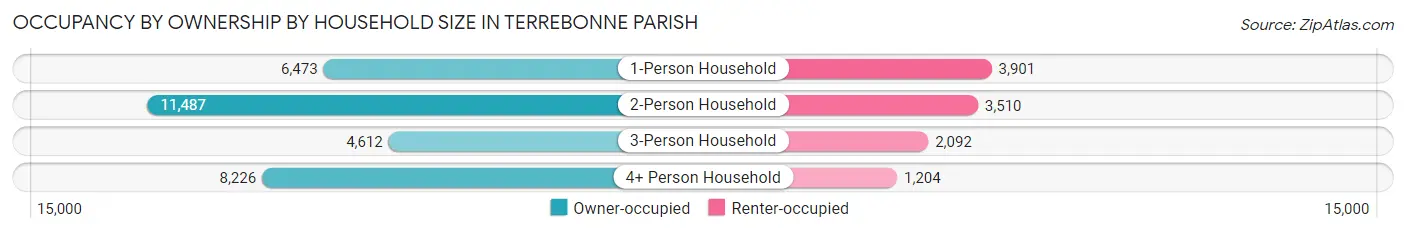
| Household Size | Owner-occupied | Renter-occupied |
| 1-Person Household | 6,473 (62.4%) | 3,901 (37.6%) |
| 2-Person Household | 11,487 (76.6%) | 3,510 (23.4%) |
| 3-Person Household | 4,612 (68.8%) | 2,092 (31.2%) |
| 4+ Person Household | 8,226 (87.2%) | 1,204 (12.8%) |
| Total Housing Units | 30,798 (74.2%) | 10,707 (25.8%) |
Occupancy by Educational Attainment in Terrebonne Parish
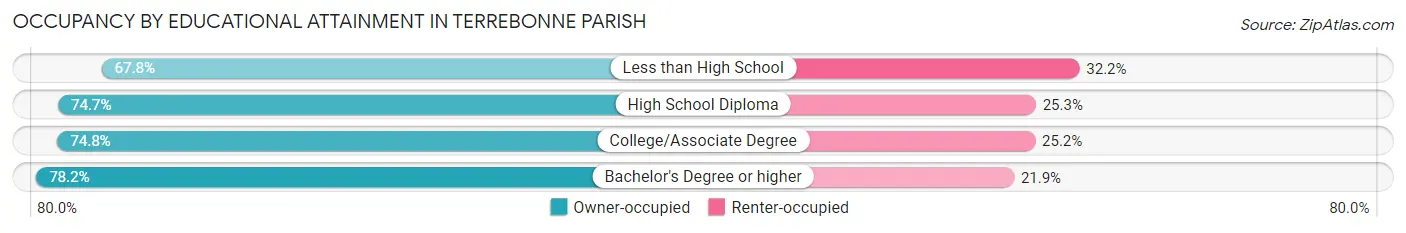
| Household Size | Owner-occupied | Renter-occupied |
| Less than High School | 4,548 (67.8%) | 2,163 (32.2%) |
| High School Diploma | 11,916 (74.7%) | 4,039 (25.3%) |
| College/Associate Degree | 8,645 (74.8%) | 2,914 (25.2%) |
| Bachelor's Degree or higher | 5,689 (78.1%) | 1,591 (21.8%) |
Occupancy by Age of Householder in Terrebonne Parish
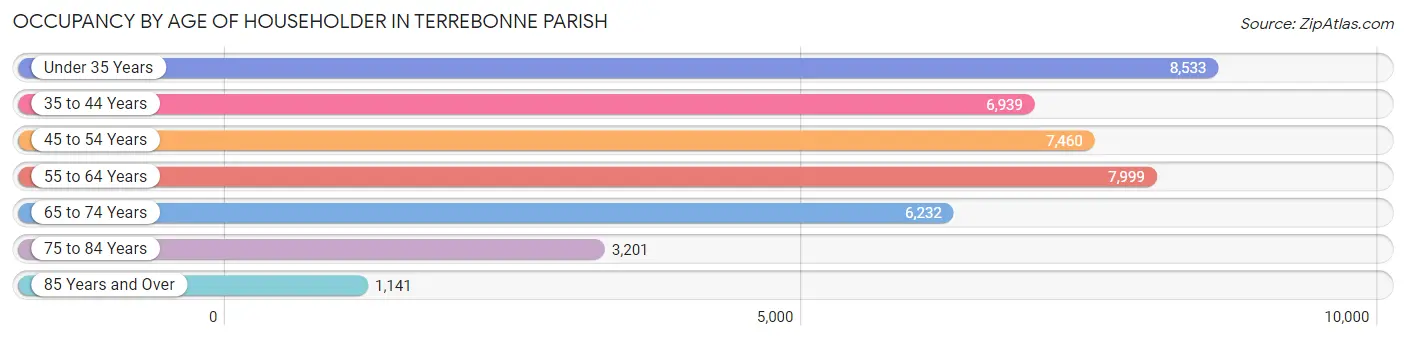
| Age Bracket | # Households | % Households |
| Under 35 Years | 8,533 | 20.6% |
| 35 to 44 Years | 6,939 | 16.7% |
| 45 to 54 Years | 7,460 | 18.0% |
| 55 to 64 Years | 7,999 | 19.3% |
| 65 to 74 Years | 6,232 | 15.0% |
| 75 to 84 Years | 3,201 | 7.7% |
| 85 Years and Over | 1,141 | 2.8% |
| Total | 41,505 | 100.0% |
Housing Finances in Terrebonne Parish
Median Income by Occupancy in Terrebonne Parish
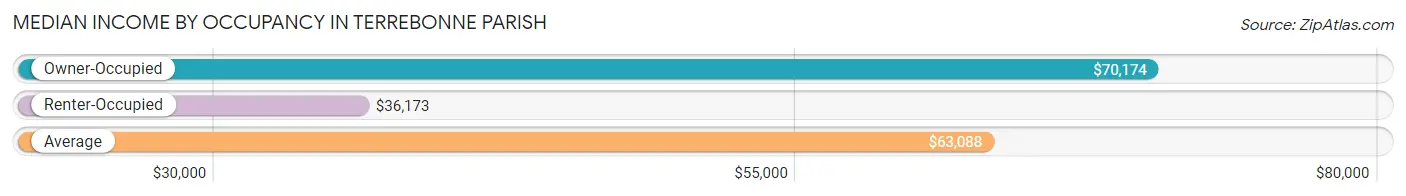
| Occupancy Type | # Households | Median Income |
| Owner-Occupied | 30,798 (74.2%) | $70,174 |
| Renter-Occupied | 10,707 (25.8%) | $36,173 |
| Average | 41,505 (100.0%) | $63,088 |
Occupancy by Householder Income Bracket in Terrebonne Parish
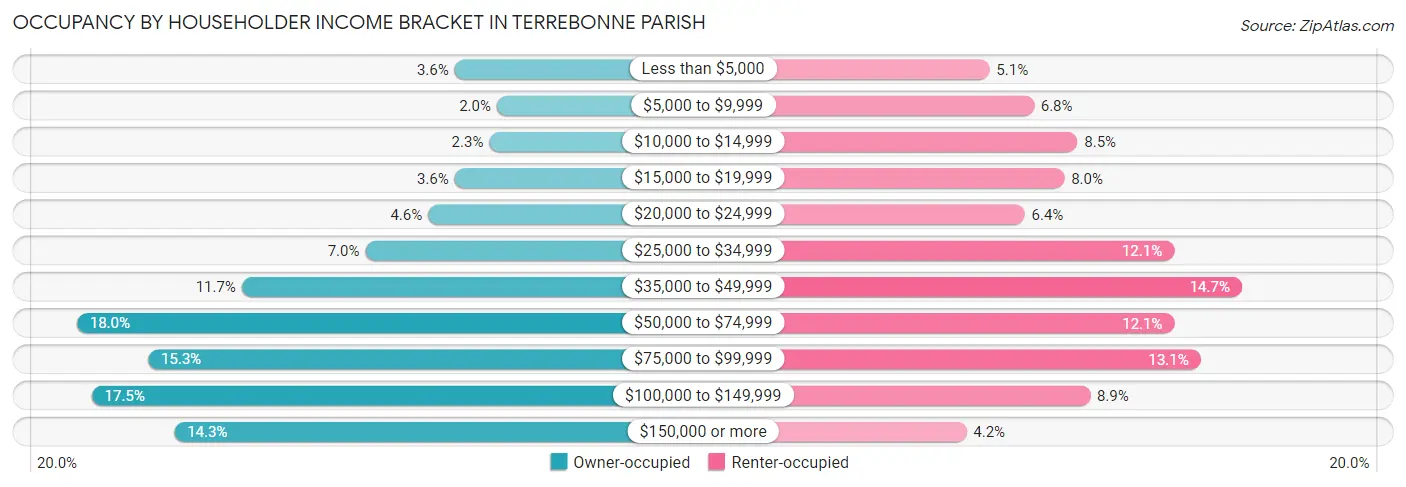
| Income Bracket | Owner-occupied | Renter-occupied |
| Less than $5,000 | 1,116 (3.6%) | 546 (5.1%) |
| $5,000 to $9,999 | 618 (2.0%) | 727 (6.8%) |
| $10,000 to $14,999 | 709 (2.3%) | 905 (8.5%) |
| $15,000 to $19,999 | 1,114 (3.6%) | 851 (8.0%) |
| $20,000 to $24,999 | 1,426 (4.6%) | 689 (6.4%) |
| $25,000 to $34,999 | 2,163 (7.0%) | 1,299 (12.1%) |
| $35,000 to $49,999 | 3,612 (11.7%) | 1,575 (14.7%) |
| $50,000 to $74,999 | 5,548 (18.0%) | 1,300 (12.1%) |
| $75,000 to $99,999 | 4,712 (15.3%) | 1,407 (13.1%) |
| $100,000 to $149,999 | 5,375 (17.4%) | 956 (8.9%) |
| $150,000 or more | 4,405 (14.3%) | 452 (4.2%) |
| Total | 30,798 (100.0%) | 10,707 (100.0%) |
Monthly Housing Cost Tiers in Terrebonne Parish
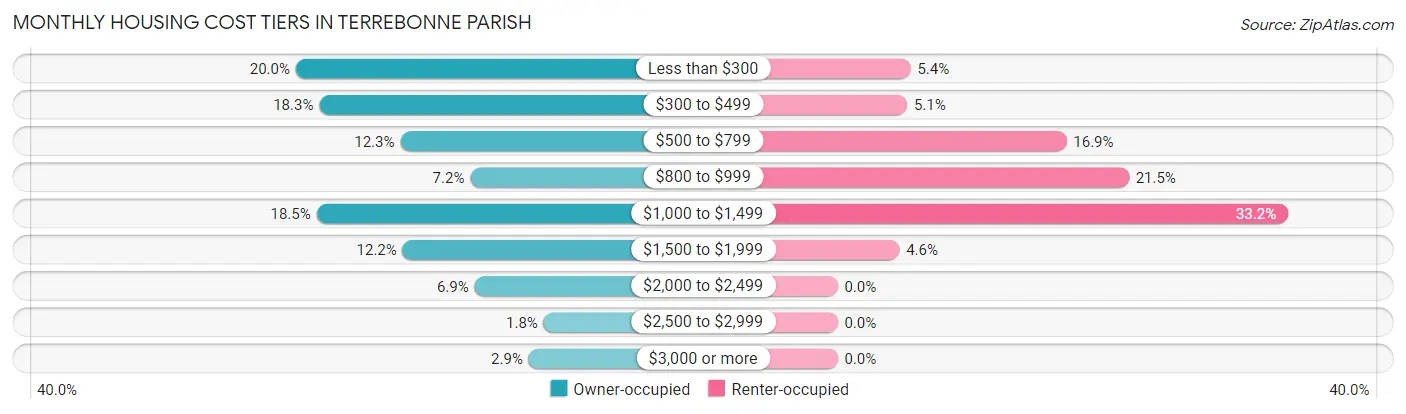
| Monthly Cost | Owner-occupied | Renter-occupied |
| Less than $300 | 6,169 (20.0%) | 576 (5.4%) |
| $300 to $499 | 5,635 (18.3%) | 548 (5.1%) |
| $500 to $799 | 3,798 (12.3%) | 1,805 (16.9%) |
| $800 to $999 | 2,212 (7.2%) | 2,297 (21.4%) |
| $1,000 to $1,499 | 5,697 (18.5%) | 3,553 (33.2%) |
| $1,500 to $1,999 | 3,745 (12.2%) | 487 (4.5%) |
| $2,000 to $2,499 | 2,112 (6.9%) | 0 (0.0%) |
| $2,500 to $2,999 | 545 (1.8%) | 0 (0.0%) |
| $3,000 or more | 885 (2.9%) | 0 (0.0%) |
| Total | 30,798 (100.0%) | 10,707 (100.0%) |
Physical Housing Characteristics in Terrebonne Parish
Housing Structures in Terrebonne Parish
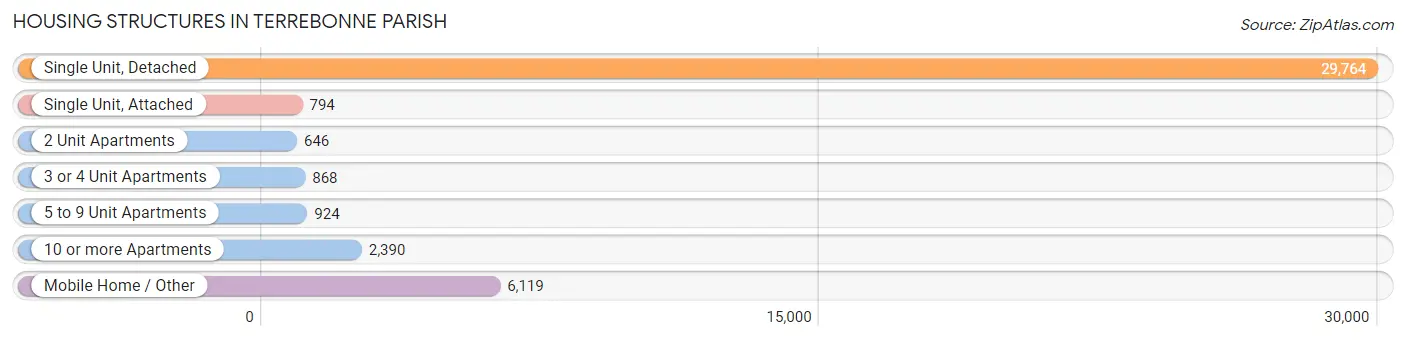
| Structure Type | # Housing Units | % Housing Units |
| Single Unit, Detached | 29,764 | 71.7% |
| Single Unit, Attached | 794 | 1.9% |
| 2 Unit Apartments | 646 | 1.6% |
| 3 or 4 Unit Apartments | 868 | 2.1% |
| 5 to 9 Unit Apartments | 924 | 2.2% |
| 10 or more Apartments | 2,390 | 5.8% |
| Mobile Home / Other | 6,119 | 14.7% |
| Total | 41,505 | 100.0% |
Housing Structures by Occupancy in Terrebonne Parish
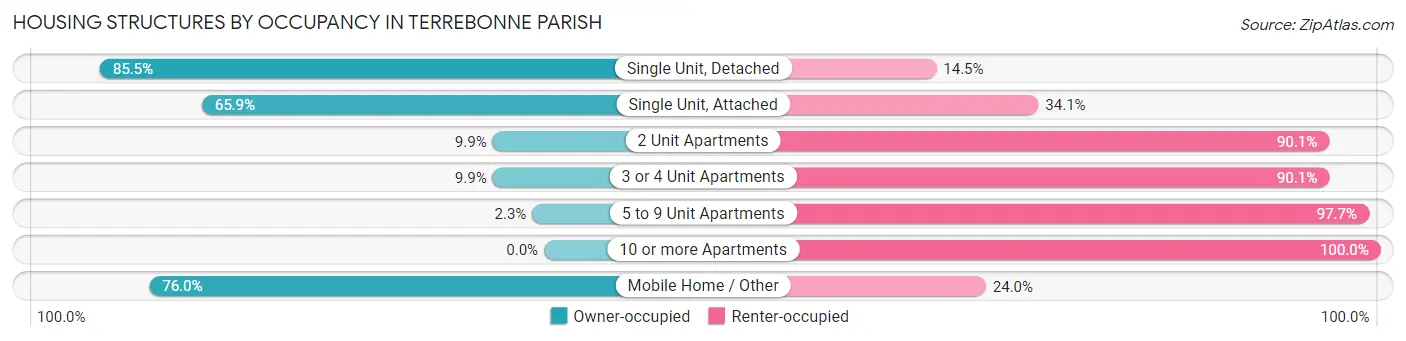
| Structure Type | Owner-occupied | Renter-occupied |
| Single Unit, Detached | 25,454 (85.5%) | 4,310 (14.5%) |
| Single Unit, Attached | 523 (65.9%) | 271 (34.1%) |
| 2 Unit Apartments | 64 (9.9%) | 582 (90.1%) |
| 3 or 4 Unit Apartments | 86 (9.9%) | 782 (90.1%) |
| 5 to 9 Unit Apartments | 21 (2.3%) | 903 (97.7%) |
| 10 or more Apartments | 0 (0.0%) | 2,390 (100.0%) |
| Mobile Home / Other | 4,650 (76.0%) | 1,469 (24.0%) |
| Total | 30,798 (74.2%) | 10,707 (25.8%) |
Housing Structures by Number of Rooms in Terrebonne Parish
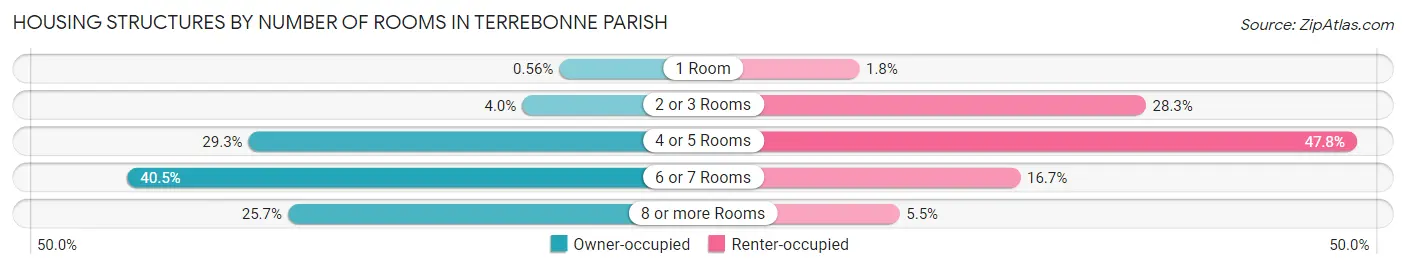
| Number of Rooms | Owner-occupied | Renter-occupied |
| 1 Room | 174 (0.6%) | 189 (1.8%) |
| 2 or 3 Rooms | 1,228 (4.0%) | 3,027 (28.3%) |
| 4 or 5 Rooms | 9,023 (29.3%) | 5,118 (47.8%) |
| 6 or 7 Rooms | 12,471 (40.5%) | 1,784 (16.7%) |
| 8 or more Rooms | 7,902 (25.7%) | 589 (5.5%) |
| Total | 30,798 (100.0%) | 10,707 (100.0%) |
Housing Structure by Heating Type in Terrebonne Parish
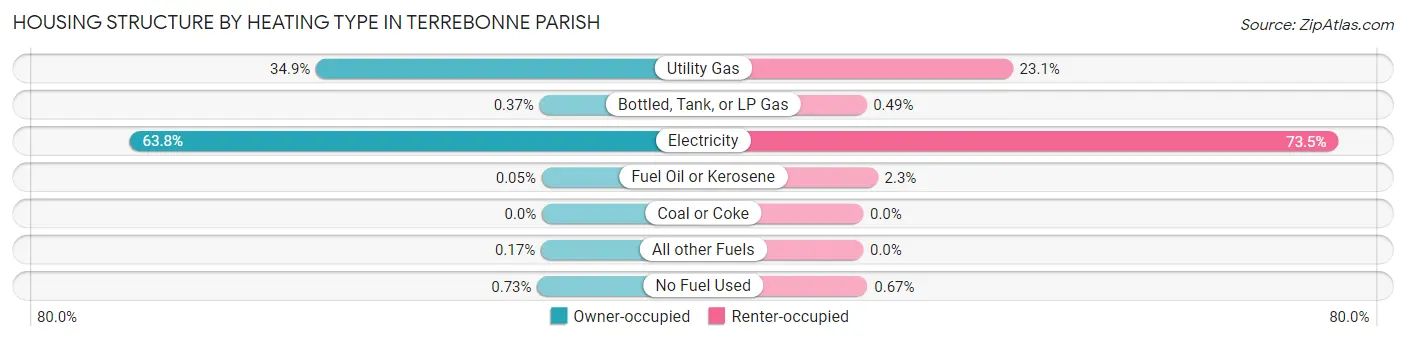
| Heating Type | Owner-occupied | Renter-occupied |
| Utility Gas | 10,758 (34.9%) | 2,476 (23.1%) |
| Bottled, Tank, or LP Gas | 115 (0.4%) | 52 (0.5%) |
| Electricity | 19,634 (63.7%) | 7,866 (73.5%) |
| Fuel Oil or Kerosene | 15 (0.1%) | 241 (2.2%) |
| Coal or Coke | 0 (0.0%) | 0 (0.0%) |
| All other Fuels | 51 (0.2%) | 0 (0.0%) |
| No Fuel Used | 225 (0.7%) | 72 (0.7%) |
| Total | 30,798 (100.0%) | 10,707 (100.0%) |
Household Vehicle Usage in Terrebonne Parish
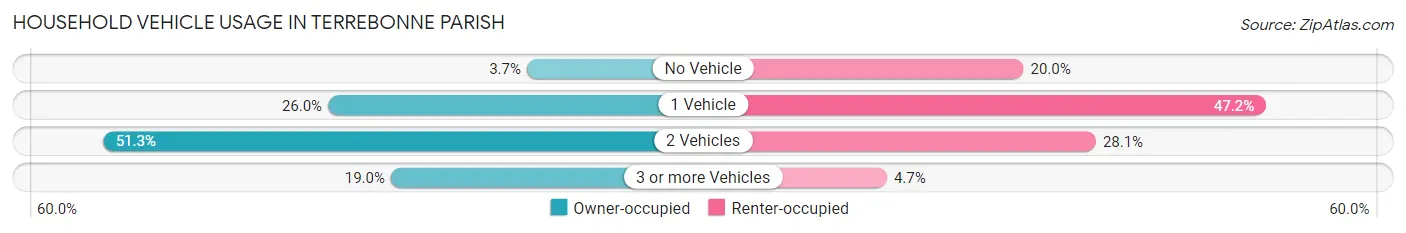
| Vehicles per Household | Owner-occupied | Renter-occupied |
| No Vehicle | 1,152 (3.7%) | 2,142 (20.0%) |
| 1 Vehicle | 8,015 (26.0%) | 5,050 (47.2%) |
| 2 Vehicles | 15,784 (51.2%) | 3,011 (28.1%) |
| 3 or more Vehicles | 5,847 (19.0%) | 504 (4.7%) |
| Total | 30,798 (100.0%) | 10,707 (100.0%) |
Real Estate & Mortgages in Terrebonne Parish
Real Estate and Mortgage Overview in Terrebonne Parish
| Characteristic | Without Mortgage | With Mortgage |
| Housing Units | 15,417 | 15,381 |
| Median Property Value | $151,300 | $203,700 |
| Median Household Income | $53,087 | $2,879 |
| Monthly Housing Costs | $359 | $876 |
| Real Estate Taxes | $544 | $1,890 |
Property Value by Mortgage Status in Terrebonne Parish
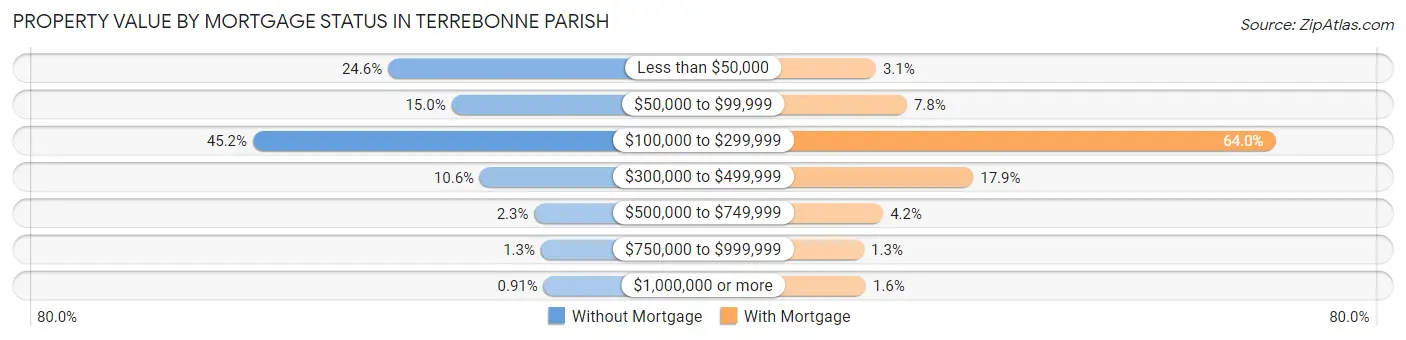
| Property Value | Without Mortgage | With Mortgage |
| Less than $50,000 | 3,797 (24.6%) | 478 (3.1%) |
| $50,000 to $99,999 | 2,305 (14.9%) | 1,206 (7.8%) |
| $100,000 to $299,999 | 6,972 (45.2%) | 9,840 (64.0%) |
| $300,000 to $499,999 | 1,638 (10.6%) | 2,760 (17.9%) |
| $500,000 to $749,999 | 359 (2.3%) | 649 (4.2%) |
| $750,000 to $999,999 | 206 (1.3%) | 202 (1.3%) |
| $1,000,000 or more | 140 (0.9%) | 246 (1.6%) |
| Total | 15,417 (100.0%) | 15,381 (100.0%) |
Household Income by Mortgage Status in Terrebonne Parish
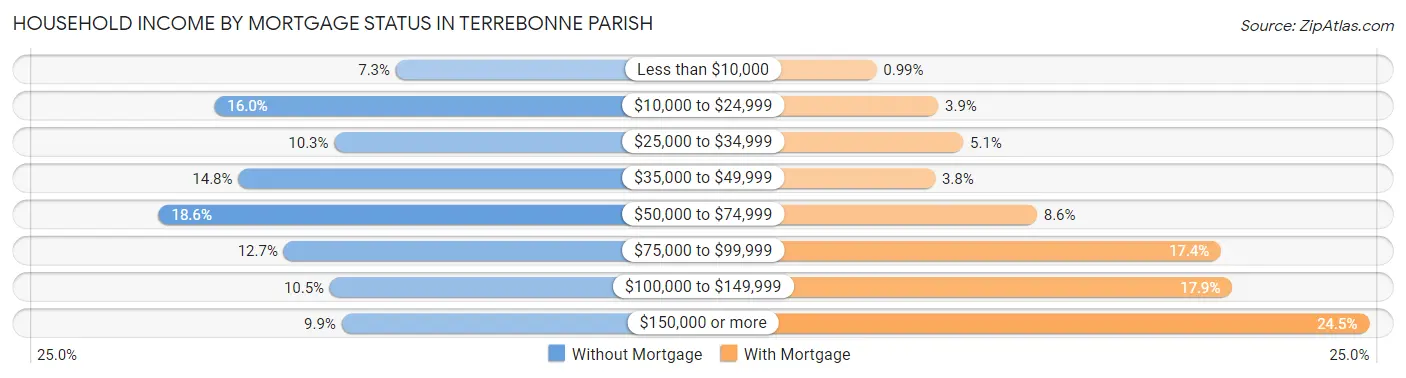
| Household Income | Without Mortgage | With Mortgage |
| Less than $10,000 | 1,129 (7.3%) | 153 (1.0%) |
| $10,000 to $24,999 | 2,461 (16.0%) | 605 (3.9%) |
| $25,000 to $34,999 | 1,581 (10.2%) | 788 (5.1%) |
| $35,000 to $49,999 | 2,285 (14.8%) | 582 (3.8%) |
| $50,000 to $74,999 | 2,870 (18.6%) | 1,327 (8.6%) |
| $75,000 to $99,999 | 1,952 (12.7%) | 2,678 (17.4%) |
| $100,000 to $149,999 | 1,613 (10.5%) | 2,760 (17.9%) |
| $150,000 or more | 1,526 (9.9%) | 3,762 (24.5%) |
| Total | 15,417 (100.0%) | 15,381 (100.0%) |
Property Value to Household Income Ratio in Terrebonne Parish
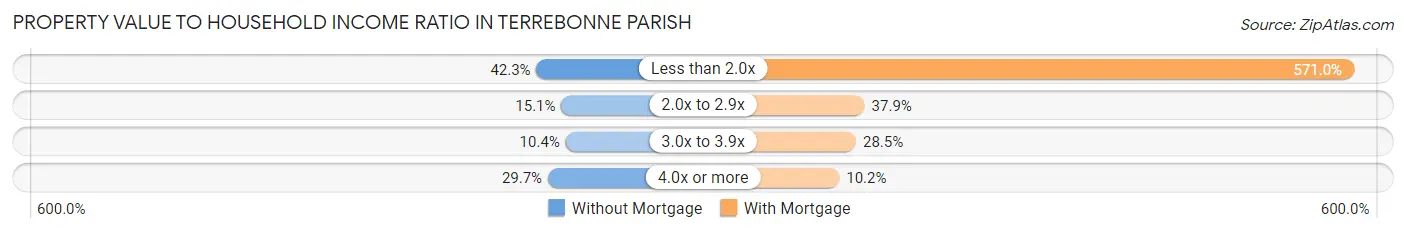
| Value-to-Income Ratio | Without Mortgage | With Mortgage |
| Less than 2.0x | 6,515 (42.3%) | 87,819 (571.0%) |
| 2.0x to 2.9x | 2,327 (15.1%) | 5,827 (37.9%) |
| 3.0x to 3.9x | 1,606 (10.4%) | 4,376 (28.4%) |
| 4.0x or more | 4,585 (29.7%) | 1,573 (10.2%) |
| Total | 15,417 (100.0%) | 15,381 (100.0%) |
Real Estate Taxes by Mortgage Status in Terrebonne Parish
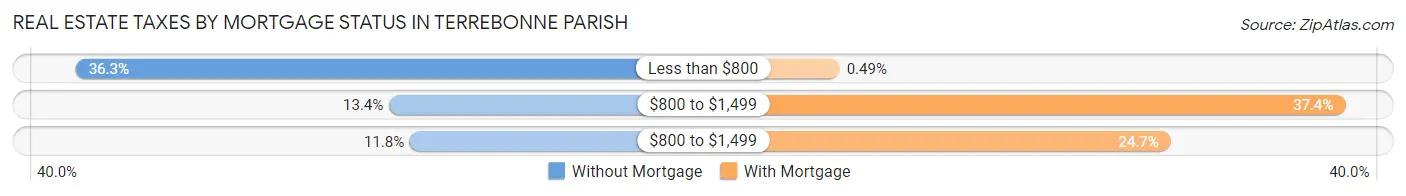
| Property Taxes | Without Mortgage | With Mortgage |
| Less than $800 | 5,590 (36.3%) | 76 (0.5%) |
| $800 to $1,499 | 2,062 (13.4%) | 5,755 (37.4%) |
| $800 to $1,499 | 1,826 (11.8%) | 3,793 (24.7%) |
| Total | 15,417 (100.0%) | 15,381 (100.0%) |
Health & Disability in Terrebonne Parish
Health Insurance Coverage by Age in Terrebonne Parish
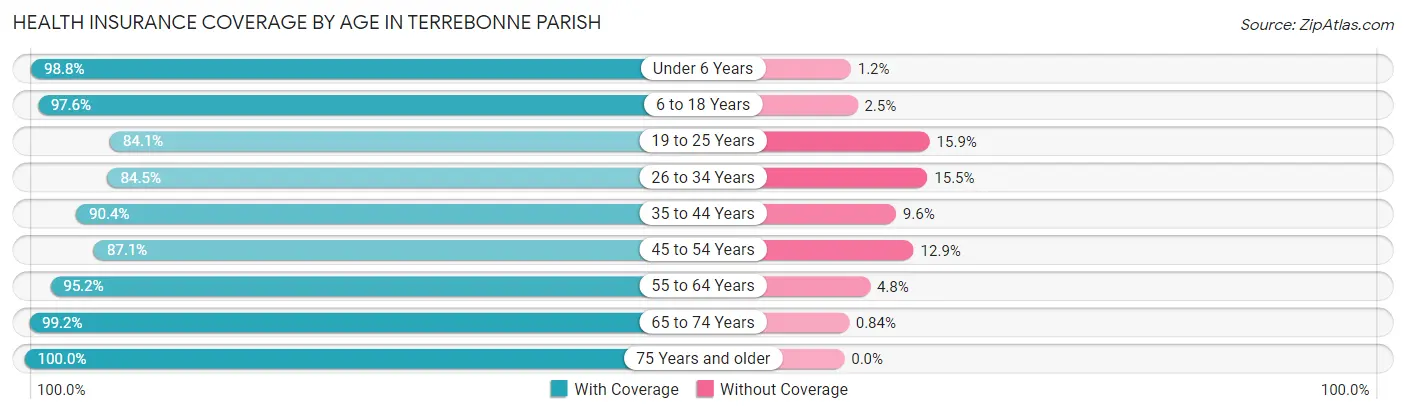
| Age Bracket | With Coverage | Without Coverage |
| Under 6 Years | 8,619 (98.8%) | 106 (1.2%) |
| 6 to 18 Years | 19,197 (97.6%) | 483 (2.5%) |
| 19 to 25 Years | 7,262 (84.1%) | 1,375 (15.9%) |
| 26 to 34 Years | 11,335 (84.5%) | 2,077 (15.5%) |
| 35 to 44 Years | 12,581 (90.4%) | 1,339 (9.6%) |
| 45 to 54 Years | 11,183 (87.1%) | 1,660 (12.9%) |
| 55 to 64 Years | 13,583 (95.2%) | 684 (4.8%) |
| 65 to 74 Years | 9,818 (99.2%) | 83 (0.8%) |
| 75 Years and older | 6,189 (100.0%) | 0 (0.0%) |
| Total | 99,767 (92.7%) | 7,807 (7.3%) |
Health Insurance Coverage by Citizenship Status in Terrebonne Parish
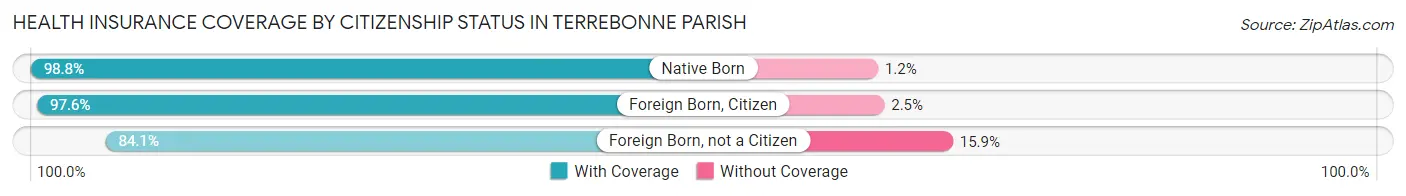
| Citizenship Status | With Coverage | Without Coverage |
| Native Born | 8,619 (98.8%) | 106 (1.2%) |
| Foreign Born, Citizen | 19,197 (97.6%) | 483 (2.5%) |
| Foreign Born, not a Citizen | 7,262 (84.1%) | 1,375 (15.9%) |
Health Insurance Coverage by Household Income in Terrebonne Parish
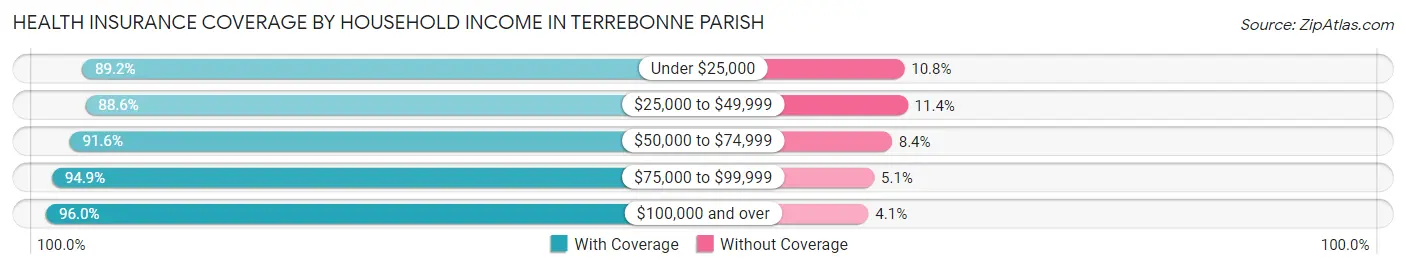
| Household Income | With Coverage | Without Coverage |
| Under $25,000 | 13,912 (89.2%) | 1,679 (10.8%) |
| $25,000 to $49,999 | 16,286 (88.6%) | 2,095 (11.4%) |
| $50,000 to $74,999 | 17,257 (91.6%) | 1,588 (8.4%) |
| $75,000 to $99,999 | 16,704 (94.9%) | 899 (5.1%) |
| $100,000 and over | 35,468 (96.0%) | 1,497 (4.1%) |
Public vs Private Health Insurance Coverage by Age in Terrebonne Parish
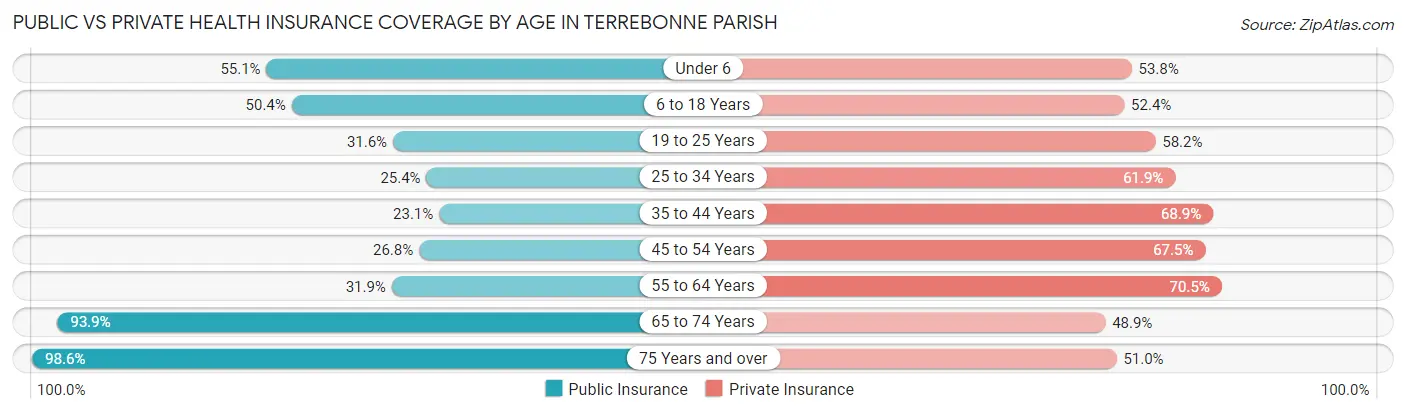
| Age Bracket | Public Insurance | Private Insurance |
| Under 6 | 4,808 (55.1%) | 4,692 (53.8%) |
| 6 to 18 Years | 9,926 (50.4%) | 10,314 (52.4%) |
| 19 to 25 Years | 2,732 (31.6%) | 5,026 (58.2%) |
| 25 to 34 Years | 3,408 (25.4%) | 8,300 (61.9%) |
| 35 to 44 Years | 3,210 (23.1%) | 9,594 (68.9%) |
| 45 to 54 Years | 3,440 (26.8%) | 8,662 (67.4%) |
| 55 to 64 Years | 4,545 (31.9%) | 10,058 (70.5%) |
| 65 to 74 Years | 9,300 (93.9%) | 4,841 (48.9%) |
| 75 Years and over | 6,102 (98.6%) | 3,155 (51.0%) |
| Total | 47,471 (44.1%) | 64,642 (60.1%) |
Disability Status by Sex by Age in Terrebonne Parish
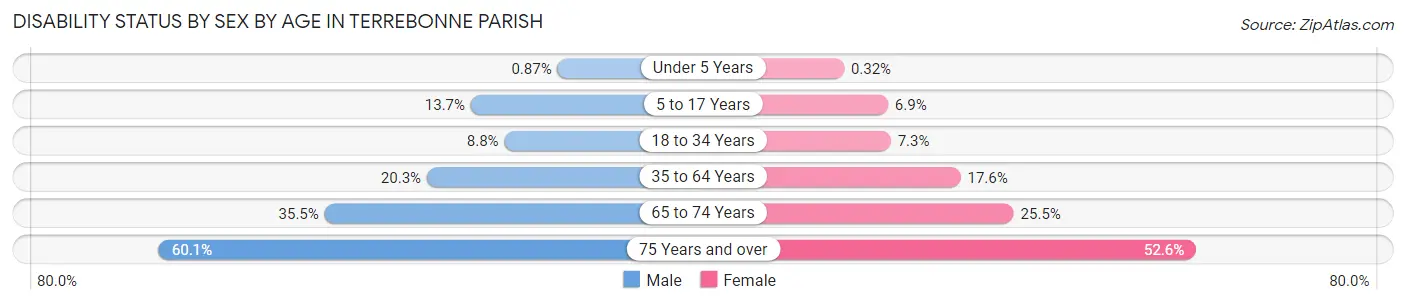
| Age Bracket | Male | Female |
| Under 5 Years | 32 (0.9%) | 11 (0.3%) |
| 5 to 17 Years | 1,426 (13.7%) | 670 (6.9%) |
| 18 to 34 Years | 1,008 (8.7%) | 844 (7.3%) |
| 35 to 64 Years | 4,088 (20.3%) | 3,676 (17.6%) |
| 65 to 74 Years | 1,647 (35.4%) | 1,341 (25.5%) |
| 75 Years and over | 1,543 (60.1%) | 1,904 (52.6%) |
Disability Class by Sex by Age in Terrebonne Parish
Disability Class: Hearing Difficulty
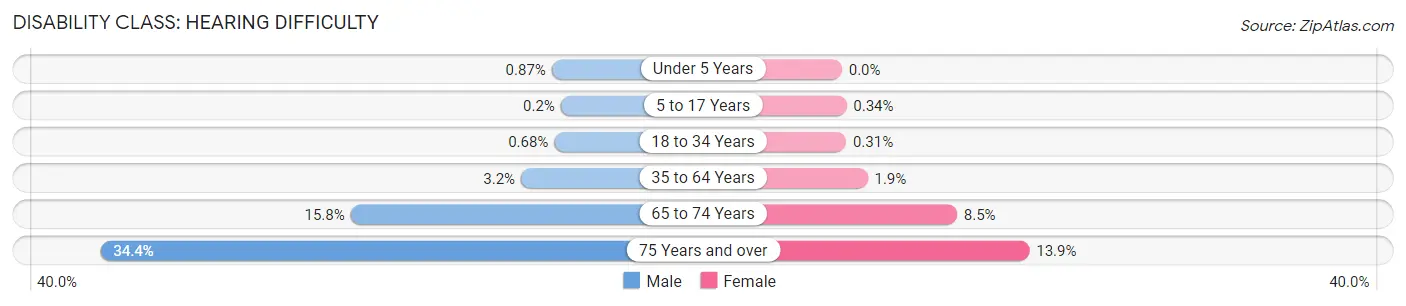
| Age Bracket | Male | Female |
| Under 5 Years | 32 (0.9%) | 0 (0.0%) |
| 5 to 17 Years | 21 (0.2%) | 33 (0.3%) |
| 18 to 34 Years | 78 (0.7%) | 36 (0.3%) |
| 35 to 64 Years | 635 (3.2%) | 398 (1.9%) |
| 65 to 74 Years | 734 (15.8%) | 449 (8.5%) |
| 75 Years and over | 883 (34.4%) | 504 (13.9%) |
Disability Class: Vision Difficulty
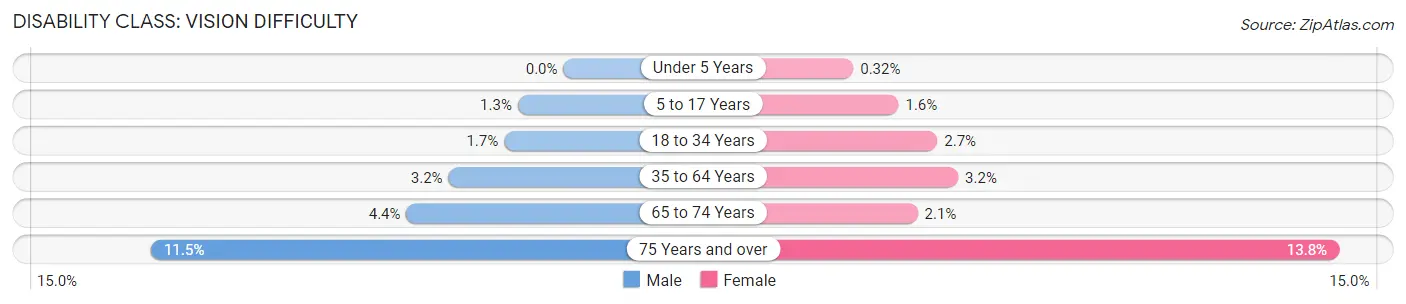
| Age Bracket | Male | Female |
| Under 5 Years | 0 (0.0%) | 11 (0.3%) |
| 5 to 17 Years | 132 (1.3%) | 154 (1.6%) |
| 18 to 34 Years | 190 (1.7%) | 309 (2.7%) |
| 35 to 64 Years | 646 (3.2%) | 676 (3.2%) |
| 65 to 74 Years | 203 (4.4%) | 111 (2.1%) |
| 75 Years and over | 295 (11.5%) | 501 (13.8%) |
Disability Class: Cognitive Difficulty
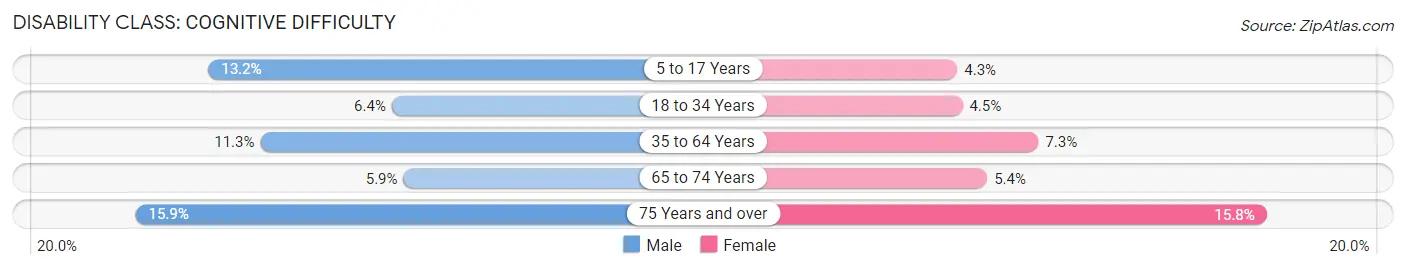
| Age Bracket | Male | Female |
| 5 to 17 Years | 1,369 (13.2%) | 419 (4.3%) |
| 18 to 34 Years | 734 (6.4%) | 520 (4.5%) |
| 35 to 64 Years | 2,271 (11.3%) | 1,522 (7.3%) |
| 65 to 74 Years | 276 (5.9%) | 284 (5.4%) |
| 75 Years and over | 408 (15.9%) | 571 (15.8%) |
Disability Class: Ambulatory Difficulty
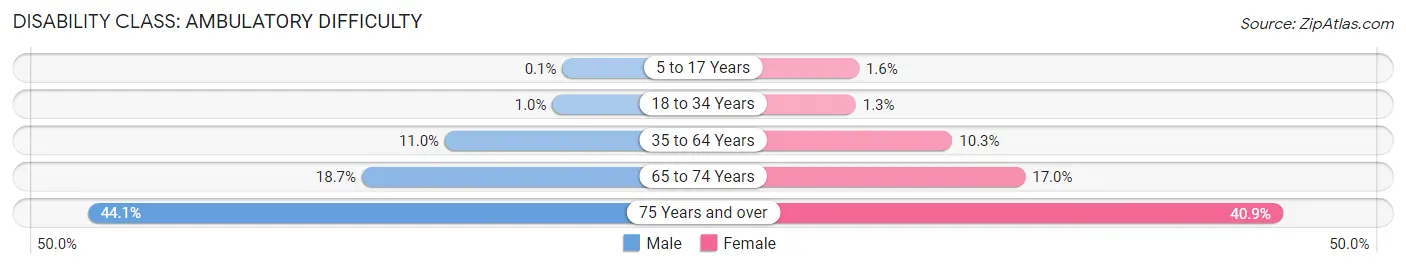
| Age Bracket | Male | Female |
| 5 to 17 Years | 10 (0.1%) | 155 (1.6%) |
| 18 to 34 Years | 117 (1.0%) | 151 (1.3%) |
| 35 to 64 Years | 2,218 (11.0%) | 2,140 (10.3%) |
| 65 to 74 Years | 869 (18.7%) | 895 (17.0%) |
| 75 Years and over | 1,134 (44.1%) | 1,481 (40.9%) |
Disability Class: Self-Care Difficulty
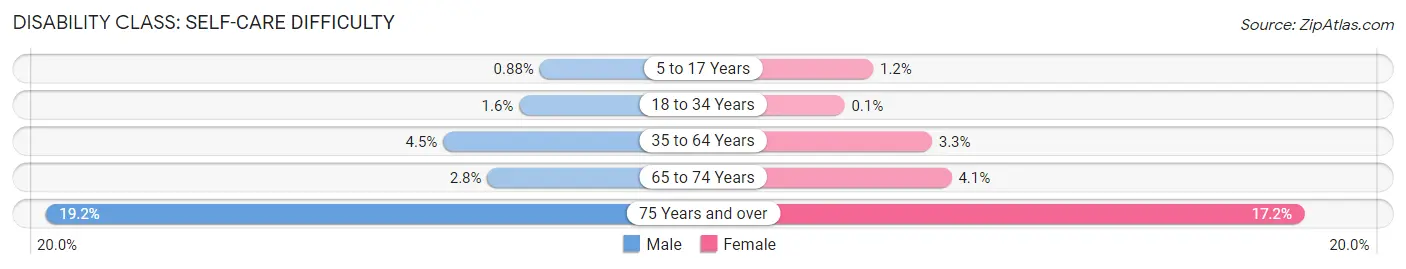
| Age Bracket | Male | Female |
| 5 to 17 Years | 91 (0.9%) | 113 (1.2%) |
| 18 to 34 Years | 189 (1.6%) | 12 (0.1%) |
| 35 to 64 Years | 900 (4.5%) | 697 (3.3%) |
| 65 to 74 Years | 131 (2.8%) | 214 (4.1%) |
| 75 Years and over | 493 (19.2%) | 621 (17.2%) |
Technology Access in Terrebonne Parish
Computing Device Access in Terrebonne Parish
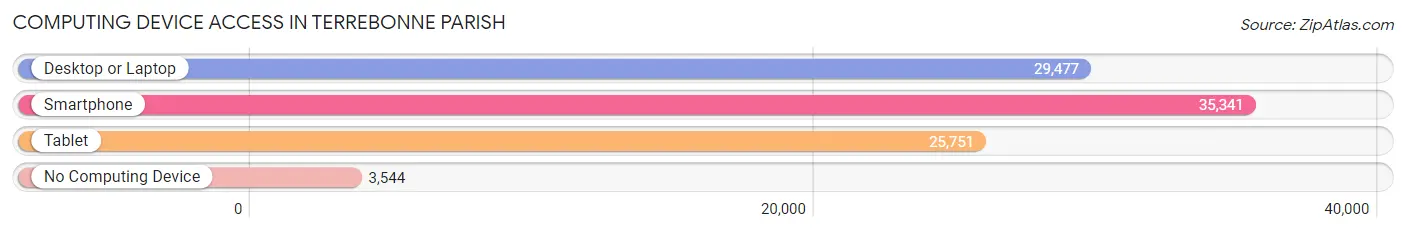
| Device Type | # Households | % Households |
| Desktop or Laptop | 29,477 | 71.0% |
| Smartphone | 35,341 | 85.2% |
| Tablet | 25,751 | 62.0% |
| No Computing Device | 3,544 | 8.5% |
| Total | 41,505 | 100.0% |
Internet Access in Terrebonne Parish
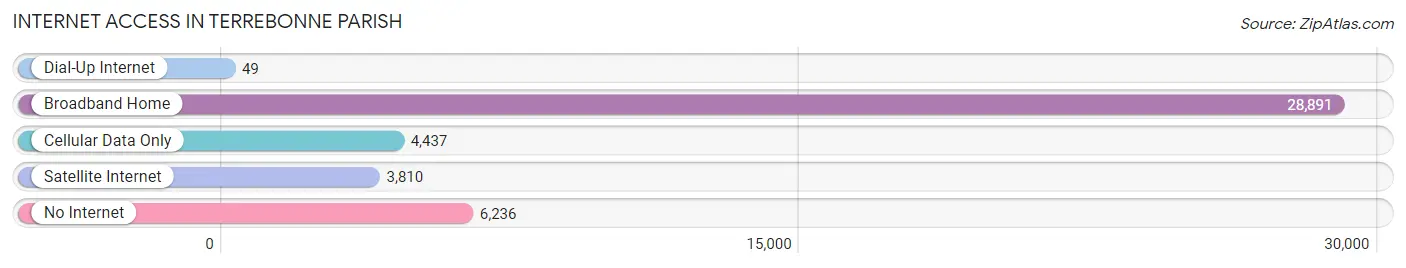
| Internet Type | # Households | % Households |
| Dial-Up Internet | 49 | 0.1% |
| Broadband Home | 28,891 | 69.6% |
| Cellular Data Only | 4,437 | 10.7% |
| Satellite Internet | 3,810 | 9.2% |
| No Internet | 6,236 | 15.0% |
| Total | 41,505 | 100.0% |
Terrebonne Parish Summary
Terrebonne Parish, located in the southeastern part of Louisiana, is a vibrant and diverse community with a rich history, diverse geography, and a strong economy. The parish is home to over 111,000 people, making it the fifth most populous parish in the state. The parish is bordered by Lafourche Parish to the east, St. Mary Parish to the south, and Assumption Parish to the west.
History
Terrebonne Parish was established in 1822, and was named after the French word for “good earth.” The parish was originally part of Lafourche Parish, but was split off in 1822 due to the growing population. The parish was originally inhabited by Native Americans, including the Houma, Choctaw, and Chitimacha tribes. The first European settlers arrived in the area in the late 1700s, and the parish was officially established in 1822.
The parish has a long and rich history, and has been home to many notable figures, including former Louisiana Governor Huey P. Long, who was born in the parish in 1893. The parish has also been home to many famous musicians, including Fats Domino, who was born in the parish in 1928.
Geography
Terrebonne Parish is located in the southeastern part of Louisiana, and is bordered by Lafourche Parish to the east, St. Mary Parish to the south, and Assumption Parish to the west. The parish is located on the Gulf of Mexico, and is home to many bayous, including Bayou Terrebonne, Bayou Black, and Bayou Grand Caillou. The parish is also home to many swamps and marshes, including the Atchafalaya Basin and the Barataria-Terrebonne National Estuary.
The parish has a total area of 1,541 square miles, and is home to many small towns and cities, including Houma, the parish seat, and Thibodaux, the largest city in the parish. The parish is also home to many small unincorporated communities, including Bayou Cane, Bayou Blue, and Montegut.
Economy
Terrebonne Parish has a strong and diverse economy, and is home to many industries, including oil and gas, fishing, and tourism. The parish is home to many oil and gas companies, including Chevron, Shell, and ExxonMobil. The parish is also home to many fishing companies, including Gulf Coast Seafood, which is the largest seafood processor in the state.
The parish is also home to many tourist attractions, including the Houma-Terrebonne Civic Center, the Southdown Plantation House, and the Bayou Terrebonne Waterlife Museum. The parish is also home to many festivals, including the annual Shrimp and Petroleum Festival, which celebrates the parish’s rich history and culture.
Demographics
As of the 2010 census, the population of Terrebonne Parish was 111,860, making it the fifth most populous parish in the state. The population is made up of a diverse mix of ethnicities, including White (63.2%), African American (25.2%), Hispanic or Latino (7.2%), and Asian (2.2%). The median household income in the parish is $45,845, and the median home value is $133,400.
Conclusion
Terrebonne Parish is a vibrant and diverse community with a rich history, diverse geography, and a strong economy. The parish is home to many industries, including oil and gas, fishing, and tourism, and is home to many tourist attractions, including the Houma-Terrebonne Civic Center and the Southdown Plantation House. The population of the parish is made up of a diverse mix of ethnicities, and the median household income is $45,845. Terrebonne Parish is a great place to live, work, and visit, and is sure to continue to be a vibrant and diverse community for years to come.
Common Questions
What is the Total Population of Terrebonne Parish?
Total Population of Terrebonne Parish is 108,862.
What is the Total Male Population of Terrebonne Parish?
Total Male Population of Terrebonne Parish is 53,934.
What is the Total Female Population of Terrebonne Parish?
Total Female Population of Terrebonne Parish is 54,928.
What is the Ratio of Males per 100 Females in Terrebonne Parish?
There are 98.19 Males per 100 Females in Terrebonne Parish.
What is the Ratio of Females per 100 Males in Terrebonne Parish?
There are 101.84 Females per 100 Males in Terrebonne Parish.
What is the Median Population Age in Terrebonne Parish?
Median Population Age in Terrebonne Parish is 36.9 Years.
What is the Average Family Size in Terrebonne Parish
Average Family Size in Terrebonne Parish is 3.1 People.
What is the Average Household Size in Terrebonne Parish
Average Household Size in Terrebonne Parish is 2.6 People.
What is Per Capita Income in Terrebonne Parish?
Per Capita income in Terrebonne Parish is $32,143.
What is the Median Family Income in Terrebonne Parish?
Median Family Income in Terrebonne Parish is $72,340.
What is the Median Household income in Terrebonne Parish?
Median Household Income in Terrebonne Parish is $63,088.
What is Income or Wage Gap in Terrebonne Parish?
Income or Wage Gap in Terrebonne Parish is 48.6%.
Women in Terrebonne Parish earn 51.4 cents for every dollar earned by a man.
What is Family Income Deficit in Terrebonne Parish?
Family Income Deficit in Terrebonne Parish is $9,041.
Families that are below poverty line in Terrebonne Parish earn $9,041 less on average than the poverty threshold level.
What is Inequality or Gini Index in Terrebonne Parish?
Inequality or Gini Index in Terrebonne Parish is 0.47.
How Large is the Labor Force in Terrebonne Parish?
There are 50,267 People in the Labor Forcein in Terrebonne Parish.
What is the Percentage of People in the Labor Force in Terrebonne Parish?
59.3% of People are in the Labor Force in Terrebonne Parish.
What is the Unemployment Rate in Terrebonne Parish?
Unemployment Rate in Terrebonne Parish is 5.9%.