Tangipahoa Parish, LA
Tangipahoa Parish Map
Tangipahoa Parish Overview
133,953
TOTAL POPULATION
65,523
MALE POPULATION
68,430
FEMALE POPULATION
95.75
MALES / 100 FEMALES
104.44
FEMALES / 100 MALES
35.7
MEDIAN AGE
3.3
AVG FAMILY SIZE
2.7
AVG HOUSEHOLD SIZE
$29,192
PER CAPITA INCOME
$69,080
AVG FAMILY INCOME
$55,274
AVG HOUSEHOLD INCOME
35.8%
WAGE / INCOME GAP [ % ]
64.2¢/ $1
WAGE / INCOME GAP [ $ ]
$11,249
FAMILY INCOME DEFICIT
0.47
INEQUALITY / GINI INDEX
61,029
LABOR FORCE [ PEOPLE ]
57.9%
PERCENT IN LABOR FORCE
5.6%
UNEMPLOYMENT RATE
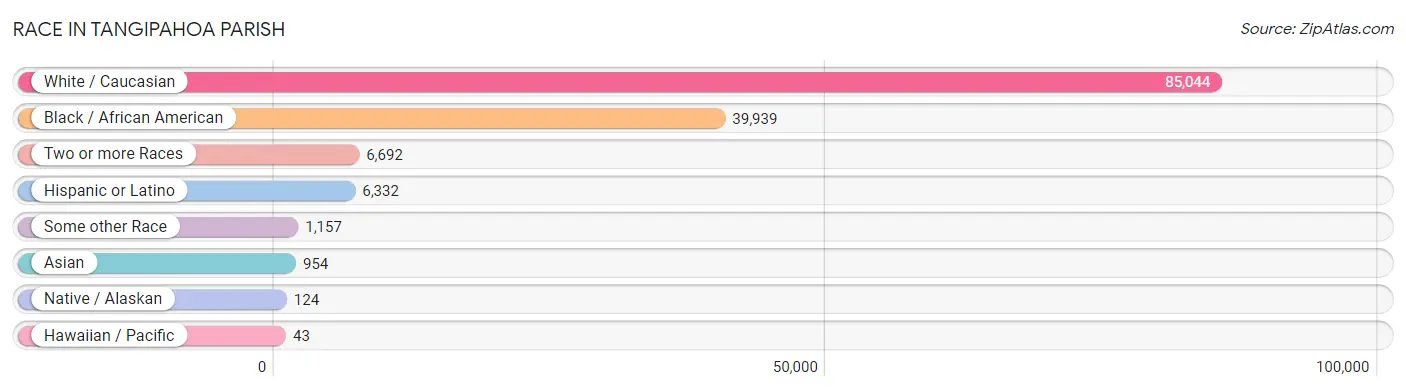
Race in Tangipahoa Parish
The most populous races in Tangipahoa Parish are White / Caucasian (85,044 | 63.5%), Black / African American (39,939 | 29.8%), and Two or more Races (6,692 | 5.0%).
| Race | # Population | % Population |
| Asian | 954 | 0.7% |
| Black / African American | 39,939 | 29.8% |
| Hawaiian / Pacific | 43 | 0.0% |
| Hispanic or Latino | 6,332 | 4.7% |
| Native / Alaskan | 124 | 0.1% |
| White / Caucasian | 85,044 | 63.5% |
| Two or more Races | 6,692 | 5.0% |
| Some other Race | 1,157 | 0.9% |
| Total | 133,953 | 100.0% |
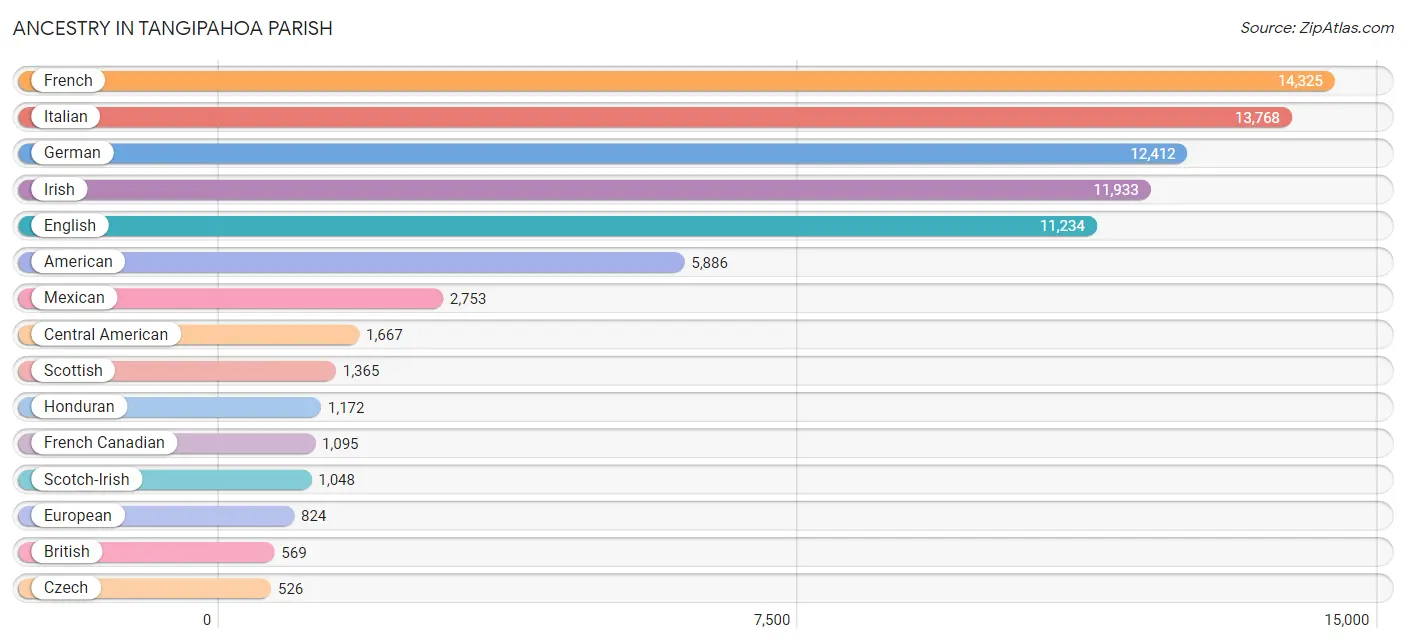
Ancestry in Tangipahoa Parish
The most populous ancestries reported in Tangipahoa Parish are French (14,325 | 10.7%), Italian (13,768 | 10.3%), German (12,412 | 9.3%), Irish (11,933 | 8.9%), and English (11,234 | 8.4%), together accounting for 47.5% of all Tangipahoa Parish residents.
| Ancestry | # Population | % Population |
| African | 139 | 0.1% |
| Alaska Native | 5 | 0.0% |
| Albanian | 9 | 0.0% |
| American | 5,886 | 4.4% |
| Apache | 7 | 0.0% |
| Arab | 331 | 0.3% |
| Austrian | 58 | 0.0% |
| Belgian | 6 | 0.0% |
| Bhutanese | 43 | 0.0% |
| Blackfeet | 44 | 0.0% |
| Brazilian | 62 | 0.1% |
| British | 569 | 0.4% |
| Burmese | 41 | 0.0% |
| Cajun | 496 | 0.4% |
| Central American | 1,667 | 1.2% |
| Central American Indian | 34 | 0.0% |
| Cherokee | 217 | 0.2% |
| Chilean | 21 | 0.0% |
| Choctaw | 126 | 0.1% |
| Colombian | 120 | 0.1% |
| Costa Rican | 7 | 0.0% |
| Croatian | 11 | 0.0% |
| Cuban | 311 | 0.2% |
| Czech | 526 | 0.4% |
| Czechoslovakian | 5 | 0.0% |
| Danish | 23 | 0.0% |
| Dominican | 175 | 0.1% |
| Dutch | 513 | 0.4% |
| Eastern European | 9 | 0.0% |
| English | 11,234 | 8.4% |
| Estonian | 45 | 0.0% |
| European | 824 | 0.6% |
| Filipino | 27 | 0.0% |
| Finnish | 31 | 0.0% |
| French | 14,325 | 10.7% |
| French Canadian | 1,095 | 0.8% |
| German | 12,412 | 9.3% |
| Greek | 152 | 0.1% |
| Guamanian / Chamorro | 12 | 0.0% |
| Guatemalan | 340 | 0.3% |
| Honduran | 1,172 | 0.9% |
| Houma | 103 | 0.1% |
| Hungarian | 396 | 0.3% |
| Icelander | 2 | 0.0% |
| Indian (Asian) | 403 | 0.3% |
| Irish | 11,933 | 8.9% |
| Iroquois | 1 | 0.0% |
| Israeli | 27 | 0.0% |
| Italian | 13,768 | 10.3% |
| Korean | 424 | 0.3% |
| Lebanese | 39 | 0.0% |
| Lithuanian | 132 | 0.1% |
| Mexican | 2,753 | 2.1% |
| Mexican American Indian | 62 | 0.1% |
| Nicaraguan | 12 | 0.0% |
| Nigerian | 36 | 0.0% |
| Norwegian | 290 | 0.2% |
| Palestinian | 190 | 0.1% |
| Pennsylvania German | 18 | 0.0% |
| Peruvian | 62 | 0.1% |
| Polish | 413 | 0.3% |
| Portuguese | 1 | 0.0% |
| Puerto Rican | 467 | 0.4% |
| Romanian | 149 | 0.1% |
| Russian | 306 | 0.2% |
| Salvadoran | 136 | 0.1% |
| Samoan | 48 | 0.0% |
| Scandinavian | 295 | 0.2% |
| Scotch-Irish | 1,048 | 0.8% |
| Scottish | 1,365 | 1.0% |
| Serbian | 144 | 0.1% |
| Sioux | 11 | 0.0% |
| Slavic | 28 | 0.0% |
| South American | 203 | 0.2% |
| Spaniard | 267 | 0.2% |
| Spanish | 333 | 0.3% |
| Spanish American | 21 | 0.0% |
| Sri Lankan | 310 | 0.2% |
| Subsaharan African | 195 | 0.2% |
| Swedish | 105 | 0.1% |
| Swiss | 173 | 0.1% |
| Syrian | 33 | 0.0% |
| Thai | 153 | 0.1% |
| Turkish | 119 | 0.1% |
| Ukrainian | 4 | 0.0% |
| Welsh | 341 | 0.3% |
| West Indian | 24 | 0.0% |
| Yugoslavian | 2 | 0.0% | View All 88 Rows |
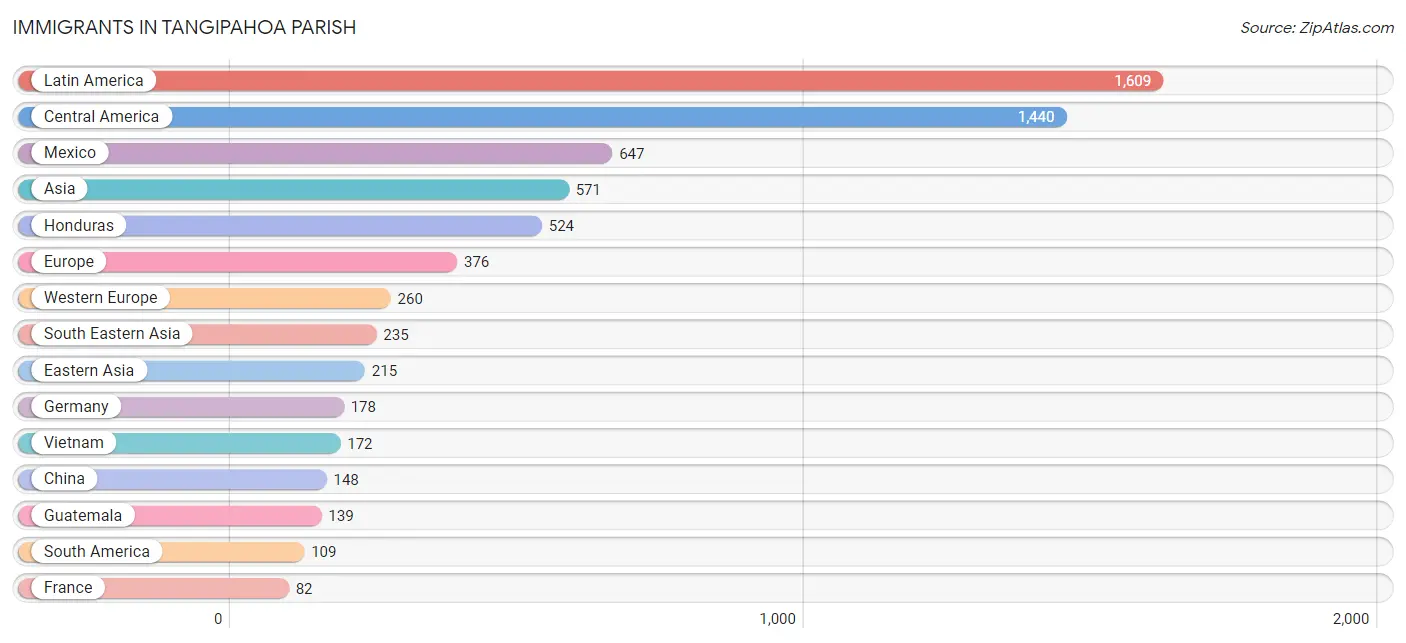
Immigrants in Tangipahoa Parish
The most numerous immigrant groups reported in Tangipahoa Parish came from Latin America (1,609 | 1.2%), Central America (1,440 | 1.1%), Mexico (647 | 0.5%), Asia (571 | 0.4%), and Honduras (524 | 0.4%), together accounting for 3.6% of all Tangipahoa Parish residents.
| Immigration Origin | # Population | % Population |
| Africa | 67 | 0.1% |
| Armenia | 5 | 0.0% |
| Asia | 571 | 0.4% |
| Belize | 1 | 0.0% |
| Brazil | 54 | 0.0% |
| Caribbean | 60 | 0.0% |
| Central America | 1,440 | 1.1% |
| China | 148 | 0.1% |
| Colombia | 55 | 0.0% |
| Cuba | 1 | 0.0% |
| Dominican Republic | 59 | 0.0% |
| Eastern Africa | 15 | 0.0% |
| Eastern Asia | 215 | 0.2% |
| Eastern Europe | 16 | 0.0% |
| El Salvador | 73 | 0.1% |
| Ethiopia | 15 | 0.0% |
| Europe | 376 | 0.3% |
| France | 82 | 0.1% |
| Germany | 178 | 0.1% |
| Greece | 21 | 0.0% |
| Guatemala | 139 | 0.1% |
| Honduras | 524 | 0.4% |
| India | 76 | 0.1% |
| Japan | 43 | 0.0% |
| Korea | 24 | 0.0% |
| Latin America | 1,609 | 1.2% |
| Mexico | 647 | 0.5% |
| Nicaragua | 56 | 0.0% |
| Nigeria | 36 | 0.0% |
| Northern Europe | 58 | 0.0% |
| Philippines | 63 | 0.1% |
| South Africa | 16 | 0.0% |
| South America | 109 | 0.1% |
| South Central Asia | 76 | 0.1% |
| South Eastern Asia | 235 | 0.2% |
| Southern Europe | 42 | 0.0% |
| Spain | 21 | 0.0% |
| Taiwan | 55 | 0.0% |
| Ukraine | 11 | 0.0% |
| Vietnam | 172 | 0.1% |
| Western Africa | 36 | 0.0% |
| Western Asia | 5 | 0.0% |
| Western Europe | 260 | 0.2% | View All 43 Rows |
Sex and Age in Tangipahoa Parish
Sex and Age in Tangipahoa Parish
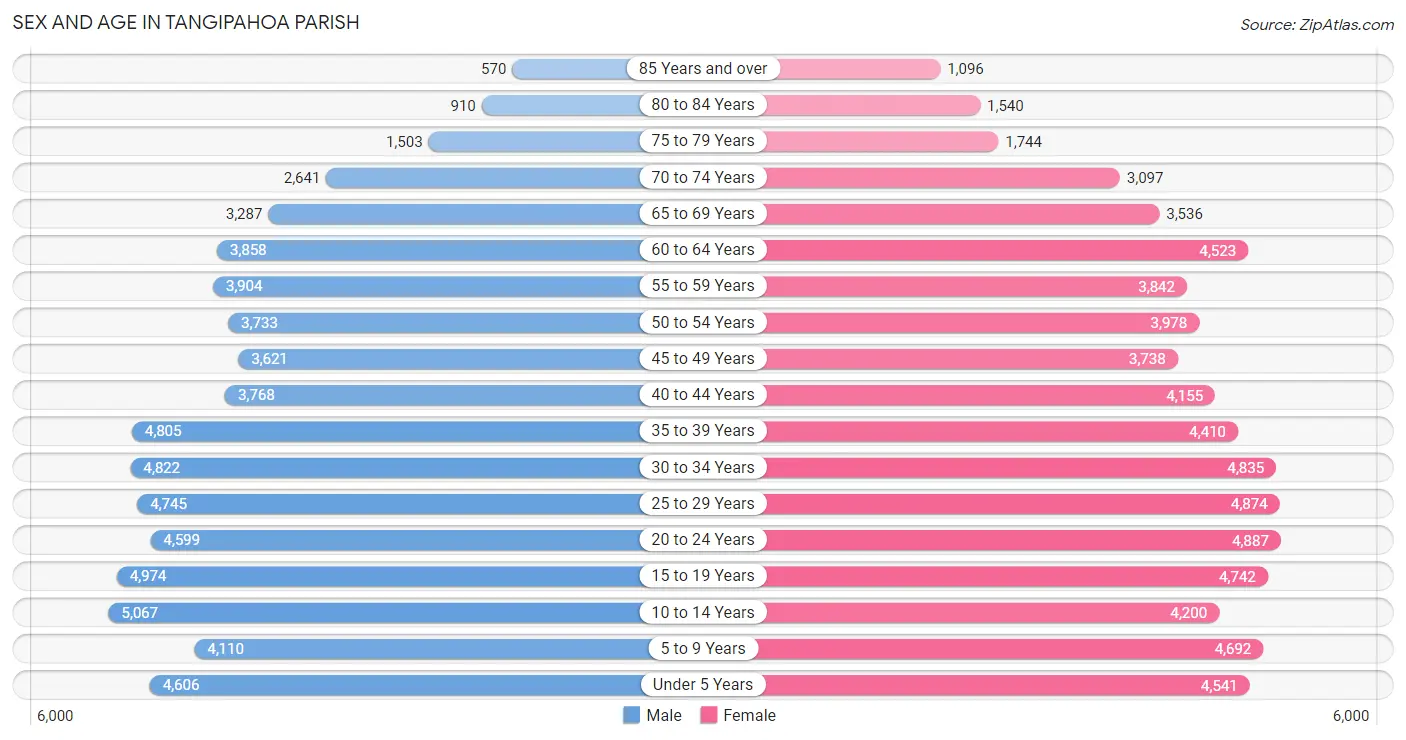
The most populous age groups in Tangipahoa Parish are 10 to 14 Years (5,067 | 7.7%) for men and 20 to 24 Years (4,887 | 7.1%) for women.
| Age Bracket | Male | Female |
| Under 5 Years | 4,606 (7.0%) | 4,541 (6.6%) |
| 5 to 9 Years | 4,110 (6.3%) | 4,692 (6.9%) |
| 10 to 14 Years | 5,067 (7.7%) | 4,200 (6.1%) |
| 15 to 19 Years | 4,974 (7.6%) | 4,742 (6.9%) |
| 20 to 24 Years | 4,599 (7.0%) | 4,887 (7.1%) |
| 25 to 29 Years | 4,745 (7.2%) | 4,874 (7.1%) |
| 30 to 34 Years | 4,822 (7.4%) | 4,835 (7.1%) |
| 35 to 39 Years | 4,805 (7.3%) | 4,410 (6.4%) |
| 40 to 44 Years | 3,768 (5.8%) | 4,155 (6.1%) |
| 45 to 49 Years | 3,621 (5.5%) | 3,738 (5.5%) |
| 50 to 54 Years | 3,733 (5.7%) | 3,978 (5.8%) |
| 55 to 59 Years | 3,904 (6.0%) | 3,842 (5.6%) |
| 60 to 64 Years | 3,858 (5.9%) | 4,523 (6.6%) |
| 65 to 69 Years | 3,287 (5.0%) | 3,536 (5.2%) |
| 70 to 74 Years | 2,641 (4.0%) | 3,097 (4.5%) |
| 75 to 79 Years | 1,503 (2.3%) | 1,744 (2.5%) |
| 80 to 84 Years | 910 (1.4%) | 1,540 (2.2%) |
| 85 Years and over | 570 (0.9%) | 1,096 (1.6%) |
| Total | 65,523 (100.0%) | 68,430 (100.0%) |
Families and Households in Tangipahoa Parish
Median Family Size in Tangipahoa Parish
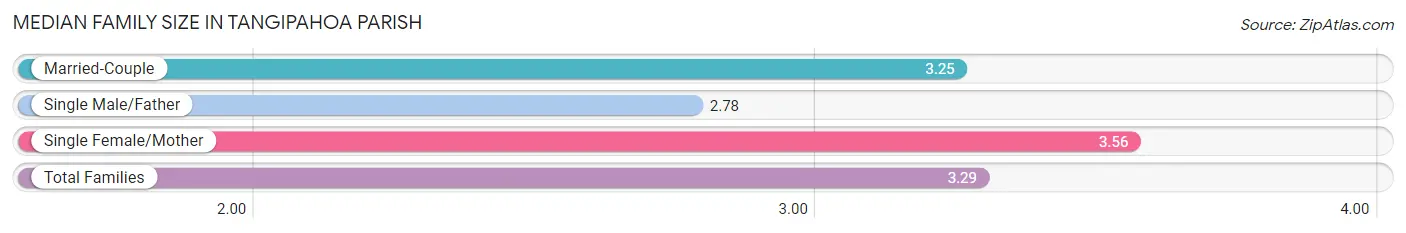
The median family size in Tangipahoa Parish is 3.29 persons per family, with single female/mother families (8,232 | 25.7%) accounting for the largest median family size of 3.56 persons per family. On the other hand, single male/father families (2,354 | 7.3%) represent the smallest median family size with 2.78 persons per family.
| Family Type | # Families | Family Size |
| Married-Couple | 21,456 (67.0%) | 3.25 |
| Single Male/Father | 2,354 (7.3%) | 2.78 |
| Single Female/Mother | 8,232 (25.7%) | 3.56 |
| Total Families | 32,042 (100.0%) | 3.29 |
Median Household Size in Tangipahoa Parish
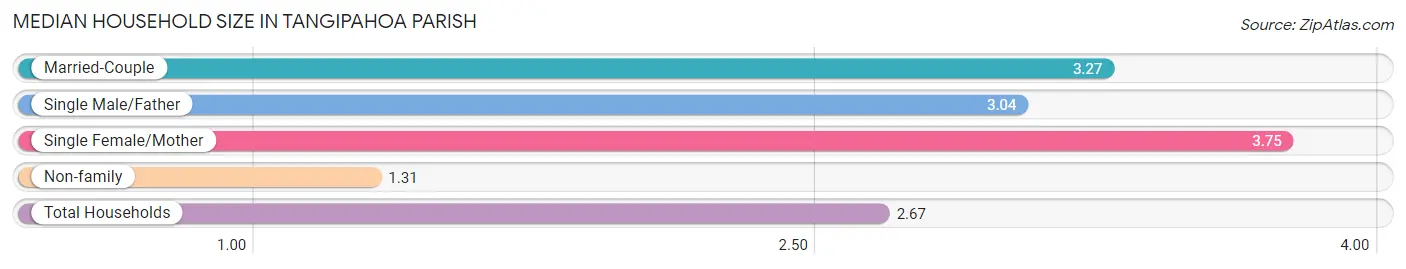
The median household size in Tangipahoa Parish is 2.67 persons per household, with single female/mother households (8,232 | 16.9%) accounting for the largest median household size of 3.75 persons per household. non-family households (16,616 | 34.2%) represent the smallest median household size with 1.31 persons per household.
| Household Type | # Households | Household Size |
| Married-Couple | 21,456 (44.1%) | 3.27 |
| Single Male/Father | 2,354 (4.8%) | 3.04 |
| Single Female/Mother | 8,232 (16.9%) | 3.75 |
| Non-family | 16,616 (34.2%) | 1.31 |
| Total Households | 48,658 (100.0%) | 2.67 |
Household Size by Marriage Status in Tangipahoa Parish
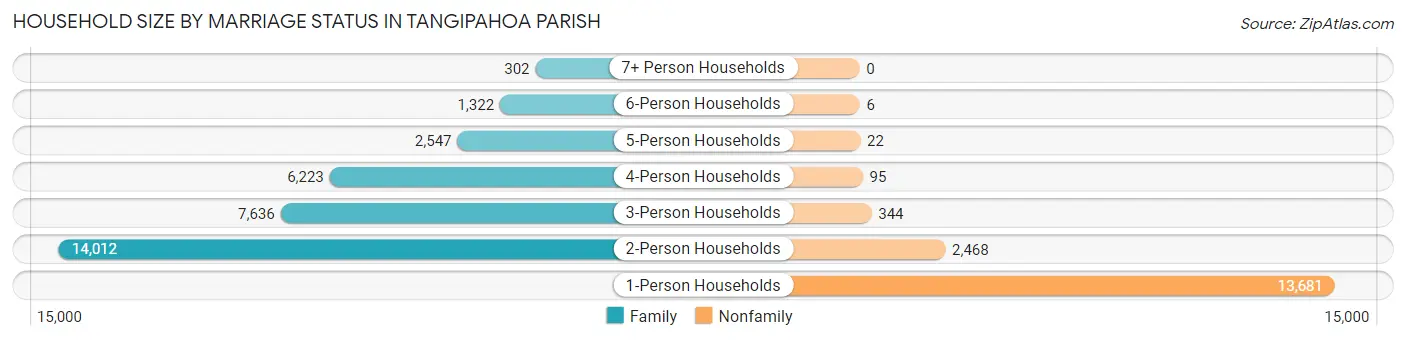
Out of a total of 48,658 households in Tangipahoa Parish, 32,042 (65.8%) are family households, while 16,616 (34.2%) are nonfamily households. The most numerous type of family households are 2-person households, comprising 14,012, and the most common type of nonfamily households are 1-person households, comprising 13,681.
| Household Size | Family Households | Nonfamily Households |
| 1-Person Households | - | 13,681 (28.1%) |
| 2-Person Households | 14,012 (28.8%) | 2,468 (5.1%) |
| 3-Person Households | 7,636 (15.7%) | 344 (0.7%) |
| 4-Person Households | 6,223 (12.8%) | 95 (0.2%) |
| 5-Person Households | 2,547 (5.2%) | 22 (0.1%) |
| 6-Person Households | 1,322 (2.7%) | 6 (0.0%) |
| 7+ Person Households | 302 (0.6%) | 0 (0.0%) |
| Total | 32,042 (65.8%) | 16,616 (34.2%) |
Female Fertility in Tangipahoa Parish
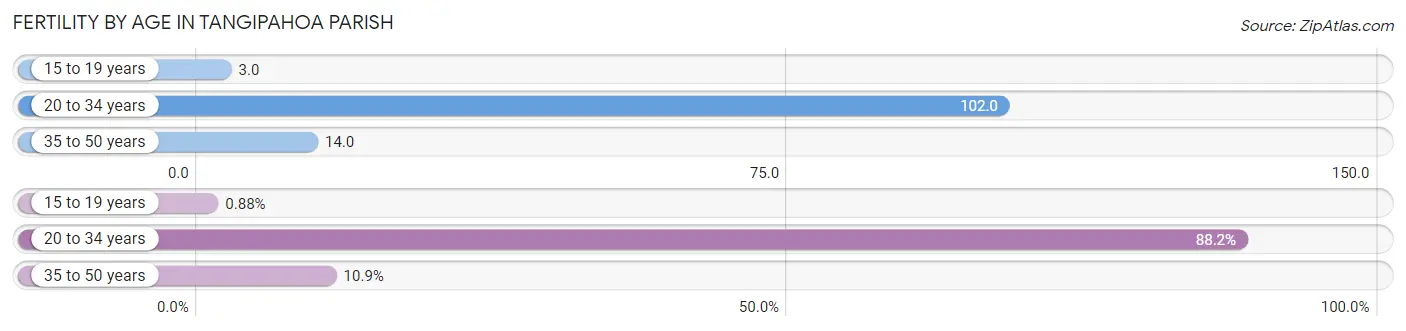
Fertility by Age in Tangipahoa Parish
Average fertility rate in Tangipahoa Parish is 52.0 births per 1,000 women. Women in the age bracket of 20 to 34 years have the highest fertility rate with 102.0 births per 1,000 women. Women in the age bracket of 20 to 34 years acount for 88.2% of all women with births.
| Age Bracket | Women with Births | Births / 1,000 Women |
| 15 to 19 years | 15 (0.9%) | 3.0 |
| 20 to 34 years | 1,496 (88.2%) | 102.0 |
| 35 to 50 years | 185 (10.9%) | 14.0 |
| Total | 1,696 (100.0%) | 52.0 |
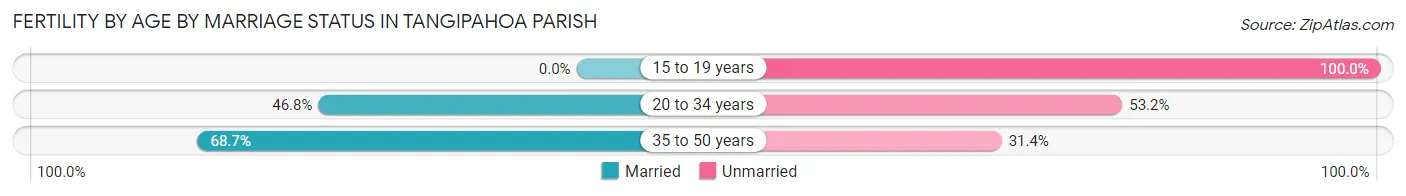
Fertility by Age by Marriage Status in Tangipahoa Parish
48.8% of women with births (1,696) in Tangipahoa Parish are married. The highest percentage of unmarried women with births falls into 15 to 19 years age bracket with 100.0% of them unmarried at the time of birth, while the lowest percentage of unmarried women with births belong to 35 to 50 years age bracket with 31.4% of them unmarried.
| Age Bracket | Married | Unmarried |
| 15 to 19 years | 0 (0.0%) | 15 (100.0%) |
| 20 to 34 years | 700 (46.8%) | 796 (53.2%) |
| 35 to 50 years | 127 (68.6%) | 58 (31.4%) |
| Total | 828 (48.8%) | 868 (51.2%) |
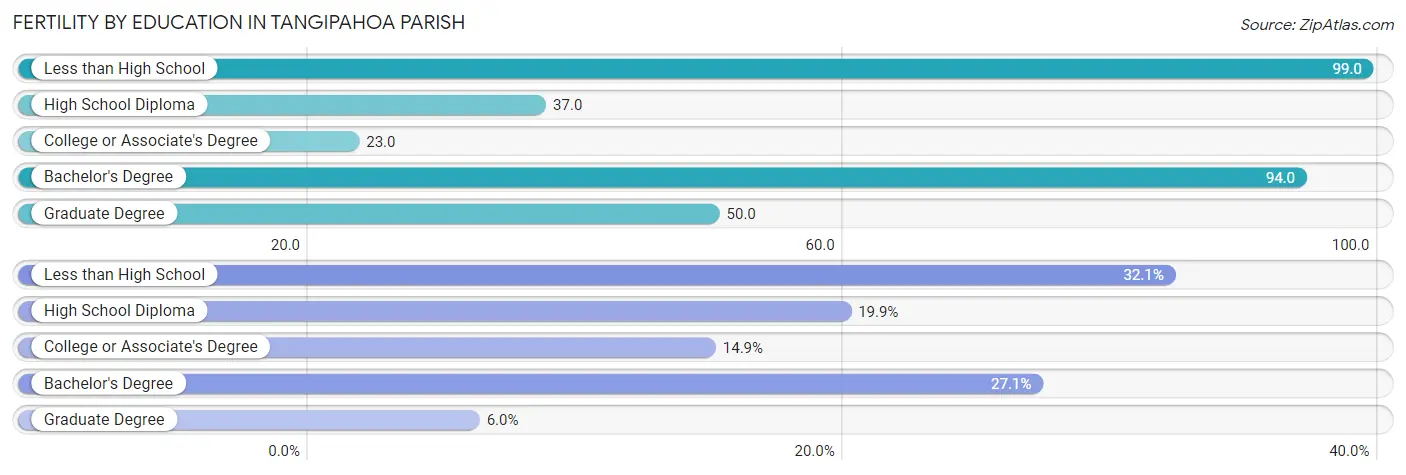
Fertility by Education in Tangipahoa Parish
Average fertility rate in Tangipahoa Parish is 52.0 births per 1,000 women. Women with the education attainment of less than high school have the highest fertility rate of 99.0 births per 1,000 women, while women with the education attainment of college or associate's degree have the lowest fertility at 23.0 births per 1,000 women. Women with the education attainment of less than high school represent 32.1% of all women with births.
| Educational Attainment | Women with Births | Births / 1,000 Women |
| Less than High School | 544 (32.1%) | 99.0 |
| High School Diploma | 338 (19.9%) | 37.0 |
| College or Associate's Degree | 252 (14.9%) | 23.0 |
| Bachelor's Degree | 460 (27.1%) | 94.0 |
| Graduate Degree | 102 (6.0%) | 50.0 |
| Total | 1,696 (100.0%) | 52.0 |
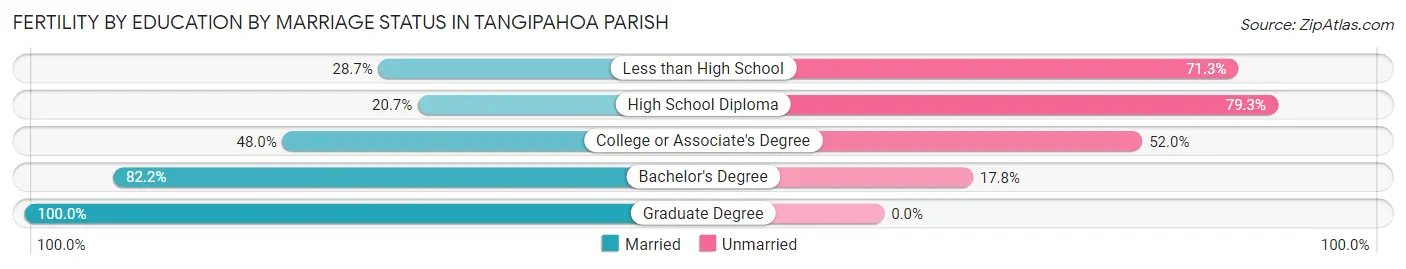
Fertility by Education by Marriage Status in Tangipahoa Parish
51.2% of women with births in Tangipahoa Parish are unmarried. Women with the educational attainment of graduate degree are most likely to be married with 100.0% of them married at childbirth, while women with the educational attainment of high school diploma are least likely to be married with 79.3% of them unmarried at childbirth.
| Educational Attainment | Married | Unmarried |
| Less than High School | 156 (28.7%) | 388 (71.3%) |
| High School Diploma | 70 (20.7%) | 268 (79.3%) |
| College or Associate's Degree | 121 (48.0%) | 131 (52.0%) |
| Bachelor's Degree | 378 (82.2%) | 82 (17.8%) |
| Graduate Degree | 102 (100.0%) | 0 (0.0%) |
| Total | 828 (48.8%) | 868 (51.2%) |
Income in Tangipahoa Parish
Income Overview in Tangipahoa Parish
Per Capita Income in Tangipahoa Parish is $29,192, while median incomes of families and households are $69,080 and $55,274 respectively.
| Characteristic | Number | Measure |
| Per Capita Income | 133,953 | $29,192 |
| Median Family Income | 32,042 | $69,080 |
| Mean Family Income | 32,042 | $90,632 |
| Median Household Income | 48,658 | $55,274 |
| Mean Household Income | 48,658 | $75,429 |
| Income Deficit | 32,042 | $11,249 |
| Wage / Income Gap (%) | 133,953 | 35.83% |
| Wage / Income Gap ($) | 133,953 | 64.17¢ per $1 |
| Gini / Inequality Index | 133,953 | 0.47 |
Earnings by Sex in Tangipahoa Parish
Average Earnings in Tangipahoa Parish are $33,539, $42,306 for men and $27,146 for women, a difference of 35.8%.
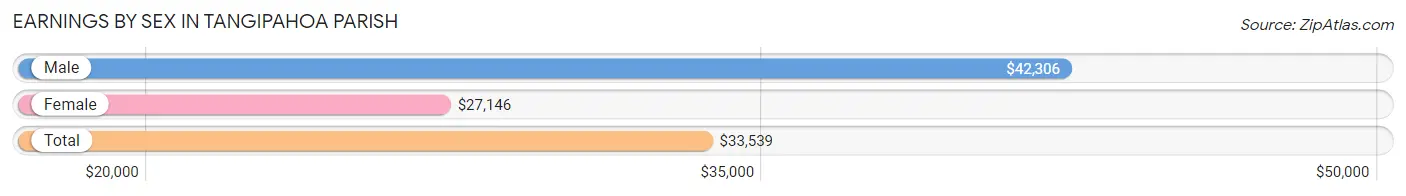
| Sex | Number | Average Earnings |
| Male | 34,055 (52.9%) | $42,306 |
| Female | 30,321 (47.1%) | $27,146 |
| Total | 64,376 (100.0%) | $33,539 |
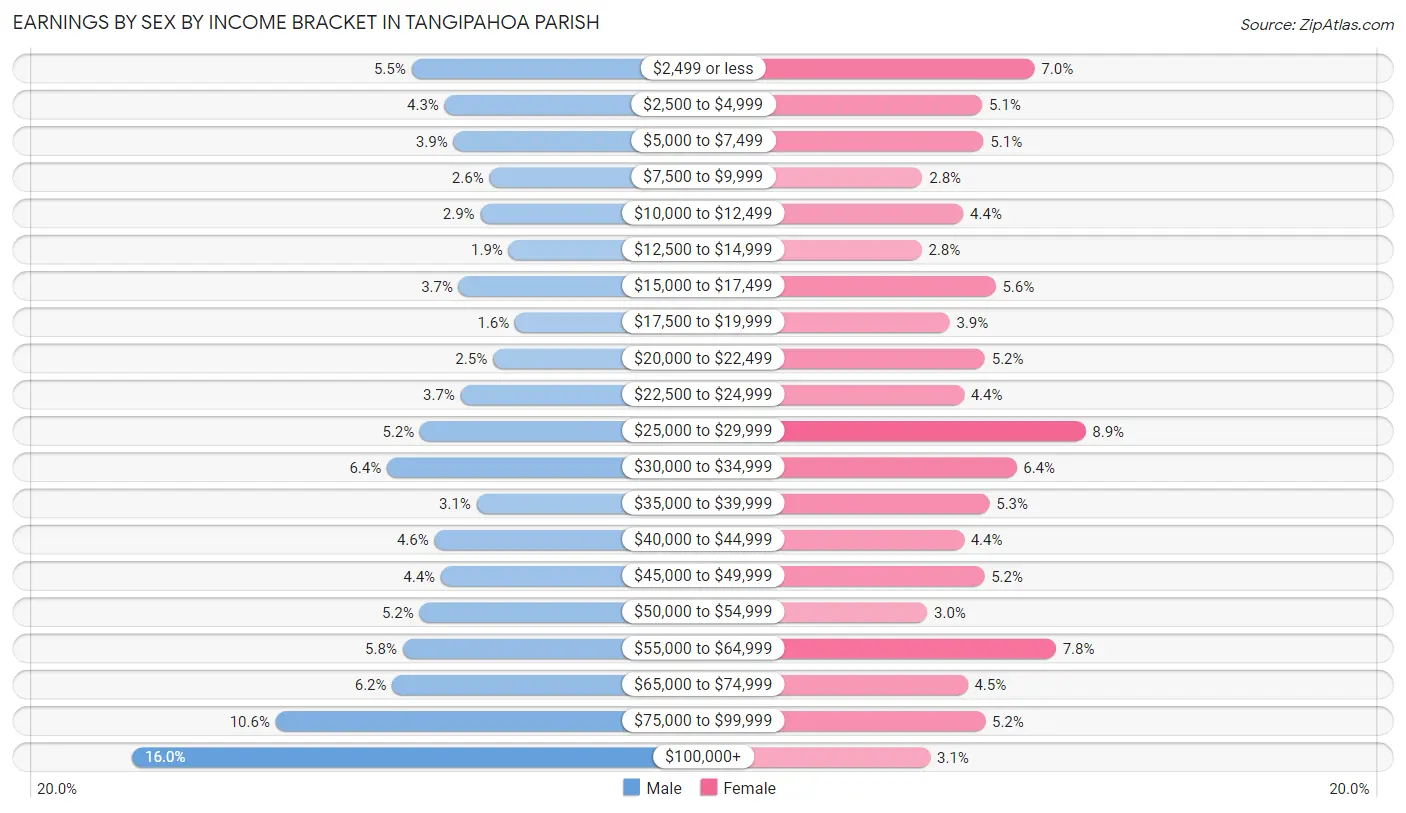
Earnings by Sex by Income Bracket in Tangipahoa Parish
The most common earnings brackets in Tangipahoa Parish are $100,000+ for men (5,438 | 16.0%) and $25,000 to $29,999 for women (2,711 | 8.9%).
| Income | Male | Female |
| $2,499 or less | 1,874 (5.5%) | 2,131 (7.0%) |
| $2,500 to $4,999 | 1,451 (4.3%) | 1,538 (5.1%) |
| $5,000 to $7,499 | 1,338 (3.9%) | 1,552 (5.1%) |
| $7,500 to $9,999 | 877 (2.6%) | 859 (2.8%) |
| $10,000 to $12,499 | 994 (2.9%) | 1,322 (4.4%) |
| $12,500 to $14,999 | 632 (1.9%) | 848 (2.8%) |
| $15,000 to $17,499 | 1,270 (3.7%) | 1,689 (5.6%) |
| $17,500 to $19,999 | 552 (1.6%) | 1,167 (3.8%) |
| $20,000 to $22,499 | 834 (2.5%) | 1,567 (5.2%) |
| $22,500 to $24,999 | 1,246 (3.7%) | 1,328 (4.4%) |
| $25,000 to $29,999 | 1,764 (5.2%) | 2,711 (8.9%) |
| $30,000 to $34,999 | 2,185 (6.4%) | 1,925 (6.4%) |
| $35,000 to $39,999 | 1,043 (3.1%) | 1,620 (5.3%) |
| $40,000 to $44,999 | 1,580 (4.6%) | 1,327 (4.4%) |
| $45,000 to $49,999 | 1,498 (4.4%) | 1,561 (5.1%) |
| $50,000 to $54,999 | 1,771 (5.2%) | 913 (3.0%) |
| $55,000 to $64,999 | 1,984 (5.8%) | 2,374 (7.8%) |
| $65,000 to $74,999 | 2,117 (6.2%) | 1,372 (4.5%) |
| $75,000 to $99,999 | 3,607 (10.6%) | 1,570 (5.2%) |
| $100,000+ | 5,438 (16.0%) | 947 (3.1%) |
| Total | 34,055 (100.0%) | 30,321 (100.0%) |
Earnings by Sex by Educational Attainment in Tangipahoa Parish
Average earnings in Tangipahoa Parish are $50,862 for men and $33,213 for women, a difference of 34.7%. Men with an educational attainment of graduate degree enjoy the highest average annual earnings of $70,653, while those with less than high school education earn the least with $32,500. Women with an educational attainment of graduate degree earn the most with the average annual earnings of $55,377, while those with less than high school education have the smallest earnings of $16,939.
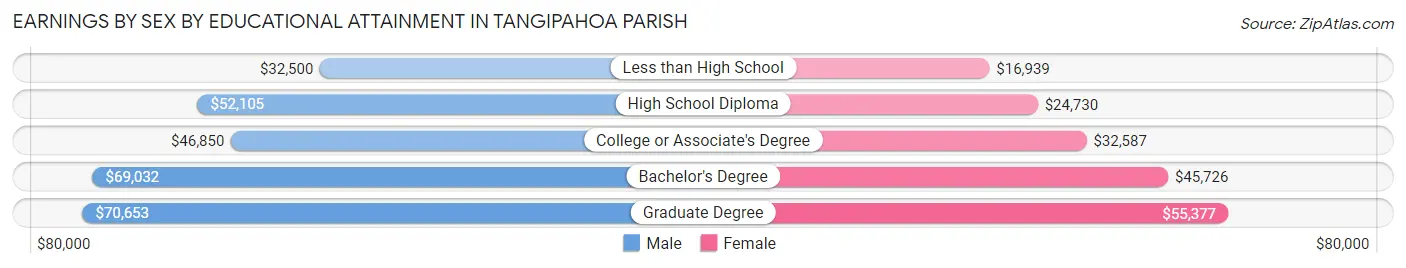
| Educational Attainment | Male Income | Female Income |
| Less than High School | $32,500 | $16,939 |
| High School Diploma | $52,105 | $24,730 |
| College or Associate's Degree | $46,850 | $32,587 |
| Bachelor's Degree | $69,032 | $45,726 |
| Graduate Degree | $70,653 | $55,377 |
| Total | $50,862 | $33,213 |
Family Income in Tangipahoa Parish
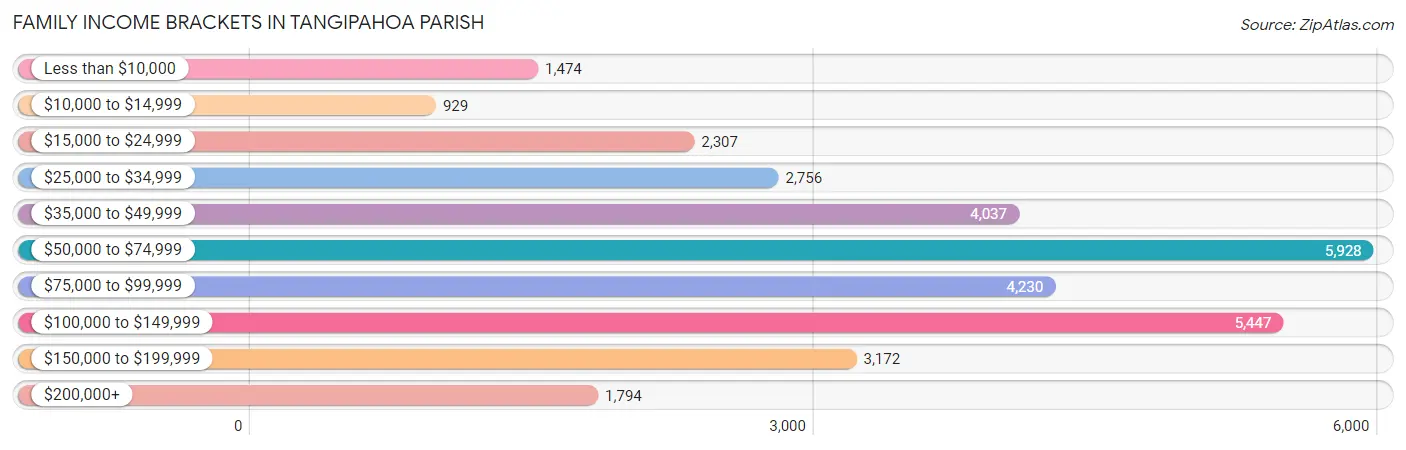
Family Income Brackets in Tangipahoa Parish
According to the Tangipahoa Parish family income data, there are 5,928 families falling into the $50,000 to $74,999 income range, which is the most common income bracket and makes up 18.5% of all families. Conversely, the $10,000 to $14,999 income bracket is the least frequent group with only 929 families (2.9%) belonging to this category.
| Income Bracket | # Families | % Families |
| Less than $10,000 | 1,474 | 4.6% |
| $10,000 to $14,999 | 929 | 2.9% |
| $15,000 to $24,999 | 2,307 | 7.2% |
| $25,000 to $34,999 | 2,756 | 8.6% |
| $35,000 to $49,999 | 4,037 | 12.6% |
| $50,000 to $74,999 | 5,928 | 18.5% |
| $75,000 to $99,999 | 4,230 | 13.2% |
| $100,000 to $149,999 | 5,447 | 17.0% |
| $150,000 to $199,999 | 3,172 | 9.9% |
| $200,000+ | 1,794 | 5.6% |
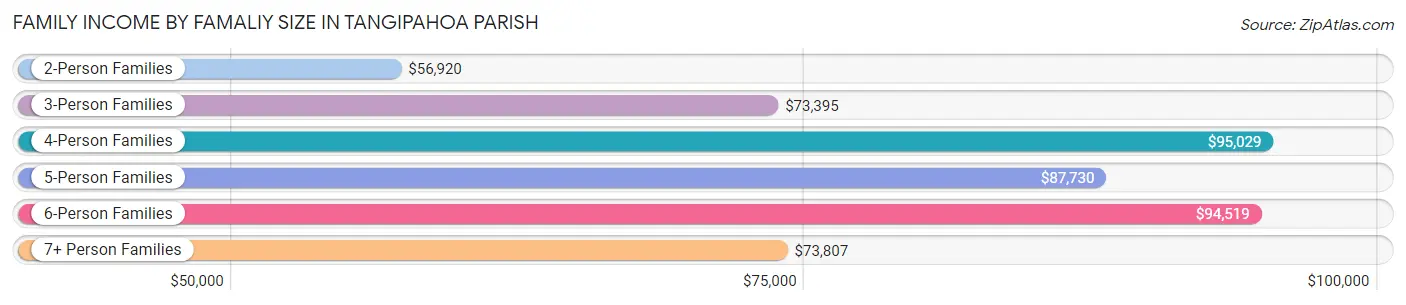
Family Income by Famaliy Size in Tangipahoa Parish
4-person families (5,758 | 18.0%) account for the highest median family income in Tangipahoa Parish with $95,029 per family, while 2-person families (14,665 | 45.8%) have the highest median income of $28,460 per family member.
| Income Bracket | # Families | Median Income |
| 2-Person Families | 14,665 (45.8%) | $56,920 |
| 3-Person Families | 7,717 (24.1%) | $73,395 |
| 4-Person Families | 5,758 (18.0%) | $95,029 |
| 5-Person Families | 2,451 (7.6%) | $87,730 |
| 6-Person Families | 1,158 (3.6%) | $94,519 |
| 7+ Person Families | 293 (0.9%) | $73,807 |
| Total | 32,042 (100.0%) | $69,080 |
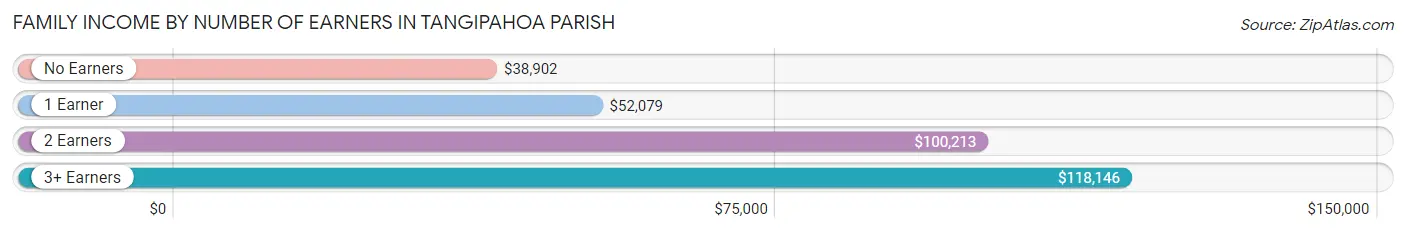
Family Income by Number of Earners in Tangipahoa Parish
The median family income in Tangipahoa Parish is $69,080, with families comprising 3+ earners (3,219) having the highest median family income of $118,146, while families with no earners (5,660) have the lowest median family income of $38,902, accounting for 10.1% and 17.7% of families, respectively.
| Number of Earners | # Families | Median Income |
| No Earners | 5,660 (17.7%) | $38,902 |
| 1 Earner | 12,128 (37.9%) | $52,079 |
| 2 Earners | 11,035 (34.4%) | $100,213 |
| 3+ Earners | 3,219 (10.1%) | $118,146 |
| Total | 32,042 (100.0%) | $69,080 |
Household Income in Tangipahoa Parish
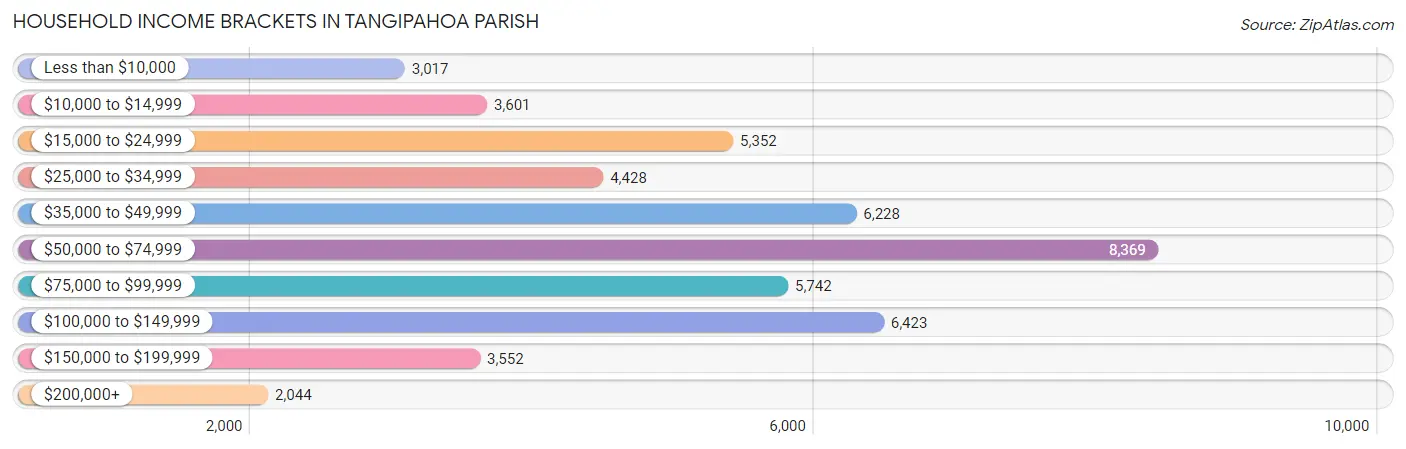
Household Income Brackets in Tangipahoa Parish
With 8,369 households falling in the category, the $50,000 to $74,999 income range is the most frequent in Tangipahoa Parish, accounting for 17.2% of all households. In contrast, only 2,044 households (4.2%) fall into the $200,000+ income bracket, making it the least populous group.
| Income Bracket | # Households | % Households |
| Less than $10,000 | 3,017 | 6.2% |
| $10,000 to $14,999 | 3,601 | 7.4% |
| $15,000 to $24,999 | 5,352 | 11.0% |
| $25,000 to $34,999 | 4,428 | 9.1% |
| $35,000 to $49,999 | 6,228 | 12.8% |
| $50,000 to $74,999 | 8,369 | 17.2% |
| $75,000 to $99,999 | 5,742 | 11.8% |
| $100,000 to $149,999 | 6,423 | 13.2% |
| $150,000 to $199,999 | 3,552 | 7.3% |
| $200,000+ | 2,044 | 4.2% |
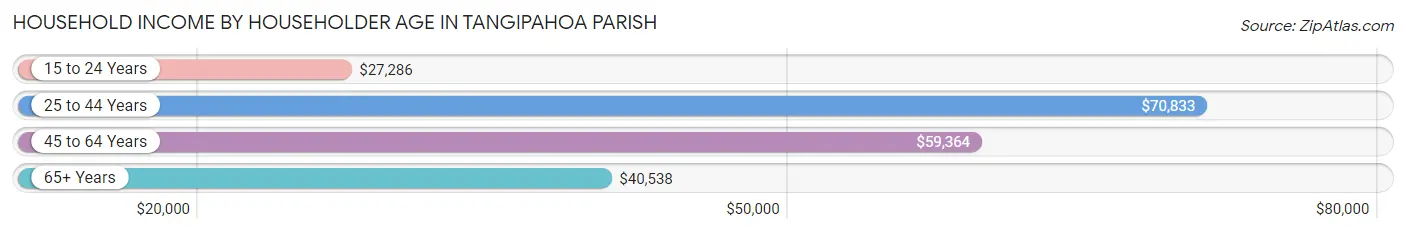
Household Income by Householder Age in Tangipahoa Parish
The median household income in Tangipahoa Parish is $55,274, with the highest median household income of $70,833 found in the 25 to 44 years age bracket for the primary householder. A total of 16,196 households (33.3%) fall into this category. Meanwhile, the 15 to 24 years age bracket for the primary householder has the lowest median household income of $27,286, with 1,942 households (4.0%) in this group.
| Income Bracket | # Households | Median Income |
| 15 to 24 Years | 1,942 (4.0%) | $27,286 |
| 25 to 44 Years | 16,196 (33.3%) | $70,833 |
| 45 to 64 Years | 17,575 (36.1%) | $59,364 |
| 65+ Years | 12,945 (26.6%) | $40,538 |
| Total | 48,658 (100.0%) | $55,274 |
Poverty in Tangipahoa Parish
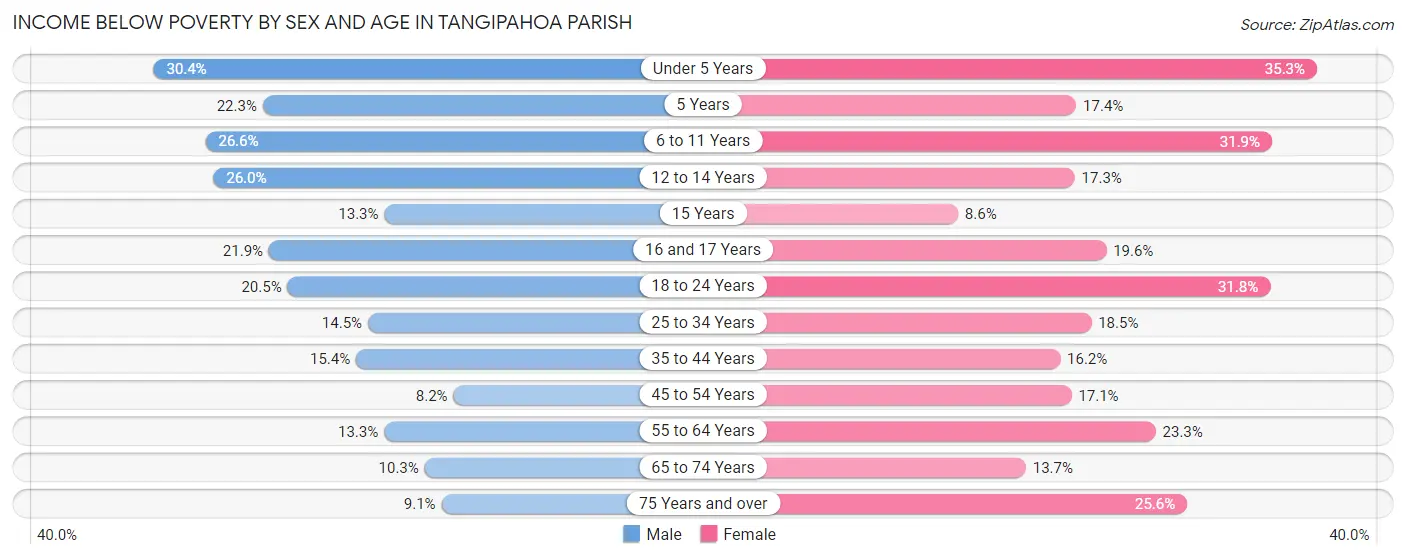
Income Below Poverty by Sex and Age in Tangipahoa Parish
With 16.6% poverty level for males and 21.7% for females among the residents of Tangipahoa Parish, under 5 year old males and under 5 year old females are the most vulnerable to poverty, with 1,384 males (30.4%) and 1,554 females (35.3%) in their respective age groups living below the poverty level.
| Age Bracket | Male | Female |
| Under 5 Years | 1,384 (30.4%) | 1,554 (35.3%) |
| 5 Years | 158 (22.3%) | 199 (17.4%) |
| 6 to 11 Years | 1,388 (26.6%) | 1,591 (31.9%) |
| 12 to 14 Years | 770 (26.0%) | 429 (17.3%) |
| 15 Years | 90 (13.3%) | 56 (8.6%) |
| 16 and 17 Years | 461 (21.9%) | 357 (19.6%) |
| 18 to 24 Years | 1,143 (20.5%) | 1,754 (31.8%) |
| 25 to 34 Years | 1,376 (14.5%) | 1,794 (18.5%) |
| 35 to 44 Years | 1,309 (15.4%) | 1,387 (16.2%) |
| 45 to 54 Years | 597 (8.2%) | 1,315 (17.1%) |
| 55 to 64 Years | 1,025 (13.3%) | 1,945 (23.3%) |
| 65 to 74 Years | 609 (10.3%) | 898 (13.7%) |
| 75 Years and over | 259 (9.0%) | 1,048 (25.6%) |
| Total | 10,569 (16.6%) | 14,327 (21.7%) |
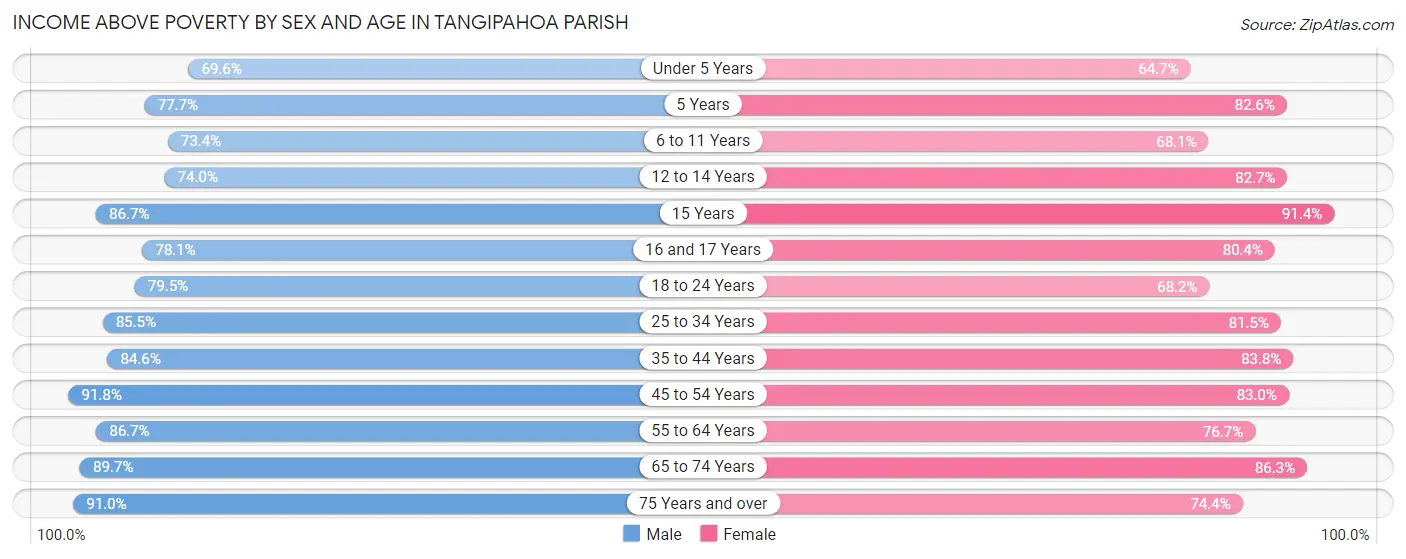
Income Above Poverty by Sex and Age in Tangipahoa Parish
According to the poverty statistics in Tangipahoa Parish, males aged 45 to 54 years and females aged 15 years are the age groups that are most secure financially, with 91.8% of males and 91.4% of females in these age groups living above the poverty line.
| Age Bracket | Male | Female |
| Under 5 Years | 3,164 (69.6%) | 2,852 (64.7%) |
| 5 Years | 550 (77.7%) | 945 (82.6%) |
| 6 to 11 Years | 3,833 (73.4%) | 3,392 (68.1%) |
| 12 to 14 Years | 2,193 (74.0%) | 2,052 (82.7%) |
| 15 Years | 587 (86.7%) | 594 (91.4%) |
| 16 and 17 Years | 1,648 (78.1%) | 1,462 (80.4%) |
| 18 to 24 Years | 4,438 (79.5%) | 3,763 (68.2%) |
| 25 to 34 Years | 8,107 (85.5%) | 7,893 (81.5%) |
| 35 to 44 Years | 7,195 (84.6%) | 7,172 (83.8%) |
| 45 to 54 Years | 6,717 (91.8%) | 6,397 (83.0%) |
| 55 to 64 Years | 6,674 (86.7%) | 6,402 (76.7%) |
| 65 to 74 Years | 5,302 (89.7%) | 5,674 (86.3%) |
| 75 Years and over | 2,602 (90.9%) | 3,041 (74.4%) |
| Total | 53,010 (83.4%) | 51,639 (78.3%) |
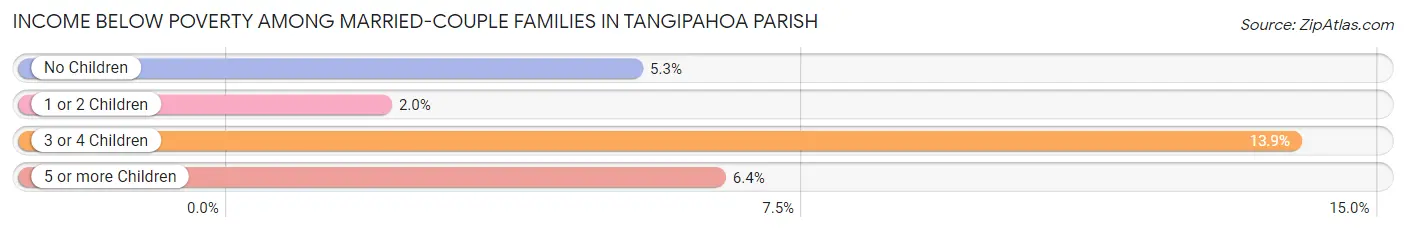
Income Below Poverty Among Married-Couple Families in Tangipahoa Parish
The poverty statistics for married-couple families in Tangipahoa Parish show that 5.1% or 1,083 of the total 21,456 families live below the poverty line. Families with 3 or 4 children have the highest poverty rate of 13.9%, comprising of 287 families. On the other hand, families with 1 or 2 children have the lowest poverty rate of 2.0%, which includes 142 families.
| Children | Above Poverty | Below Poverty |
| No Children | 11,530 (94.7%) | 644 (5.3%) |
| 1 or 2 Children | 6,917 (98.0%) | 142 (2.0%) |
| 3 or 4 Children | 1,779 (86.1%) | 287 (13.9%) |
| 5 or more Children | 147 (93.6%) | 10 (6.4%) |
| Total | 20,373 (95.0%) | 1,083 (5.1%) |
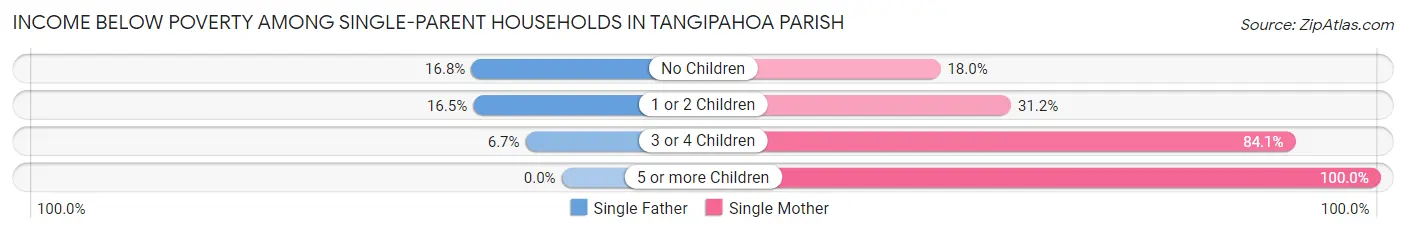
Income Below Poverty Among Single-Parent Households in Tangipahoa Parish
According to the poverty data in Tangipahoa Parish, 16.1% or 380 single-father households and 34.5% or 2,837 single-mother households are living below the poverty line. Among single-father households, those with no children have the highest poverty rate, with 180 households (16.8%) experiencing poverty. Likewise, among single-mother households, those with 5 or more children have the highest poverty rate, with 69 households (100.0%) falling below the poverty line.
| Children | Single Father | Single Mother |
| No Children | 180 (16.8%) | 558 (18.0%) |
| 1 or 2 Children | 192 (16.5%) | 1,209 (31.2%) |
| 3 or 4 Children | 8 (6.7%) | 1,001 (84.1%) |
| 5 or more Children | 0 (0.0%) | 69 (100.0%) |
| Total | 380 (16.1%) | 2,837 (34.5%) |
Income Below Poverty Among Married-Couple vs Single-Parent Households in Tangipahoa Parish
The poverty data for Tangipahoa Parish shows that 1,083 of the married-couple family households (5.1%) and 3,217 of the single-parent households (30.4%) are living below the poverty level. Within the married-couple family households, those with 3 or 4 children have the highest poverty rate, with 287 households (13.9%) falling below the poverty line. Among the single-parent households, those with 5 or more children have the highest poverty rate, with 69 household (100.0%) living below poverty.
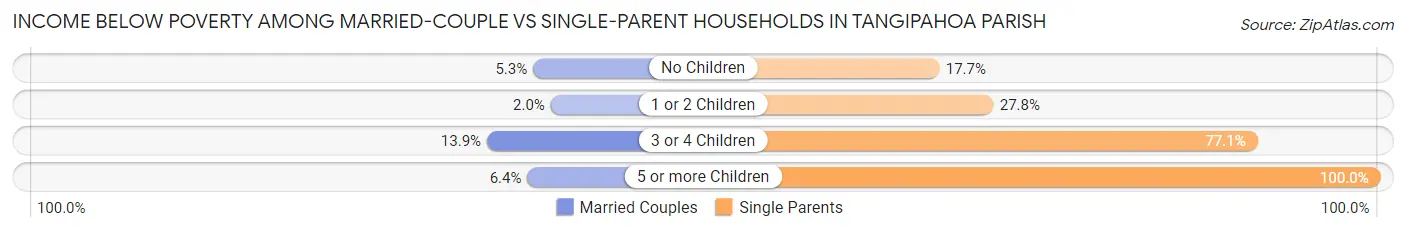
| Children | Married-Couple Families | Single-Parent Households |
| No Children | 644 (5.3%) | 738 (17.7%) |
| 1 or 2 Children | 142 (2.0%) | 1,401 (27.8%) |
| 3 or 4 Children | 287 (13.9%) | 1,009 (77.1%) |
| 5 or more Children | 10 (6.4%) | 69 (100.0%) |
| Total | 1,083 (5.1%) | 3,217 (30.4%) |
Employment Characteristics in Tangipahoa Parish
Employment by Class of Employer in Tangipahoa Parish
Among the 56,297 employed individuals in Tangipahoa Parish, private company employees (38,462 | 68.3%), state government employees (4,985 | 8.8%), and not-for-profit organizations (3,348 | 5.9%) make up the most common classes of employment.
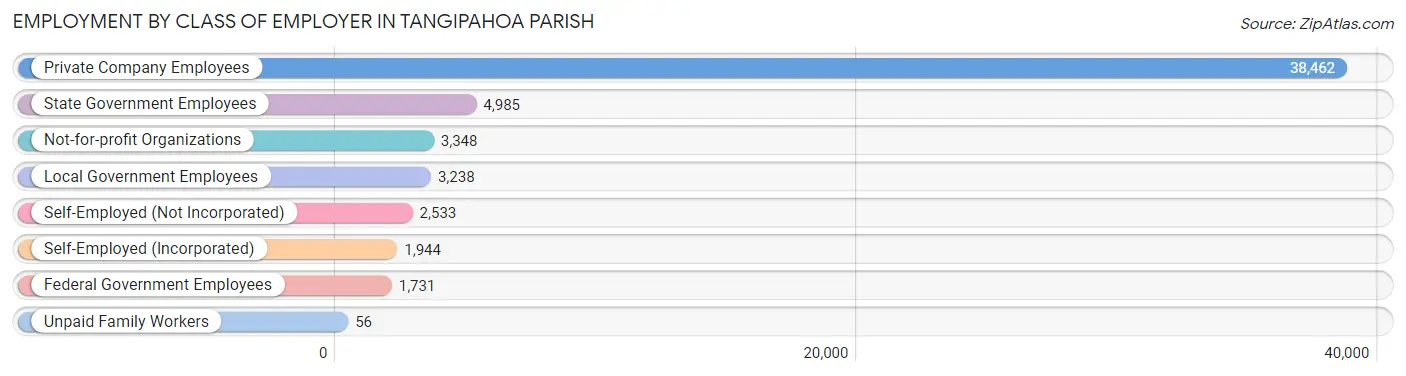
| Employer Class | # Employees | % Employees |
| Private Company Employees | 38,462 | 68.3% |
| Self-Employed (Incorporated) | 1,944 | 3.5% |
| Self-Employed (Not Incorporated) | 2,533 | 4.5% |
| Not-for-profit Organizations | 3,348 | 5.9% |
| Local Government Employees | 3,238 | 5.8% |
| State Government Employees | 4,985 | 8.8% |
| Federal Government Employees | 1,731 | 3.1% |
| Unpaid Family Workers | 56 | 0.1% |
| Total | 56,297 | 100.0% |
Employment Status by Age in Tangipahoa Parish
According to the labor force statistics for Tangipahoa Parish, out of the total population over 16 years of age (105,405), 57.9% or 61,029 individuals are in the labor force, with 5.6% or 3,418 of them unemployed. The age group with the highest labor force participation rate is 25 to 29 years, with 80.8% or 7,772 individuals in the labor force. Within the labor force, the 16 to 19 years age range has the highest percentage of unemployed individuals, with 10.7% or 376 of them being unemployed.
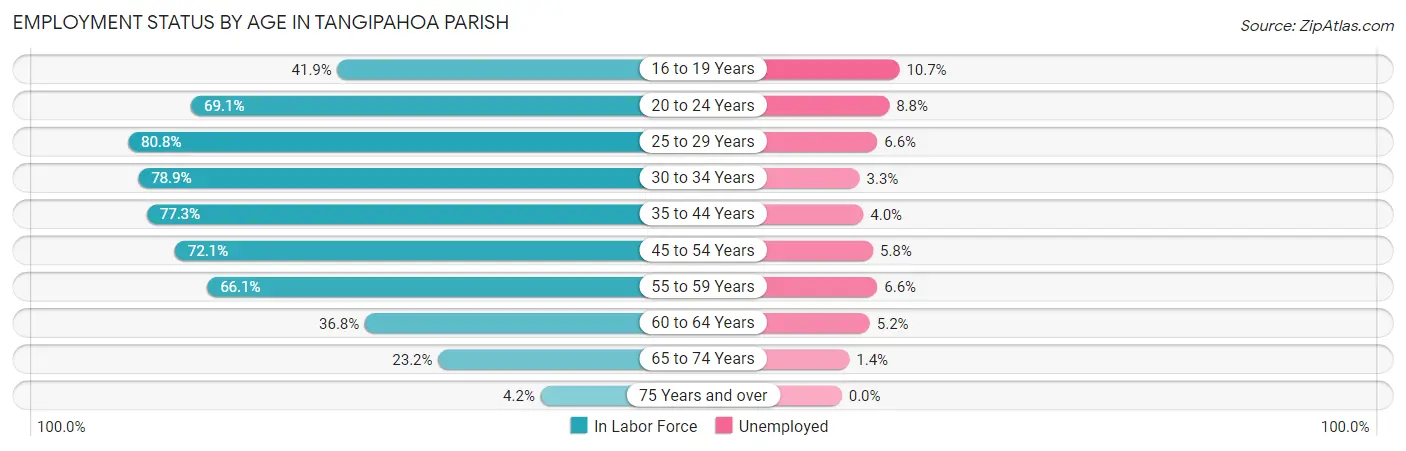
| Age Bracket | In Labor Force | Unemployed |
| 16 to 19 Years | 3,513 (41.9%) | 376 (10.7%) |
| 20 to 24 Years | 6,555 (69.1%) | 577 (8.8%) |
| 25 to 29 Years | 7,772 (80.8%) | 513 (6.6%) |
| 30 to 34 Years | 7,619 (78.9%) | 251 (3.3%) |
| 35 to 44 Years | 13,248 (77.3%) | 530 (4.0%) |
| 45 to 54 Years | 10,865 (72.1%) | 630 (5.8%) |
| 55 to 59 Years | 5,120 (66.1%) | 338 (6.6%) |
| 60 to 64 Years | 3,084 (36.8%) | 160 (5.2%) |
| 65 to 74 Years | 2,914 (23.2%) | 41 (1.4%) |
| 75 Years and over | 309 (4.2%) | 0 (0.0%) |
| Total | 61,029 (57.9%) | 3,418 (5.6%) |
Employment Status by Educational Attainment in Tangipahoa Parish
According to labor force statistics for Tangipahoa Parish, 70.5% of individuals (47,666) out of the total population between 25 and 64 years of age (67,611) are in the labor force, with 5.1% or 2,431 of them being unemployed. The group with the highest labor force participation rate are those with the educational attainment of bachelor's degree or higher, with 87.5% or 13,239 individuals in the labor force. Within the labor force, individuals with less than high school education have the highest percentage of unemployment, with 16.8% or 636 of them being unemployed.
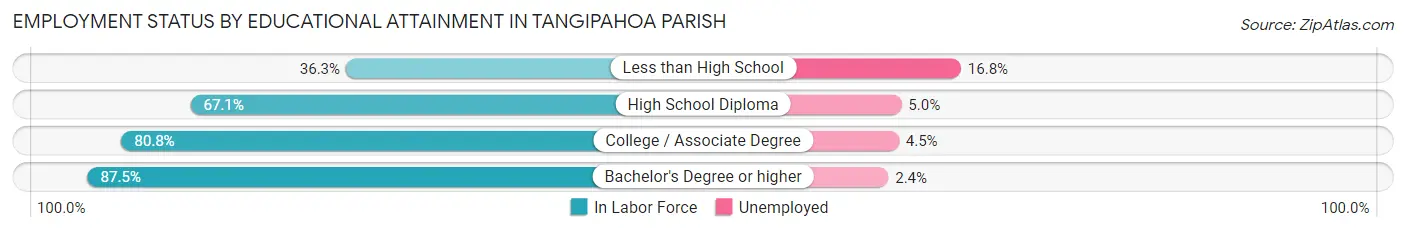
| Educational Attainment | In Labor Force | Unemployed |
| Less than High School | 3,785 (36.3%) | 1,752 (16.8%) |
| High School Diploma | 16,130 (67.1%) | 1,202 (5.0%) |
| College / Associate Degree | 14,556 (80.8%) | 811 (4.5%) |
| Bachelor's Degree or higher | 13,239 (87.5%) | 363 (2.4%) |
| Total | 47,666 (70.5%) | 3,448 (5.1%) |
Employment Occupations by Sex in Tangipahoa Parish
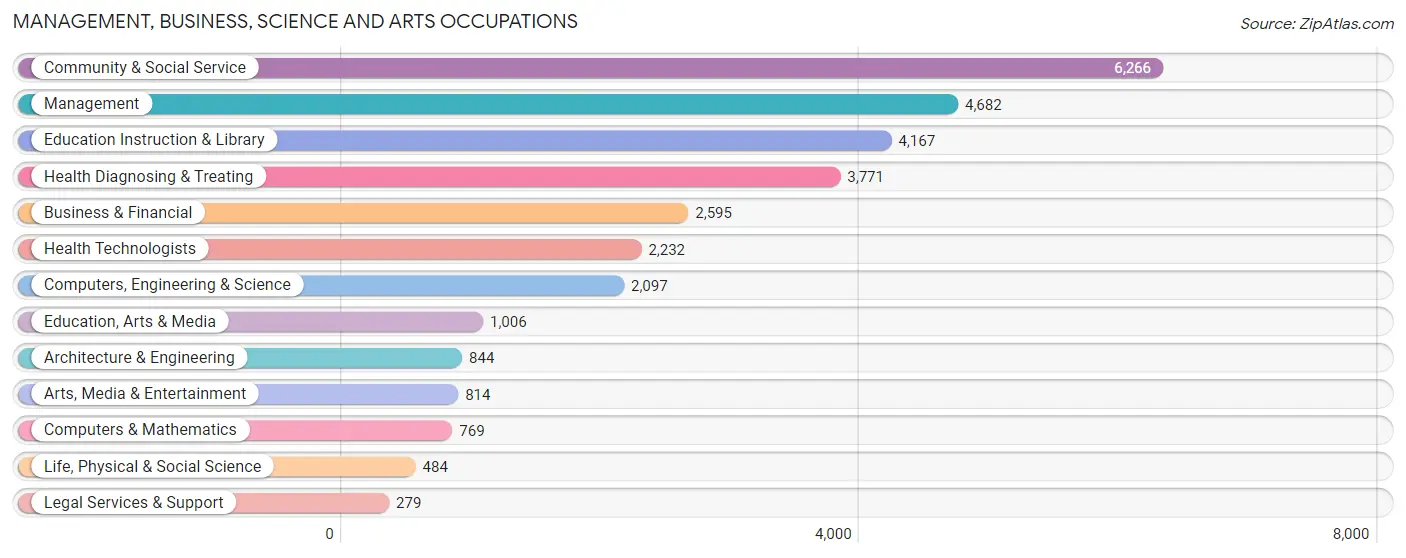
Management, Business, Science and Arts Occupations
The most common Management, Business, Science and Arts occupations in Tangipahoa Parish are Community & Social Service (6,266 | 10.9%), Management (4,682 | 8.2%), Education Instruction & Library (4,167 | 7.3%), Health Diagnosing & Treating (3,771 | 6.6%), and Business & Financial (2,595 | 4.5%).
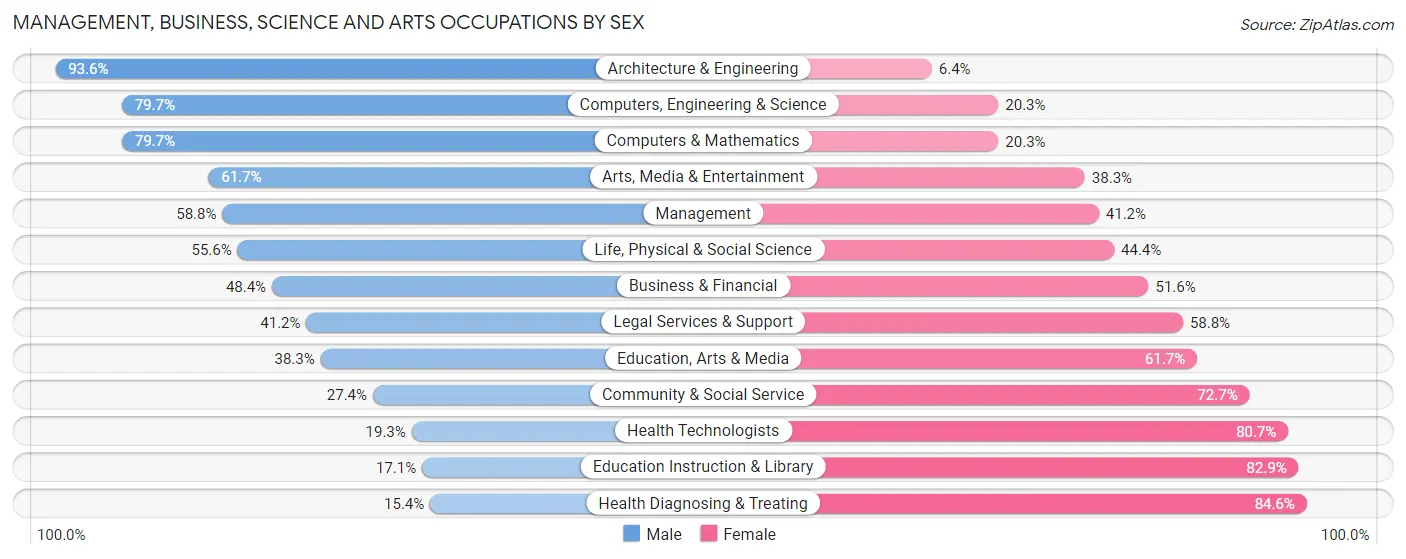
Management, Business, Science and Arts Occupations by Sex
Within the Management, Business, Science and Arts occupations in Tangipahoa Parish, the most male-oriented occupations are Architecture & Engineering (93.6%), Computers, Engineering & Science (79.7%), and Computers & Mathematics (79.7%), while the most female-oriented occupations are Health Diagnosing & Treating (84.6%), Education Instruction & Library (82.9%), and Health Technologists (80.7%).
| Occupation | Male | Female |
| Management | 2,751 (58.8%) | 1,931 (41.2%) |
| Business & Financial | 1,256 (48.4%) | 1,339 (51.6%) |
| Computers, Engineering & Science | 1,672 (79.7%) | 425 (20.3%) |
| Computers & Mathematics | 613 (79.7%) | 156 (20.3%) |
| Architecture & Engineering | 790 (93.6%) | 54 (6.4%) |
| Life, Physical & Social Science | 269 (55.6%) | 215 (44.4%) |
| Community & Social Service | 1,714 (27.4%) | 4,552 (72.7%) |
| Education, Arts & Media | 385 (38.3%) | 621 (61.7%) |
| Legal Services & Support | 115 (41.2%) | 164 (58.8%) |
| Education Instruction & Library | 712 (17.1%) | 3,455 (82.9%) |
| Arts, Media & Entertainment | 502 (61.7%) | 312 (38.3%) |
| Health Diagnosing & Treating | 581 (15.4%) | 3,190 (84.6%) |
| Health Technologists | 430 (19.3%) | 1,802 (80.7%) |
| Total (Category) | 7,974 (41.1%) | 11,437 (58.9%) |
| Total (Overall) | 30,053 (52.3%) | 27,379 (47.7%) |
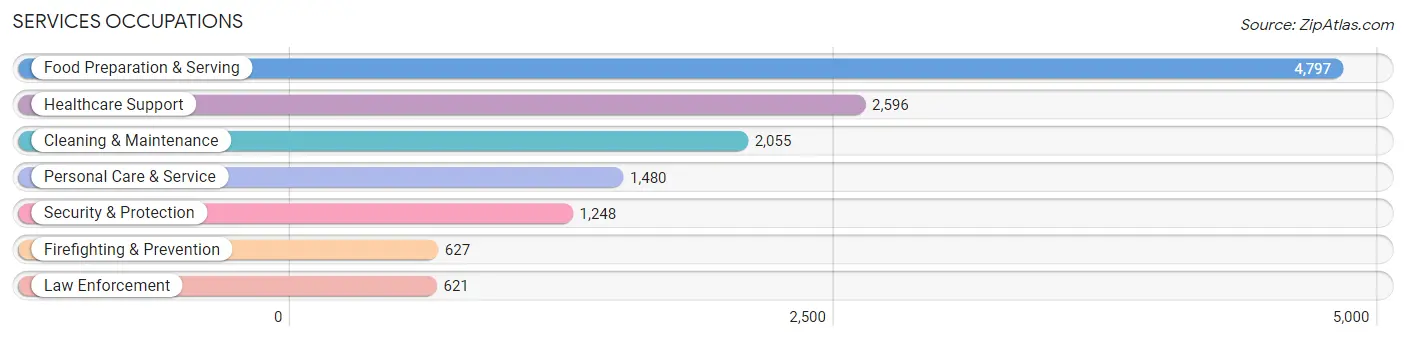
Services Occupations
The most common Services occupations in Tangipahoa Parish are Food Preparation & Serving (4,797 | 8.4%), Healthcare Support (2,596 | 4.5%), Cleaning & Maintenance (2,055 | 3.6%), Personal Care & Service (1,480 | 2.6%), and Security & Protection (1,248 | 2.2%).
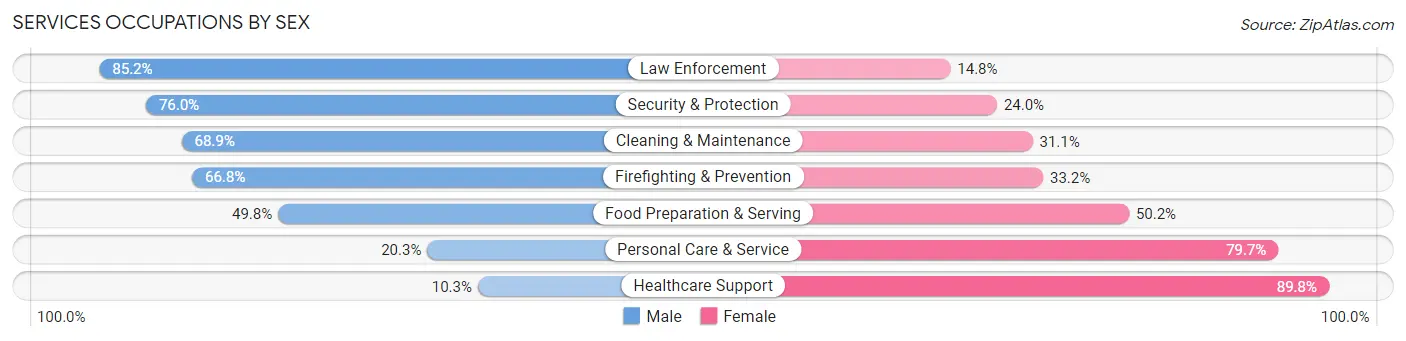
Services Occupations by Sex
Within the Services occupations in Tangipahoa Parish, the most male-oriented occupations are Law Enforcement (85.2%), Security & Protection (76.0%), and Cleaning & Maintenance (68.9%), while the most female-oriented occupations are Healthcare Support (89.7%), Personal Care & Service (79.7%), and Food Preparation & Serving (50.2%).
| Occupation | Male | Female |
| Healthcare Support | 266 (10.2%) | 2,330 (89.7%) |
| Security & Protection | 948 (76.0%) | 300 (24.0%) |
| Firefighting & Prevention | 419 (66.8%) | 208 (33.2%) |
| Law Enforcement | 529 (85.2%) | 92 (14.8%) |
| Food Preparation & Serving | 2,390 (49.8%) | 2,407 (50.2%) |
| Cleaning & Maintenance | 1,416 (68.9%) | 639 (31.1%) |
| Personal Care & Service | 300 (20.3%) | 1,180 (79.7%) |
| Total (Category) | 5,320 (43.7%) | 6,856 (56.3%) |
| Total (Overall) | 30,053 (52.3%) | 27,379 (47.7%) |
Sales and Office Occupations
The most common Sales and Office occupations in Tangipahoa Parish are Office & Administration (5,518 | 9.6%), and Sales & Related (4,963 | 8.6%).

Sales and Office Occupations by Sex
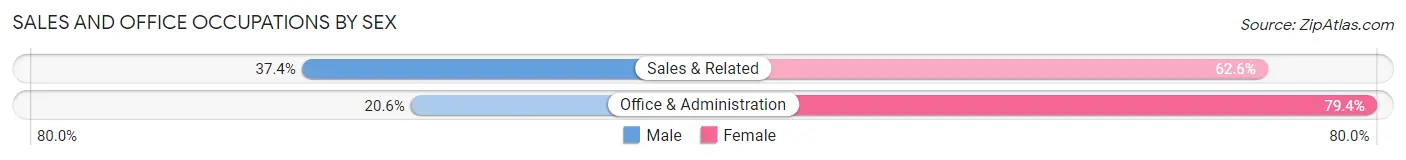
| Occupation | Male | Female |
| Sales & Related | 1,855 (37.4%) | 3,108 (62.6%) |
| Office & Administration | 1,137 (20.6%) | 4,381 (79.4%) |
| Total (Category) | 2,992 (28.5%) | 7,489 (71.5%) |
| Total (Overall) | 30,053 (52.3%) | 27,379 (47.7%) |
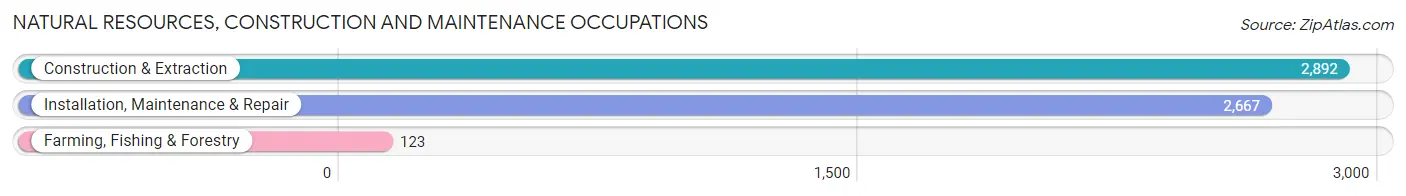
Natural Resources, Construction and Maintenance Occupations
The most common Natural Resources, Construction and Maintenance occupations in Tangipahoa Parish are Construction & Extraction (2,892 | 5.0%), Installation, Maintenance & Repair (2,667 | 4.6%), and Farming, Fishing & Forestry (123 | 0.2%).
Natural Resources, Construction and Maintenance Occupations by Sex
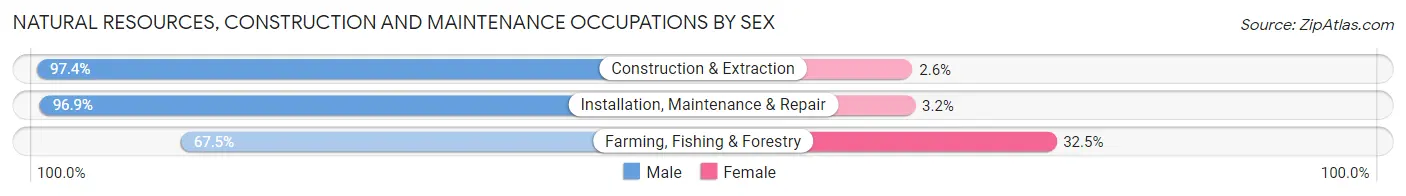
| Occupation | Male | Female |
| Farming, Fishing & Forestry | 83 (67.5%) | 40 (32.5%) |
| Construction & Extraction | 2,817 (97.4%) | 75 (2.6%) |
| Installation, Maintenance & Repair | 2,583 (96.9%) | 84 (3.2%) |
| Total (Category) | 5,483 (96.5%) | 199 (3.5%) |
| Total (Overall) | 30,053 (52.3%) | 27,379 (47.7%) |
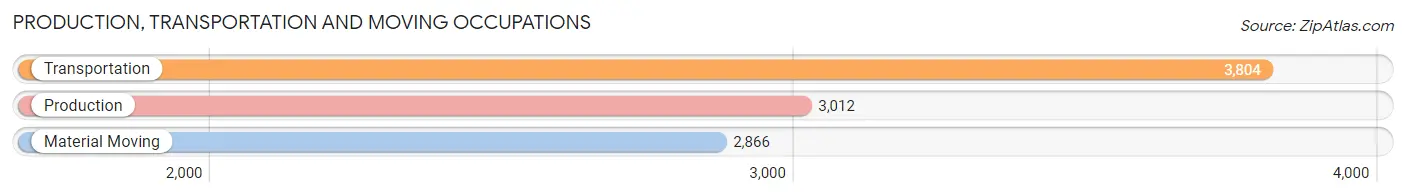
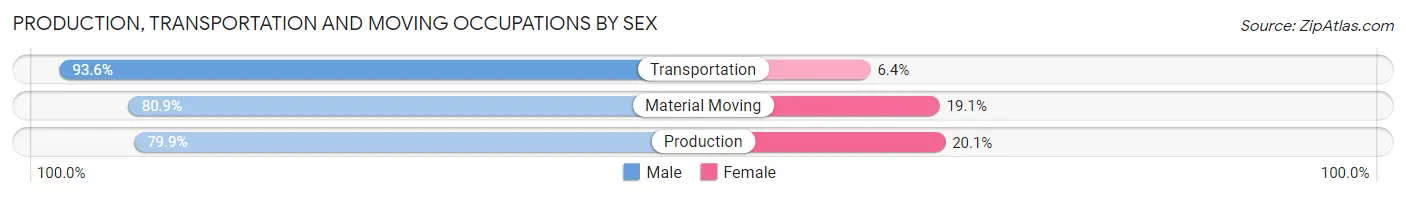
Production, Transportation and Moving Occupations
The most common Production, Transportation and Moving occupations in Tangipahoa Parish are Transportation (3,804 | 6.6%), Production (3,012 | 5.2%), and Material Moving (2,866 | 5.0%).
Production, Transportation and Moving Occupations by Sex
| Occupation | Male | Female |
| Production | 2,406 (79.9%) | 606 (20.1%) |
| Transportation | 3,560 (93.6%) | 244 (6.4%) |
| Material Moving | 2,318 (80.9%) | 548 (19.1%) |
| Total (Category) | 8,284 (85.6%) | 1,398 (14.4%) |
| Total (Overall) | 30,053 (52.3%) | 27,379 (47.7%) |
Employment Industries by Sex in Tangipahoa Parish
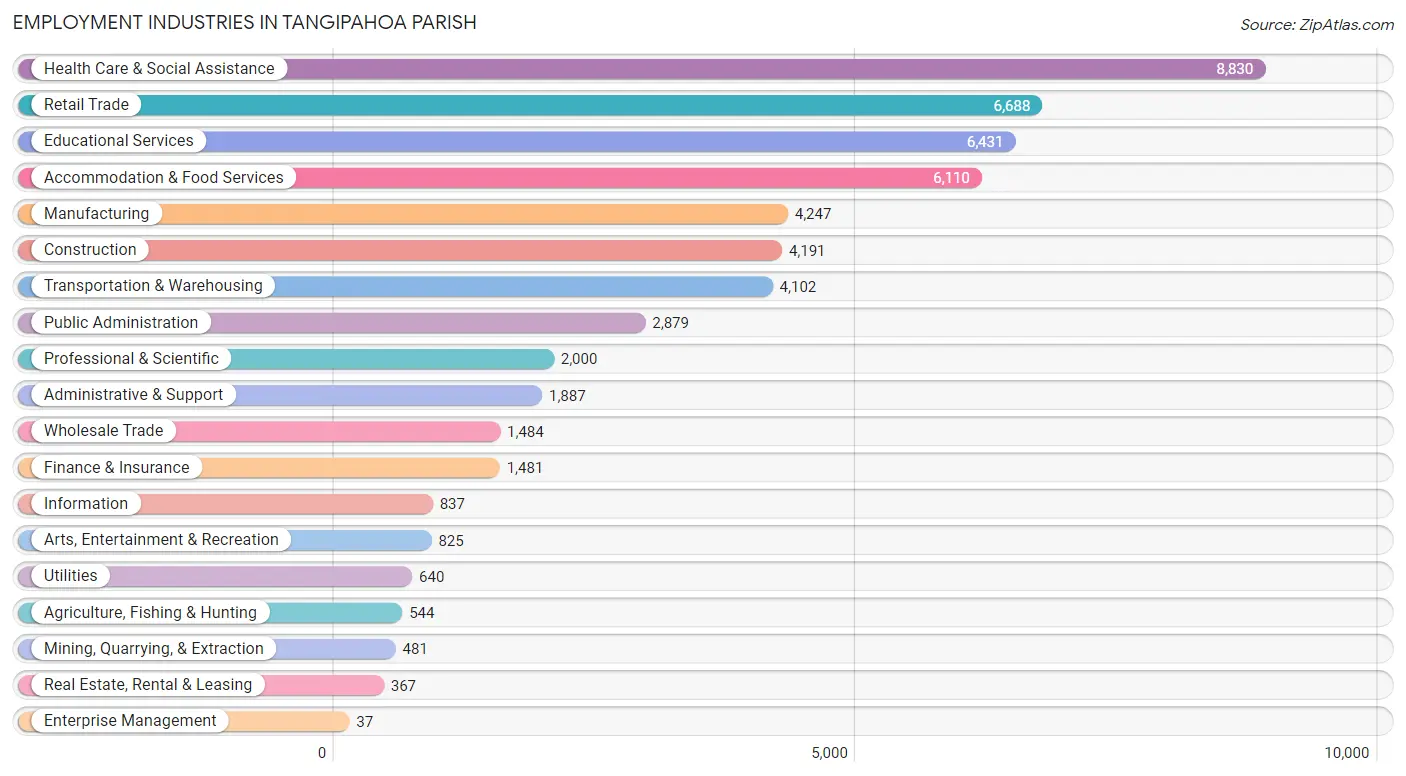
Employment Industries in Tangipahoa Parish
The major employment industries in Tangipahoa Parish include Health Care & Social Assistance (8,830 | 15.4%), Retail Trade (6,688 | 11.7%), Educational Services (6,431 | 11.2%), Accommodation & Food Services (6,110 | 10.6%), and Manufacturing (4,247 | 7.4%).
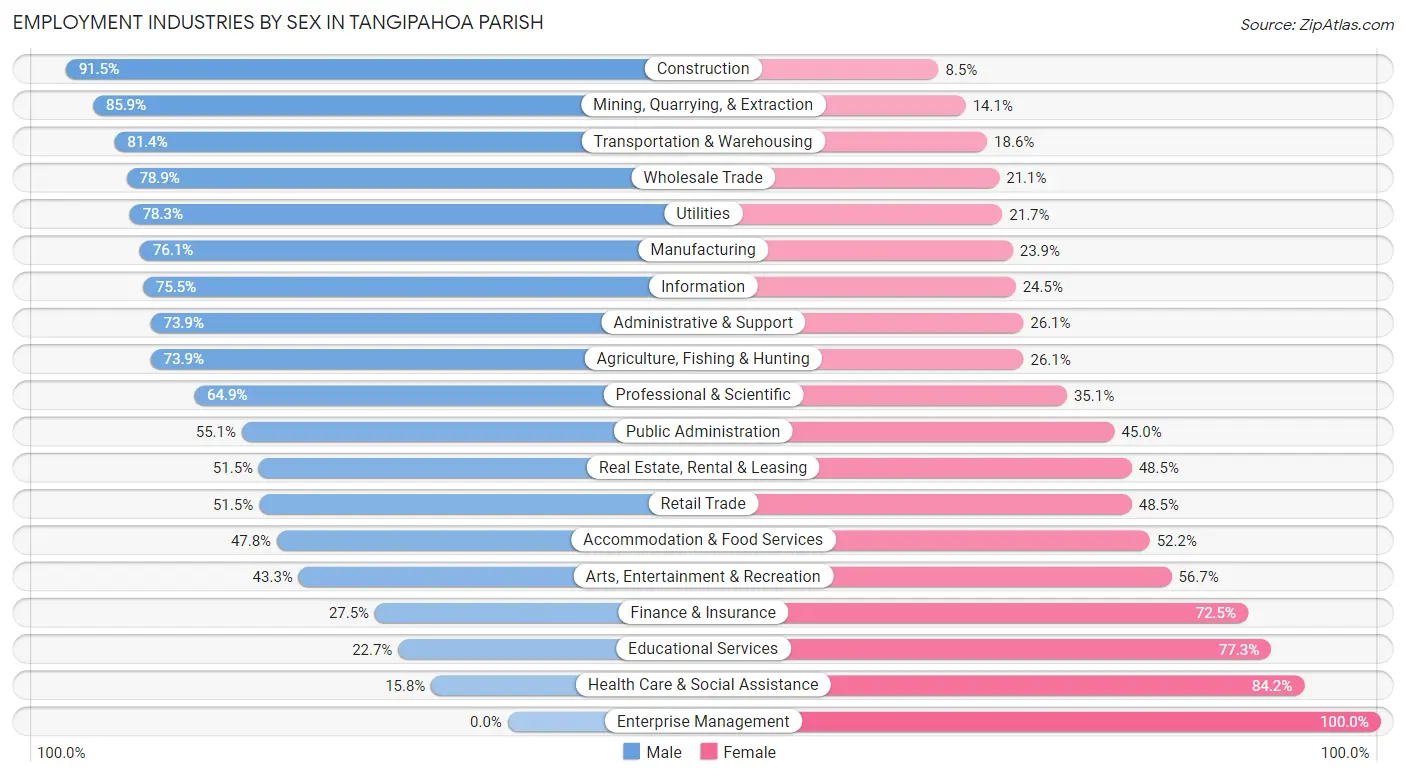
Employment Industries by Sex in Tangipahoa Parish
The Tangipahoa Parish industries that see more men than women are Construction (91.5%), Mining, Quarrying, & Extraction (85.9%), and Transportation & Warehousing (81.4%), whereas the industries that tend to have a higher number of women are Enterprise Management (100.0%), Health Care & Social Assistance (84.2%), and Educational Services (77.3%).
| Industry | Male | Female |
| Agriculture, Fishing & Hunting | 402 (73.9%) | 142 (26.1%) |
| Mining, Quarrying, & Extraction | 413 (85.9%) | 68 (14.1%) |
| Construction | 3,834 (91.5%) | 357 (8.5%) |
| Manufacturing | 3,233 (76.1%) | 1,014 (23.9%) |
| Wholesale Trade | 1,171 (78.9%) | 313 (21.1%) |
| Retail Trade | 3,443 (51.5%) | 3,245 (48.5%) |
| Transportation & Warehousing | 3,340 (81.4%) | 762 (18.6%) |
| Utilities | 501 (78.3%) | 139 (21.7%) |
| Information | 632 (75.5%) | 205 (24.5%) |
| Finance & Insurance | 407 (27.5%) | 1,074 (72.5%) |
| Real Estate, Rental & Leasing | 189 (51.5%) | 178 (48.5%) |
| Professional & Scientific | 1,298 (64.9%) | 702 (35.1%) |
| Enterprise Management | 0 (0.0%) | 37 (100.0%) |
| Administrative & Support | 1,395 (73.9%) | 492 (26.1%) |
| Educational Services | 1,458 (22.7%) | 4,973 (77.3%) |
| Health Care & Social Assistance | 1,399 (15.8%) | 7,431 (84.2%) |
| Arts, Entertainment & Recreation | 357 (43.3%) | 468 (56.7%) |
| Accommodation & Food Services | 2,919 (47.8%) | 3,191 (52.2%) |
| Public Administration | 1,585 (55.0%) | 1,294 (45.0%) |
| Total | 30,053 (52.3%) | 27,379 (47.7%) |
Education in Tangipahoa Parish
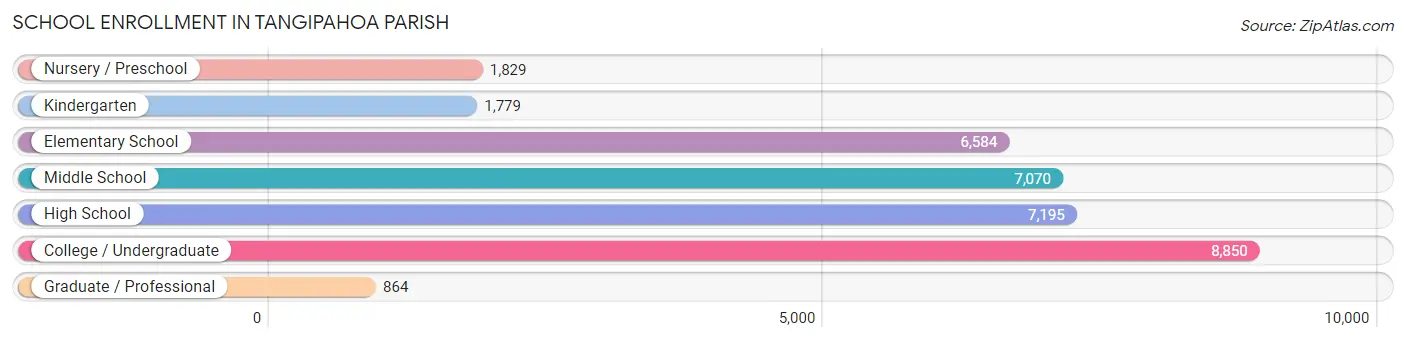
School Enrollment in Tangipahoa Parish
The most common levels of schooling among the 34,171 students in Tangipahoa Parish are college / undergraduate (8,850 | 25.9%), high school (7,195 | 21.1%), and middle school (7,070 | 20.7%).
| School Level | # Students | % Students |
| Nursery / Preschool | 1,829 | 5.3% |
| Kindergarten | 1,779 | 5.2% |
| Elementary School | 6,584 | 19.3% |
| Middle School | 7,070 | 20.7% |
| High School | 7,195 | 21.1% |
| College / Undergraduate | 8,850 | 25.9% |
| Graduate / Professional | 864 | 2.5% |
| Total | 34,171 | 100.0% |
School Enrollment by Age by Funding Source in Tangipahoa Parish
Out of a total of 34,171 students who are enrolled in schools in Tangipahoa Parish, 6,390 (18.7%) attend a private institution, while the remaining 27,781 (81.3%) are enrolled in public schools. The age group of 3 to 4 year olds has the highest likelihood of being enrolled in private schools, with 795 (57.0% in the age bracket) enrolled. Conversely, the age group of 18 to 19 year olds has the lowest likelihood of being enrolled in a private school, with 3,484 (95.2% in the age bracket) attending a public institution.
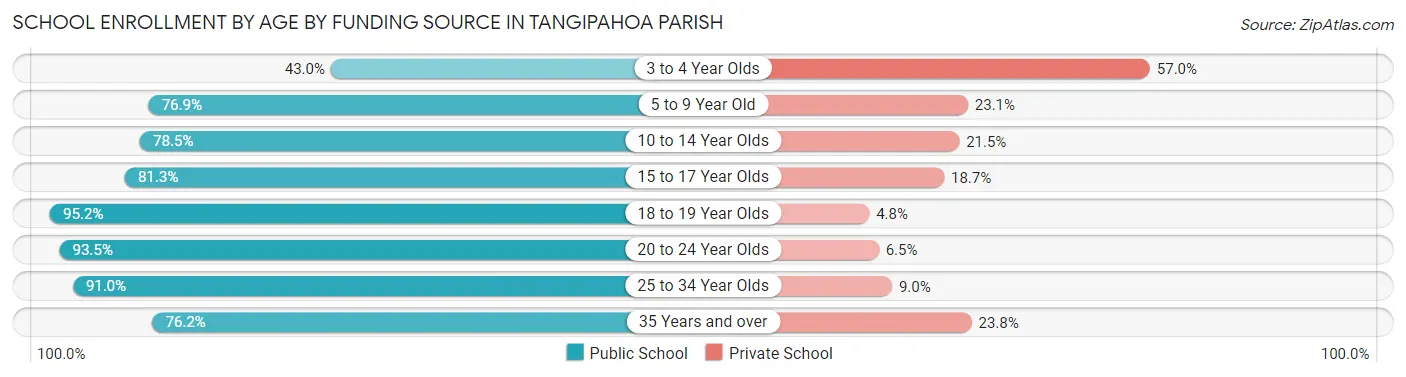
| Age Bracket | Public School | Private School |
| 3 to 4 Year Olds | 599 (43.0%) | 795 (57.0%) |
| 5 to 9 Year Old | 6,053 (76.9%) | 1,821 (23.1%) |
| 10 to 14 Year Olds | 7,224 (78.5%) | 1,981 (21.5%) |
| 15 to 17 Year Olds | 4,042 (81.3%) | 930 (18.7%) |
| 18 to 19 Year Olds | 3,484 (95.2%) | 174 (4.8%) |
| 20 to 24 Year Olds | 3,583 (93.5%) | 250 (6.5%) |
| 25 to 34 Year Olds | 2,073 (91.0%) | 205 (9.0%) |
| 35 Years and over | 729 (76.2%) | 228 (23.8%) |
| Total | 27,781 (81.3%) | 6,390 (18.7%) |
Educational Attainment by Field of Study in Tangipahoa Parish
Education (3,397 | 17.1%), business (3,377 | 17.0%), science & technology (3,166 | 15.9%), arts & humanities (1,714 | 8.6%), and liberal arts & history (1,684 | 8.5%) are the most common fields of study among 19,919 individuals in Tangipahoa Parish who have obtained a bachelor's degree or higher.
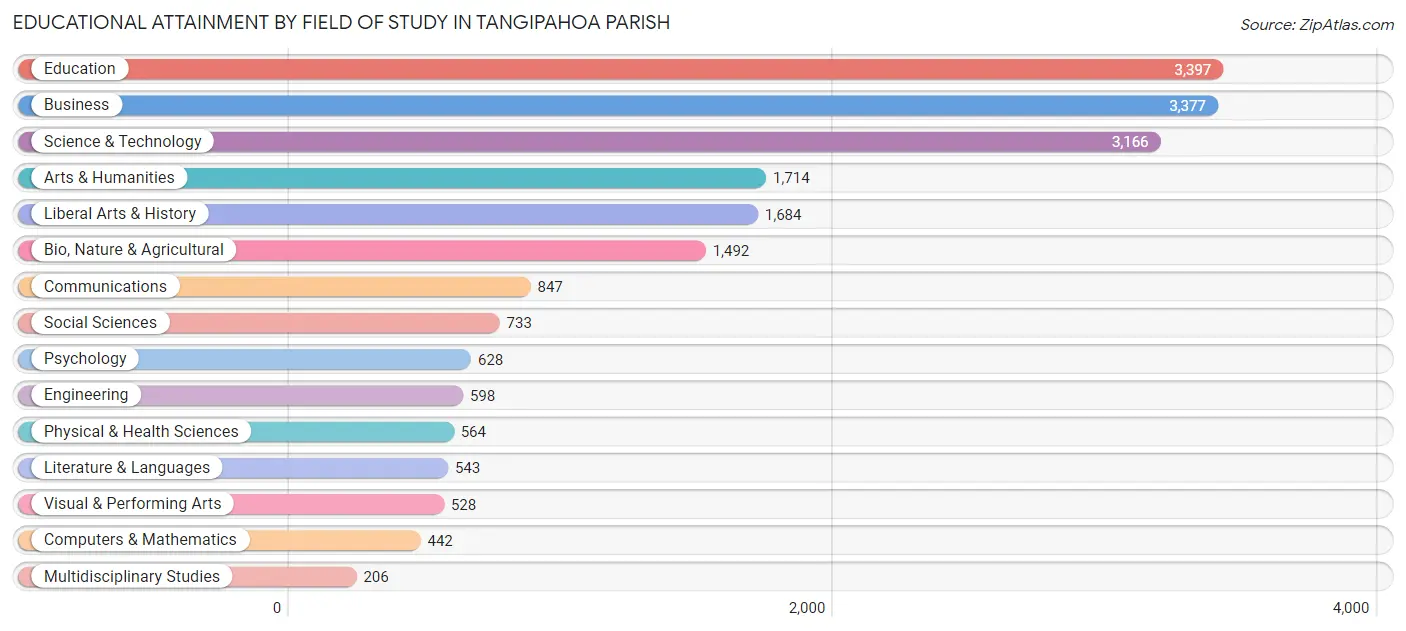
| Field of Study | # Graduates | % Graduates |
| Computers & Mathematics | 442 | 2.2% |
| Bio, Nature & Agricultural | 1,492 | 7.5% |
| Physical & Health Sciences | 564 | 2.8% |
| Psychology | 628 | 3.2% |
| Social Sciences | 733 | 3.7% |
| Engineering | 598 | 3.0% |
| Multidisciplinary Studies | 206 | 1.0% |
| Science & Technology | 3,166 | 15.9% |
| Business | 3,377 | 17.0% |
| Education | 3,397 | 17.1% |
| Literature & Languages | 543 | 2.7% |
| Liberal Arts & History | 1,684 | 8.5% |
| Visual & Performing Arts | 528 | 2.6% |
| Communications | 847 | 4.3% |
| Arts & Humanities | 1,714 | 8.6% |
| Total | 19,919 | 100.0% |
Transportation & Commute in Tangipahoa Parish
Vehicle Availability by Sex in Tangipahoa Parish
The most prevalent vehicle ownership categories in Tangipahoa Parish are males with 2 vehicles (12,967, accounting for 44.6%) and females with 2 vehicles (10,682, making up 49.2%).
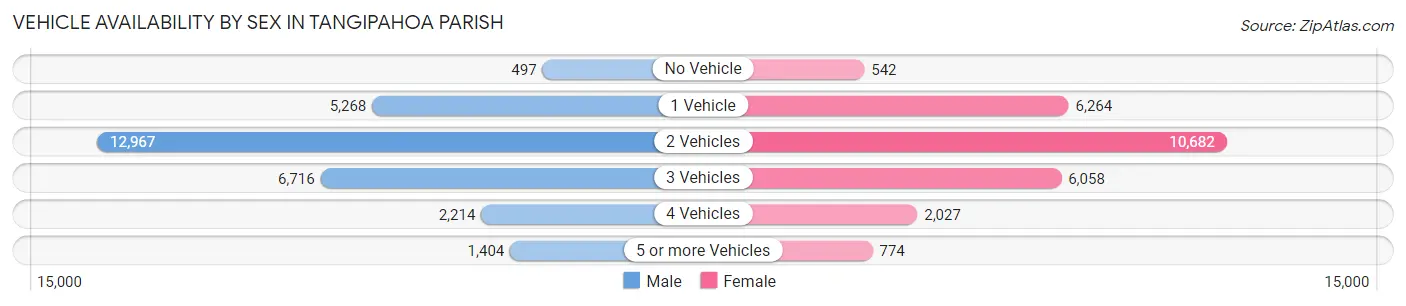
| Vehicles Available | Male | Female |
| No Vehicle | 497 (1.7%) | 542 (2.1%) |
| 1 Vehicle | 5,268 (18.1%) | 6,264 (23.8%) |
| 2 Vehicles | 12,967 (44.6%) | 10,682 (40.5%) |
| 3 Vehicles | 6,716 (23.1%) | 6,058 (23.0%) |
| 4 Vehicles | 2,214 (7.6%) | 2,027 (7.7%) |
| 5 or more Vehicles | 1,404 (4.8%) | 774 (2.9%) |
| Total | 29,066 (100.0%) | 26,347 (100.0%) |
Commute Time in Tangipahoa Parish
The most frequently occuring commute durations in Tangipahoa Parish are 15 to 19 minutes (9,050 commuters, 17.0%), 10 to 14 minutes (7,458 commuters, 14.0%), and 45 to 59 minutes (6,071 commuters, 11.4%).
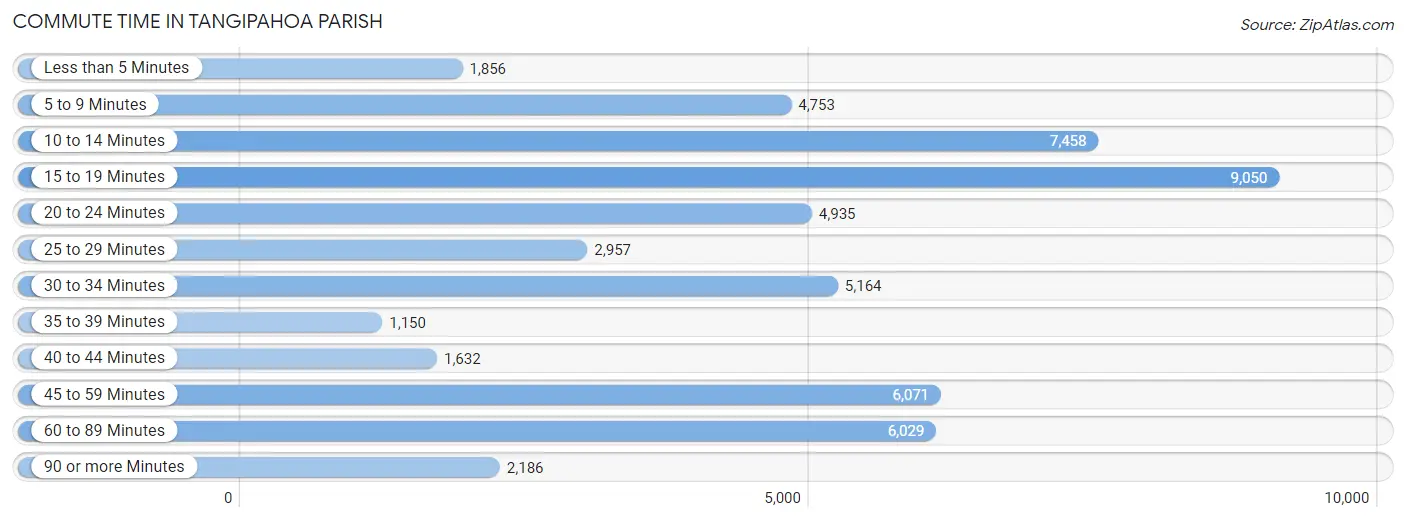
| Commute Time | # Commuters | % Commuters |
| Less than 5 Minutes | 1,856 | 3.5% |
| 5 to 9 Minutes | 4,753 | 8.9% |
| 10 to 14 Minutes | 7,458 | 14.0% |
| 15 to 19 Minutes | 9,050 | 17.0% |
| 20 to 24 Minutes | 4,935 | 9.3% |
| 25 to 29 Minutes | 2,957 | 5.6% |
| 30 to 34 Minutes | 5,164 | 9.7% |
| 35 to 39 Minutes | 1,150 | 2.2% |
| 40 to 44 Minutes | 1,632 | 3.1% |
| 45 to 59 Minutes | 6,071 | 11.4% |
| 60 to 89 Minutes | 6,029 | 11.3% |
| 90 or more Minutes | 2,186 | 4.1% |
Commute Time by Sex in Tangipahoa Parish
The most common commute times in Tangipahoa Parish are 60 to 89 minutes (4,274 commuters, 15.3%) for males and 15 to 19 minutes (5,259 commuters, 20.7%) for females.
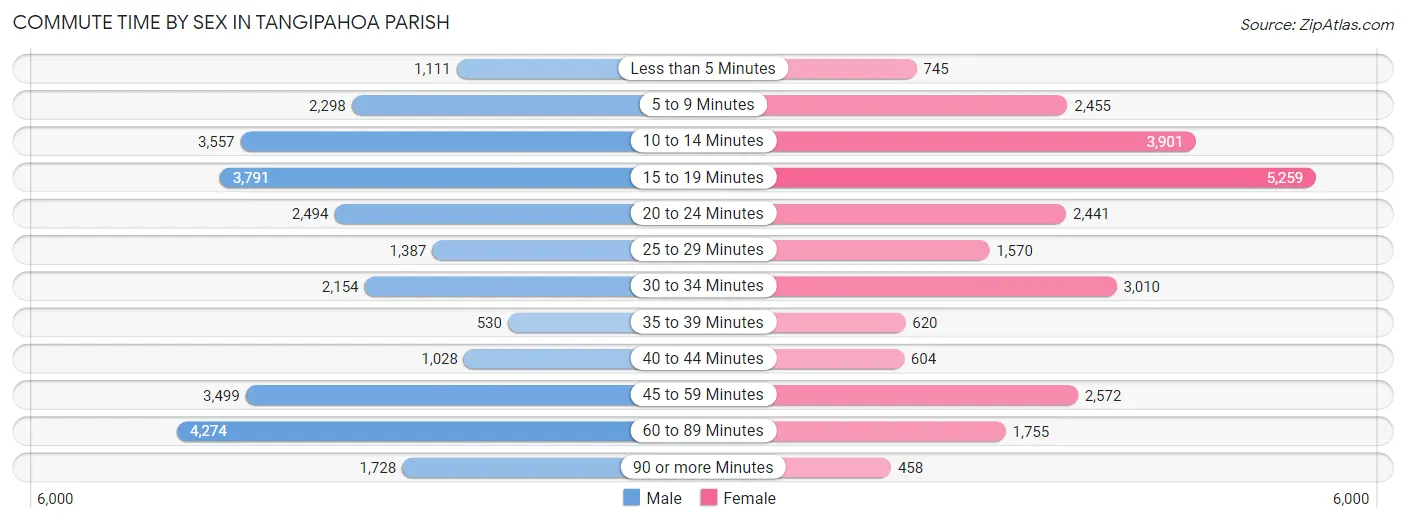
| Commute Time | Male | Female |
| Less than 5 Minutes | 1,111 (4.0%) | 745 (2.9%) |
| 5 to 9 Minutes | 2,298 (8.3%) | 2,455 (9.7%) |
| 10 to 14 Minutes | 3,557 (12.8%) | 3,901 (15.4%) |
| 15 to 19 Minutes | 3,791 (13.6%) | 5,259 (20.7%) |
| 20 to 24 Minutes | 2,494 (8.9%) | 2,441 (9.6%) |
| 25 to 29 Minutes | 1,387 (5.0%) | 1,570 (6.2%) |
| 30 to 34 Minutes | 2,154 (7.7%) | 3,010 (11.9%) |
| 35 to 39 Minutes | 530 (1.9%) | 620 (2.4%) |
| 40 to 44 Minutes | 1,028 (3.7%) | 604 (2.4%) |
| 45 to 59 Minutes | 3,499 (12.6%) | 2,572 (10.1%) |
| 60 to 89 Minutes | 4,274 (15.3%) | 1,755 (6.9%) |
| 90 or more Minutes | 1,728 (6.2%) | 458 (1.8%) |
Time of Departure to Work by Sex in Tangipahoa Parish
The most frequent times of departure to work in Tangipahoa Parish are 12:00 AM to 4:59 AM (4,854, 17.4%) for males and 7:00 AM to 7:29 AM (4,328, 17.1%) for females.
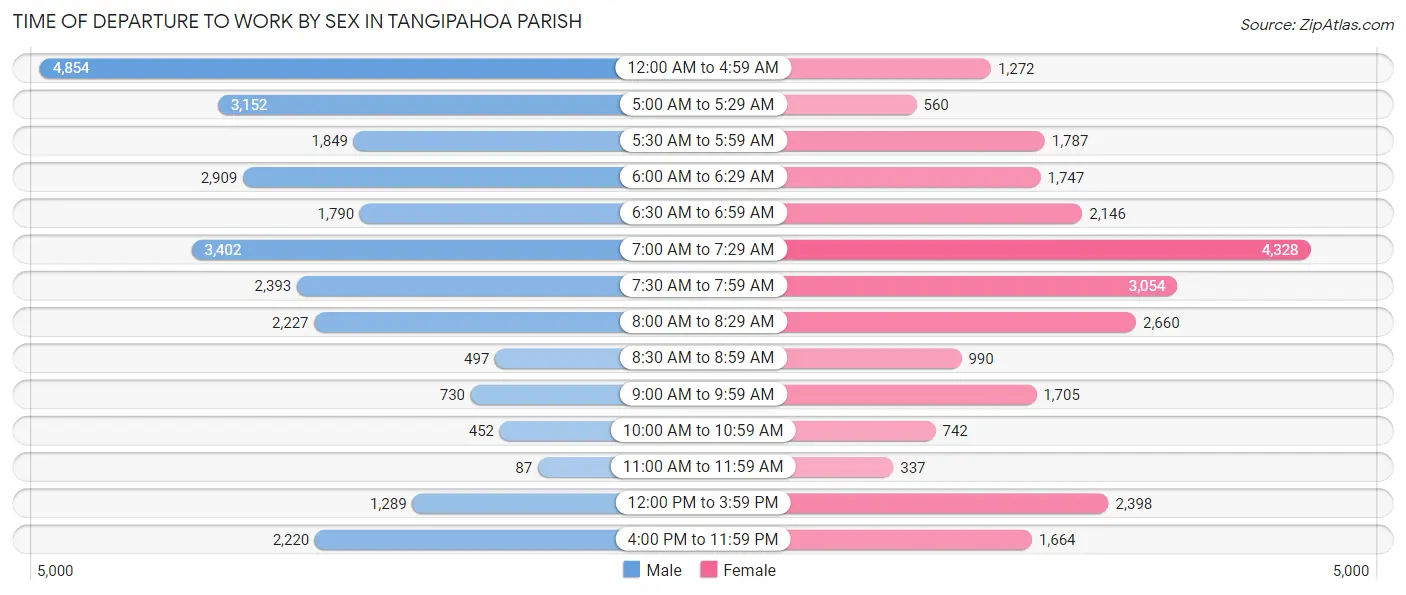
| Time of Departure | Male | Female |
| 12:00 AM to 4:59 AM | 4,854 (17.4%) | 1,272 (5.0%) |
| 5:00 AM to 5:29 AM | 3,152 (11.3%) | 560 (2.2%) |
| 5:30 AM to 5:59 AM | 1,849 (6.6%) | 1,787 (7.0%) |
| 6:00 AM to 6:29 AM | 2,909 (10.4%) | 1,747 (6.9%) |
| 6:30 AM to 6:59 AM | 1,790 (6.4%) | 2,146 (8.5%) |
| 7:00 AM to 7:29 AM | 3,402 (12.2%) | 4,328 (17.1%) |
| 7:30 AM to 7:59 AM | 2,393 (8.6%) | 3,054 (12.0%) |
| 8:00 AM to 8:29 AM | 2,227 (8.0%) | 2,660 (10.5%) |
| 8:30 AM to 8:59 AM | 497 (1.8%) | 990 (3.9%) |
| 9:00 AM to 9:59 AM | 730 (2.6%) | 1,705 (6.7%) |
| 10:00 AM to 10:59 AM | 452 (1.6%) | 742 (2.9%) |
| 11:00 AM to 11:59 AM | 87 (0.3%) | 337 (1.3%) |
| 12:00 PM to 3:59 PM | 1,289 (4.6%) | 2,398 (9.4%) |
| 4:00 PM to 11:59 PM | 2,220 (8.0%) | 1,664 (6.6%) |
| Total | 27,851 (100.0%) | 25,390 (100.0%) |
Housing Occupancy in Tangipahoa Parish
Occupancy by Ownership in Tangipahoa Parish
Of the total 48,658 dwellings in Tangipahoa Parish, owner-occupied units account for 35,378 (72.7%), while renter-occupied units make up 13,280 (27.3%).
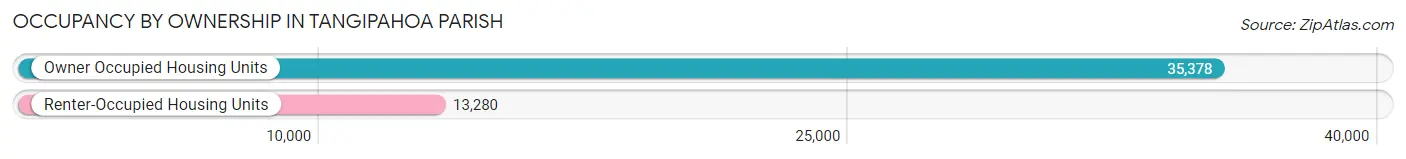
| Occupancy | # Housing Units | % Housing Units |
| Owner Occupied Housing Units | 35,378 | 72.7% |
| Renter-Occupied Housing Units | 13,280 | 27.3% |
| Total Occupied Housing Units | 48,658 | 100.0% |
Occupancy by Household Size in Tangipahoa Parish
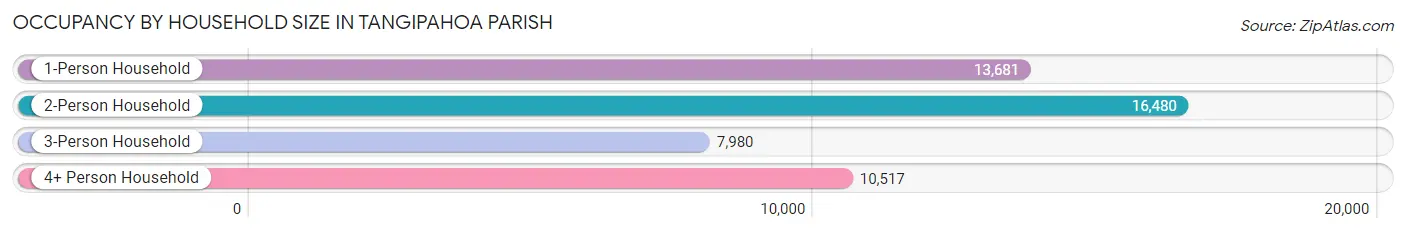
| Household Size | # Housing Units | % Housing Units |
| 1-Person Household | 13,681 | 28.1% |
| 2-Person Household | 16,480 | 33.9% |
| 3-Person Household | 7,980 | 16.4% |
| 4+ Person Household | 10,517 | 21.6% |
| Total Housing Units | 48,658 | 100.0% |
Occupancy by Ownership by Household Size in Tangipahoa Parish
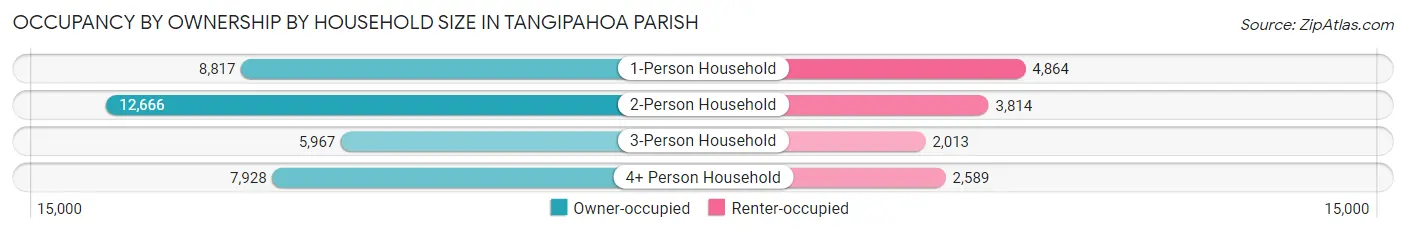
| Household Size | Owner-occupied | Renter-occupied |
| 1-Person Household | 8,817 (64.4%) | 4,864 (35.5%) |
| 2-Person Household | 12,666 (76.9%) | 3,814 (23.1%) |
| 3-Person Household | 5,967 (74.8%) | 2,013 (25.2%) |
| 4+ Person Household | 7,928 (75.4%) | 2,589 (24.6%) |
| Total Housing Units | 35,378 (72.7%) | 13,280 (27.3%) |
Occupancy by Educational Attainment in Tangipahoa Parish
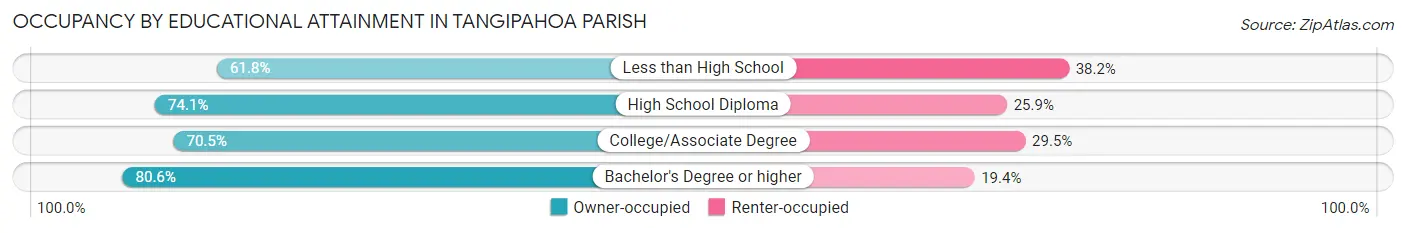
| Household Size | Owner-occupied | Renter-occupied |
| Less than High School | 4,689 (61.8%) | 2,895 (38.2%) |
| High School Diploma | 12,077 (74.1%) | 4,220 (25.9%) |
| College/Associate Degree | 9,406 (70.5%) | 3,944 (29.5%) |
| Bachelor's Degree or higher | 9,206 (80.6%) | 2,221 (19.4%) |
Occupancy by Age of Householder in Tangipahoa Parish
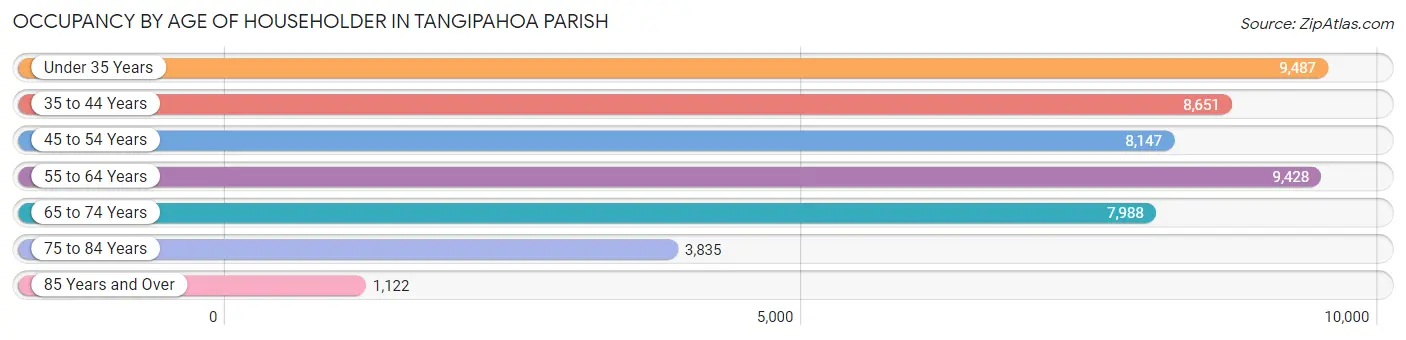
| Age Bracket | # Households | % Households |
| Under 35 Years | 9,487 | 19.5% |
| 35 to 44 Years | 8,651 | 17.8% |
| 45 to 54 Years | 8,147 | 16.7% |
| 55 to 64 Years | 9,428 | 19.4% |
| 65 to 74 Years | 7,988 | 16.4% |
| 75 to 84 Years | 3,835 | 7.9% |
| 85 Years and Over | 1,122 | 2.3% |
| Total | 48,658 | 100.0% |
Housing Finances in Tangipahoa Parish
Median Income by Occupancy in Tangipahoa Parish
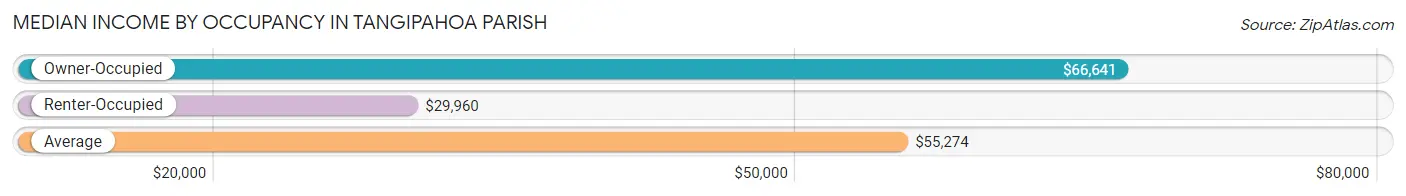
| Occupancy Type | # Households | Median Income |
| Owner-Occupied | 35,378 (72.7%) | $66,641 |
| Renter-Occupied | 13,280 (27.3%) | $29,960 |
| Average | 48,658 (100.0%) | $55,274 |
Occupancy by Householder Income Bracket in Tangipahoa Parish
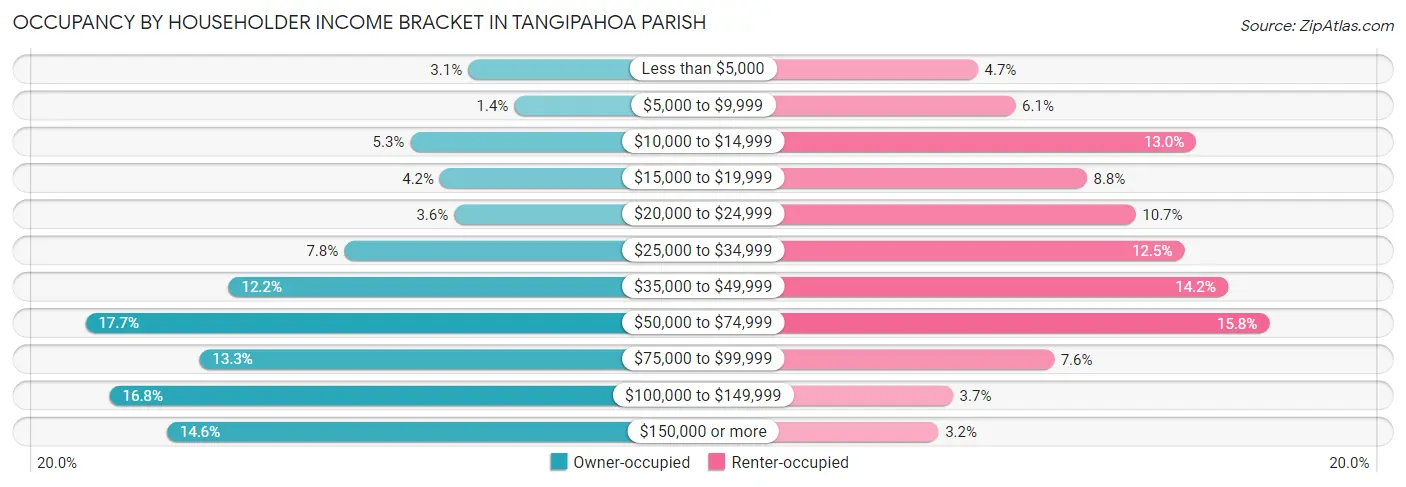
| Income Bracket | Owner-occupied | Renter-occupied |
| Less than $5,000 | 1,099 (3.1%) | 617 (4.6%) |
| $5,000 to $9,999 | 477 (1.3%) | 808 (6.1%) |
| $10,000 to $14,999 | 1,879 (5.3%) | 1,723 (13.0%) |
| $15,000 to $19,999 | 1,479 (4.2%) | 1,169 (8.8%) |
| $20,000 to $24,999 | 1,286 (3.6%) | 1,416 (10.7%) |
| $25,000 to $34,999 | 2,771 (7.8%) | 1,662 (12.5%) |
| $35,000 to $49,999 | 4,326 (12.2%) | 1,882 (14.2%) |
| $50,000 to $74,999 | 6,254 (17.7%) | 2,091 (15.8%) |
| $75,000 to $99,999 | 4,719 (13.3%) | 1,002 (7.5%) |
| $100,000 to $149,999 | 5,929 (16.8%) | 492 (3.7%) |
| $150,000 or more | 5,159 (14.6%) | 418 (3.2%) |
| Total | 35,378 (100.0%) | 13,280 (100.0%) |
Monthly Housing Cost Tiers in Tangipahoa Parish
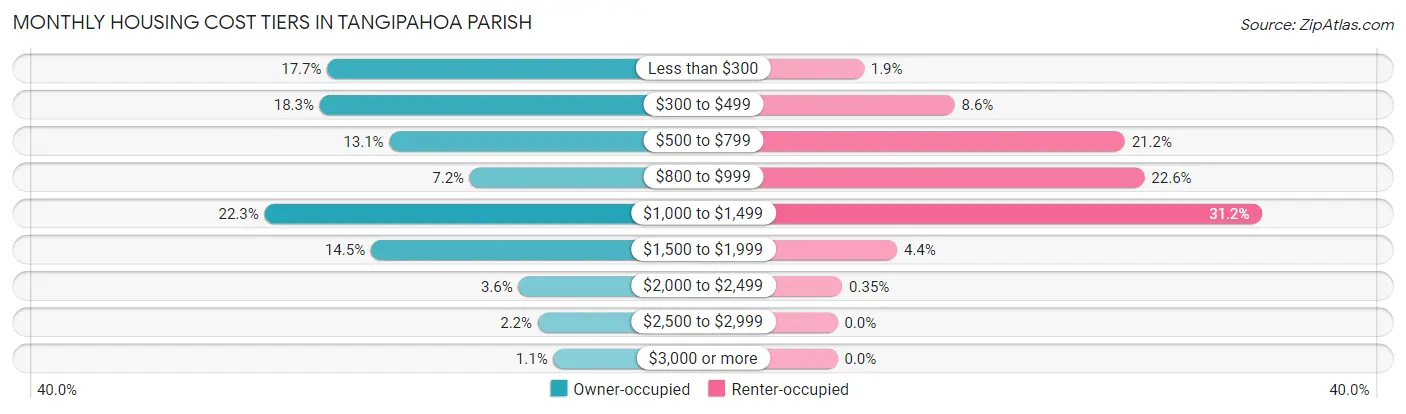
| Monthly Cost | Owner-occupied | Renter-occupied |
| Less than $300 | 6,264 (17.7%) | 257 (1.9%) |
| $300 to $499 | 6,461 (18.3%) | 1,146 (8.6%) |
| $500 to $799 | 4,644 (13.1%) | 2,810 (21.2%) |
| $800 to $999 | 2,547 (7.2%) | 3,003 (22.6%) |
| $1,000 to $1,499 | 7,901 (22.3%) | 4,146 (31.2%) |
| $1,500 to $1,999 | 5,128 (14.5%) | 583 (4.4%) |
| $2,000 to $2,499 | 1,281 (3.6%) | 47 (0.4%) |
| $2,500 to $2,999 | 779 (2.2%) | 0 (0.0%) |
| $3,000 or more | 373 (1.1%) | 0 (0.0%) |
| Total | 35,378 (100.0%) | 13,280 (100.0%) |
Physical Housing Characteristics in Tangipahoa Parish
Housing Structures in Tangipahoa Parish
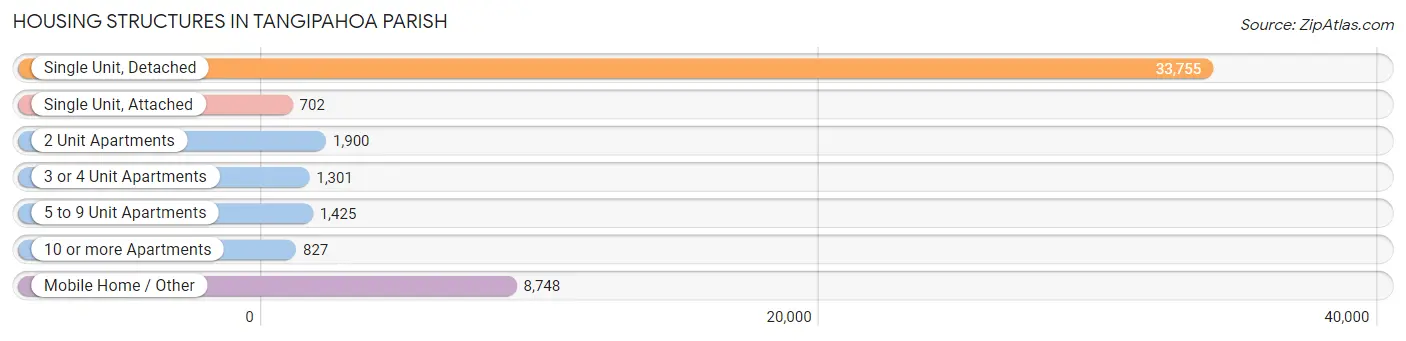
| Structure Type | # Housing Units | % Housing Units |
| Single Unit, Detached | 33,755 | 69.4% |
| Single Unit, Attached | 702 | 1.4% |
| 2 Unit Apartments | 1,900 | 3.9% |
| 3 or 4 Unit Apartments | 1,301 | 2.7% |
| 5 to 9 Unit Apartments | 1,425 | 2.9% |
| 10 or more Apartments | 827 | 1.7% |
| Mobile Home / Other | 8,748 | 18.0% |
| Total | 48,658 | 100.0% |
Housing Structures by Occupancy in Tangipahoa Parish
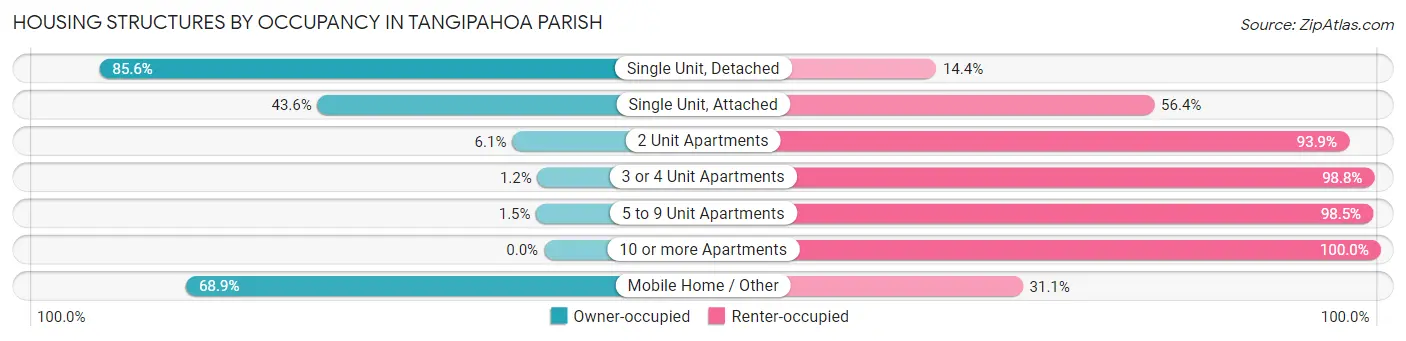
| Structure Type | Owner-occupied | Renter-occupied |
| Single Unit, Detached | 28,890 (85.6%) | 4,865 (14.4%) |
| Single Unit, Attached | 306 (43.6%) | 396 (56.4%) |
| 2 Unit Apartments | 116 (6.1%) | 1,784 (93.9%) |
| 3 or 4 Unit Apartments | 16 (1.2%) | 1,285 (98.8%) |
| 5 to 9 Unit Apartments | 21 (1.5%) | 1,404 (98.5%) |
| 10 or more Apartments | 0 (0.0%) | 827 (100.0%) |
| Mobile Home / Other | 6,029 (68.9%) | 2,719 (31.1%) |
| Total | 35,378 (72.7%) | 13,280 (27.3%) |
Housing Structures by Number of Rooms in Tangipahoa Parish
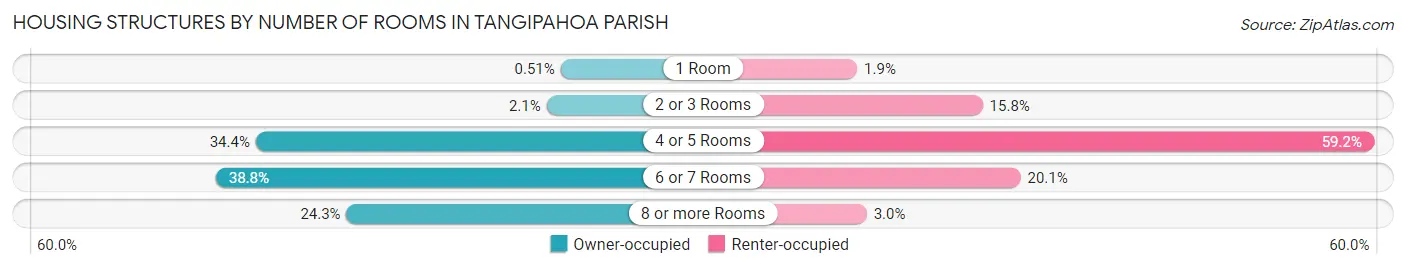
| Number of Rooms | Owner-occupied | Renter-occupied |
| 1 Room | 181 (0.5%) | 253 (1.9%) |
| 2 or 3 Rooms | 734 (2.1%) | 2,103 (15.8%) |
| 4 or 5 Rooms | 12,154 (34.4%) | 7,867 (59.2%) |
| 6 or 7 Rooms | 13,718 (38.8%) | 2,662 (20.1%) |
| 8 or more Rooms | 8,591 (24.3%) | 395 (3.0%) |
| Total | 35,378 (100.0%) | 13,280 (100.0%) |
Housing Structure by Heating Type in Tangipahoa Parish
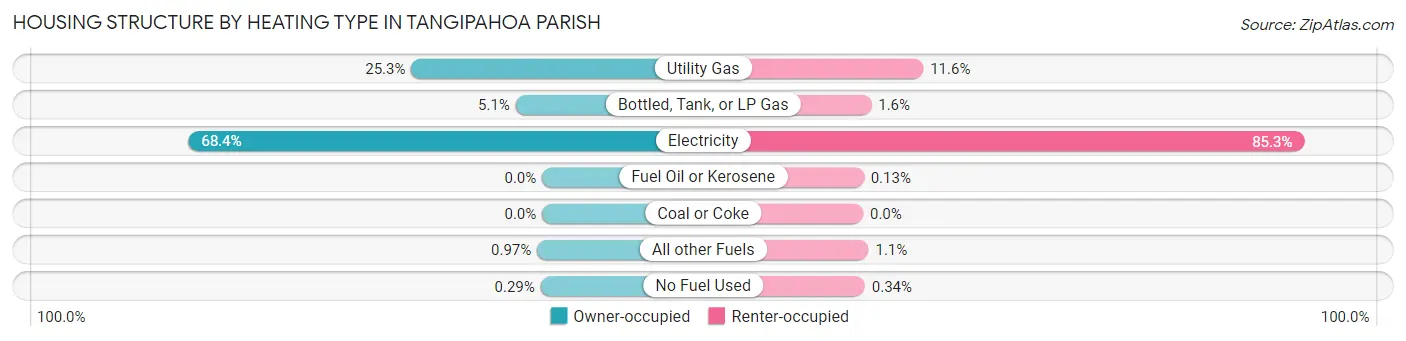
| Heating Type | Owner-occupied | Renter-occupied |
| Utility Gas | 8,944 (25.3%) | 1,545 (11.6%) |
| Bottled, Tank, or LP Gas | 1,803 (5.1%) | 211 (1.6%) |
| Electricity | 24,186 (68.4%) | 11,321 (85.3%) |
| Fuel Oil or Kerosene | 0 (0.0%) | 17 (0.1%) |
| Coal or Coke | 0 (0.0%) | 0 (0.0%) |
| All other Fuels | 344 (1.0%) | 141 (1.1%) |
| No Fuel Used | 101 (0.3%) | 45 (0.3%) |
| Total | 35,378 (100.0%) | 13,280 (100.0%) |
Household Vehicle Usage in Tangipahoa Parish
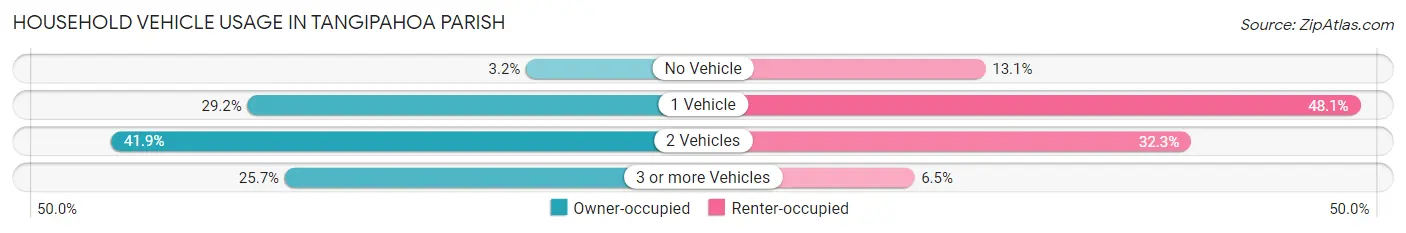
| Vehicles per Household | Owner-occupied | Renter-occupied |
| No Vehicle | 1,124 (3.2%) | 1,740 (13.1%) |
| 1 Vehicle | 10,327 (29.2%) | 6,390 (48.1%) |
| 2 Vehicles | 14,834 (41.9%) | 4,291 (32.3%) |
| 3 or more Vehicles | 9,093 (25.7%) | 859 (6.5%) |
| Total | 35,378 (100.0%) | 13,280 (100.0%) |
Real Estate & Mortgages in Tangipahoa Parish
Real Estate and Mortgage Overview in Tangipahoa Parish
| Characteristic | Without Mortgage | With Mortgage |
| Housing Units | 16,460 | 18,918 |
| Median Property Value | $158,300 | $214,000 |
| Median Household Income | $42,370 | $3,651 |
| Monthly Housing Costs | $360 | $370 |
| Real Estate Taxes | $512 | $3,193 |
Property Value by Mortgage Status in Tangipahoa Parish
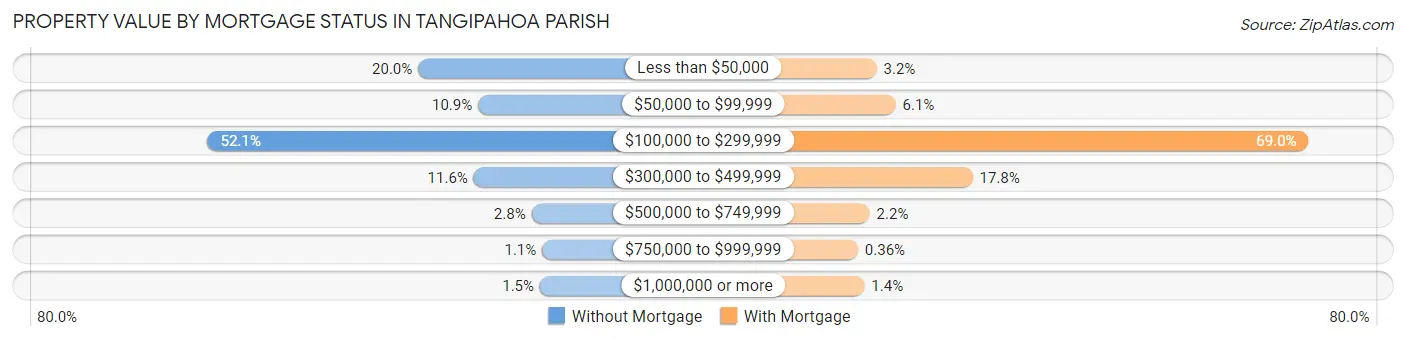
| Property Value | Without Mortgage | With Mortgage |
| Less than $50,000 | 3,299 (20.0%) | 607 (3.2%) |
| $50,000 to $99,999 | 1,794 (10.9%) | 1,154 (6.1%) |
| $100,000 to $299,999 | 8,579 (52.1%) | 13,053 (69.0%) |
| $300,000 to $499,999 | 1,904 (11.6%) | 3,374 (17.8%) |
| $500,000 to $749,999 | 454 (2.8%) | 406 (2.1%) |
| $750,000 to $999,999 | 187 (1.1%) | 68 (0.4%) |
| $1,000,000 or more | 243 (1.5%) | 256 (1.3%) |
| Total | 16,460 (100.0%) | 18,918 (100.0%) |
Household Income by Mortgage Status in Tangipahoa Parish
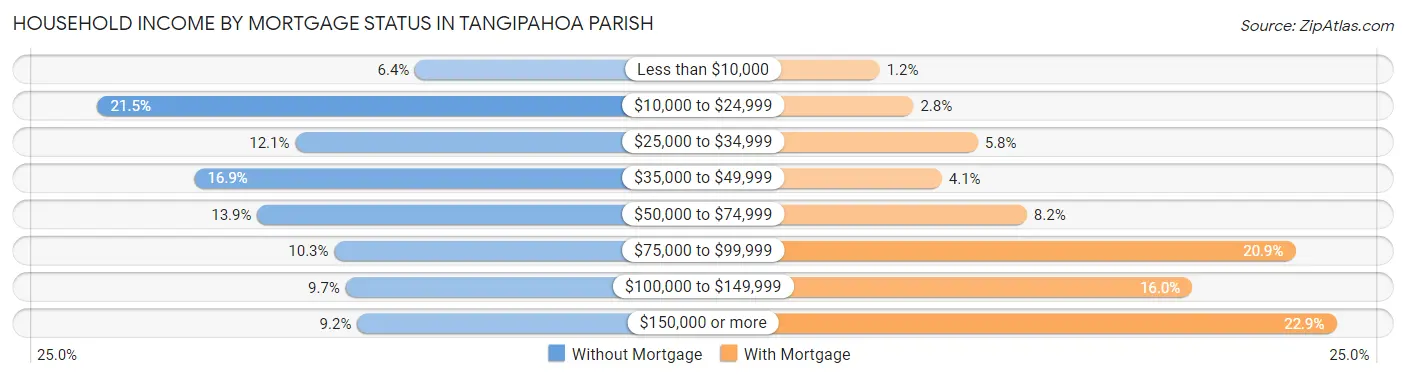
| Household Income | Without Mortgage | With Mortgage |
| Less than $10,000 | 1,054 (6.4%) | 218 (1.1%) |
| $10,000 to $24,999 | 3,543 (21.5%) | 522 (2.8%) |
| $25,000 to $34,999 | 1,994 (12.1%) | 1,101 (5.8%) |
| $35,000 to $49,999 | 2,783 (16.9%) | 777 (4.1%) |
| $50,000 to $74,999 | 2,292 (13.9%) | 1,543 (8.2%) |
| $75,000 to $99,999 | 1,687 (10.2%) | 3,962 (20.9%) |
| $100,000 to $149,999 | 1,599 (9.7%) | 3,032 (16.0%) |
| $150,000 or more | 1,508 (9.2%) | 4,330 (22.9%) |
| Total | 16,460 (100.0%) | 18,918 (100.0%) |
Property Value to Household Income Ratio in Tangipahoa Parish
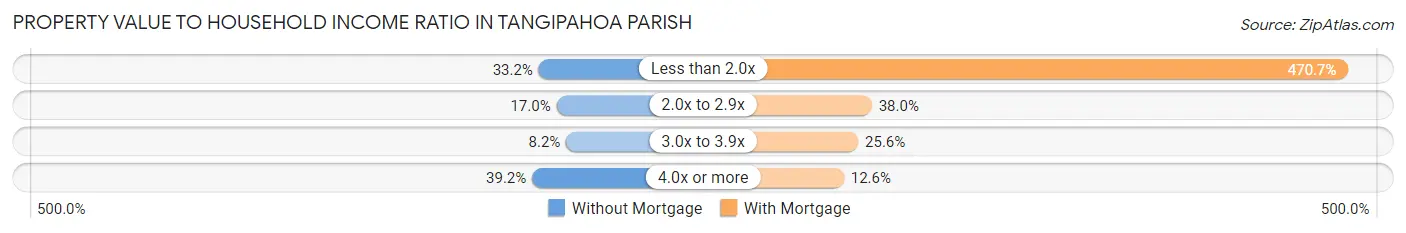
| Value-to-Income Ratio | Without Mortgage | With Mortgage |
| Less than 2.0x | 5,457 (33.2%) | 89,047 (470.7%) |
| 2.0x to 2.9x | 2,799 (17.0%) | 7,184 (38.0%) |
| 3.0x to 3.9x | 1,355 (8.2%) | 4,847 (25.6%) |
| 4.0x or more | 6,448 (39.2%) | 2,379 (12.6%) |
| Total | 16,460 (100.0%) | 18,918 (100.0%) |
Real Estate Taxes by Mortgage Status in Tangipahoa Parish
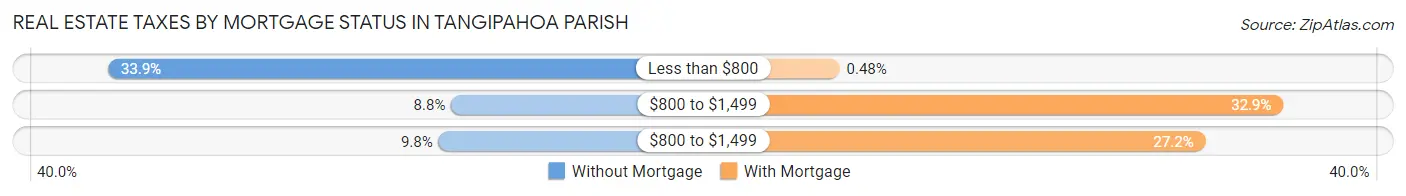
| Property Taxes | Without Mortgage | With Mortgage |
| Less than $800 | 5,581 (33.9%) | 90 (0.5%) |
| $800 to $1,499 | 1,454 (8.8%) | 6,223 (32.9%) |
| $800 to $1,499 | 1,607 (9.8%) | 5,150 (27.2%) |
| Total | 16,460 (100.0%) | 18,918 (100.0%) |
Health & Disability in Tangipahoa Parish
Health Insurance Coverage by Age in Tangipahoa Parish
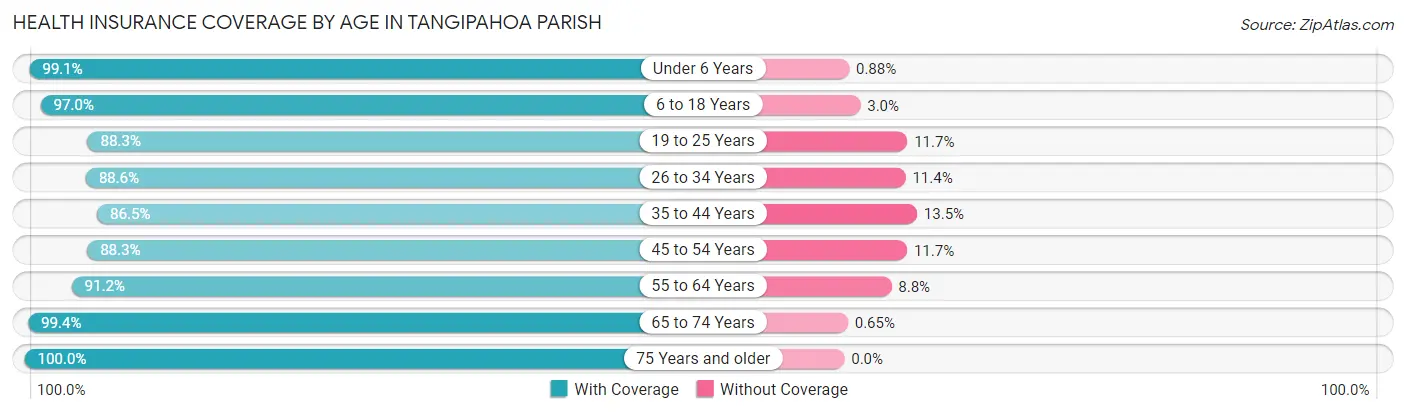
| Age Bracket | With Coverage | Without Coverage |
| Under 6 Years | 10,902 (99.1%) | 97 (0.9%) |
| 6 to 18 Years | 22,595 (97.0%) | 695 (3.0%) |
| 19 to 25 Years | 12,566 (88.3%) | 1,672 (11.7%) |
| 26 to 34 Years | 15,001 (88.6%) | 1,933 (11.4%) |
| 35 to 44 Years | 14,726 (86.5%) | 2,306 (13.5%) |
| 45 to 54 Years | 13,192 (88.3%) | 1,746 (11.7%) |
| 55 to 64 Years | 14,637 (91.2%) | 1,409 (8.8%) |
| 65 to 74 Years | 12,402 (99.4%) | 81 (0.6%) |
| 75 Years and older | 6,950 (100.0%) | 0 (0.0%) |
| Total | 122,971 (92.5%) | 9,939 (7.5%) |
Health Insurance Coverage by Citizenship Status in Tangipahoa Parish
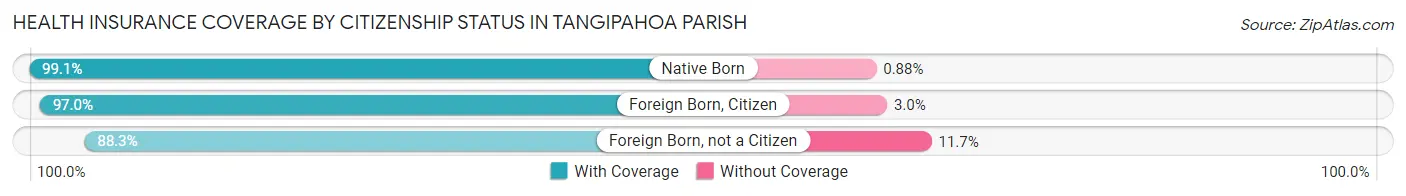
| Citizenship Status | With Coverage | Without Coverage |
| Native Born | 10,902 (99.1%) | 97 (0.9%) |
| Foreign Born, Citizen | 22,595 (97.0%) | 695 (3.0%) |
| Foreign Born, not a Citizen | 12,566 (88.3%) | 1,672 (11.7%) |
Health Insurance Coverage by Household Income in Tangipahoa Parish
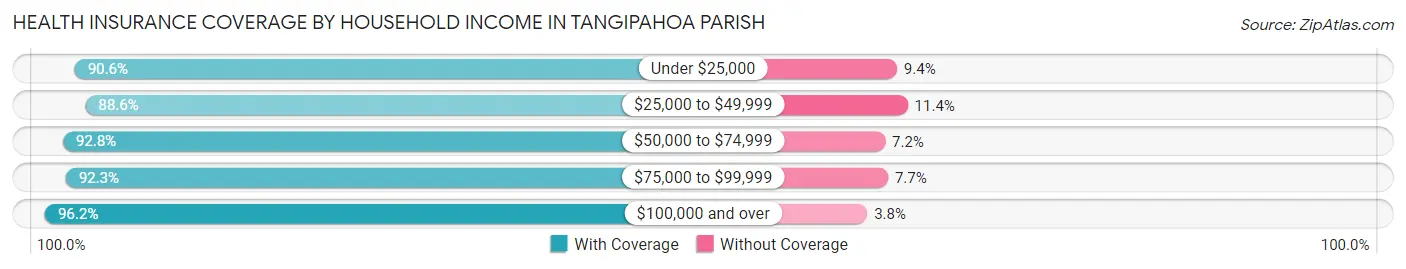
| Household Income | With Coverage | Without Coverage |
| Under $25,000 | 21,798 (90.6%) | 2,260 (9.4%) |
| $25,000 to $49,999 | 22,823 (88.6%) | 2,936 (11.4%) |
| $50,000 to $74,999 | 20,725 (92.8%) | 1,604 (7.2%) |
| $75,000 to $99,999 | 16,466 (92.3%) | 1,376 (7.7%) |
| $100,000 and over | 38,268 (96.2%) | 1,522 (3.8%) |
Public vs Private Health Insurance Coverage by Age in Tangipahoa Parish
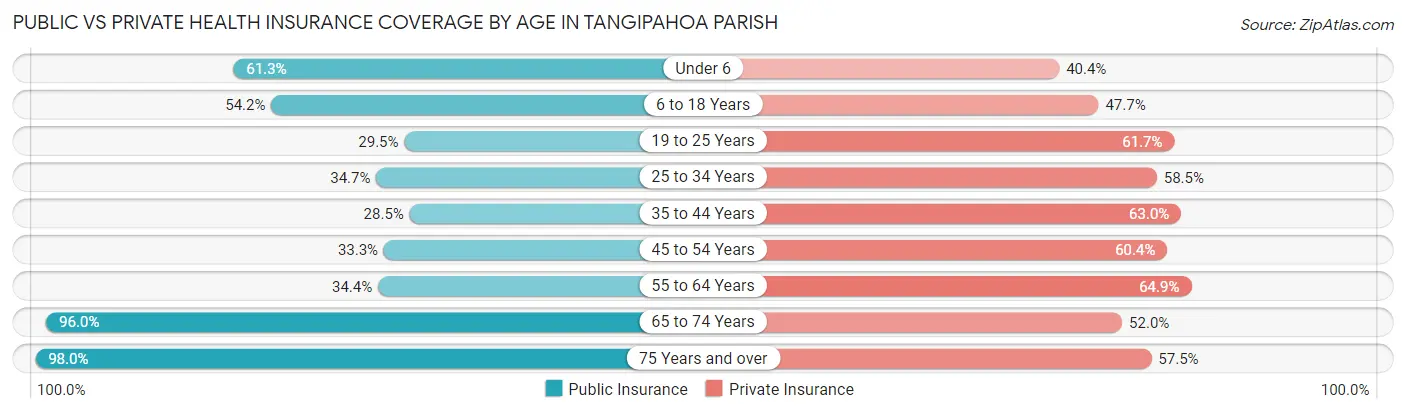
| Age Bracket | Public Insurance | Private Insurance |
| Under 6 | 6,738 (61.3%) | 4,438 (40.4%) |
| 6 to 18 Years | 12,626 (54.2%) | 11,097 (47.6%) |
| 19 to 25 Years | 4,202 (29.5%) | 8,788 (61.7%) |
| 25 to 34 Years | 5,879 (34.7%) | 9,901 (58.5%) |
| 35 to 44 Years | 4,860 (28.5%) | 10,726 (63.0%) |
| 45 to 54 Years | 4,975 (33.3%) | 9,023 (60.4%) |
| 55 to 64 Years | 5,518 (34.4%) | 10,407 (64.9%) |
| 65 to 74 Years | 11,984 (96.0%) | 6,496 (52.0%) |
| 75 Years and over | 6,813 (98.0%) | 3,994 (57.5%) |
| Total | 63,595 (47.8%) | 74,870 (56.3%) |
Disability Status by Sex by Age in Tangipahoa Parish
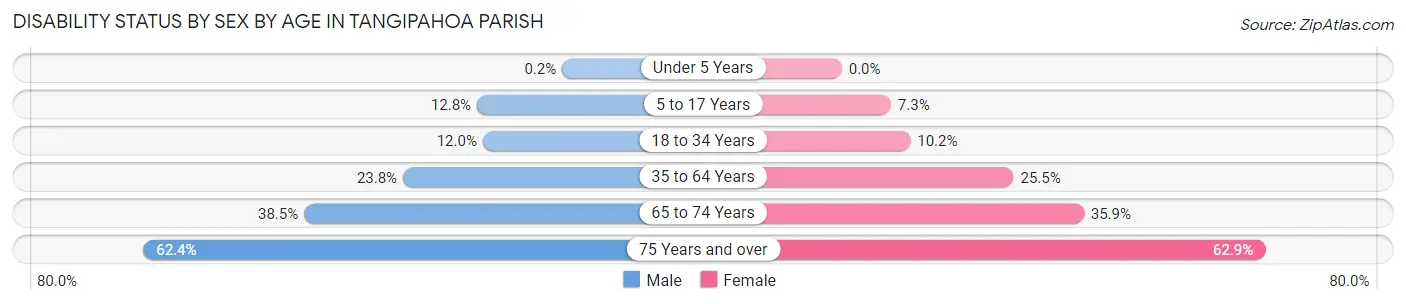
| Age Bracket | Male | Female |
| Under 5 Years | 9 (0.2%) | 0 (0.0%) |
| 5 to 17 Years | 1,533 (12.8%) | 828 (7.3%) |
| 18 to 34 Years | 1,934 (12.0%) | 1,713 (10.2%) |
| 35 to 64 Years | 5,573 (23.8%) | 6,277 (25.5%) |
| 65 to 74 Years | 2,276 (38.5%) | 2,361 (35.9%) |
| 75 Years and over | 1,784 (62.4%) | 2,570 (62.8%) |
Disability Class by Sex by Age in Tangipahoa Parish
Disability Class: Hearing Difficulty
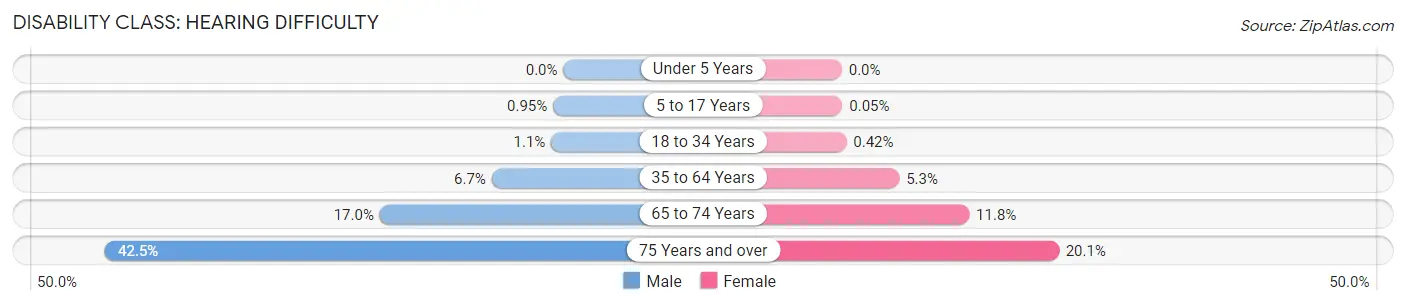
| Age Bracket | Male | Female |
| Under 5 Years | 0 (0.0%) | 0 (0.0%) |
| 5 to 17 Years | 114 (0.9%) | 6 (0.1%) |
| 18 to 34 Years | 183 (1.1%) | 71 (0.4%) |
| 35 to 64 Years | 1,556 (6.7%) | 1,313 (5.3%) |
| 65 to 74 Years | 1,007 (17.0%) | 777 (11.8%) |
| 75 Years and over | 1,217 (42.5%) | 823 (20.1%) |
Disability Class: Vision Difficulty
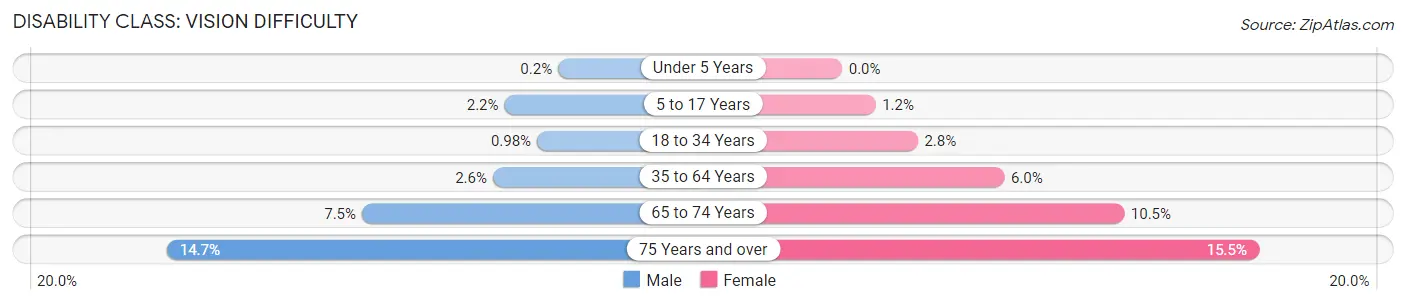
| Age Bracket | Male | Female |
| Under 5 Years | 9 (0.2%) | 0 (0.0%) |
| 5 to 17 Years | 262 (2.2%) | 141 (1.2%) |
| 18 to 34 Years | 158 (1.0%) | 473 (2.8%) |
| 35 to 64 Years | 613 (2.6%) | 1,482 (6.0%) |
| 65 to 74 Years | 442 (7.5%) | 688 (10.5%) |
| 75 Years and over | 421 (14.7%) | 633 (15.5%) |
Disability Class: Cognitive Difficulty
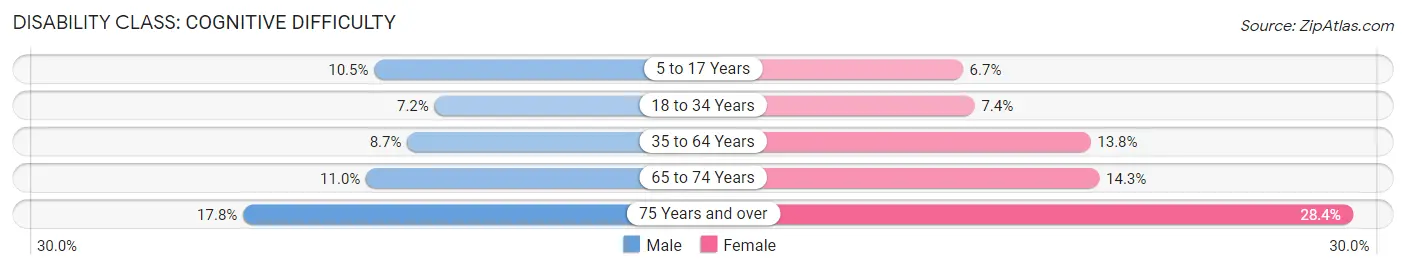
| Age Bracket | Male | Female |
| 5 to 17 Years | 1,258 (10.5%) | 764 (6.7%) |
| 18 to 34 Years | 1,158 (7.2%) | 1,246 (7.4%) |
| 35 to 64 Years | 2,034 (8.7%) | 3,407 (13.8%) |
| 65 to 74 Years | 649 (11.0%) | 942 (14.3%) |
| 75 Years and over | 510 (17.8%) | 1,163 (28.4%) |
Disability Class: Ambulatory Difficulty
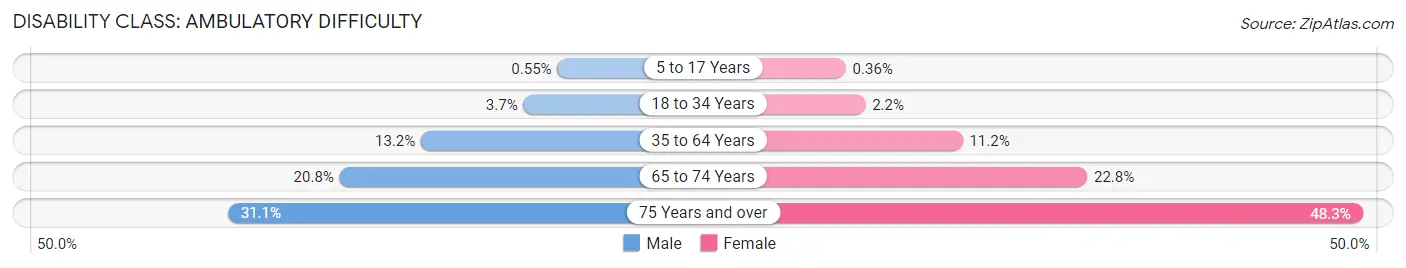
| Age Bracket | Male | Female |
| 5 to 17 Years | 66 (0.5%) | 41 (0.4%) |
| 18 to 34 Years | 597 (3.7%) | 365 (2.2%) |
| 35 to 64 Years | 3,090 (13.2%) | 2,756 (11.2%) |
| 65 to 74 Years | 1,227 (20.8%) | 1,496 (22.8%) |
| 75 Years and over | 891 (31.1%) | 1,976 (48.3%) |
Disability Class: Self-Care Difficulty
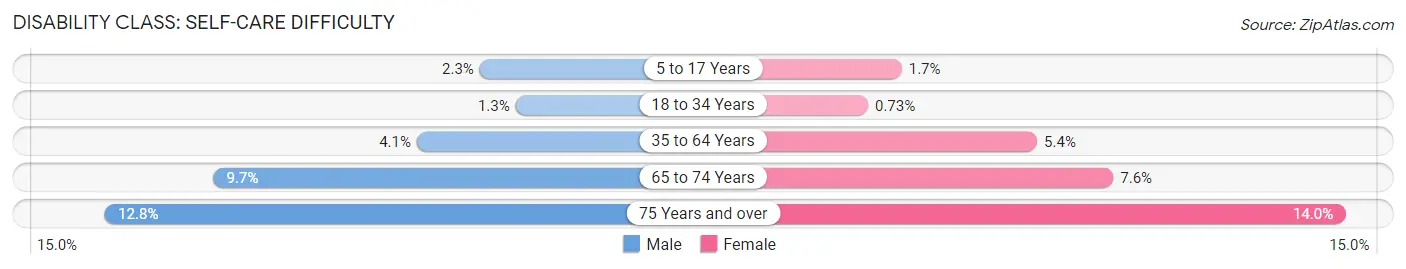
| Age Bracket | Male | Female |
| 5 to 17 Years | 278 (2.3%) | 190 (1.7%) |
| 18 to 34 Years | 215 (1.3%) | 123 (0.7%) |
| 35 to 64 Years | 955 (4.1%) | 1,340 (5.4%) |
| 65 to 74 Years | 576 (9.7%) | 497 (7.6%) |
| 75 Years and over | 365 (12.8%) | 573 (14.0%) |
Technology Access in Tangipahoa Parish
Computing Device Access in Tangipahoa Parish
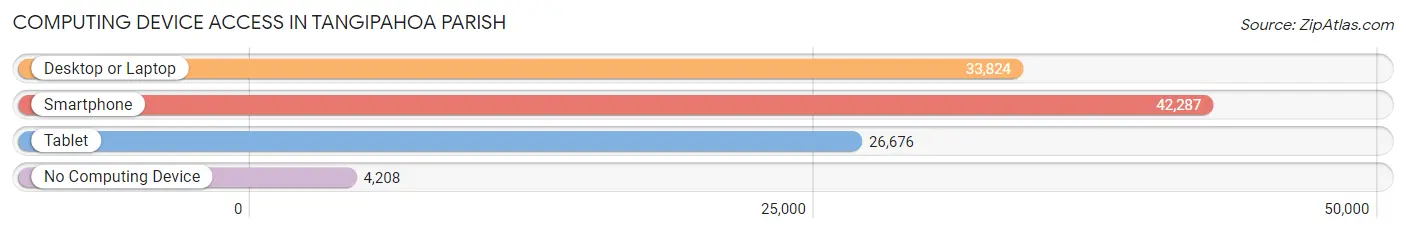
| Device Type | # Households | % Households |
| Desktop or Laptop | 33,824 | 69.5% |
| Smartphone | 42,287 | 86.9% |
| Tablet | 26,676 | 54.8% |
| No Computing Device | 4,208 | 8.6% |
| Total | 48,658 | 100.0% |
Internet Access in Tangipahoa Parish
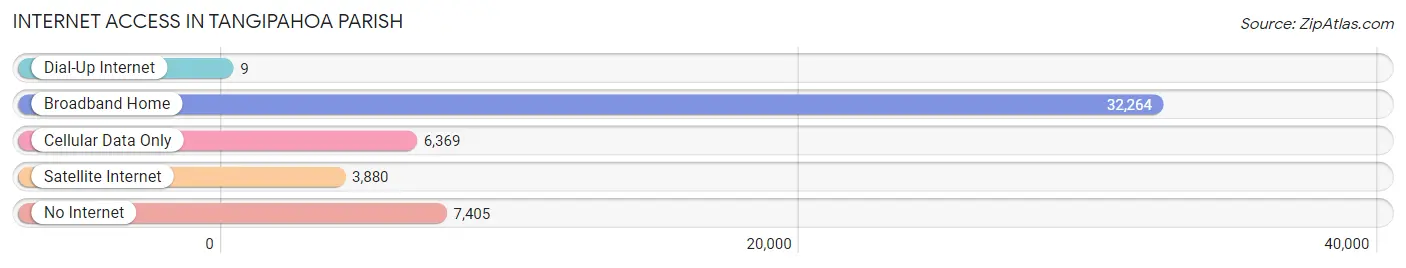
| Internet Type | # Households | % Households |
| Dial-Up Internet | 9 | 0.0% |
| Broadband Home | 32,264 | 66.3% |
| Cellular Data Only | 6,369 | 13.1% |
| Satellite Internet | 3,880 | 8.0% |
| No Internet | 7,405 | 15.2% |
| Total | 48,658 | 100.0% |
Tangipahoa Parish Summary
Introduction
Tangipahoa Parish is located in the southeastern part of Louisiana, and is part of the Greater New Orleans Metropolitan Area. It is bordered by the parishes of St. Tammany, Washington, St. Helena, and Livingston. The parish seat is Amite City, and the largest city is Hammond. The parish was established in 1869 and is named after the Tangipahoa River, which flows through the parish.
History
The area that is now Tangipahoa Parish was originally inhabited by the Choctaw and Chitimacha Native American tribes. The first European settlers arrived in the area in the late 1700s, and the parish was officially established in 1869.
The parish was originally a rural area, but in the early 1900s, the population began to grow as people moved to the area for work in the timber and railroad industries. The parish also became a popular tourist destination, with many people visiting the area for its natural beauty and recreational activities.
In the 1950s, the parish began to experience rapid growth as people moved to the area for jobs in the oil and gas industry. This growth continued into the 1960s and 1970s, and the parish experienced a population boom.
Geography
Tangipahoa Parish is located in the southeastern part of Louisiana, and is part of the Greater New Orleans Metropolitan Area. It is bordered by the parishes of St. Tammany, Washington, St. Helena, and Livingston. The parish covers an area of 837 square miles, and has a population of 121,097 (as of the 2010 census).
The parish is mostly rural, with the majority of the population living in small towns and villages. The parish is home to several lakes, including Lake Pontchartrain, Lake Maurepas, and Lake Cataouatche. The Tangipahoa River flows through the parish, and is a popular destination for fishing and boating.
Economy
The economy of Tangipahoa Parish is largely based on agriculture, forestry, and tourism. The parish is home to several large farms, and is a major producer of soybeans, corn, and cotton. The timber industry is also an important part of the economy, and the parish is home to several large lumber mills.
The parish is also a popular tourist destination, with many people visiting the area for its natural beauty and recreational activities. The parish is home to several state parks, including Lake Pontchartrain State Park and Lake Maurepas State Park.
Demographics
As of the 2010 census, the population of Tangipahoa Parish was 121,097. The racial makeup of the parish was 68.3% White, 28.2% African American, 0.5% Native American, 0.7% Asian, 0.1% Pacific Islander, and 1.2% from other races. Hispanic or Latino of any race were 2.3% of the population.
The median household income in the parish was $41,945, and the median family income was $50,945. The per capita income was $20,945. About 17.2% of the population was below the poverty line.
Conclusion
Tangipahoa Parish is located in the southeastern part of Louisiana, and is part of the Greater New Orleans Metropolitan Area. It is bordered by the parishes of St. Tammany, Washington, St. Helena, and Livingston. The parish was established in 1869 and is named after the Tangipahoa River, which flows through the parish. The economy of Tangipahoa Parish is largely based on agriculture, forestry, and tourism. As of the 2010 census, the population of Tangipahoa Parish was 121,097. The racial makeup of the parish was 68.3% White, 28.2% African American, 0.5% Native American, 0.7% Asian, 0.1% Pacific Islander, and 1.2% from other races. The median household income in the parish was $41,945, and the median family income was $50,945. The per capita income was $20,945. About 17.2% of the population was below the poverty line.
Common Questions
What is the Total Population of Tangipahoa Parish?
Total Population of Tangipahoa Parish is 133,953.
What is the Total Male Population of Tangipahoa Parish?
Total Male Population of Tangipahoa Parish is 65,523.
What is the Total Female Population of Tangipahoa Parish?
Total Female Population of Tangipahoa Parish is 68,430.
What is the Ratio of Males per 100 Females in Tangipahoa Parish?
There are 95.75 Males per 100 Females in Tangipahoa Parish.
What is the Ratio of Females per 100 Males in Tangipahoa Parish?
There are 104.44 Females per 100 Males in Tangipahoa Parish.
What is the Median Population Age in Tangipahoa Parish?
Median Population Age in Tangipahoa Parish is 35.7 Years.
What is the Average Family Size in Tangipahoa Parish
Average Family Size in Tangipahoa Parish is 3.3 People.
What is the Average Household Size in Tangipahoa Parish
Average Household Size in Tangipahoa Parish is 2.7 People.
What is Per Capita Income in Tangipahoa Parish?
Per Capita income in Tangipahoa Parish is $29,192.
What is the Median Family Income in Tangipahoa Parish?
Median Family Income in Tangipahoa Parish is $69,080.
What is the Median Household income in Tangipahoa Parish?
Median Household Income in Tangipahoa Parish is $55,274.
What is Income or Wage Gap in Tangipahoa Parish?
Income or Wage Gap in Tangipahoa Parish is 35.8%.
Women in Tangipahoa Parish earn 64.2 cents for every dollar earned by a man.
What is Family Income Deficit in Tangipahoa Parish?
Family Income Deficit in Tangipahoa Parish is $11,249.
Families that are below poverty line in Tangipahoa Parish earn $11,249 less on average than the poverty threshold level.
What is Inequality or Gini Index in Tangipahoa Parish?
Inequality or Gini Index in Tangipahoa Parish is 0.47.
How Large is the Labor Force in Tangipahoa Parish?
There are 61,029 People in the Labor Forcein in Tangipahoa Parish.
What is the Percentage of People in the Labor Force in Tangipahoa Parish?
57.9% of People are in the Labor Force in Tangipahoa Parish.
What is the Unemployment Rate in Tangipahoa Parish?
Unemployment Rate in Tangipahoa Parish is 5.6%.