St. Tammany Parish, LA
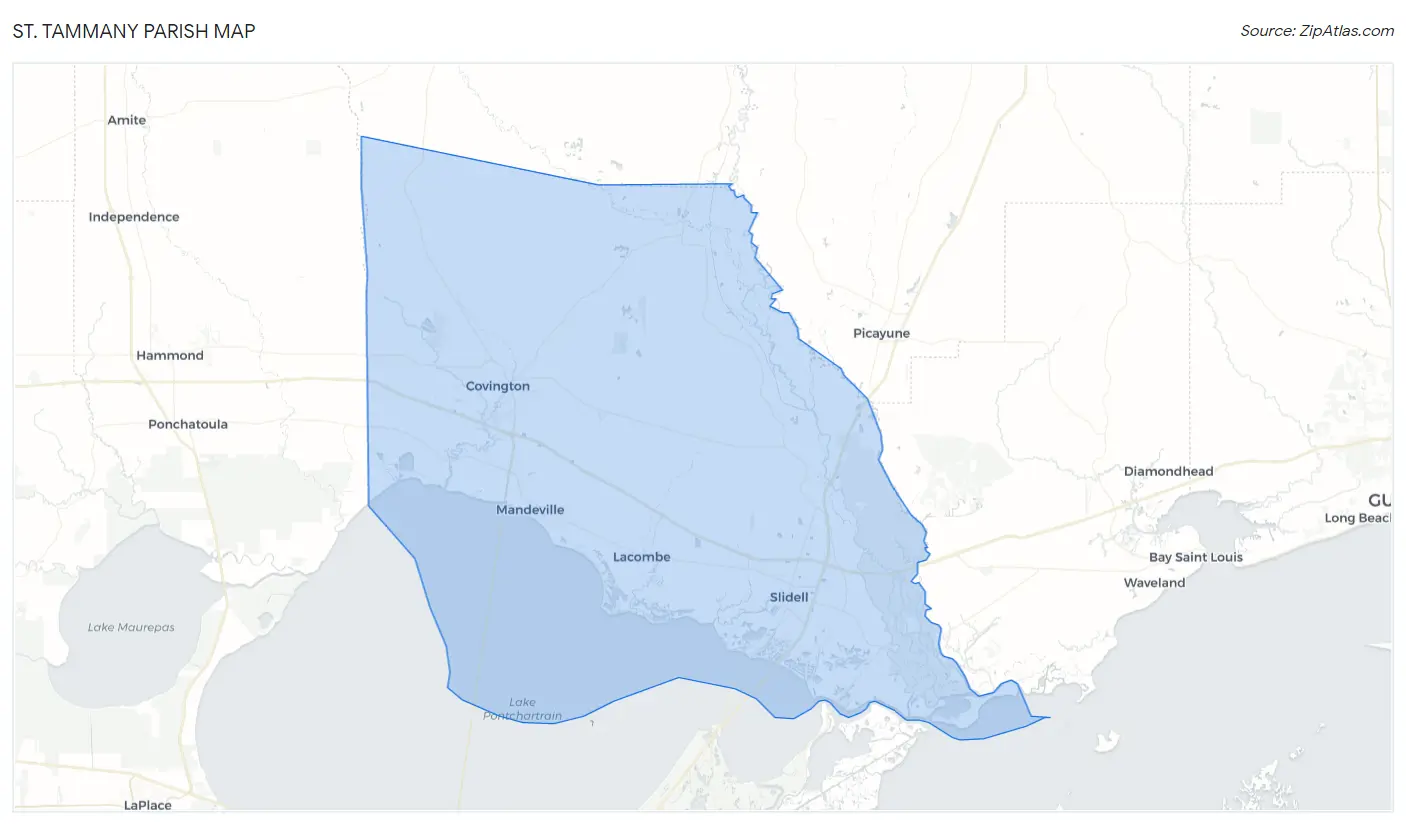
St. Tammany Parish Map
St. Tammany Parish Overview
266,168
TOTAL POPULATION
130,486
MALE POPULATION
135,682
FEMALE POPULATION
96.17
MALES / 100 FEMALES
103.98
FEMALES / 100 MALES
40.6
MEDIAN AGE
3.1
AVG FAMILY SIZE
2.6
AVG HOUSEHOLD SIZE
$40,393
PER CAPITA INCOME
$92,115
AVG FAMILY INCOME
$76,914
AVG HOUSEHOLD INCOME
37.9%
WAGE / INCOME GAP [ % ]
62.1¢/ $1
WAGE / INCOME GAP [ $ ]
$10,333
FAMILY INCOME DEFICIT
0.46
INEQUALITY / GINI INDEX
131,782
LABOR FORCE [ PEOPLE ]
62.5%
PERCENT IN LABOR FORCE
5.2%
UNEMPLOYMENT RATE
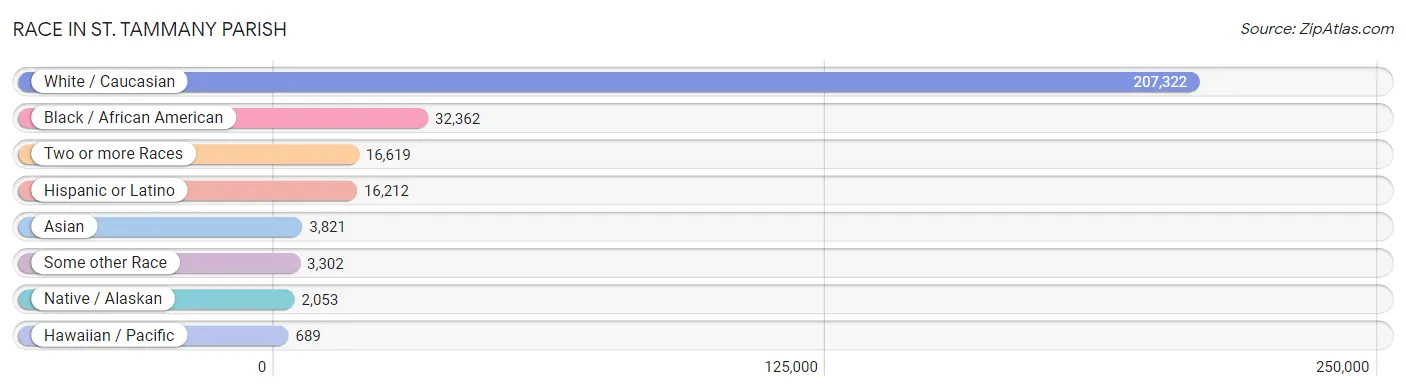
Race in St. Tammany Parish
The most populous races in St. Tammany Parish are White / Caucasian (207,322 | 77.9%), Black / African American (32,362 | 12.2%), and Two or more Races (16,619 | 6.2%).
| Race | # Population | % Population |
| Asian | 3,821 | 1.4% |
| Black / African American | 32,362 | 12.2% |
| Hawaiian / Pacific | 689 | 0.3% |
| Hispanic or Latino | 16,212 | 6.1% |
| Native / Alaskan | 2,053 | 0.8% |
| White / Caucasian | 207,322 | 77.9% |
| Two or more Races | 16,619 | 6.2% |
| Some other Race | 3,302 | 1.2% |
| Total | 266,168 | 100.0% |
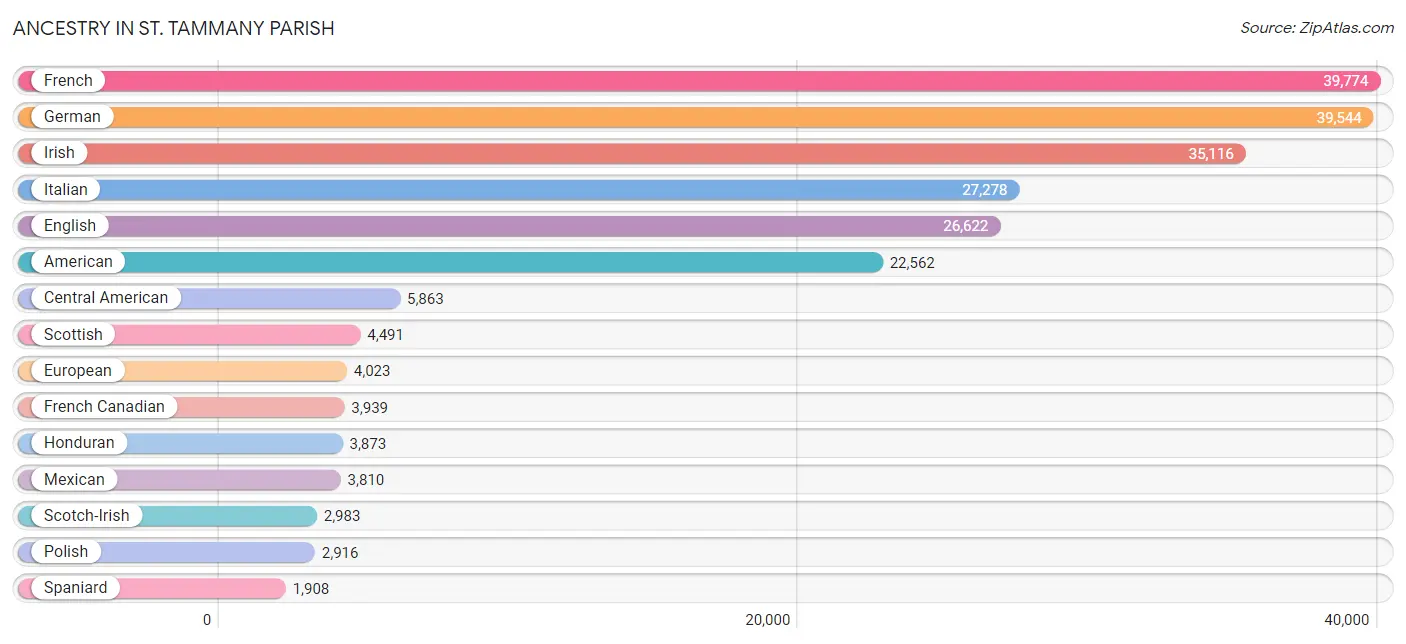
Ancestry in St. Tammany Parish
The most populous ancestries reported in St. Tammany Parish are French (39,774 | 14.9%), German (39,544 | 14.9%), Irish (35,116 | 13.2%), Italian (27,278 | 10.2%), and English (26,622 | 10.0%), together accounting for 63.2% of all St. Tammany Parish residents.
| Ancestry | # Population | % Population |
| African | 821 | 0.3% |
| Alaskan Athabascan | 31 | 0.0% |
| Albanian | 16 | 0.0% |
| American | 22,562 | 8.5% |
| Apache | 48 | 0.0% |
| Arab | 1,054 | 0.4% |
| Arapaho | 128 | 0.1% |
| Argentinean | 98 | 0.0% |
| Armenian | 165 | 0.1% |
| Australian | 92 | 0.0% |
| Austrian | 698 | 0.3% |
| Barbadian | 95 | 0.0% |
| Basque | 23 | 0.0% |
| Belgian | 248 | 0.1% |
| Belizean | 101 | 0.0% |
| Bhutanese | 285 | 0.1% |
| Blackfeet | 164 | 0.1% |
| Bolivian | 13 | 0.0% |
| Brazilian | 363 | 0.1% |
| British | 1,244 | 0.5% |
| Bulgarian | 120 | 0.1% |
| Burmese | 135 | 0.1% |
| Cajun | 1,233 | 0.5% |
| Cambodian | 12 | 0.0% |
| Canadian | 396 | 0.2% |
| Celtic | 31 | 0.0% |
| Central American | 5,863 | 2.2% |
| Central American Indian | 382 | 0.1% |
| Cherokee | 806 | 0.3% |
| Chickasaw | 49 | 0.0% |
| Chilean | 10 | 0.0% |
| Chippewa | 75 | 0.0% |
| Choctaw | 351 | 0.1% |
| Colombian | 358 | 0.1% |
| Comanche | 17 | 0.0% |
| Costa Rican | 147 | 0.1% |
| Cree | 5 | 0.0% |
| Creek | 110 | 0.0% |
| Croatian | 273 | 0.1% |
| Cuban | 584 | 0.2% |
| Czech | 273 | 0.1% |
| Czechoslovakian | 117 | 0.0% |
| Danish | 549 | 0.2% |
| Dominican | 63 | 0.0% |
| Dutch | 1,672 | 0.6% |
| Eastern European | 154 | 0.1% |
| Ecuadorian | 64 | 0.0% |
| Egyptian | 10 | 0.0% |
| English | 26,622 | 10.0% |
| Estonian | 23 | 0.0% |
| Ethiopian | 33 | 0.0% |
| European | 4,023 | 1.5% |
| Filipino | 11 | 0.0% |
| Finnish | 205 | 0.1% |
| French | 39,774 | 14.9% |
| French American Indian | 43 | 0.0% |
| French Canadian | 3,939 | 1.5% |
| German | 39,544 | 14.9% |
| Ghanaian | 25 | 0.0% |
| Greek | 820 | 0.3% |
| Guamanian / Chamorro | 324 | 0.1% |
| Guatemalan | 277 | 0.1% |
| Haitian | 176 | 0.1% |
| Honduran | 3,873 | 1.5% |
| Houma | 263 | 0.1% |
| Hungarian | 517 | 0.2% |
| Indian (Asian) | 720 | 0.3% |
| Indonesian | 19 | 0.0% |
| Iranian | 45 | 0.0% |
| Irish | 35,116 | 13.2% |
| Iroquois | 55 | 0.0% |
| Israeli | 112 | 0.0% |
| Italian | 27,278 | 10.2% |
| Jamaican | 31 | 0.0% |
| Jordanian | 88 | 0.0% |
| Korean | 1,280 | 0.5% |
| Laotian | 16 | 0.0% |
| Latvian | 71 | 0.0% |
| Lebanese | 499 | 0.2% |
| Lithuanian | 427 | 0.2% |
| Malaysian | 50 | 0.0% |
| Mexican | 3,810 | 1.4% |
| Mexican American Indian | 589 | 0.2% |
| Native Hawaiian | 153 | 0.1% |
| Navajo | 36 | 0.0% |
| Nicaraguan | 425 | 0.2% |
| Nigerian | 191 | 0.1% |
| Northern European | 633 | 0.2% |
| Norwegian | 1,884 | 0.7% |
| Pakistani | 63 | 0.0% |
| Palestinian | 52 | 0.0% |
| Panamanian | 191 | 0.1% |
| Paraguayan | 3 | 0.0% |
| Pennsylvania German | 11 | 0.0% |
| Peruvian | 99 | 0.0% |
| Polish | 2,916 | 1.1% |
| Portuguese | 541 | 0.2% |
| Puerto Rican | 969 | 0.4% |
| Romanian | 188 | 0.1% |
| Russian | 523 | 0.2% |
| Salvadoran | 640 | 0.2% |
| Samoan | 247 | 0.1% |
| Scandinavian | 395 | 0.2% |
| Scotch-Irish | 2,983 | 1.1% |
| Scottish | 4,491 | 1.7% |
| Seminole | 3 | 0.0% |
| Serbian | 48 | 0.0% |
| Sioux | 116 | 0.0% |
| Slavic | 124 | 0.1% |
| Slovak | 297 | 0.1% |
| Slovene | 5 | 0.0% |
| South American | 792 | 0.3% |
| South American Indian | 23 | 0.0% |
| Spaniard | 1,908 | 0.7% |
| Spanish | 1,714 | 0.6% |
| Spanish American | 4 | 0.0% |
| Spanish American Indian | 74 | 0.0% |
| Sri Lankan | 1,299 | 0.5% |
| Subsaharan African | 1,074 | 0.4% |
| Swedish | 1,407 | 0.5% |
| Swiss | 332 | 0.1% |
| Syrian | 311 | 0.1% |
| Thai | 628 | 0.2% |
| Trinidadian and Tobagonian | 512 | 0.2% |
| Turkish | 140 | 0.1% |
| U.S. Virgin Islander | 10 | 0.0% |
| Ukrainian | 261 | 0.1% |
| Uruguayan | 61 | 0.0% |
| Venezuelan | 86 | 0.0% |
| Vietnamese | 29 | 0.0% |
| Welsh | 1,116 | 0.4% |
| West Indian | 377 | 0.1% |
| Yugoslavian | 58 | 0.0% | View All 133 Rows |
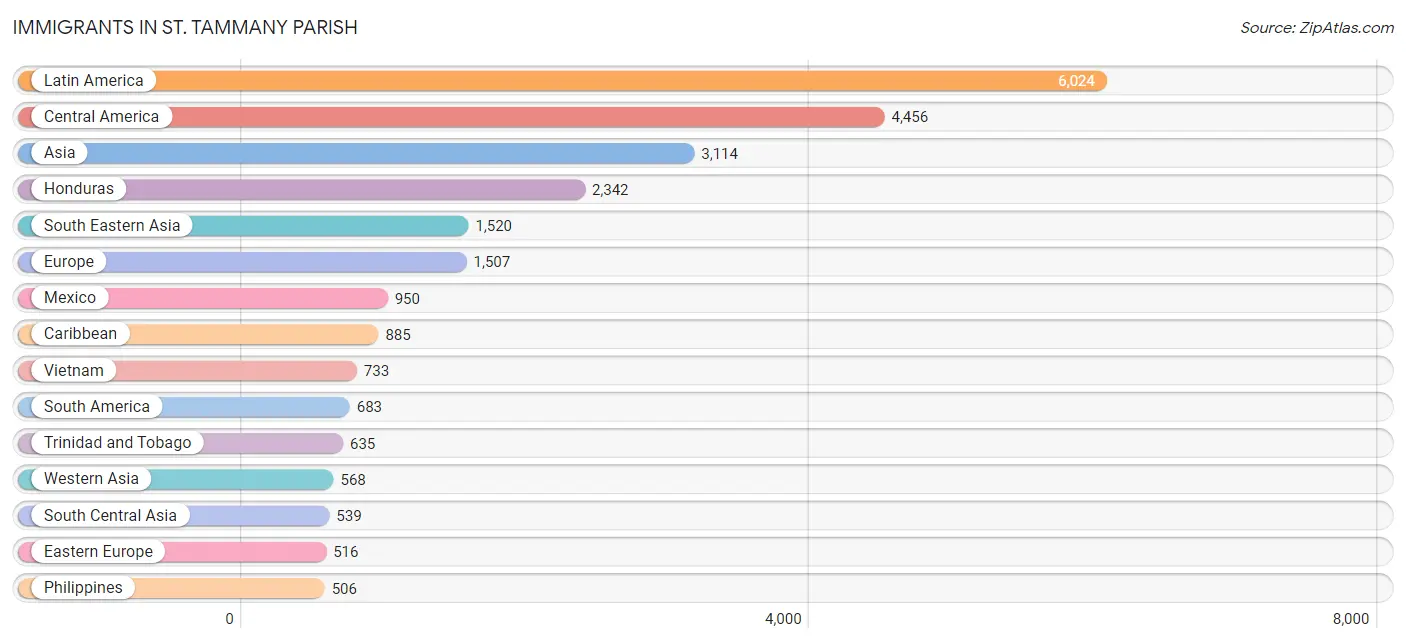
Immigrants in St. Tammany Parish
The most numerous immigrant groups reported in St. Tammany Parish came from Latin America (6,024 | 2.3%), Central America (4,456 | 1.7%), Asia (3,114 | 1.2%), Honduras (2,342 | 0.9%), and South Eastern Asia (1,520 | 0.6%), together accounting for 6.6% of all St. Tammany Parish residents.
| Immigration Origin | # Population | % Population |
| Africa | 461 | 0.2% |
| Argentina | 47 | 0.0% |
| Asia | 3,114 | 1.2% |
| Australia | 13 | 0.0% |
| Austria | 42 | 0.0% |
| Bangladesh | 38 | 0.0% |
| Barbados | 44 | 0.0% |
| Belize | 64 | 0.0% |
| Bolivia | 7 | 0.0% |
| Brazil | 134 | 0.1% |
| Bulgaria | 39 | 0.0% |
| Canada | 447 | 0.2% |
| Caribbean | 885 | 0.3% |
| Central America | 4,456 | 1.7% |
| Chile | 2 | 0.0% |
| China | 304 | 0.1% |
| Colombia | 182 | 0.1% |
| Costa Rica | 135 | 0.1% |
| Cuba | 80 | 0.0% |
| Czechoslovakia | 9 | 0.0% |
| Dominican Republic | 76 | 0.0% |
| Eastern Africa | 39 | 0.0% |
| Eastern Asia | 478 | 0.2% |
| Eastern Europe | 516 | 0.2% |
| Ecuador | 71 | 0.0% |
| Egypt | 7 | 0.0% |
| El Salvador | 400 | 0.2% |
| England | 170 | 0.1% |
| Ethiopia | 39 | 0.0% |
| Europe | 1,507 | 0.6% |
| France | 45 | 0.0% |
| Germany | 251 | 0.1% |
| Guatemala | 165 | 0.1% |
| Guyana | 81 | 0.0% |
| Haiti | 49 | 0.0% |
| Honduras | 2,342 | 0.9% |
| India | 299 | 0.1% |
| Indonesia | 14 | 0.0% |
| Iran | 17 | 0.0% |
| Ireland | 58 | 0.0% |
| Israel | 122 | 0.1% |
| Italy | 111 | 0.0% |
| Jamaica | 1 | 0.0% |
| Japan | 109 | 0.0% |
| Jordan | 73 | 0.0% |
| Korea | 65 | 0.0% |
| Laos | 94 | 0.0% |
| Latin America | 6,024 | 2.3% |
| Lebanon | 89 | 0.0% |
| Mexico | 950 | 0.4% |
| Middle Africa | 16 | 0.0% |
| Nepal | 99 | 0.0% |
| Netherlands | 127 | 0.1% |
| Nicaragua | 83 | 0.0% |
| Nigeria | 309 | 0.1% |
| Northern Africa | 47 | 0.0% |
| Northern Europe | 410 | 0.2% |
| Norway | 32 | 0.0% |
| Oceania | 13 | 0.0% |
| Pakistan | 86 | 0.0% |
| Panama | 146 | 0.1% |
| Peru | 89 | 0.0% |
| Philippines | 506 | 0.2% |
| Poland | 67 | 0.0% |
| Romania | 22 | 0.0% |
| Russia | 187 | 0.1% |
| Scotland | 24 | 0.0% |
| Serbia | 60 | 0.0% |
| Singapore | 7 | 0.0% |
| South America | 683 | 0.3% |
| South Central Asia | 539 | 0.2% |
| South Eastern Asia | 1,520 | 0.6% |
| Southern Europe | 116 | 0.0% |
| Spain | 5 | 0.0% |
| Sweden | 15 | 0.0% |
| Syria | 193 | 0.1% |
| Taiwan | 11 | 0.0% |
| Thailand | 57 | 0.0% |
| Trinidad and Tobago | 635 | 0.2% |
| Turkey | 91 | 0.0% |
| Ukraine | 78 | 0.0% |
| Uruguay | 27 | 0.0% |
| Venezuela | 40 | 0.0% |
| Vietnam | 733 | 0.3% |
| Western Africa | 359 | 0.1% |
| Western Asia | 568 | 0.2% |
| Western Europe | 465 | 0.2% | View All 87 Rows |
Sex and Age in St. Tammany Parish
Sex and Age in St. Tammany Parish
The most populous age groups in St. Tammany Parish are 10 to 14 Years (10,075 | 7.7%) for men and 60 to 64 Years (10,008 | 7.4%) for women.
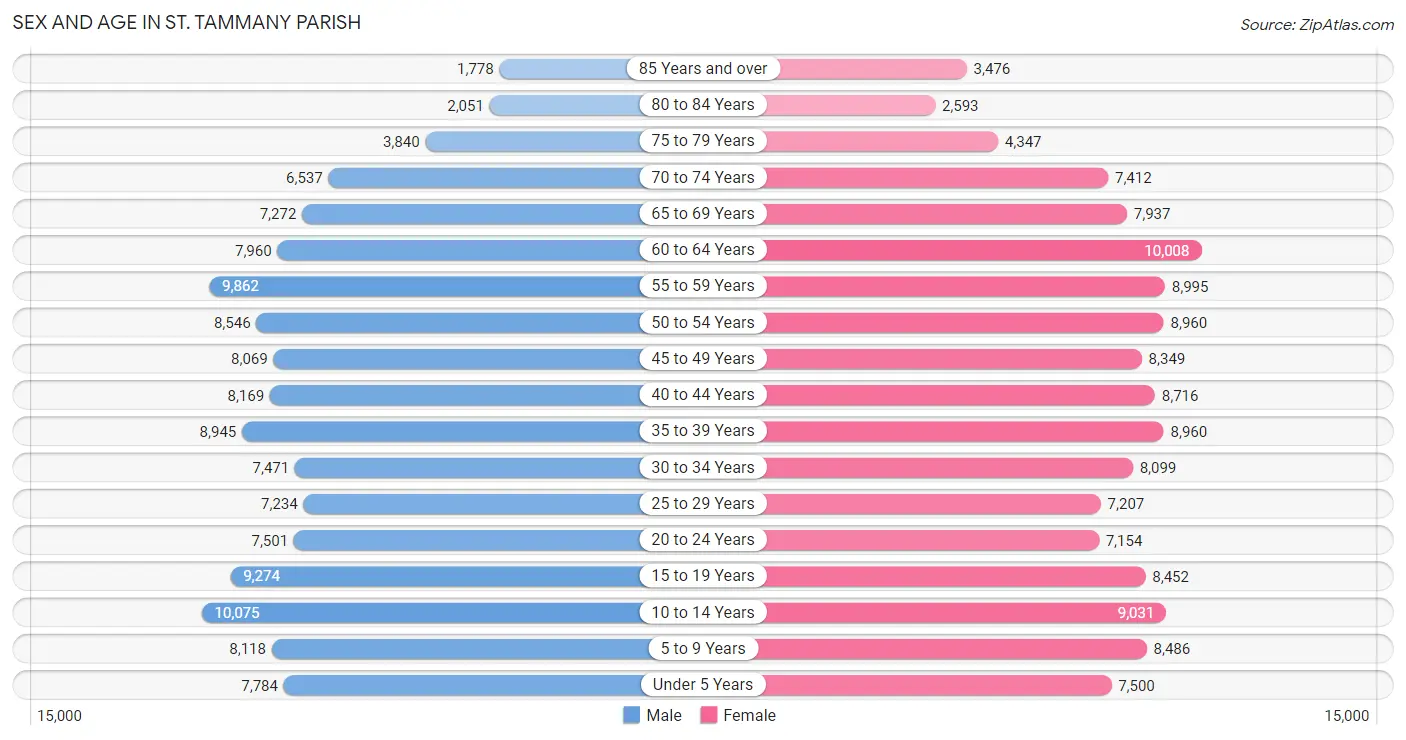
| Age Bracket | Male | Female |
| Under 5 Years | 7,784 (6.0%) | 7,500 (5.5%) |
| 5 to 9 Years | 8,118 (6.2%) | 8,486 (6.2%) |
| 10 to 14 Years | 10,075 (7.7%) | 9,031 (6.7%) |
| 15 to 19 Years | 9,274 (7.1%) | 8,452 (6.2%) |
| 20 to 24 Years | 7,501 (5.8%) | 7,154 (5.3%) |
| 25 to 29 Years | 7,234 (5.5%) | 7,207 (5.3%) |
| 30 to 34 Years | 7,471 (5.7%) | 8,099 (6.0%) |
| 35 to 39 Years | 8,945 (6.9%) | 8,960 (6.6%) |
| 40 to 44 Years | 8,169 (6.3%) | 8,716 (6.4%) |
| 45 to 49 Years | 8,069 (6.2%) | 8,349 (6.1%) |
| 50 to 54 Years | 8,546 (6.6%) | 8,960 (6.6%) |
| 55 to 59 Years | 9,862 (7.6%) | 8,995 (6.6%) |
| 60 to 64 Years | 7,960 (6.1%) | 10,008 (7.4%) |
| 65 to 69 Years | 7,272 (5.6%) | 7,937 (5.9%) |
| 70 to 74 Years | 6,537 (5.0%) | 7,412 (5.5%) |
| 75 to 79 Years | 3,840 (2.9%) | 4,347 (3.2%) |
| 80 to 84 Years | 2,051 (1.6%) | 2,593 (1.9%) |
| 85 Years and over | 1,778 (1.4%) | 3,476 (2.6%) |
| Total | 130,486 (100.0%) | 135,682 (100.0%) |
Families and Households in St. Tammany Parish
Median Family Size in St. Tammany Parish
The median family size in St. Tammany Parish is 3.12 persons per family, with single female/mother families (13,240 | 18.6%) accounting for the largest median family size of 3.15 persons per family. On the other hand, single male/father families (5,030 | 7.1%) represent the smallest median family size with 2.81 persons per family.
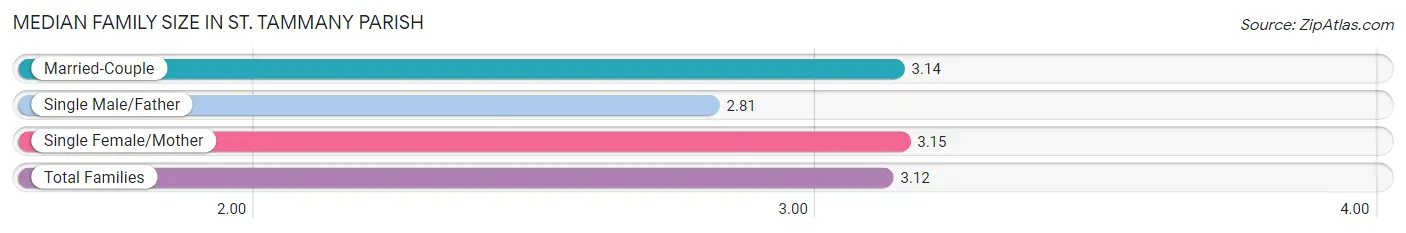
| Family Type | # Families | Family Size |
| Married-Couple | 52,993 (74.4%) | 3.14 |
| Single Male/Father | 5,030 (7.1%) | 2.81 |
| Single Female/Mother | 13,240 (18.6%) | 3.15 |
| Total Families | 71,263 (100.0%) | 3.12 |
Median Household Size in St. Tammany Parish
The median household size in St. Tammany Parish is 2.61 persons per household, with single female/mother households (13,240 | 13.1%) accounting for the largest median household size of 3.33 persons per household. non-family households (29,949 | 29.6%) represent the smallest median household size with 1.21 persons per household.
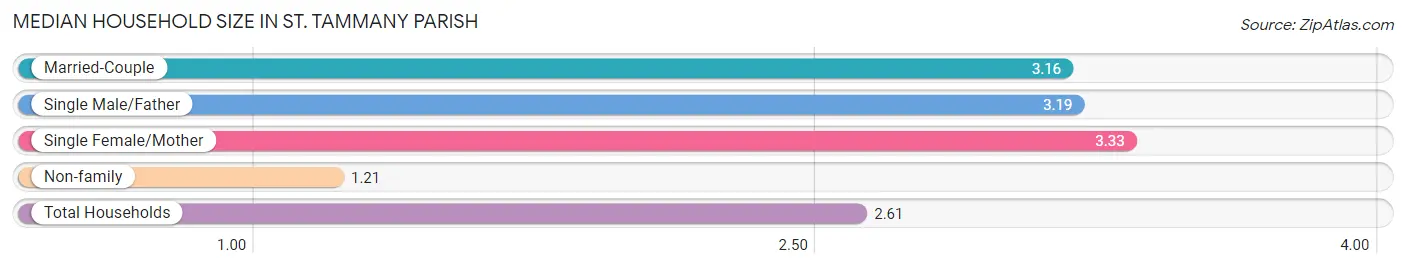
| Household Type | # Households | Household Size |
| Married-Couple | 52,993 (52.4%) | 3.16 |
| Single Male/Father | 5,030 (5.0%) | 3.19 |
| Single Female/Mother | 13,240 (13.1%) | 3.33 |
| Non-family | 29,949 (29.6%) | 1.21 |
| Total Households | 101,212 (100.0%) | 2.61 |
Household Size by Marriage Status in St. Tammany Parish
Out of a total of 101,212 households in St. Tammany Parish, 71,263 (70.4%) are family households, while 29,949 (29.6%) are nonfamily households. The most numerous type of family households are 2-person households, comprising 31,338, and the most common type of nonfamily households are 1-person households, comprising 25,314.
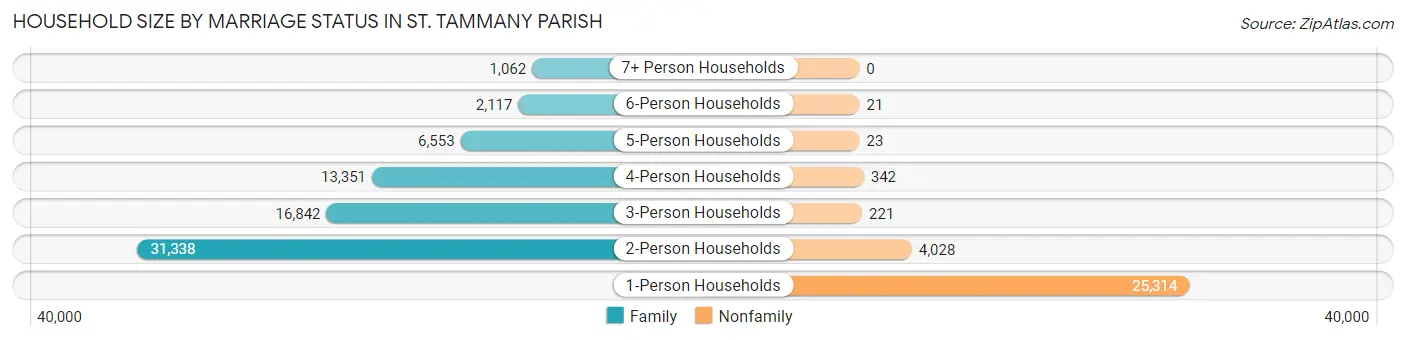
| Household Size | Family Households | Nonfamily Households |
| 1-Person Households | - | 25,314 (25.0%) |
| 2-Person Households | 31,338 (31.0%) | 4,028 (4.0%) |
| 3-Person Households | 16,842 (16.6%) | 221 (0.2%) |
| 4-Person Households | 13,351 (13.2%) | 342 (0.3%) |
| 5-Person Households | 6,553 (6.5%) | 23 (0.0%) |
| 6-Person Households | 2,117 (2.1%) | 21 (0.0%) |
| 7+ Person Households | 1,062 (1.1%) | 0 (0.0%) |
| Total | 71,263 (70.4%) | 29,949 (29.6%) |
Female Fertility in St. Tammany Parish
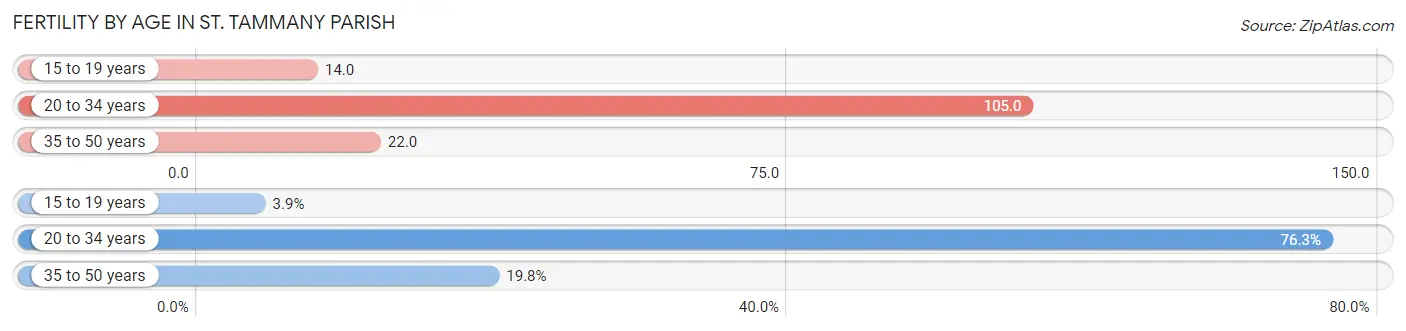
Fertility by Age in St. Tammany Parish
Average fertility rate in St. Tammany Parish is 53.0 births per 1,000 women. Women in the age bracket of 20 to 34 years have the highest fertility rate with 105.0 births per 1,000 women. Women in the age bracket of 20 to 34 years acount for 76.3% of all women with births.
| Age Bracket | Women with Births | Births / 1,000 Women |
| 15 to 19 years | 121 (3.9%) | 14.0 |
| 20 to 34 years | 2,362 (76.3%) | 105.0 |
| 35 to 50 years | 612 (19.8%) | 22.0 |
| Total | 3,095 (100.0%) | 53.0 |
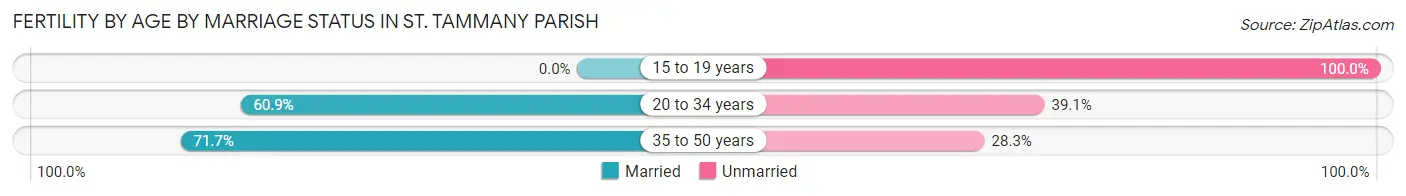
Fertility by Age by Marriage Status in St. Tammany Parish
60.6% of women with births (3,095) in St. Tammany Parish are married. The highest percentage of unmarried women with births falls into 15 to 19 years age bracket with 100.0% of them unmarried at the time of birth, while the lowest percentage of unmarried women with births belong to 35 to 50 years age bracket with 28.3% of them unmarried.
| Age Bracket | Married | Unmarried |
| 15 to 19 years | 0 (0.0%) | 121 (100.0%) |
| 20 to 34 years | 1,438 (60.9%) | 924 (39.1%) |
| 35 to 50 years | 439 (71.7%) | 173 (28.3%) |
| Total | 1,876 (60.6%) | 1,219 (39.4%) |
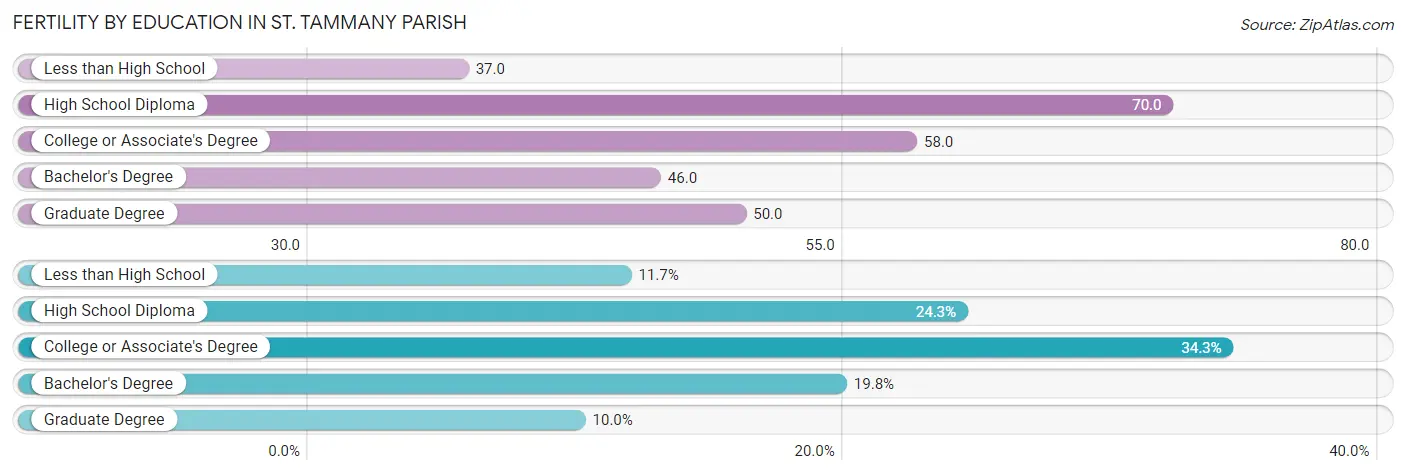
Fertility by Education in St. Tammany Parish
Average fertility rate in St. Tammany Parish is 53.0 births per 1,000 women. Women with the education attainment of high school diploma have the highest fertility rate of 70.0 births per 1,000 women, while women with the education attainment of less than high school have the lowest fertility at 37.0 births per 1,000 women. Women with the education attainment of college or associate's degree represent 34.3% of all women with births.
| Educational Attainment | Women with Births | Births / 1,000 Women |
| Less than High School | 362 (11.7%) | 37.0 |
| High School Diploma | 752 (24.3%) | 70.0 |
| College or Associate's Degree | 1,060 (34.3%) | 58.0 |
| Bachelor's Degree | 612 (19.8%) | 46.0 |
| Graduate Degree | 309 (10.0%) | 50.0 |
| Total | 3,095 (100.0%) | 53.0 |
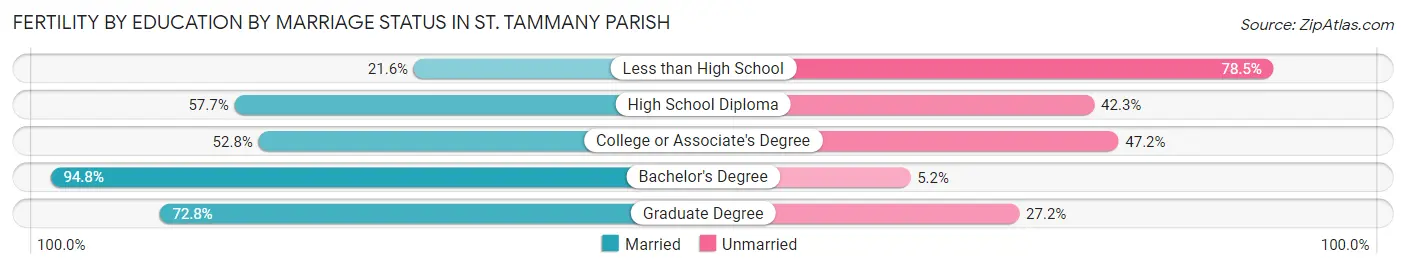
Fertility by Education by Marriage Status in St. Tammany Parish
39.4% of women with births in St. Tammany Parish are unmarried. Women with the educational attainment of bachelor's degree are most likely to be married with 94.8% of them married at childbirth, while women with the educational attainment of less than high school are least likely to be married with 78.4% of them unmarried at childbirth.
| Educational Attainment | Married | Unmarried |
| Less than High School | 78 (21.5%) | 284 (78.4%) |
| High School Diploma | 434 (57.7%) | 318 (42.3%) |
| College or Associate's Degree | 560 (52.8%) | 500 (47.2%) |
| Bachelor's Degree | 580 (94.8%) | 32 (5.2%) |
| Graduate Degree | 225 (72.8%) | 84 (27.2%) |
| Total | 1,876 (60.6%) | 1,219 (39.4%) |
Income in St. Tammany Parish
Income Overview in St. Tammany Parish
Per Capita Income in St. Tammany Parish is $40,393, while median incomes of families and households are $92,115 and $76,914 respectively.
| Characteristic | Number | Measure |
| Per Capita Income | 266,168 | $40,393 |
| Median Family Income | 71,263 | $92,115 |
| Mean Family Income | 71,263 | $120,707 |
| Median Household Income | 101,212 | $76,914 |
| Mean Household Income | 101,212 | $103,990 |
| Income Deficit | 71,263 | $10,333 |
| Wage / Income Gap (%) | 266,168 | 37.94% |
| Wage / Income Gap ($) | 266,168 | 62.06¢ per $1 |
| Gini / Inequality Index | 266,168 | 0.46 |
Earnings by Sex in St. Tammany Parish
Average Earnings in St. Tammany Parish are $44,240, $54,042 for men and $33,538 for women, a difference of 37.9%.
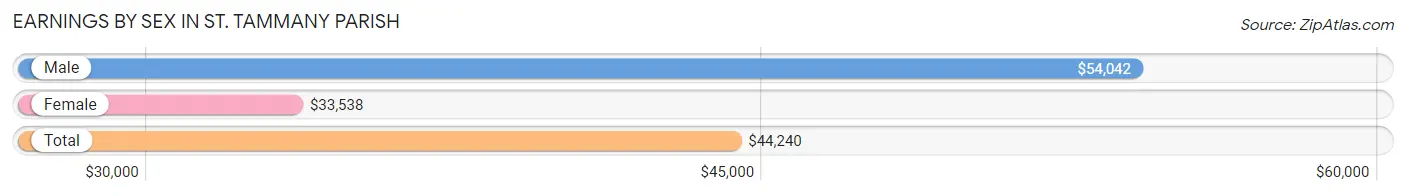
| Sex | Number | Average Earnings |
| Male | 71,926 (52.6%) | $54,042 |
| Female | 64,725 (47.4%) | $33,538 |
| Total | 136,651 (100.0%) | $44,240 |
Earnings by Sex by Income Bracket in St. Tammany Parish
The most common earnings brackets in St. Tammany Parish are $100,000+ for men (16,847 | 23.4%) and $55,000 to $64,999 for women (5,386 | 8.3%).
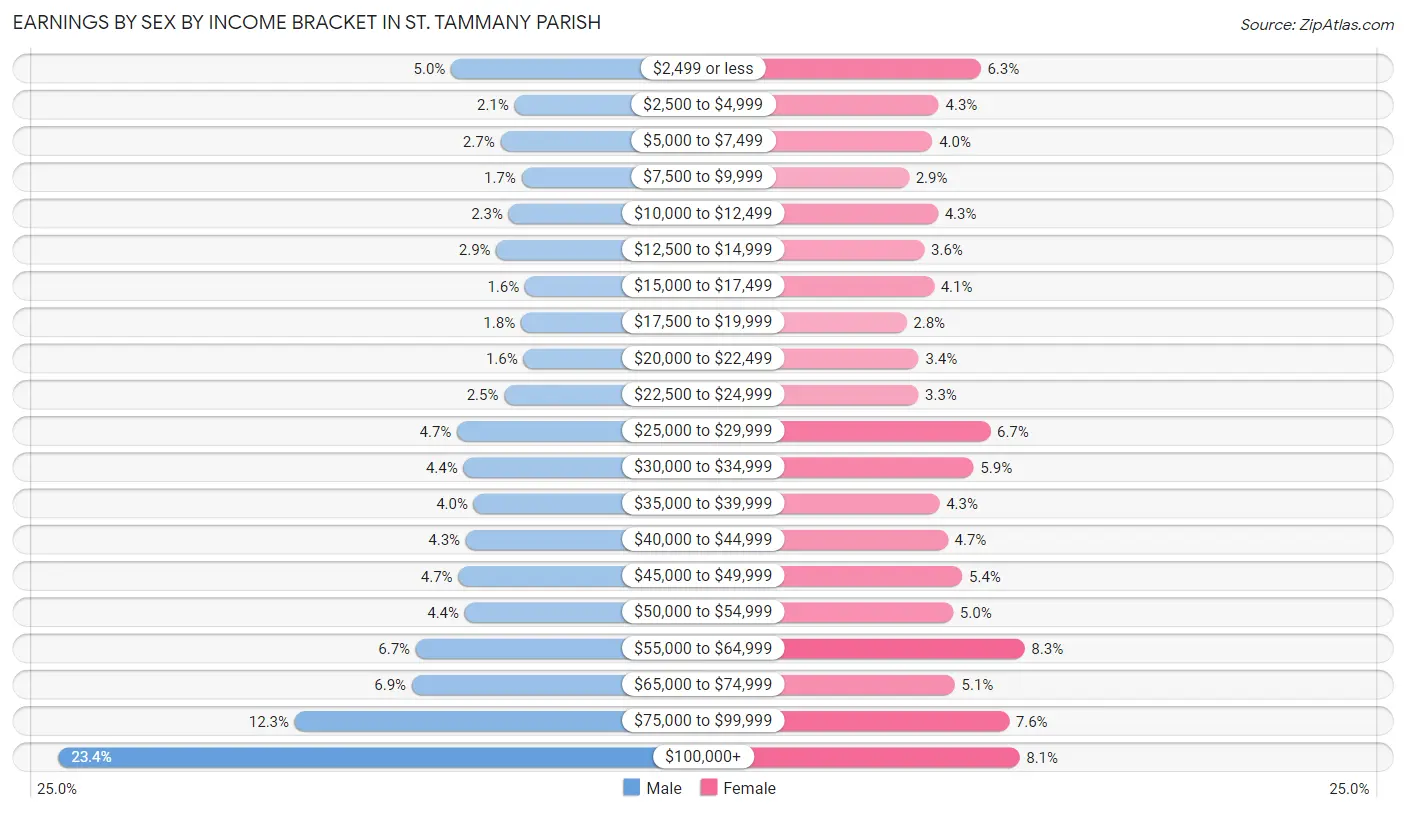
| Income | Male | Female |
| $2,499 or less | 3,609 (5.0%) | 4,054 (6.3%) |
| $2,500 to $4,999 | 1,473 (2.1%) | 2,784 (4.3%) |
| $5,000 to $7,499 | 1,946 (2.7%) | 2,590 (4.0%) |
| $7,500 to $9,999 | 1,236 (1.7%) | 1,880 (2.9%) |
| $10,000 to $12,499 | 1,669 (2.3%) | 2,756 (4.3%) |
| $12,500 to $14,999 | 2,086 (2.9%) | 2,342 (3.6%) |
| $15,000 to $17,499 | 1,119 (1.6%) | 2,632 (4.1%) |
| $17,500 to $19,999 | 1,260 (1.8%) | 1,806 (2.8%) |
| $20,000 to $22,499 | 1,174 (1.6%) | 2,172 (3.4%) |
| $22,500 to $24,999 | 1,823 (2.5%) | 2,160 (3.3%) |
| $25,000 to $29,999 | 3,408 (4.7%) | 4,341 (6.7%) |
| $30,000 to $34,999 | 3,192 (4.4%) | 3,839 (5.9%) |
| $35,000 to $39,999 | 2,849 (4.0%) | 2,802 (4.3%) |
| $40,000 to $44,999 | 3,113 (4.3%) | 3,055 (4.7%) |
| $45,000 to $49,999 | 3,365 (4.7%) | 3,495 (5.4%) |
| $50,000 to $54,999 | 3,148 (4.4%) | 3,218 (5.0%) |
| $55,000 to $64,999 | 4,795 (6.7%) | 5,386 (8.3%) |
| $65,000 to $74,999 | 4,937 (6.9%) | 3,271 (5.1%) |
| $75,000 to $99,999 | 8,877 (12.3%) | 4,911 (7.6%) |
| $100,000+ | 16,847 (23.4%) | 5,231 (8.1%) |
| Total | 71,926 (100.0%) | 64,725 (100.0%) |
Earnings by Sex by Educational Attainment in St. Tammany Parish
Average earnings in St. Tammany Parish are $61,953 for men and $40,382 for women, a difference of 34.8%. Men with an educational attainment of graduate degree enjoy the highest average annual earnings of $109,730, while those with less than high school education earn the least with $35,115. Women with an educational attainment of graduate degree earn the most with the average annual earnings of $58,374, while those with less than high school education have the smallest earnings of $21,624.
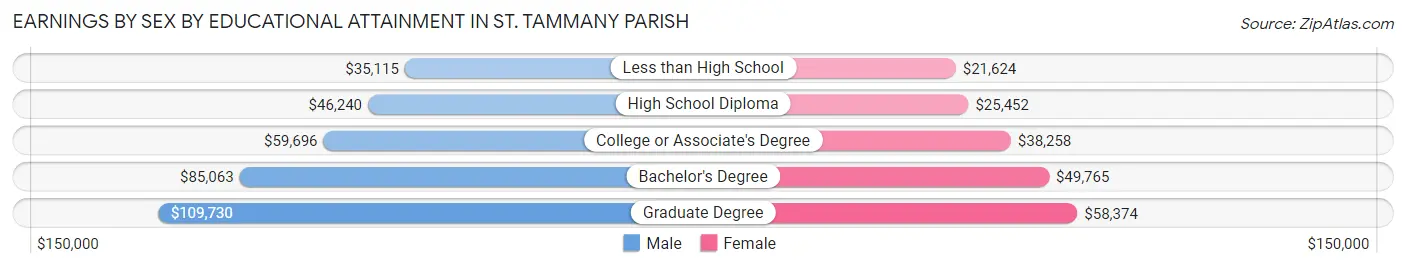
| Educational Attainment | Male Income | Female Income |
| Less than High School | $35,115 | $21,624 |
| High School Diploma | $46,240 | $25,452 |
| College or Associate's Degree | $59,696 | $38,258 |
| Bachelor's Degree | $85,063 | $49,765 |
| Graduate Degree | $109,730 | $58,374 |
| Total | $61,953 | $40,382 |
Family Income in St. Tammany Parish
Family Income Brackets in St. Tammany Parish
According to the St. Tammany Parish family income data, there are 14,395 families falling into the $100,000 to $149,999 income range, which is the most common income bracket and makes up 20.2% of all families. Conversely, the $10,000 to $14,999 income bracket is the least frequent group with only 1,354 families (1.9%) belonging to this category.
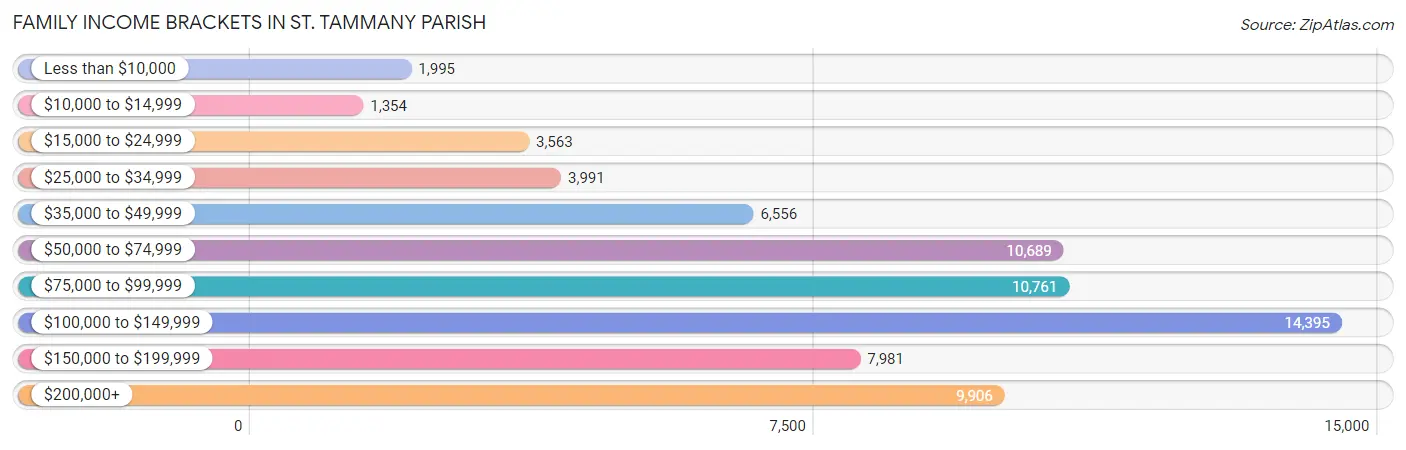
| Income Bracket | # Families | % Families |
| Less than $10,000 | 1,995 | 2.8% |
| $10,000 to $14,999 | 1,354 | 1.9% |
| $15,000 to $24,999 | 3,563 | 5.0% |
| $25,000 to $34,999 | 3,991 | 5.6% |
| $35,000 to $49,999 | 6,556 | 9.2% |
| $50,000 to $74,999 | 10,689 | 15.0% |
| $75,000 to $99,999 | 10,761 | 15.1% |
| $100,000 to $149,999 | 14,395 | 20.2% |
| $150,000 to $199,999 | 7,981 | 11.2% |
| $200,000+ | 9,906 | 13.9% |
Family Income by Famaliy Size in St. Tammany Parish
6-person families (1,649 | 2.3%) account for the highest median family income in St. Tammany Parish with $112,679 per family, while 2-person families (33,073 | 46.4%) have the highest median income of $40,297 per family member.
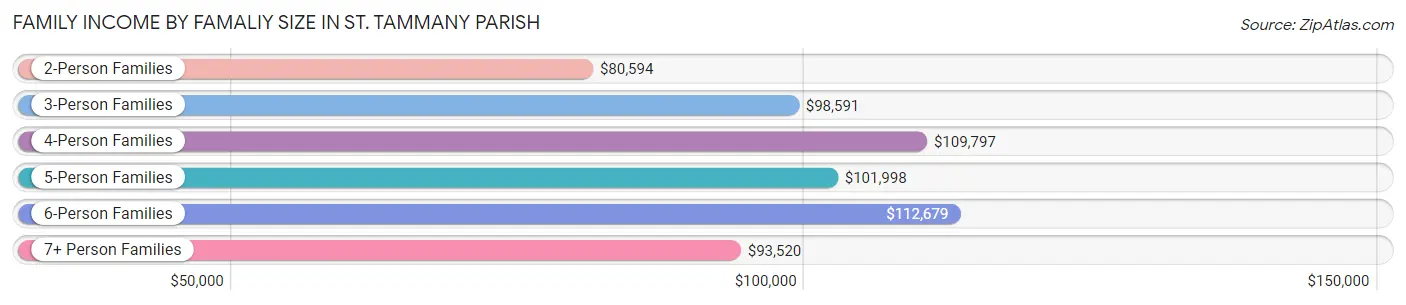
| Income Bracket | # Families | Median Income |
| 2-Person Families | 33,073 (46.4%) | $80,594 |
| 3-Person Families | 16,726 (23.5%) | $98,591 |
| 4-Person Families | 12,814 (18.0%) | $109,797 |
| 5-Person Families | 6,087 (8.5%) | $101,998 |
| 6-Person Families | 1,649 (2.3%) | $112,679 |
| 7+ Person Families | 914 (1.3%) | $93,520 |
| Total | 71,263 (100.0%) | $92,115 |
Family Income by Number of Earners in St. Tammany Parish
The median family income in St. Tammany Parish is $92,115, with families comprising 3+ earners (7,303) having the highest median family income of $150,226, while families with no earners (11,272) have the lowest median family income of $49,563, accounting for 10.2% and 15.8% of families, respectively.
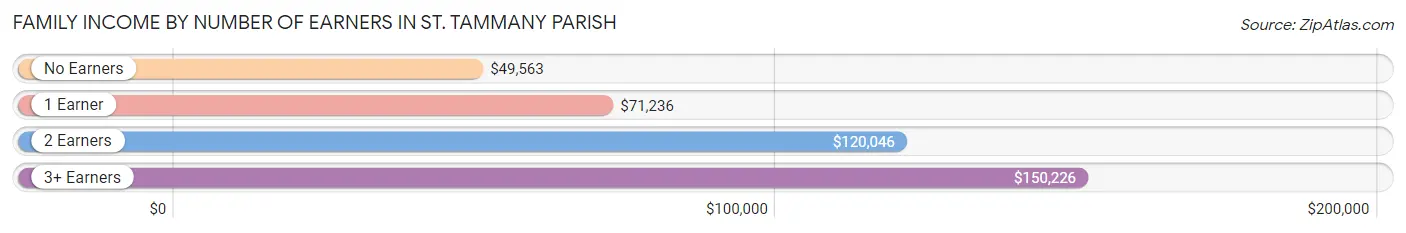
| Number of Earners | # Families | Median Income |
| No Earners | 11,272 (15.8%) | $49,563 |
| 1 Earner | 24,812 (34.8%) | $71,236 |
| 2 Earners | 27,876 (39.1%) | $120,046 |
| 3+ Earners | 7,303 (10.2%) | $150,226 |
| Total | 71,263 (100.0%) | $92,115 |
Household Income in St. Tammany Parish
Household Income Brackets in St. Tammany Parish
With 18,319 households falling in the category, the $100,000 to $149,999 income range is the most frequent in St. Tammany Parish, accounting for 18.1% of all households. In contrast, only 3,644 households (3.6%) fall into the $10,000 to $14,999 income bracket, making it the least populous group.
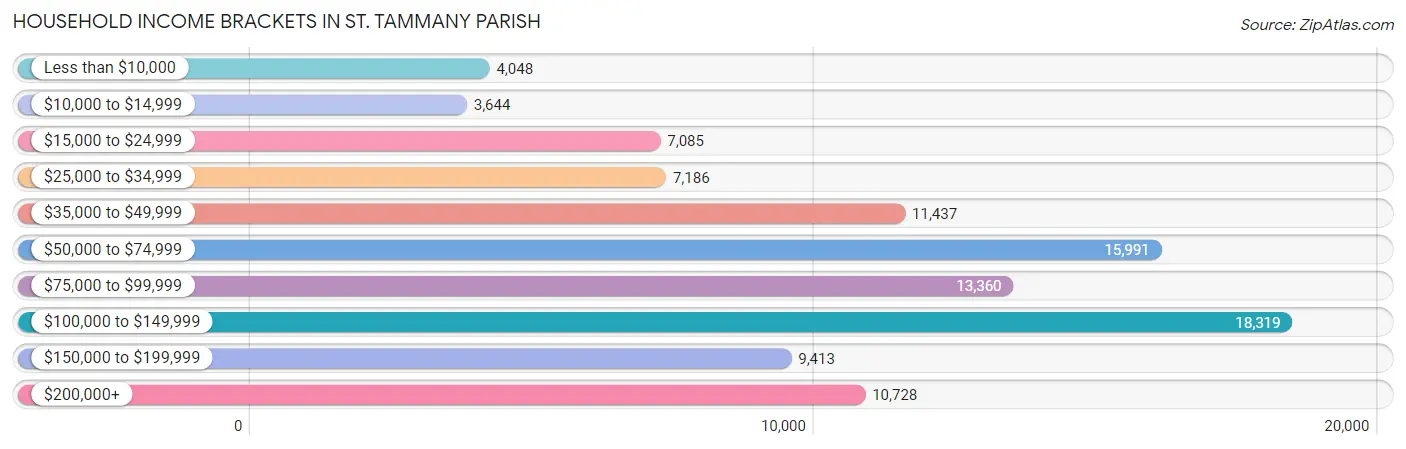
| Income Bracket | # Households | % Households |
| Less than $10,000 | 4,048 | 4.0% |
| $10,000 to $14,999 | 3,644 | 3.6% |
| $15,000 to $24,999 | 7,085 | 7.0% |
| $25,000 to $34,999 | 7,186 | 7.1% |
| $35,000 to $49,999 | 11,437 | 11.3% |
| $50,000 to $74,999 | 15,991 | 15.8% |
| $75,000 to $99,999 | 13,360 | 13.2% |
| $100,000 to $149,999 | 18,319 | 18.1% |
| $150,000 to $199,999 | 9,413 | 9.3% |
| $200,000+ | 10,728 | 10.6% |
Household Income by Householder Age in St. Tammany Parish
The median household income in St. Tammany Parish is $76,914, with the highest median household income of $93,241 found in the 45 to 64 years age bracket for the primary householder. A total of 38,834 households (38.4%) fall into this category. Meanwhile, the 65+ years age bracket for the primary householder has the lowest median household income of $52,579, with 29,696 households (29.3%) in this group.
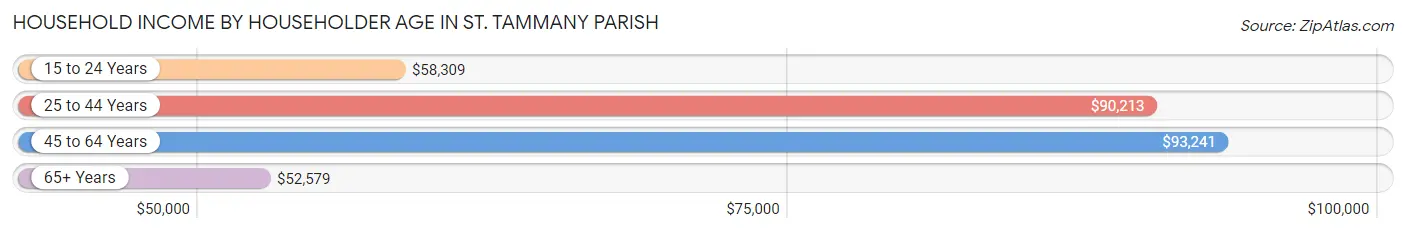
| Income Bracket | # Households | Median Income |
| 15 to 24 Years | 1,979 (2.0%) | $58,309 |
| 25 to 44 Years | 30,703 (30.3%) | $90,213 |
| 45 to 64 Years | 38,834 (38.4%) | $93,241 |
| 65+ Years | 29,696 (29.3%) | $52,579 |
| Total | 101,212 (100.0%) | $76,914 |
Poverty in St. Tammany Parish
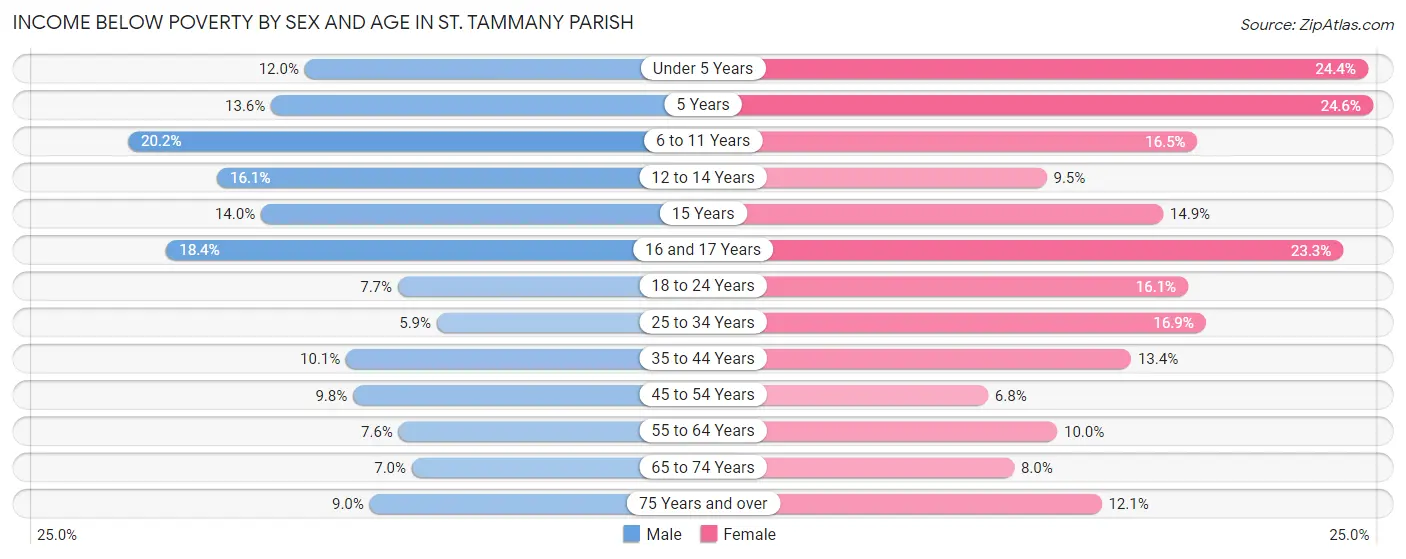
Income Below Poverty by Sex and Age in St. Tammany Parish
With 10.2% poverty level for males and 13.0% for females among the residents of St. Tammany Parish, 6 to 11 year old males and 5 year old females are the most vulnerable to poverty, with 2,192 males (20.2%) and 308 females (24.6%) in their respective age groups living below the poverty level.
| Age Bracket | Male | Female |
| Under 5 Years | 918 (12.0%) | 1,739 (24.4%) |
| 5 Years | 169 (13.6%) | 308 (24.6%) |
| 6 to 11 Years | 2,192 (20.2%) | 1,788 (16.5%) |
| 12 to 14 Years | 919 (16.1%) | 499 (9.5%) |
| 15 Years | 321 (14.0%) | 303 (14.9%) |
| 16 and 17 Years | 699 (18.4%) | 840 (23.3%) |
| 18 to 24 Years | 806 (7.7%) | 1,593 (16.1%) |
| 25 to 34 Years | 848 (5.9%) | 2,577 (16.9%) |
| 35 to 44 Years | 1,701 (10.1%) | 2,363 (13.4%) |
| 45 to 54 Years | 1,607 (9.8%) | 1,170 (6.8%) |
| 55 to 64 Years | 1,357 (7.6%) | 1,894 (10.0%) |
| 65 to 74 Years | 964 (7.0%) | 1,218 (8.0%) |
| 75 Years and over | 681 (9.0%) | 1,208 (12.0%) |
| Total | 13,182 (10.2%) | 17,500 (13.0%) |
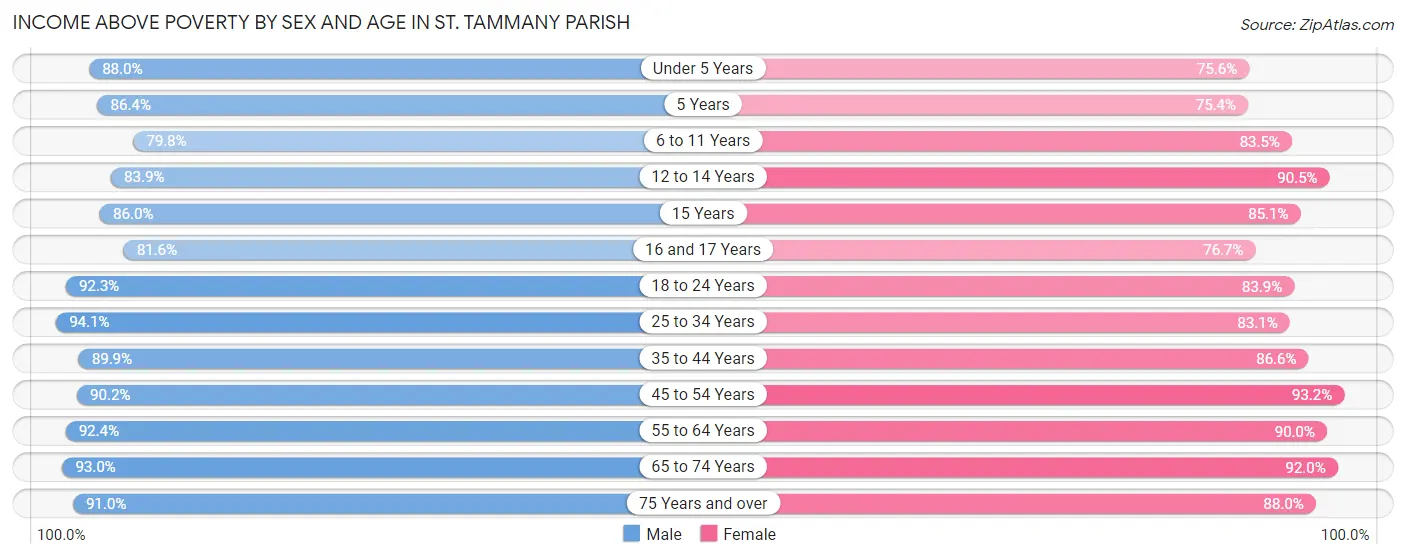
Income Above Poverty by Sex and Age in St. Tammany Parish
According to the poverty statistics in St. Tammany Parish, males aged 25 to 34 years and females aged 45 to 54 years are the age groups that are most secure financially, with 94.1% of males and 93.2% of females in these age groups living above the poverty line.
| Age Bracket | Male | Female |
| Under 5 Years | 6,733 (88.0%) | 5,389 (75.6%) |
| 5 Years | 1,077 (86.4%) | 942 (75.4%) |
| 6 to 11 Years | 8,658 (79.8%) | 9,049 (83.5%) |
| 12 to 14 Years | 4,800 (83.9%) | 4,751 (90.5%) |
| 15 Years | 1,967 (86.0%) | 1,731 (85.1%) |
| 16 and 17 Years | 3,095 (81.6%) | 2,772 (76.7%) |
| 18 to 24 Years | 9,687 (92.3%) | 8,326 (83.9%) |
| 25 to 34 Years | 13,591 (94.1%) | 12,687 (83.1%) |
| 35 to 44 Years | 15,173 (89.9%) | 15,246 (86.6%) |
| 45 to 54 Years | 14,860 (90.2%) | 16,086 (93.2%) |
| 55 to 64 Years | 16,397 (92.4%) | 17,058 (90.0%) |
| 65 to 74 Years | 12,748 (93.0%) | 14,021 (92.0%) |
| 75 Years and over | 6,893 (91.0%) | 8,813 (87.9%) |
| Total | 115,679 (89.8%) | 116,871 (87.0%) |
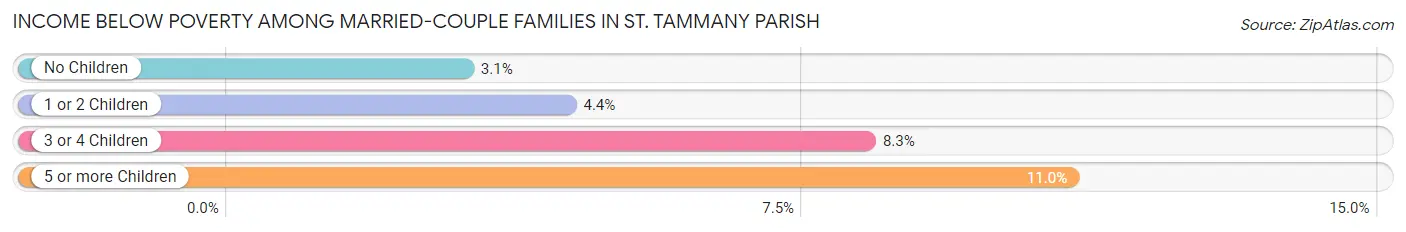
Income Below Poverty Among Married-Couple Families in St. Tammany Parish
The poverty statistics for married-couple families in St. Tammany Parish show that 4.0% or 2,126 of the total 52,993 families live below the poverty line. Families with 5 or more children have the highest poverty rate of 11.0%, comprising of 36 families. On the other hand, families with no children have the lowest poverty rate of 3.1%, which includes 956 families.
| Children | Above Poverty | Below Poverty |
| No Children | 30,107 (96.9%) | 956 (3.1%) |
| 1 or 2 Children | 16,252 (95.6%) | 751 (4.4%) |
| 3 or 4 Children | 4,216 (91.7%) | 383 (8.3%) |
| 5 or more Children | 292 (89.0%) | 36 (11.0%) |
| Total | 50,867 (96.0%) | 2,126 (4.0%) |
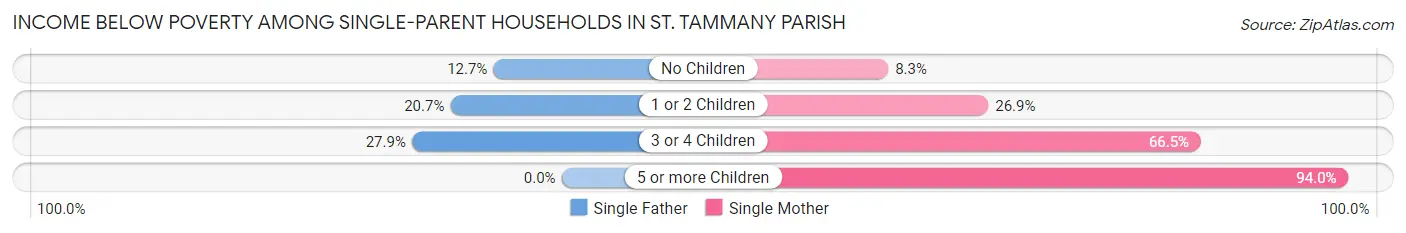
Income Below Poverty Among Single-Parent Households in St. Tammany Parish
According to the poverty data in St. Tammany Parish, 18.7% or 940 single-father households and 26.1% or 3,454 single-mother households are living below the poverty line. Among single-father households, those with 3 or 4 children have the highest poverty rate, with 164 households (27.9%) experiencing poverty. Likewise, among single-mother households, those with 5 or more children have the highest poverty rate, with 157 households (94.0%) falling below the poverty line.
| Children | Single Father | Single Mother |
| No Children | 220 (12.7%) | 380 (8.3%) |
| 1 or 2 Children | 556 (20.7%) | 1,861 (26.9%) |
| 3 or 4 Children | 164 (27.9%) | 1,056 (66.5%) |
| 5 or more Children | 0 (0.0%) | 157 (94.0%) |
| Total | 940 (18.7%) | 3,454 (26.1%) |
Income Below Poverty Among Married-Couple vs Single-Parent Households in St. Tammany Parish
The poverty data for St. Tammany Parish shows that 2,126 of the married-couple family households (4.0%) and 4,394 of the single-parent households (24.0%) are living below the poverty level. Within the married-couple family households, those with 5 or more children have the highest poverty rate, with 36 households (11.0%) falling below the poverty line. Among the single-parent households, those with 5 or more children have the highest poverty rate, with 157 household (80.5%) living below poverty.
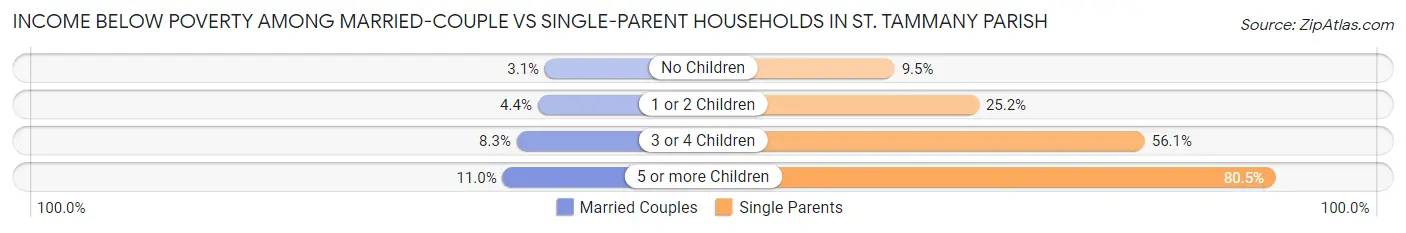
| Children | Married-Couple Families | Single-Parent Households |
| No Children | 956 (3.1%) | 600 (9.5%) |
| 1 or 2 Children | 751 (4.4%) | 2,417 (25.2%) |
| 3 or 4 Children | 383 (8.3%) | 1,220 (56.1%) |
| 5 or more Children | 36 (11.0%) | 157 (80.5%) |
| Total | 2,126 (4.0%) | 4,394 (24.0%) |
Employment Characteristics in St. Tammany Parish
Employment by Class of Employer in St. Tammany Parish
Among the 121,358 employed individuals in St. Tammany Parish, private company employees (79,514 | 65.5%), self-employed (not incorporated) (9,018 | 7.4%), and local government employees (8,689 | 7.2%) make up the most common classes of employment.
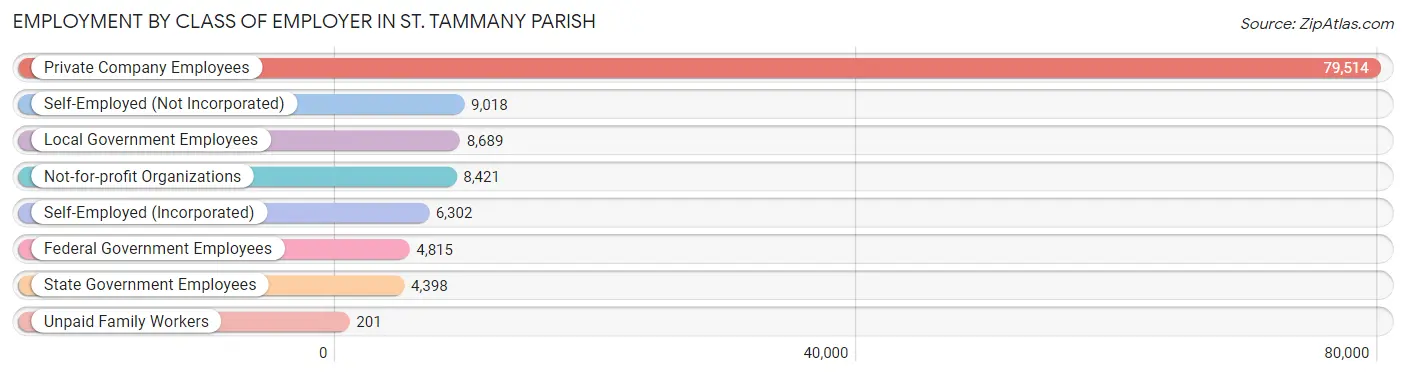
| Employer Class | # Employees | % Employees |
| Private Company Employees | 79,514 | 65.5% |
| Self-Employed (Incorporated) | 6,302 | 5.2% |
| Self-Employed (Not Incorporated) | 9,018 | 7.4% |
| Not-for-profit Organizations | 8,421 | 6.9% |
| Local Government Employees | 8,689 | 7.2% |
| State Government Employees | 4,398 | 3.6% |
| Federal Government Employees | 4,815 | 4.0% |
| Unpaid Family Workers | 201 | 0.2% |
| Total | 121,358 | 100.0% |
Employment Status by Age in St. Tammany Parish
According to the labor force statistics for St. Tammany Parish, out of the total population over 16 years of age (210,851), 62.5% or 131,782 individuals are in the labor force, with 5.2% or 6,853 of them unemployed. The age group with the highest labor force participation rate is 35 to 44 years, with 84.1% or 29,258 individuals in the labor force. Within the labor force, the 16 to 19 years age range has the highest percentage of unemployed individuals, with 13.3% or 676 of them being unemployed.
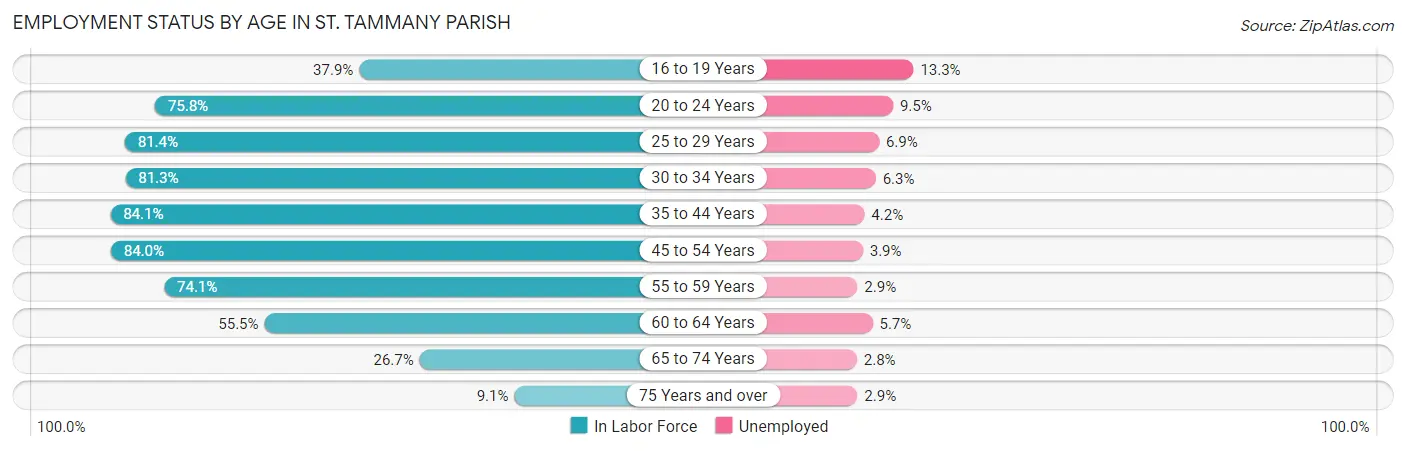
| Age Bracket | In Labor Force | Unemployed |
| 16 to 19 Years | 5,080 (37.9%) | 676 (13.3%) |
| 20 to 24 Years | 11,108 (75.8%) | 1,055 (9.5%) |
| 25 to 29 Years | 11,755 (81.4%) | 811 (6.9%) |
| 30 to 34 Years | 12,658 (81.3%) | 797 (6.3%) |
| 35 to 44 Years | 29,258 (84.1%) | 1,229 (4.2%) |
| 45 to 54 Years | 28,496 (84.0%) | 1,111 (3.9%) |
| 55 to 59 Years | 13,973 (74.1%) | 405 (2.9%) |
| 60 to 64 Years | 9,972 (55.5%) | 568 (5.7%) |
| 65 to 74 Years | 7,785 (26.7%) | 218 (2.8%) |
| 75 Years and over | 1,646 (9.1%) | 48 (2.9%) |
| Total | 131,782 (62.5%) | 6,853 (5.2%) |
Employment Status by Educational Attainment in St. Tammany Parish
According to labor force statistics for St. Tammany Parish, 78.3% of individuals (106,136) out of the total population between 25 and 64 years of age (135,550) are in the labor force, with 4.6% or 4,882 of them being unemployed. The group with the highest labor force participation rate are those with the educational attainment of bachelor's degree or higher, with 85.2% or 42,836 individuals in the labor force. Within the labor force, individuals with less than high school education have the highest percentage of unemployment, with 13.4% or 1,013 of them being unemployed.
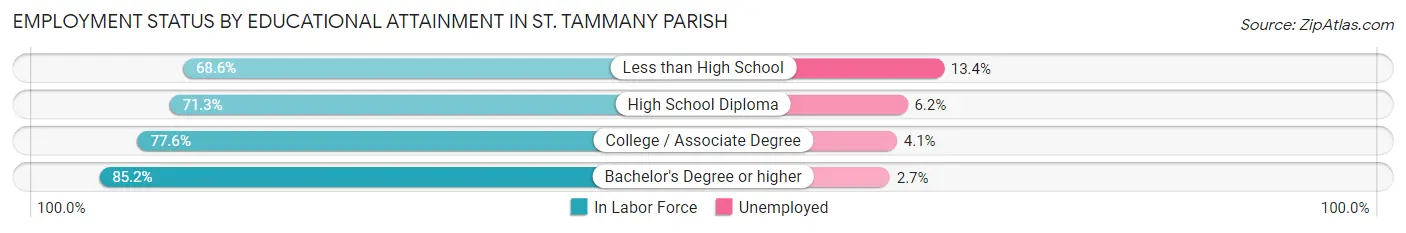
| Educational Attainment | In Labor Force | Unemployed |
| Less than High School | 7,560 (68.6%) | 1,477 (13.4%) |
| High School Diploma | 21,440 (71.3%) | 1,864 (6.2%) |
| College / Associate Degree | 34,286 (77.6%) | 1,812 (4.1%) |
| Bachelor's Degree or higher | 42,836 (85.2%) | 1,357 (2.7%) |
| Total | 106,136 (78.3%) | 6,235 (4.6%) |
Employment Occupations by Sex in St. Tammany Parish
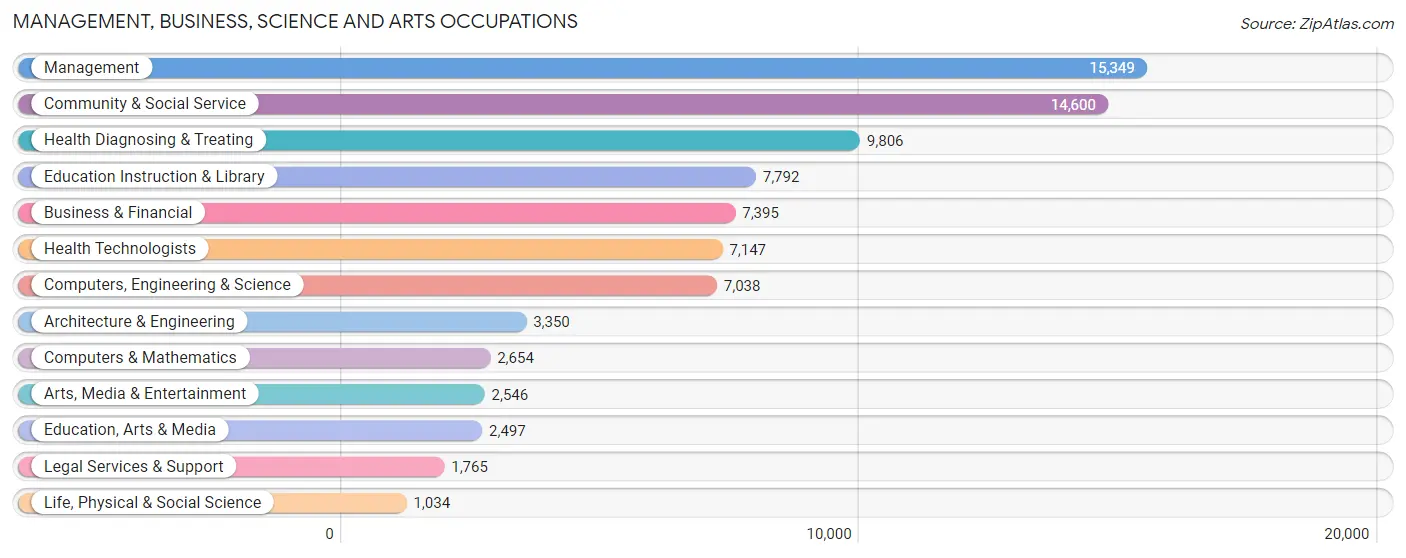
Management, Business, Science and Arts Occupations
The most common Management, Business, Science and Arts occupations in St. Tammany Parish are Management (15,349 | 12.4%), Community & Social Service (14,600 | 11.8%), Health Diagnosing & Treating (9,806 | 7.9%), Education Instruction & Library (7,792 | 6.3%), and Business & Financial (7,395 | 6.0%).
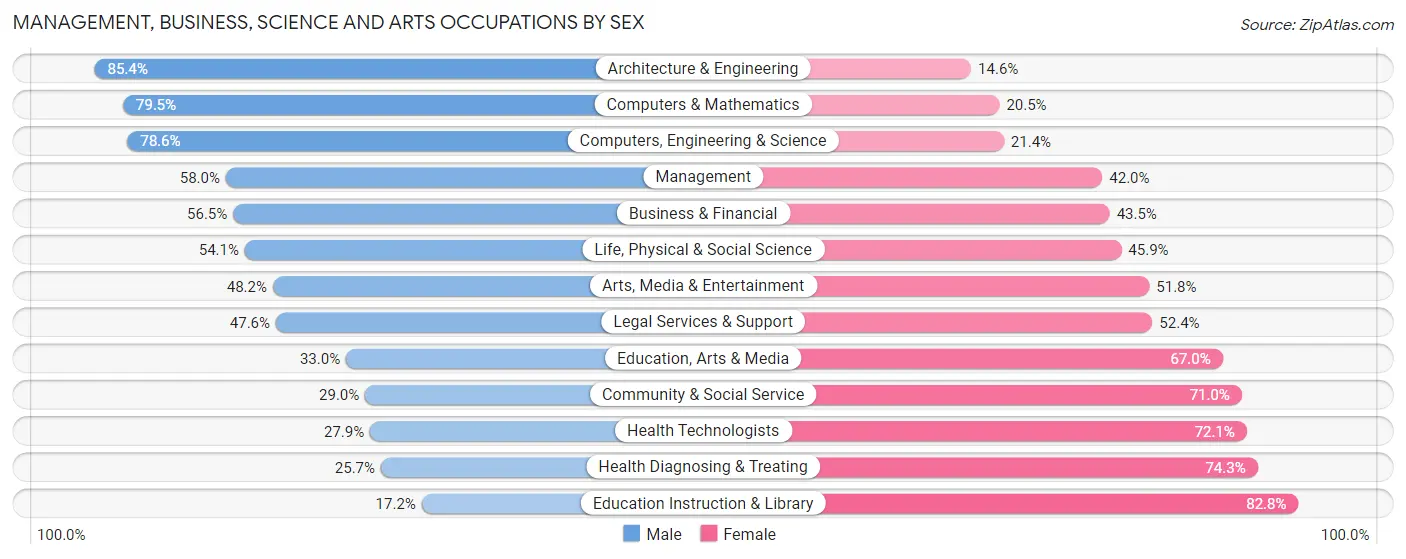
Management, Business, Science and Arts Occupations by Sex
Within the Management, Business, Science and Arts occupations in St. Tammany Parish, the most male-oriented occupations are Architecture & Engineering (85.4%), Computers & Mathematics (79.5%), and Computers, Engineering & Science (78.6%), while the most female-oriented occupations are Education Instruction & Library (82.8%), Health Diagnosing & Treating (74.3%), and Health Technologists (72.1%).
| Occupation | Male | Female |
| Management | 8,907 (58.0%) | 6,442 (42.0%) |
| Business & Financial | 4,178 (56.5%) | 3,217 (43.5%) |
| Computers, Engineering & Science | 5,530 (78.6%) | 1,508 (21.4%) |
| Computers & Mathematics | 2,110 (79.5%) | 544 (20.5%) |
| Architecture & Engineering | 2,861 (85.4%) | 489 (14.6%) |
| Life, Physical & Social Science | 559 (54.1%) | 475 (45.9%) |
| Community & Social Service | 4,229 (29.0%) | 10,371 (71.0%) |
| Education, Arts & Media | 823 (33.0%) | 1,674 (67.0%) |
| Legal Services & Support | 840 (47.6%) | 925 (52.4%) |
| Education Instruction & Library | 1,338 (17.2%) | 6,454 (82.8%) |
| Arts, Media & Entertainment | 1,228 (48.2%) | 1,318 (51.8%) |
| Health Diagnosing & Treating | 2,518 (25.7%) | 7,288 (74.3%) |
| Health Technologists | 1,996 (27.9%) | 5,151 (72.1%) |
| Total (Category) | 25,362 (46.8%) | 28,826 (53.2%) |
| Total (Overall) | 64,963 (52.6%) | 58,546 (47.4%) |
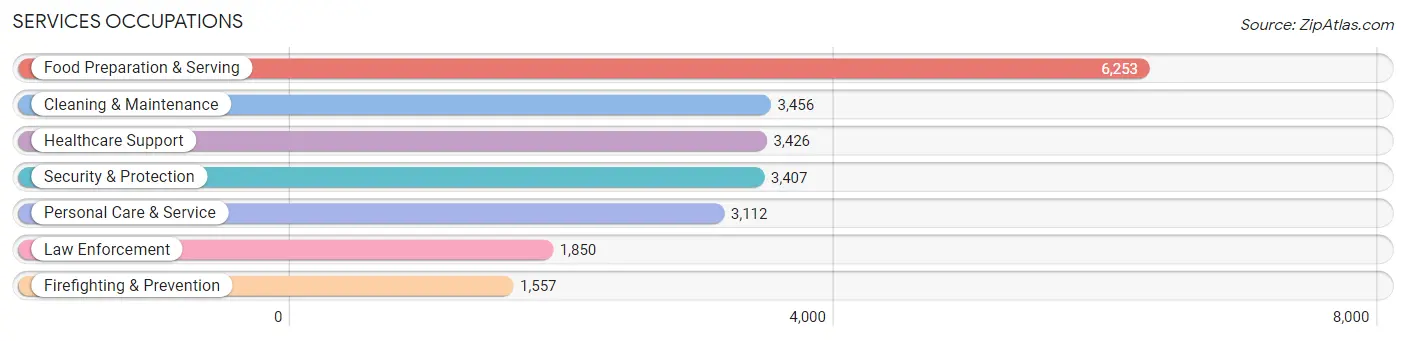
Services Occupations
The most common Services occupations in St. Tammany Parish are Food Preparation & Serving (6,253 | 5.1%), Cleaning & Maintenance (3,456 | 2.8%), Healthcare Support (3,426 | 2.8%), Security & Protection (3,407 | 2.8%), and Personal Care & Service (3,112 | 2.5%).
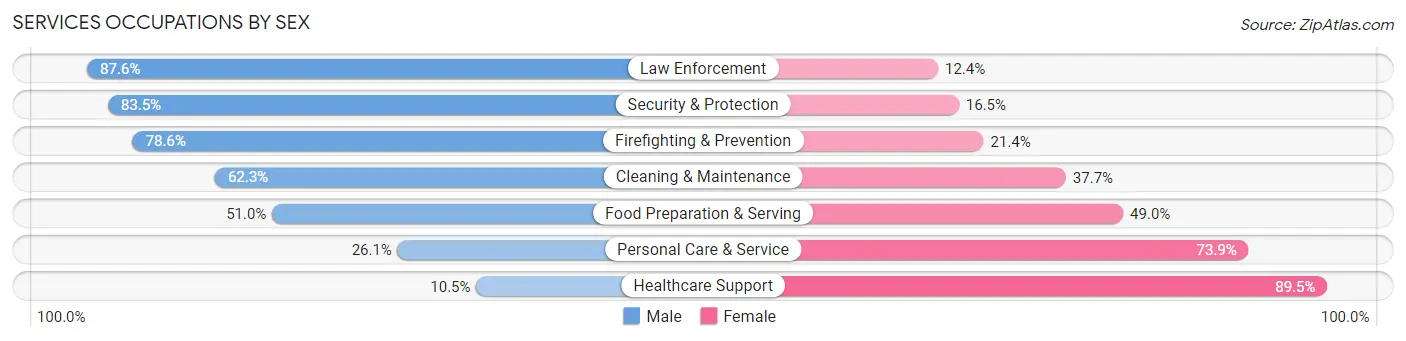
Services Occupations by Sex
Within the Services occupations in St. Tammany Parish, the most male-oriented occupations are Law Enforcement (87.6%), Security & Protection (83.5%), and Firefighting & Prevention (78.6%), while the most female-oriented occupations are Healthcare Support (89.5%), Personal Care & Service (73.9%), and Food Preparation & Serving (49.0%).
| Occupation | Male | Female |
| Healthcare Support | 361 (10.5%) | 3,065 (89.5%) |
| Security & Protection | 2,845 (83.5%) | 562 (16.5%) |
| Firefighting & Prevention | 1,224 (78.6%) | 333 (21.4%) |
| Law Enforcement | 1,621 (87.6%) | 229 (12.4%) |
| Food Preparation & Serving | 3,187 (51.0%) | 3,066 (49.0%) |
| Cleaning & Maintenance | 2,153 (62.3%) | 1,303 (37.7%) |
| Personal Care & Service | 813 (26.1%) | 2,299 (73.9%) |
| Total (Category) | 9,359 (47.6%) | 10,295 (52.4%) |
| Total (Overall) | 64,963 (52.6%) | 58,546 (47.4%) |
Sales and Office Occupations
The most common Sales and Office occupations in St. Tammany Parish are Sales & Related (13,950 | 11.3%), and Office & Administration (12,445 | 10.1%).

Sales and Office Occupations by Sex
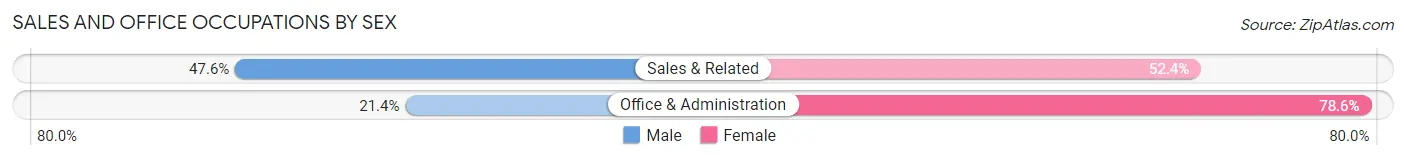
| Occupation | Male | Female |
| Sales & Related | 6,642 (47.6%) | 7,308 (52.4%) |
| Office & Administration | 2,667 (21.4%) | 9,778 (78.6%) |
| Total (Category) | 9,309 (35.3%) | 17,086 (64.7%) |
| Total (Overall) | 64,963 (52.6%) | 58,546 (47.4%) |
Natural Resources, Construction and Maintenance Occupations
The most common Natural Resources, Construction and Maintenance occupations in St. Tammany Parish are Construction & Extraction (6,874 | 5.6%), Installation, Maintenance & Repair (4,750 | 3.8%), and Farming, Fishing & Forestry (211 | 0.2%).

Natural Resources, Construction and Maintenance Occupations by Sex
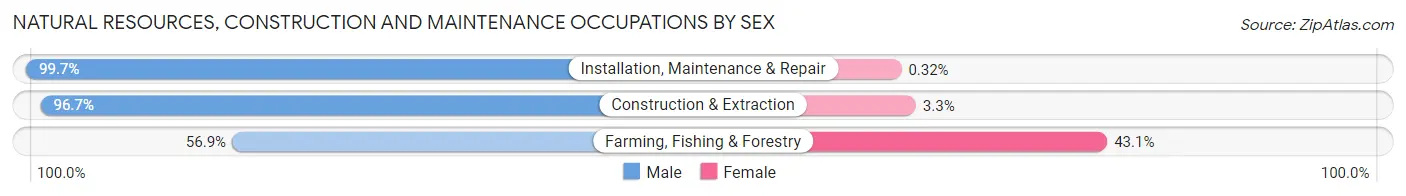
| Occupation | Male | Female |
| Farming, Fishing & Forestry | 120 (56.9%) | 91 (43.1%) |
| Construction & Extraction | 6,645 (96.7%) | 229 (3.3%) |
| Installation, Maintenance & Repair | 4,735 (99.7%) | 15 (0.3%) |
| Total (Category) | 11,500 (97.2%) | 335 (2.8%) |
| Total (Overall) | 64,963 (52.6%) | 58,546 (47.4%) |
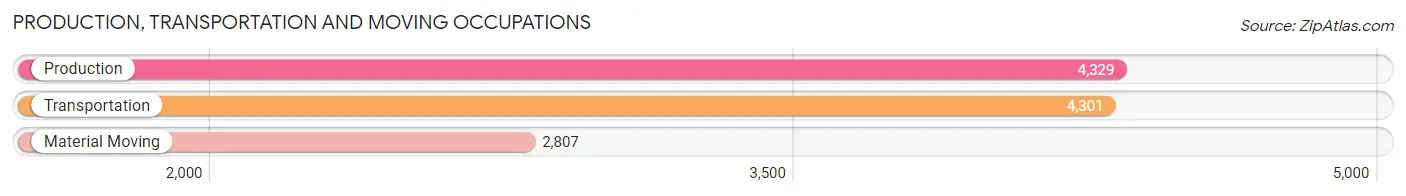
Production, Transportation and Moving Occupations
The most common Production, Transportation and Moving occupations in St. Tammany Parish are Production (4,329 | 3.5%), Transportation (4,301 | 3.5%), and Material Moving (2,807 | 2.3%).
Production, Transportation and Moving Occupations by Sex
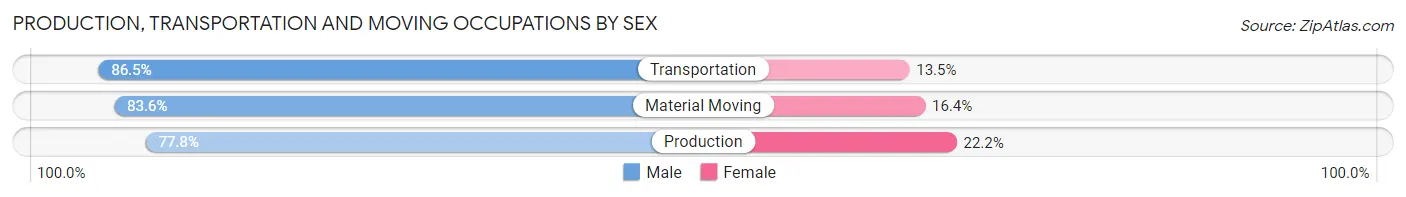
| Occupation | Male | Female |
| Production | 3,368 (77.8%) | 961 (22.2%) |
| Transportation | 3,719 (86.5%) | 582 (13.5%) |
| Material Moving | 2,346 (83.6%) | 461 (16.4%) |
| Total (Category) | 9,433 (82.5%) | 2,004 (17.5%) |
| Total (Overall) | 64,963 (52.6%) | 58,546 (47.4%) |
Employment Industries by Sex in St. Tammany Parish
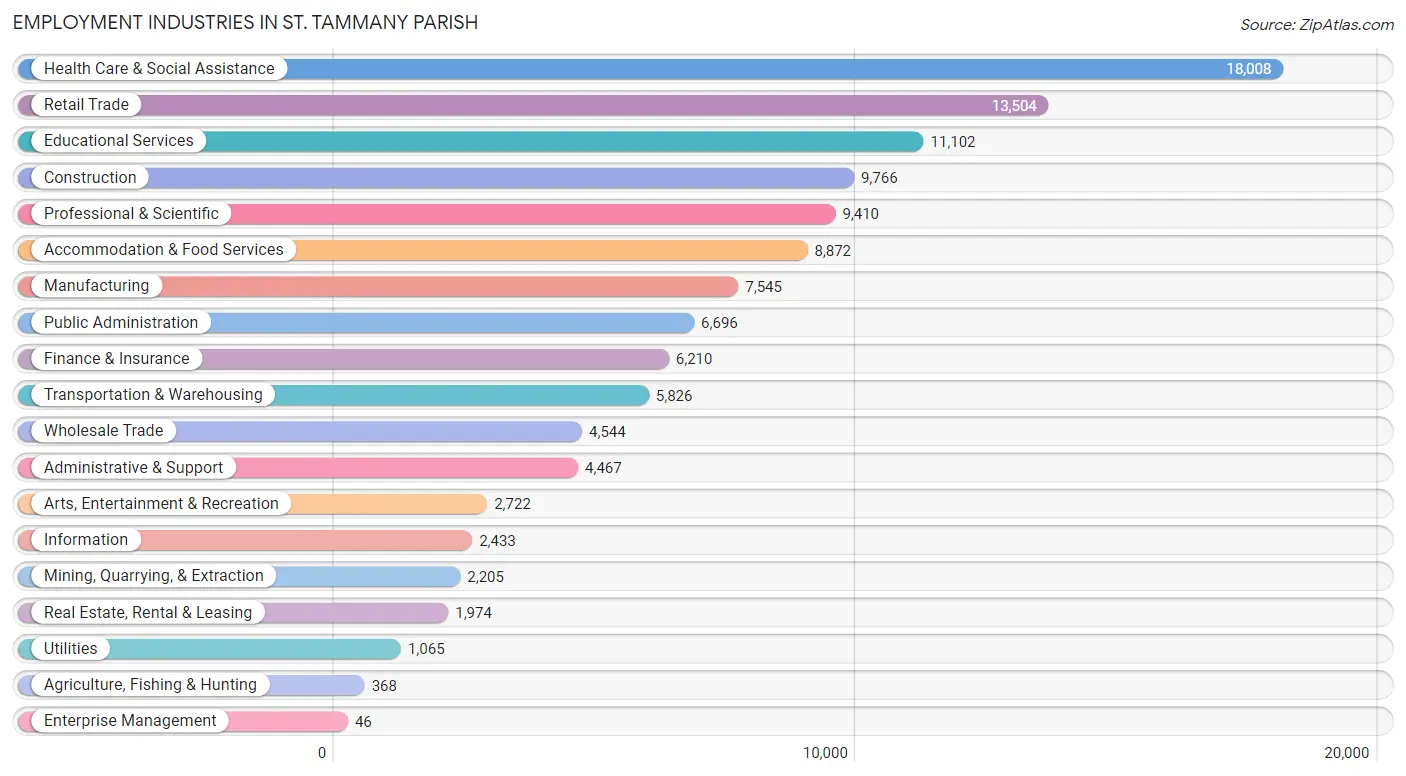
Employment Industries in St. Tammany Parish
The major employment industries in St. Tammany Parish include Health Care & Social Assistance (18,008 | 14.6%), Retail Trade (13,504 | 10.9%), Educational Services (11,102 | 9.0%), Construction (9,766 | 7.9%), and Professional & Scientific (9,410 | 7.6%).
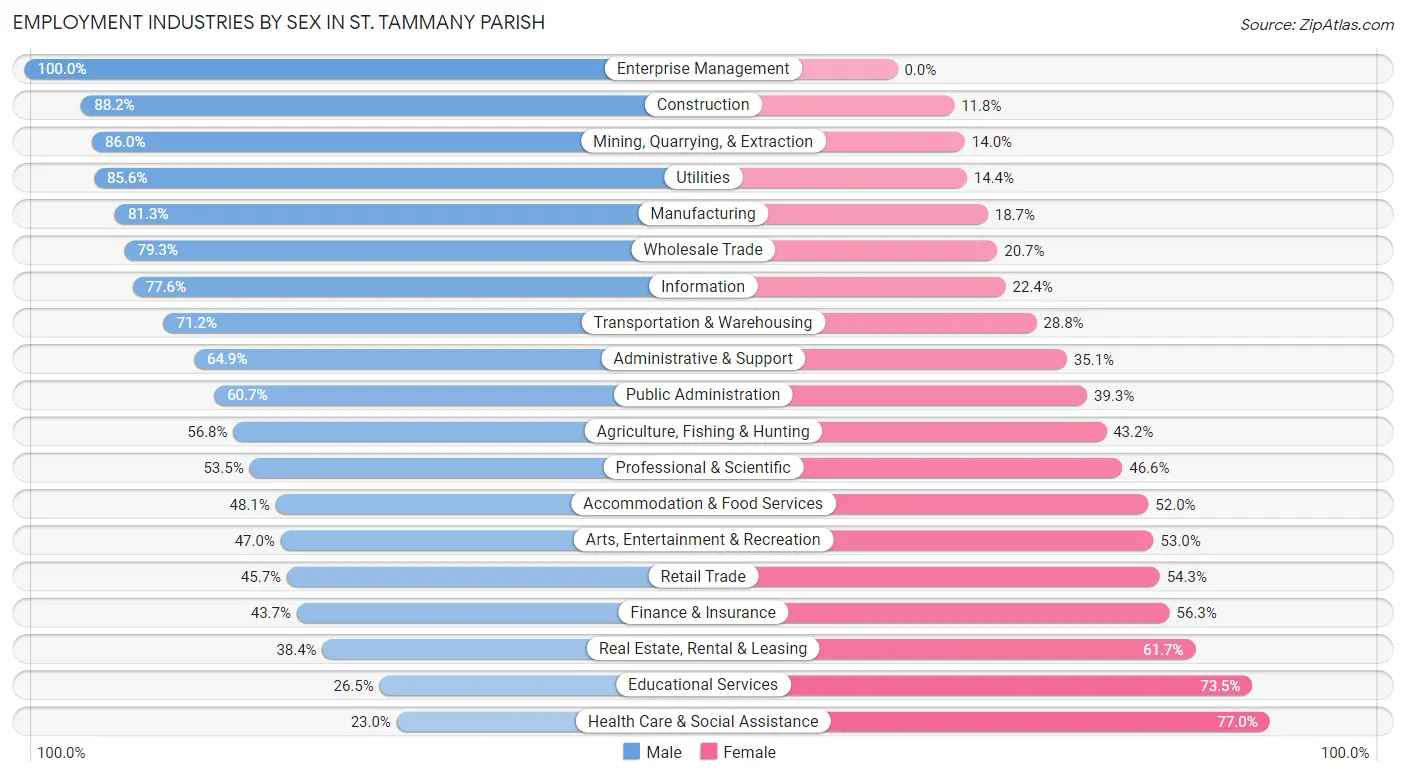
Employment Industries by Sex in St. Tammany Parish
The St. Tammany Parish industries that see more men than women are Enterprise Management (100.0%), Construction (88.2%), and Mining, Quarrying, & Extraction (86.0%), whereas the industries that tend to have a higher number of women are Health Care & Social Assistance (77.0%), Educational Services (73.5%), and Real Estate, Rental & Leasing (61.7%).
| Industry | Male | Female |
| Agriculture, Fishing & Hunting | 209 (56.8%) | 159 (43.2%) |
| Mining, Quarrying, & Extraction | 1,897 (86.0%) | 308 (14.0%) |
| Construction | 8,618 (88.2%) | 1,148 (11.8%) |
| Manufacturing | 6,133 (81.3%) | 1,412 (18.7%) |
| Wholesale Trade | 3,604 (79.3%) | 940 (20.7%) |
| Retail Trade | 6,173 (45.7%) | 7,331 (54.3%) |
| Transportation & Warehousing | 4,150 (71.2%) | 1,676 (28.8%) |
| Utilities | 912 (85.6%) | 153 (14.4%) |
| Information | 1,888 (77.6%) | 545 (22.4%) |
| Finance & Insurance | 2,711 (43.7%) | 3,499 (56.3%) |
| Real Estate, Rental & Leasing | 757 (38.4%) | 1,217 (61.7%) |
| Professional & Scientific | 5,030 (53.4%) | 4,380 (46.6%) |
| Enterprise Management | 46 (100.0%) | 0 (0.0%) |
| Administrative & Support | 2,900 (64.9%) | 1,567 (35.1%) |
| Educational Services | 2,947 (26.5%) | 8,155 (73.5%) |
| Health Care & Social Assistance | 4,139 (23.0%) | 13,869 (77.0%) |
| Arts, Entertainment & Recreation | 1,279 (47.0%) | 1,443 (53.0%) |
| Accommodation & Food Services | 4,263 (48.0%) | 4,609 (51.9%) |
| Public Administration | 4,067 (60.7%) | 2,629 (39.3%) |
| Total | 64,963 (52.6%) | 58,546 (47.4%) |
Education in St. Tammany Parish
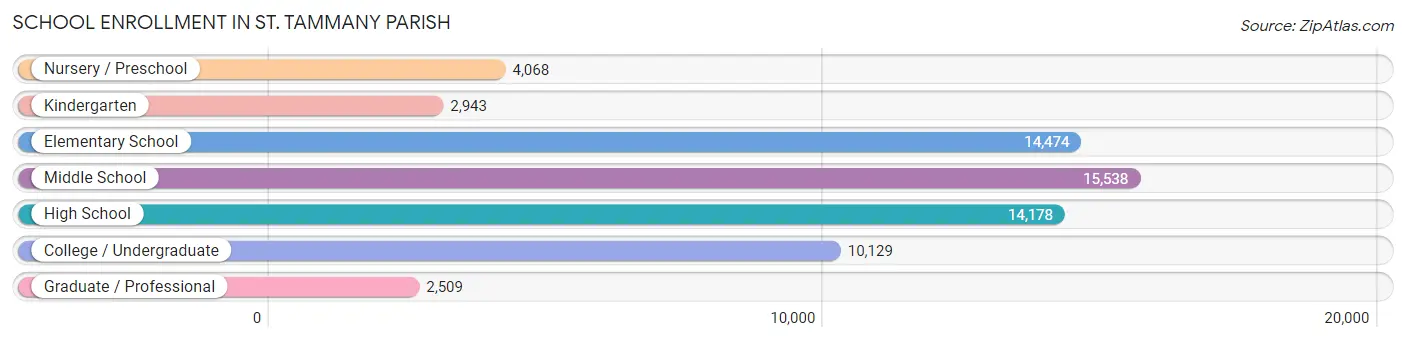
School Enrollment in St. Tammany Parish
The most common levels of schooling among the 63,839 students in St. Tammany Parish are middle school (15,538 | 24.3%), elementary school (14,474 | 22.7%), and high school (14,178 | 22.2%).
| School Level | # Students | % Students |
| Nursery / Preschool | 4,068 | 6.4% |
| Kindergarten | 2,943 | 4.6% |
| Elementary School | 14,474 | 22.7% |
| Middle School | 15,538 | 24.3% |
| High School | 14,178 | 22.2% |
| College / Undergraduate | 10,129 | 15.9% |
| Graduate / Professional | 2,509 | 3.9% |
| Total | 63,839 | 100.0% |
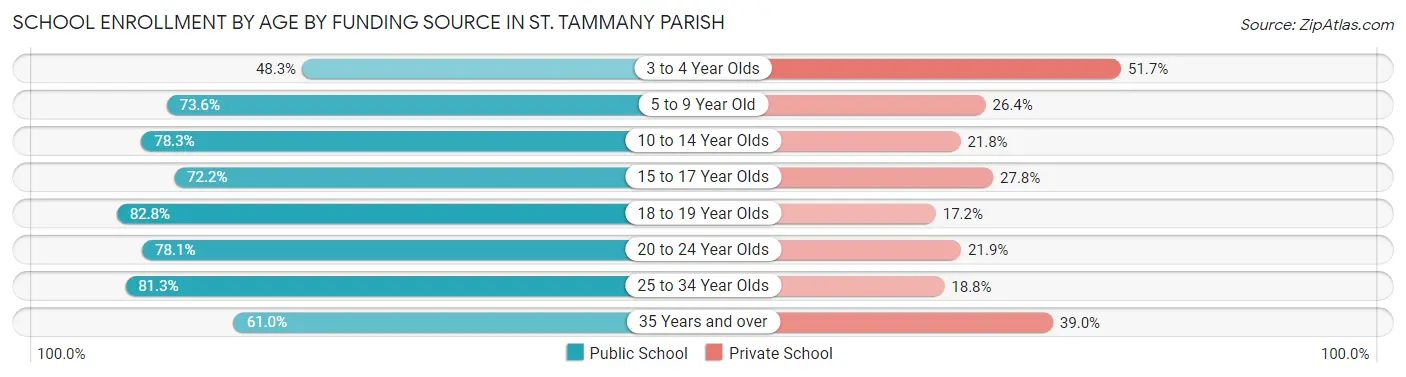
School Enrollment by Age by Funding Source in St. Tammany Parish
Out of a total of 63,839 students who are enrolled in schools in St. Tammany Parish, 16,598 (26.0%) attend a private institution, while the remaining 47,241 (74.0%) are enrolled in public schools. The age group of 3 to 4 year olds has the highest likelihood of being enrolled in private schools, with 1,831 (51.7% in the age bracket) enrolled. Conversely, the age group of 18 to 19 year olds has the lowest likelihood of being enrolled in a private school, with 3,274 (82.8% in the age bracket) attending a public institution.
| Age Bracket | Public School | Private School |
| 3 to 4 Year Olds | 1,713 (48.3%) | 1,831 (51.7%) |
| 5 to 9 Year Old | 11,415 (73.6%) | 4,103 (26.4%) |
| 10 to 14 Year Olds | 14,545 (78.2%) | 4,042 (21.7%) |
| 15 to 17 Year Olds | 8,037 (72.2%) | 3,101 (27.8%) |
| 18 to 19 Year Olds | 3,274 (82.8%) | 678 (17.2%) |
| 20 to 24 Year Olds | 4,081 (78.1%) | 1,143 (21.9%) |
| 25 to 34 Year Olds | 2,383 (81.2%) | 550 (18.8%) |
| 35 Years and over | 1,796 (61.0%) | 1,147 (39.0%) |
| Total | 47,241 (74.0%) | 16,598 (26.0%) |
Educational Attainment by Field of Study in St. Tammany Parish
Business (15,302 | 21.6%), education (9,156 | 12.9%), science & technology (9,053 | 12.8%), engineering (5,604 | 7.9%), and liberal arts & history (4,801 | 6.8%) are the most common fields of study among 70,959 individuals in St. Tammany Parish who have obtained a bachelor's degree or higher.
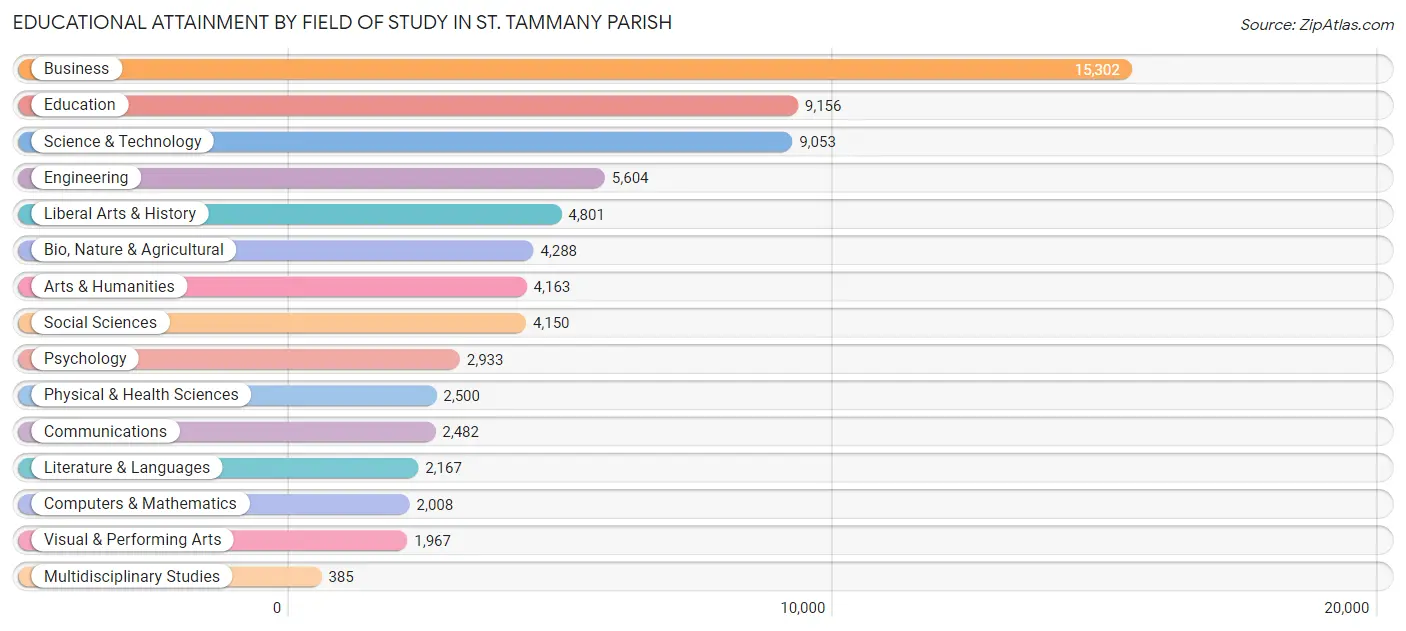
| Field of Study | # Graduates | % Graduates |
| Computers & Mathematics | 2,008 | 2.8% |
| Bio, Nature & Agricultural | 4,288 | 6.0% |
| Physical & Health Sciences | 2,500 | 3.5% |
| Psychology | 2,933 | 4.1% |
| Social Sciences | 4,150 | 5.9% |
| Engineering | 5,604 | 7.9% |
| Multidisciplinary Studies | 385 | 0.5% |
| Science & Technology | 9,053 | 12.8% |
| Business | 15,302 | 21.6% |
| Education | 9,156 | 12.9% |
| Literature & Languages | 2,167 | 3.0% |
| Liberal Arts & History | 4,801 | 6.8% |
| Visual & Performing Arts | 1,967 | 2.8% |
| Communications | 2,482 | 3.5% |
| Arts & Humanities | 4,163 | 5.9% |
| Total | 70,959 | 100.0% |
Transportation & Commute in St. Tammany Parish
Vehicle Availability by Sex in St. Tammany Parish
The most prevalent vehicle ownership categories in St. Tammany Parish are males with 2 vehicles (30,582, accounting for 47.7%) and females with 2 vehicles (24,947, making up 53.5%).
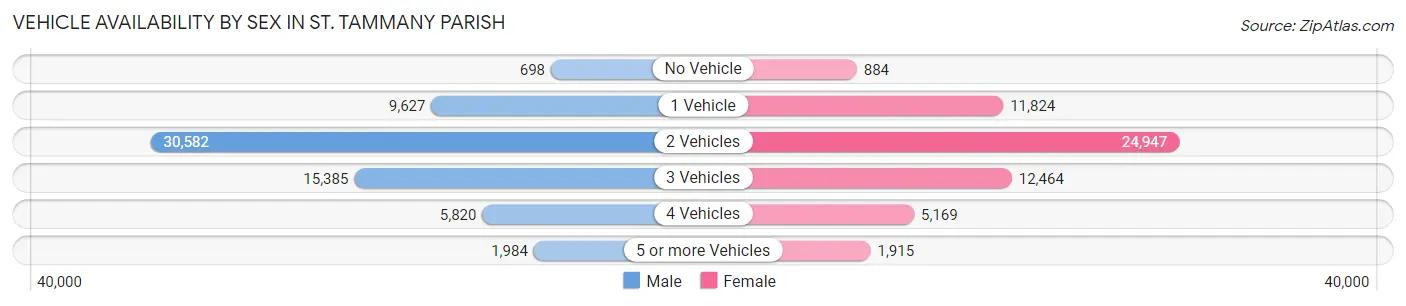
| Vehicles Available | Male | Female |
| No Vehicle | 698 (1.1%) | 884 (1.5%) |
| 1 Vehicle | 9,627 (15.0%) | 11,824 (20.7%) |
| 2 Vehicles | 30,582 (47.7%) | 24,947 (43.6%) |
| 3 Vehicles | 15,385 (24.0%) | 12,464 (21.8%) |
| 4 Vehicles | 5,820 (9.1%) | 5,169 (9.0%) |
| 5 or more Vehicles | 1,984 (3.1%) | 1,915 (3.4%) |
| Total | 64,096 (100.0%) | 57,203 (100.0%) |
Commute Time in St. Tammany Parish
The most frequently occuring commute durations in St. Tammany Parish are 15 to 19 minutes (15,023 commuters, 13.9%), 45 to 59 minutes (14,344 commuters, 13.3%), and 10 to 14 minutes (12,936 commuters, 12.0%).
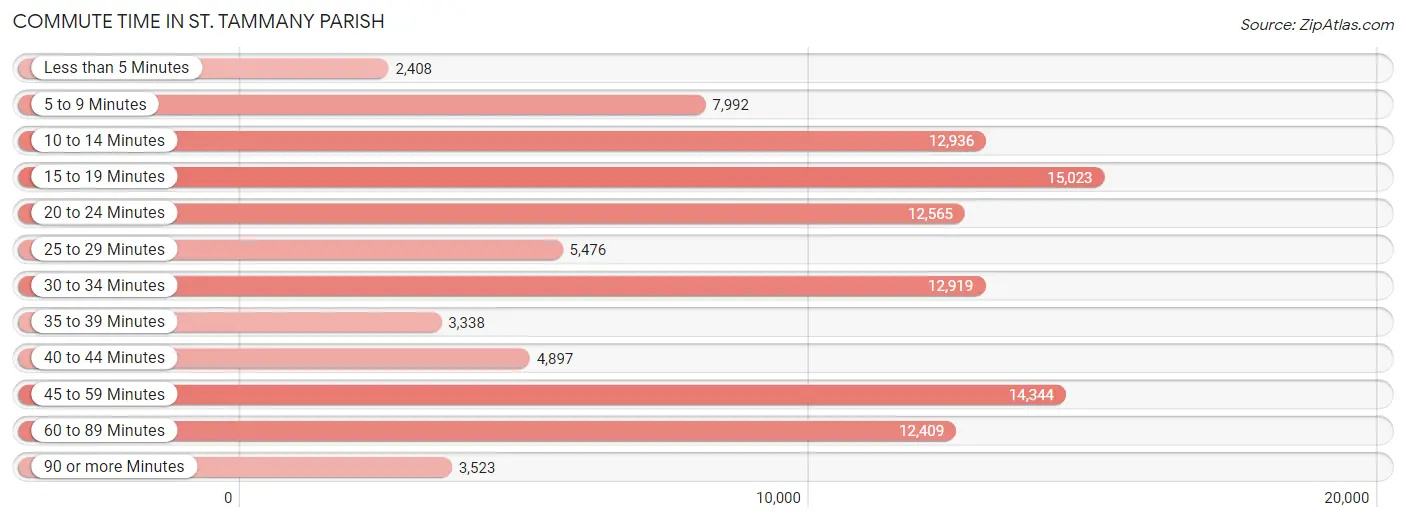
| Commute Time | # Commuters | % Commuters |
| Less than 5 Minutes | 2,408 | 2.2% |
| 5 to 9 Minutes | 7,992 | 7.4% |
| 10 to 14 Minutes | 12,936 | 12.0% |
| 15 to 19 Minutes | 15,023 | 13.9% |
| 20 to 24 Minutes | 12,565 | 11.7% |
| 25 to 29 Minutes | 5,476 | 5.1% |
| 30 to 34 Minutes | 12,919 | 12.0% |
| 35 to 39 Minutes | 3,338 | 3.1% |
| 40 to 44 Minutes | 4,897 | 4.5% |
| 45 to 59 Minutes | 14,344 | 13.3% |
| 60 to 89 Minutes | 12,409 | 11.5% |
| 90 or more Minutes | 3,523 | 3.3% |
Commute Time by Sex in St. Tammany Parish
The most common commute times in St. Tammany Parish are 45 to 59 minutes (8,957 commuters, 15.6%) for males and 15 to 19 minutes (8,109 commuters, 16.1%) for females.
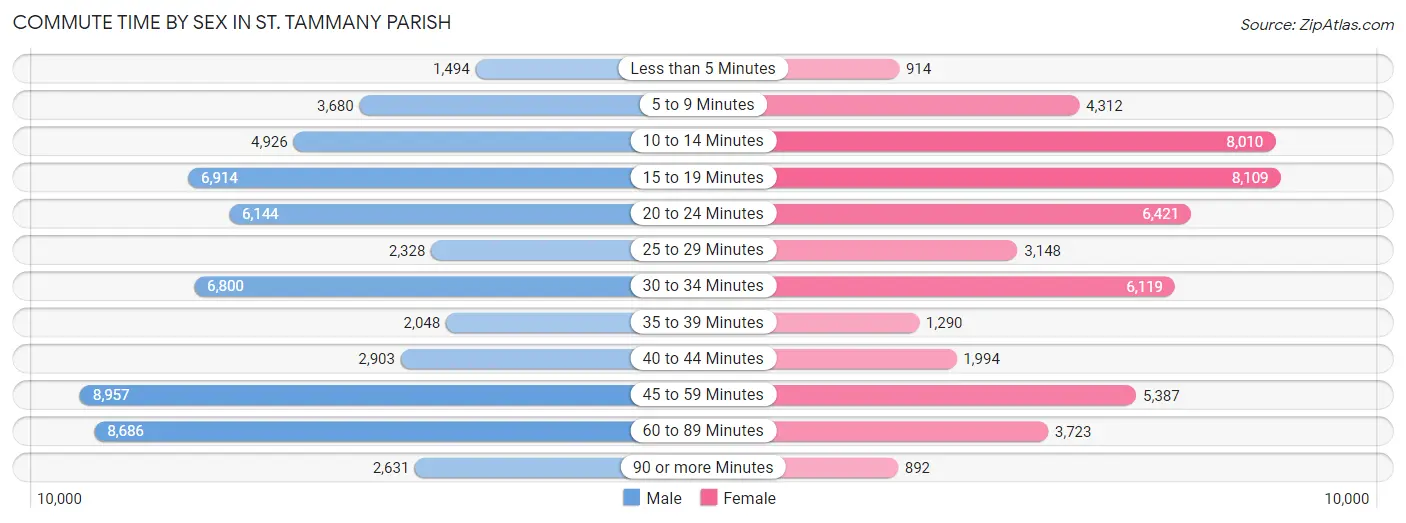
| Commute Time | Male | Female |
| Less than 5 Minutes | 1,494 (2.6%) | 914 (1.8%) |
| 5 to 9 Minutes | 3,680 (6.4%) | 4,312 (8.6%) |
| 10 to 14 Minutes | 4,926 (8.6%) | 8,010 (15.9%) |
| 15 to 19 Minutes | 6,914 (12.0%) | 8,109 (16.1%) |
| 20 to 24 Minutes | 6,144 (10.7%) | 6,421 (12.8%) |
| 25 to 29 Minutes | 2,328 (4.1%) | 3,148 (6.3%) |
| 30 to 34 Minutes | 6,800 (11.8%) | 6,119 (12.2%) |
| 35 to 39 Minutes | 2,048 (3.6%) | 1,290 (2.6%) |
| 40 to 44 Minutes | 2,903 (5.1%) | 1,994 (4.0%) |
| 45 to 59 Minutes | 8,957 (15.6%) | 5,387 (10.7%) |
| 60 to 89 Minutes | 8,686 (15.1%) | 3,723 (7.4%) |
| 90 or more Minutes | 2,631 (4.6%) | 892 (1.8%) |
Time of Departure to Work by Sex in St. Tammany Parish
The most frequent times of departure to work in St. Tammany Parish are 7:00 AM to 7:29 AM (8,475, 14.7%) for males and 7:00 AM to 7:29 AM (8,129, 16.2%) for females.
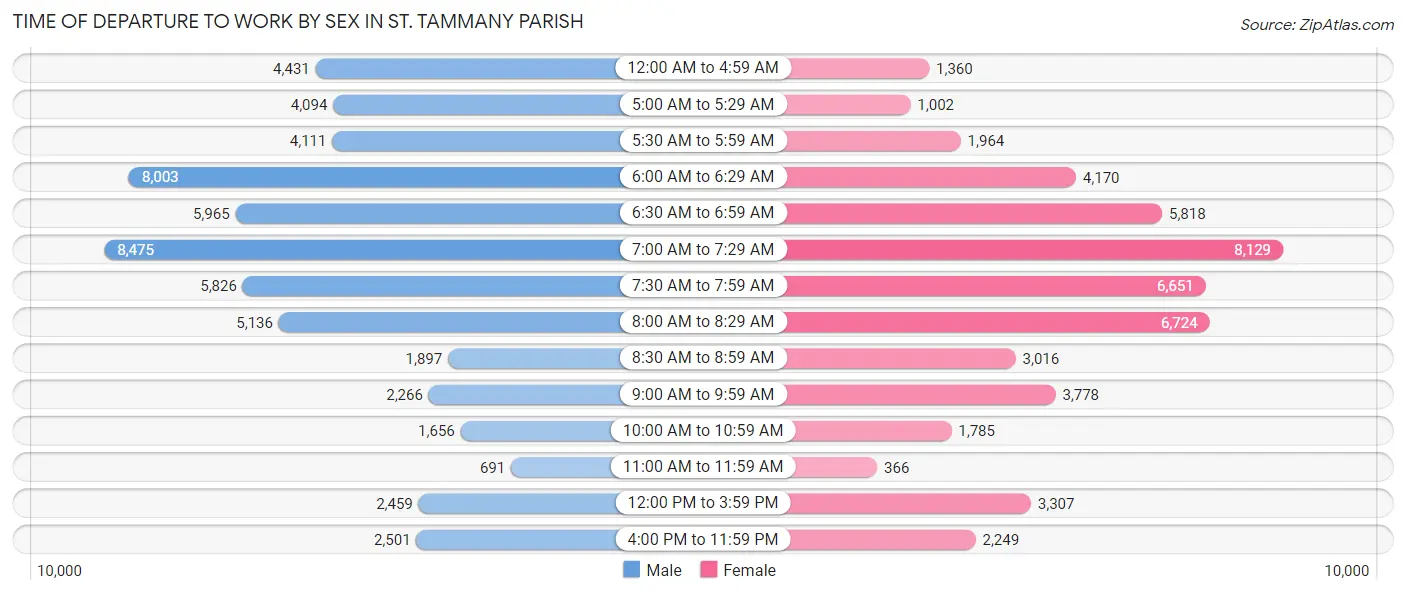
| Time of Departure | Male | Female |
| 12:00 AM to 4:59 AM | 4,431 (7.7%) | 1,360 (2.7%) |
| 5:00 AM to 5:29 AM | 4,094 (7.1%) | 1,002 (2.0%) |
| 5:30 AM to 5:59 AM | 4,111 (7.1%) | 1,964 (3.9%) |
| 6:00 AM to 6:29 AM | 8,003 (13.9%) | 4,170 (8.3%) |
| 6:30 AM to 6:59 AM | 5,965 (10.4%) | 5,818 (11.6%) |
| 7:00 AM to 7:29 AM | 8,475 (14.7%) | 8,129 (16.2%) |
| 7:30 AM to 7:59 AM | 5,826 (10.1%) | 6,651 (13.2%) |
| 8:00 AM to 8:29 AM | 5,136 (8.9%) | 6,724 (13.4%) |
| 8:30 AM to 8:59 AM | 1,897 (3.3%) | 3,016 (6.0%) |
| 9:00 AM to 9:59 AM | 2,266 (3.9%) | 3,778 (7.5%) |
| 10:00 AM to 10:59 AM | 1,656 (2.9%) | 1,785 (3.5%) |
| 11:00 AM to 11:59 AM | 691 (1.2%) | 366 (0.7%) |
| 12:00 PM to 3:59 PM | 2,459 (4.3%) | 3,307 (6.6%) |
| 4:00 PM to 11:59 PM | 2,501 (4.3%) | 2,249 (4.5%) |
| Total | 57,511 (100.0%) | 50,319 (100.0%) |
Housing Occupancy in St. Tammany Parish
Occupancy by Ownership in St. Tammany Parish
Of the total 101,212 dwellings in St. Tammany Parish, owner-occupied units account for 80,039 (79.1%), while renter-occupied units make up 21,173 (20.9%).
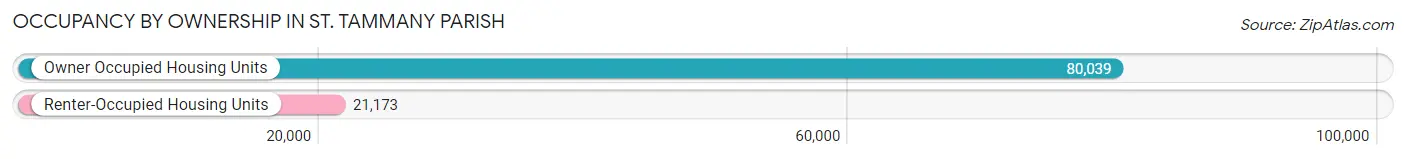
| Occupancy | # Housing Units | % Housing Units |
| Owner Occupied Housing Units | 80,039 | 79.1% |
| Renter-Occupied Housing Units | 21,173 | 20.9% |
| Total Occupied Housing Units | 101,212 | 100.0% |
Occupancy by Household Size in St. Tammany Parish
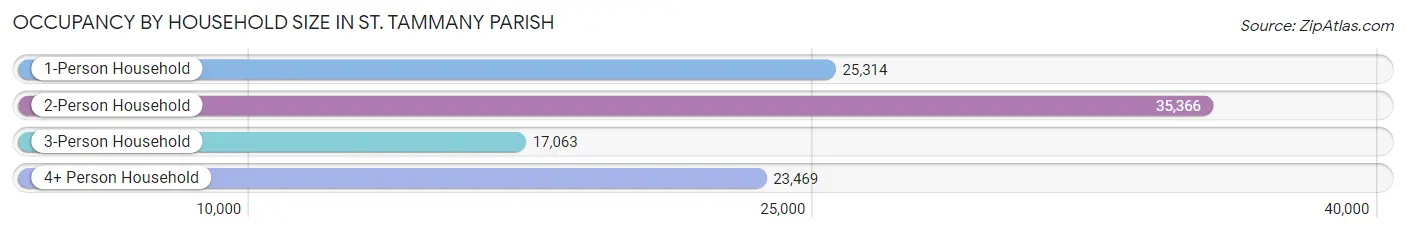
| Household Size | # Housing Units | % Housing Units |
| 1-Person Household | 25,314 | 25.0% |
| 2-Person Household | 35,366 | 34.9% |
| 3-Person Household | 17,063 | 16.9% |
| 4+ Person Household | 23,469 | 23.2% |
| Total Housing Units | 101,212 | 100.0% |
Occupancy by Ownership by Household Size in St. Tammany Parish
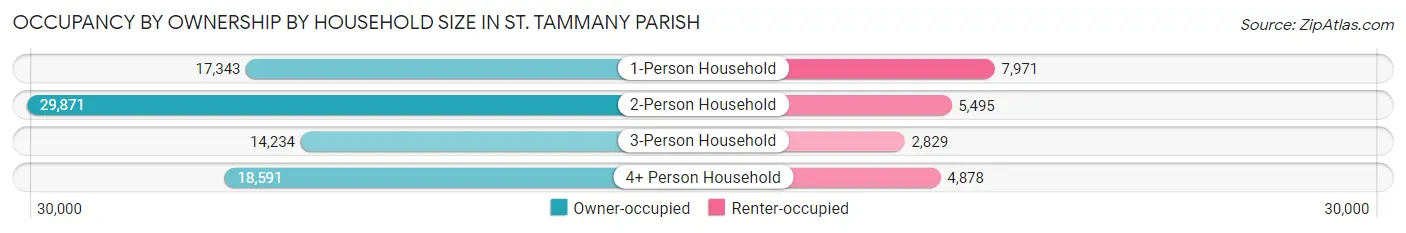
| Household Size | Owner-occupied | Renter-occupied |
| 1-Person Household | 17,343 (68.5%) | 7,971 (31.5%) |
| 2-Person Household | 29,871 (84.5%) | 5,495 (15.5%) |
| 3-Person Household | 14,234 (83.4%) | 2,829 (16.6%) |
| 4+ Person Household | 18,591 (79.2%) | 4,878 (20.8%) |
| Total Housing Units | 80,039 (79.1%) | 21,173 (20.9%) |
Occupancy by Educational Attainment in St. Tammany Parish
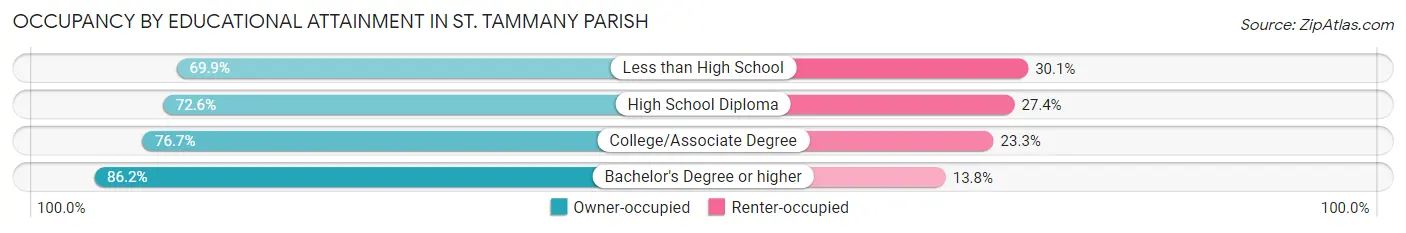
| Household Size | Owner-occupied | Renter-occupied |
| Less than High School | 5,222 (69.9%) | 2,253 (30.1%) |
| High School Diploma | 15,478 (72.6%) | 5,848 (27.4%) |
| College/Associate Degree | 24,888 (76.7%) | 7,556 (23.3%) |
| Bachelor's Degree or higher | 34,451 (86.2%) | 5,516 (13.8%) |
Occupancy by Age of Householder in St. Tammany Parish
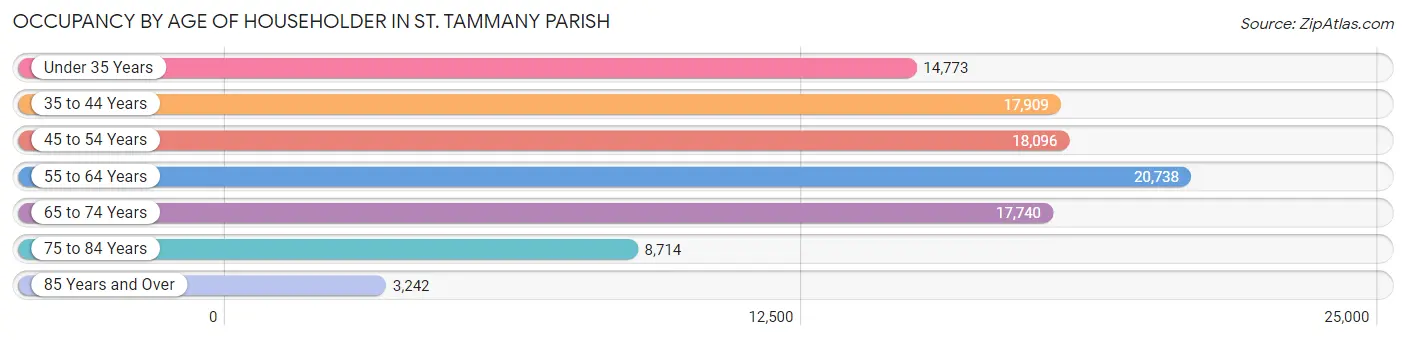
| Age Bracket | # Households | % Households |
| Under 35 Years | 14,773 | 14.6% |
| 35 to 44 Years | 17,909 | 17.7% |
| 45 to 54 Years | 18,096 | 17.9% |
| 55 to 64 Years | 20,738 | 20.5% |
| 65 to 74 Years | 17,740 | 17.5% |
| 75 to 84 Years | 8,714 | 8.6% |
| 85 Years and Over | 3,242 | 3.2% |
| Total | 101,212 | 100.0% |
Housing Finances in St. Tammany Parish
Median Income by Occupancy in St. Tammany Parish
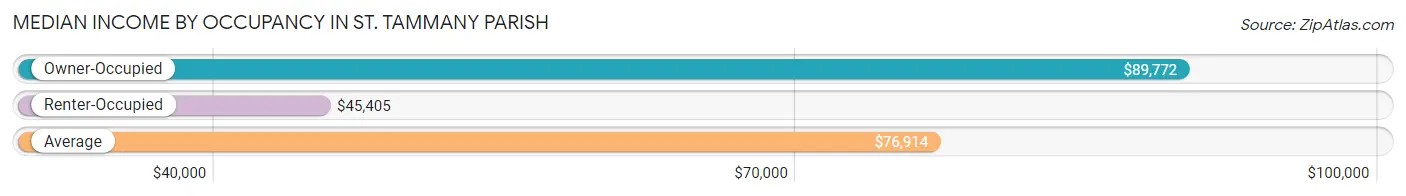
| Occupancy Type | # Households | Median Income |
| Owner-Occupied | 80,039 (79.1%) | $89,772 |
| Renter-Occupied | 21,173 (20.9%) | $45,405 |
| Average | 101,212 (100.0%) | $76,914 |
Occupancy by Householder Income Bracket in St. Tammany Parish
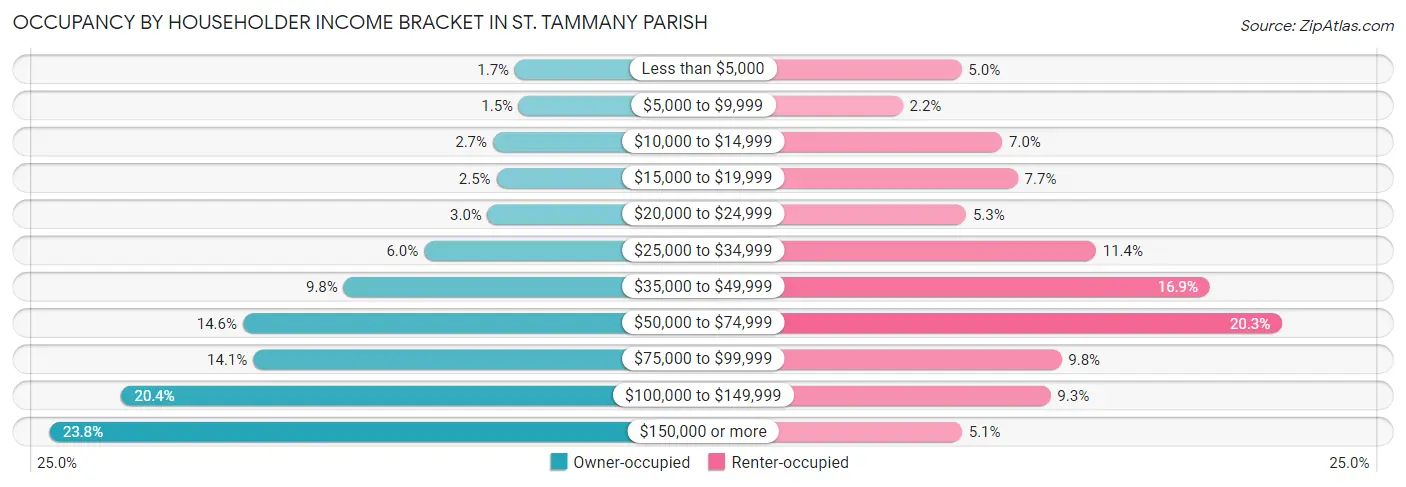
| Income Bracket | Owner-occupied | Renter-occupied |
| Less than $5,000 | 1,319 (1.7%) | 1,068 (5.0%) |
| $5,000 to $9,999 | 1,172 (1.5%) | 474 (2.2%) |
| $10,000 to $14,999 | 2,163 (2.7%) | 1,478 (7.0%) |
| $15,000 to $19,999 | 2,023 (2.5%) | 1,634 (7.7%) |
| $20,000 to $24,999 | 2,358 (2.9%) | 1,113 (5.3%) |
| $25,000 to $34,999 | 4,789 (6.0%) | 2,423 (11.4%) |
| $35,000 to $49,999 | 7,850 (9.8%) | 3,572 (16.9%) |
| $50,000 to $74,999 | 11,693 (14.6%) | 4,300 (20.3%) |
| $75,000 to $99,999 | 11,302 (14.1%) | 2,075 (9.8%) |
| $100,000 to $149,999 | 16,321 (20.4%) | 1,965 (9.3%) |
| $150,000 or more | 19,049 (23.8%) | 1,071 (5.1%) |
| Total | 80,039 (100.0%) | 21,173 (100.0%) |
Monthly Housing Cost Tiers in St. Tammany Parish
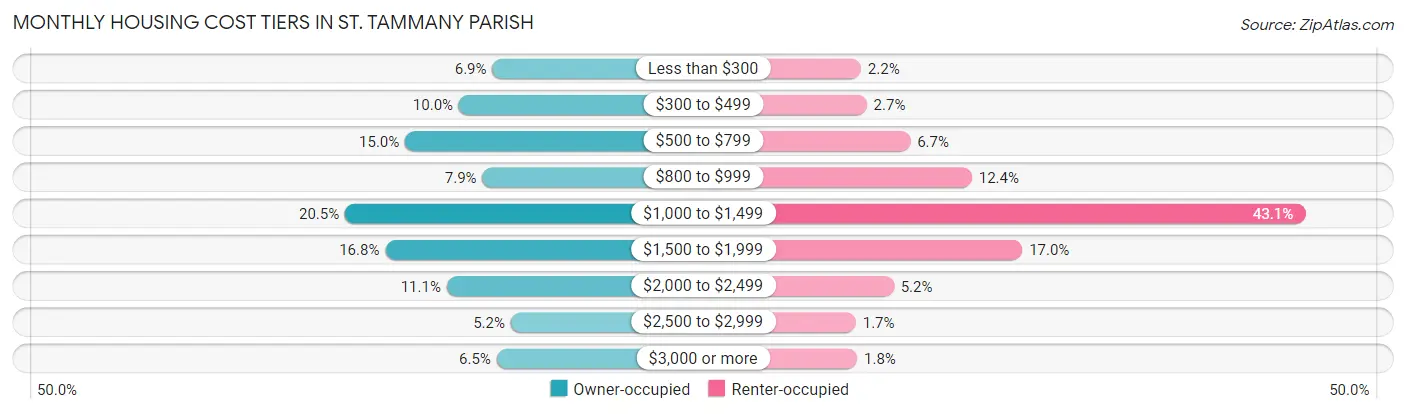
| Monthly Cost | Owner-occupied | Renter-occupied |
| Less than $300 | 5,551 (6.9%) | 458 (2.2%) |
| $300 to $499 | 8,023 (10.0%) | 570 (2.7%) |
| $500 to $799 | 11,981 (15.0%) | 1,419 (6.7%) |
| $800 to $999 | 6,287 (7.9%) | 2,620 (12.4%) |
| $1,000 to $1,499 | 16,410 (20.5%) | 9,116 (43.0%) |
| $1,500 to $1,999 | 13,444 (16.8%) | 3,602 (17.0%) |
| $2,000 to $2,499 | 8,917 (11.1%) | 1,096 (5.2%) |
| $2,500 to $2,999 | 4,193 (5.2%) | 357 (1.7%) |
| $3,000 or more | 5,233 (6.5%) | 383 (1.8%) |
| Total | 80,039 (100.0%) | 21,173 (100.0%) |
Physical Housing Characteristics in St. Tammany Parish
Housing Structures in St. Tammany Parish
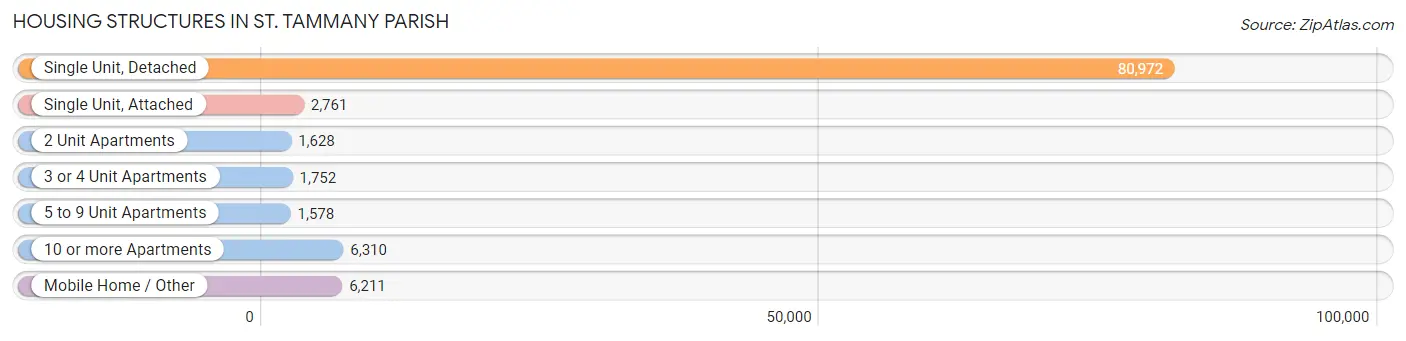
| Structure Type | # Housing Units | % Housing Units |
| Single Unit, Detached | 80,972 | 80.0% |
| Single Unit, Attached | 2,761 | 2.7% |
| 2 Unit Apartments | 1,628 | 1.6% |
| 3 or 4 Unit Apartments | 1,752 | 1.7% |
| 5 to 9 Unit Apartments | 1,578 | 1.6% |
| 10 or more Apartments | 6,310 | 6.2% |
| Mobile Home / Other | 6,211 | 6.1% |
| Total | 101,212 | 100.0% |
Housing Structures by Occupancy in St. Tammany Parish
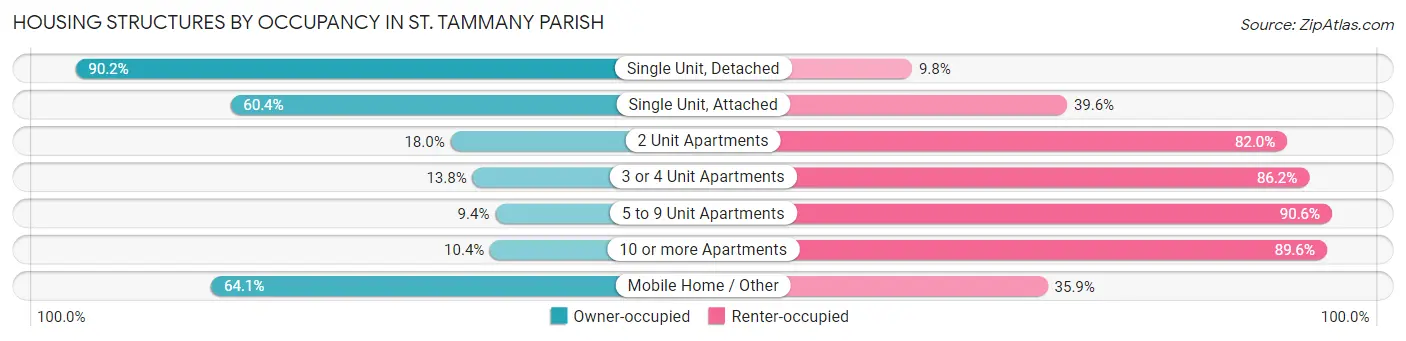
| Structure Type | Owner-occupied | Renter-occupied |
| Single Unit, Detached | 73,055 (90.2%) | 7,917 (9.8%) |
| Single Unit, Attached | 1,667 (60.4%) | 1,094 (39.6%) |
| 2 Unit Apartments | 293 (18.0%) | 1,335 (82.0%) |
| 3 or 4 Unit Apartments | 241 (13.8%) | 1,511 (86.2%) |
| 5 to 9 Unit Apartments | 148 (9.4%) | 1,430 (90.6%) |
| 10 or more Apartments | 654 (10.4%) | 5,656 (89.6%) |
| Mobile Home / Other | 3,981 (64.1%) | 2,230 (35.9%) |
| Total | 80,039 (79.1%) | 21,173 (20.9%) |
Housing Structures by Number of Rooms in St. Tammany Parish
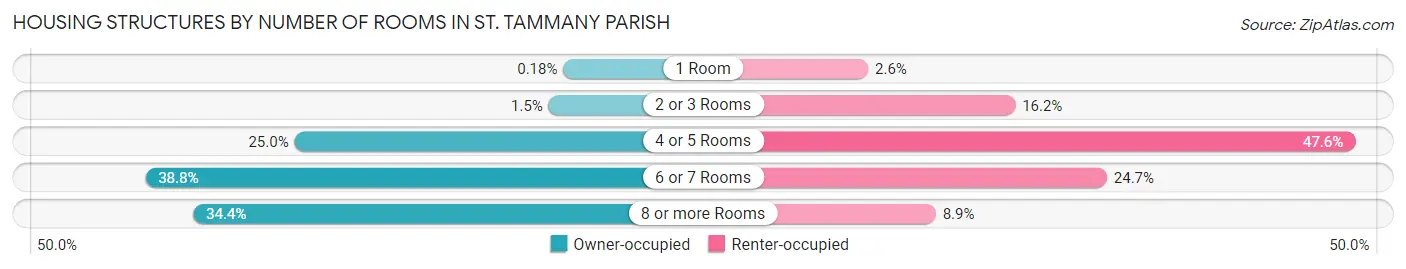
| Number of Rooms | Owner-occupied | Renter-occupied |
| 1 Room | 146 (0.2%) | 552 (2.6%) |
| 2 or 3 Rooms | 1,222 (1.5%) | 3,432 (16.2%) |
| 4 or 5 Rooms | 20,040 (25.0%) | 10,086 (47.6%) |
| 6 or 7 Rooms | 31,087 (38.8%) | 5,227 (24.7%) |
| 8 or more Rooms | 27,544 (34.4%) | 1,876 (8.9%) |
| Total | 80,039 (100.0%) | 21,173 (100.0%) |
Housing Structure by Heating Type in St. Tammany Parish
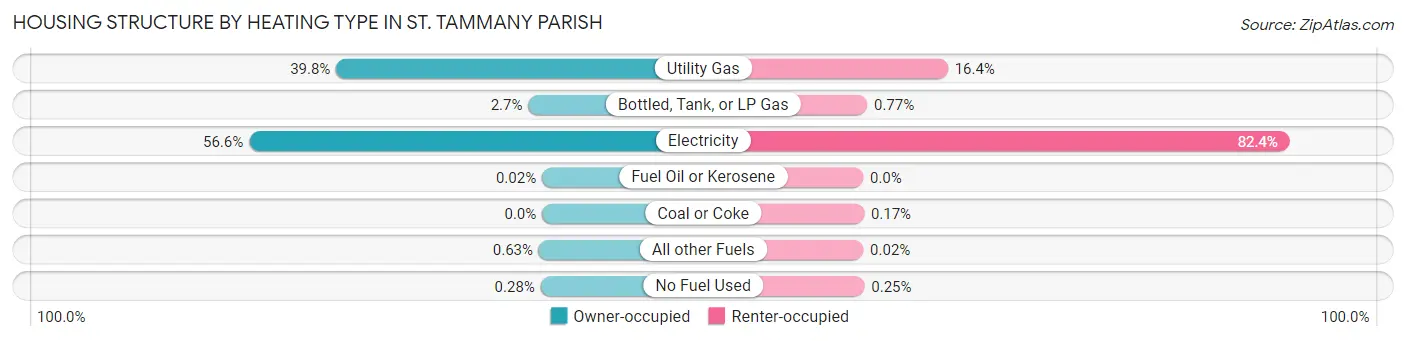
| Heating Type | Owner-occupied | Renter-occupied |
| Utility Gas | 31,844 (39.8%) | 3,463 (16.4%) |
| Bottled, Tank, or LP Gas | 2,134 (2.7%) | 163 (0.8%) |
| Electricity | 45,316 (56.6%) | 17,455 (82.4%) |
| Fuel Oil or Kerosene | 17 (0.0%) | 0 (0.0%) |
| Coal or Coke | 0 (0.0%) | 35 (0.2%) |
| All other Fuels | 505 (0.6%) | 5 (0.0%) |
| No Fuel Used | 223 (0.3%) | 52 (0.3%) |
| Total | 80,039 (100.0%) | 21,173 (100.0%) |
Household Vehicle Usage in St. Tammany Parish
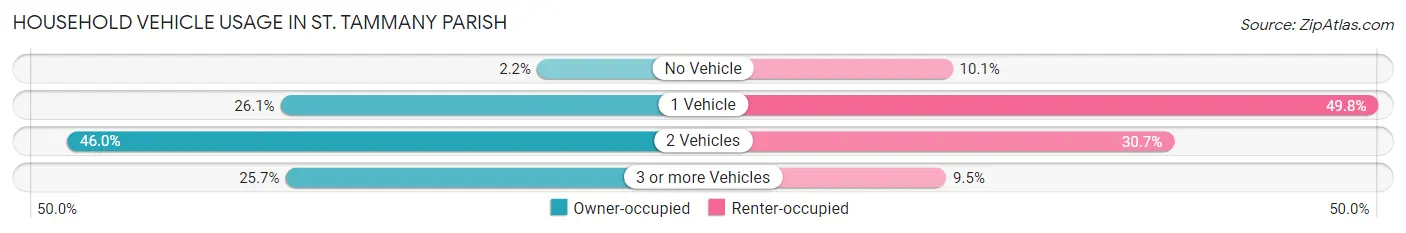
| Vehicles per Household | Owner-occupied | Renter-occupied |
| No Vehicle | 1,748 (2.2%) | 2,128 (10.1%) |
| 1 Vehicle | 20,905 (26.1%) | 10,539 (49.8%) |
| 2 Vehicles | 36,841 (46.0%) | 6,505 (30.7%) |
| 3 or more Vehicles | 20,545 (25.7%) | 2,001 (9.5%) |
| Total | 80,039 (100.0%) | 21,173 (100.0%) |
Real Estate & Mortgages in St. Tammany Parish
Real Estate and Mortgage Overview in St. Tammany Parish
| Characteristic | Without Mortgage | With Mortgage |
| Housing Units | 29,136 | 50,903 |
| Median Property Value | $241,200 | $272,300 |
| Median Household Income | $61,717 | $14,350 |
| Monthly Housing Costs | $537 | $5,163 |
| Real Estate Taxes | $1,615 | $3,073 |
Property Value by Mortgage Status in St. Tammany Parish
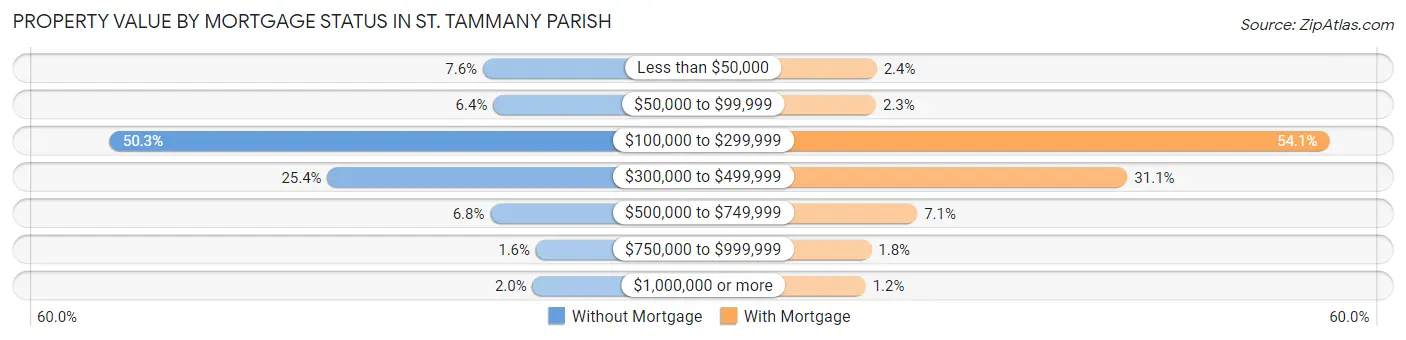
| Property Value | Without Mortgage | With Mortgage |
| Less than $50,000 | 2,219 (7.6%) | 1,231 (2.4%) |
| $50,000 to $99,999 | 1,876 (6.4%) | 1,191 (2.3%) |
| $100,000 to $299,999 | 14,643 (50.3%) | 27,561 (54.1%) |
| $300,000 to $499,999 | 7,399 (25.4%) | 15,817 (31.1%) |
| $500,000 to $749,999 | 1,974 (6.8%) | 3,590 (7.0%) |
| $750,000 to $999,999 | 458 (1.6%) | 922 (1.8%) |
| $1,000,000 or more | 567 (1.9%) | 591 (1.2%) |
| Total | 29,136 (100.0%) | 50,903 (100.0%) |
Household Income by Mortgage Status in St. Tammany Parish
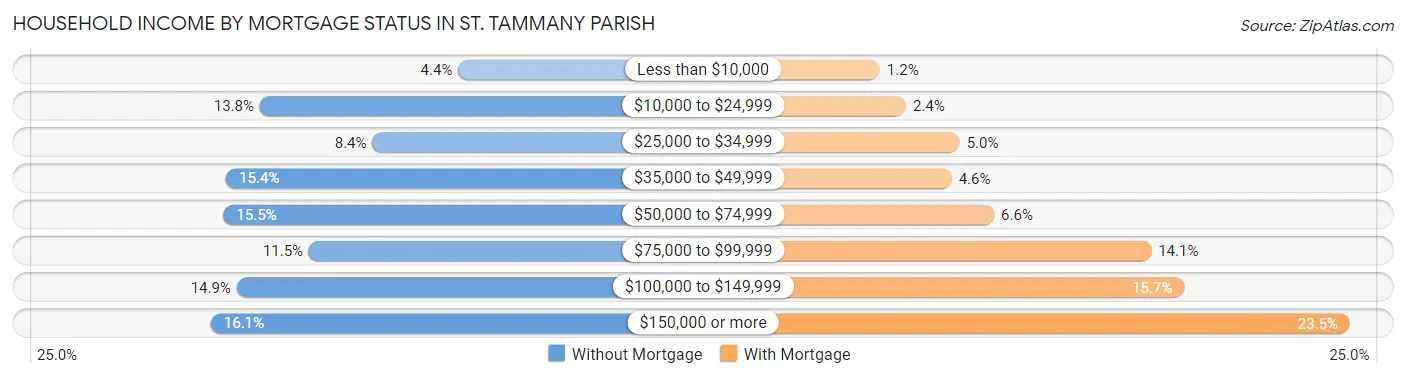
| Household Income | Without Mortgage | With Mortgage |
| Less than $10,000 | 1,267 (4.3%) | 593 (1.2%) |
| $10,000 to $24,999 | 4,020 (13.8%) | 1,224 (2.4%) |
| $25,000 to $34,999 | 2,458 (8.4%) | 2,524 (5.0%) |
| $35,000 to $49,999 | 4,488 (15.4%) | 2,331 (4.6%) |
| $50,000 to $74,999 | 4,526 (15.5%) | 3,362 (6.6%) |
| $75,000 to $99,999 | 3,338 (11.5%) | 7,167 (14.1%) |
| $100,000 to $149,999 | 4,340 (14.9%) | 7,964 (15.7%) |
| $150,000 or more | 4,699 (16.1%) | 11,981 (23.5%) |
| Total | 29,136 (100.0%) | 50,903 (100.0%) |
Property Value to Household Income Ratio in St. Tammany Parish
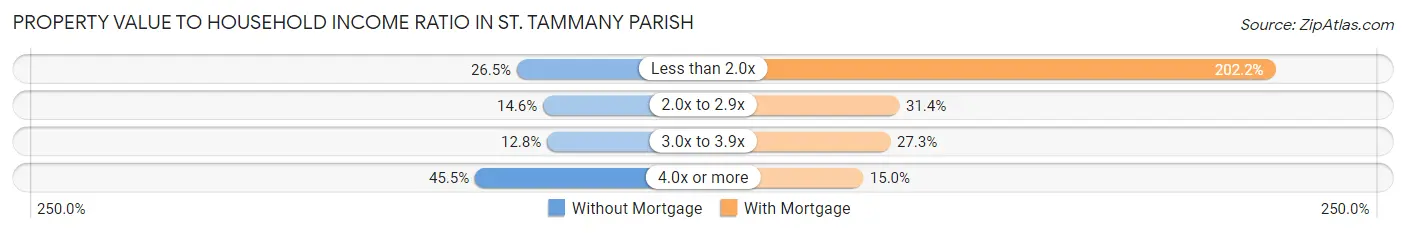
| Value-to-Income Ratio | Without Mortgage | With Mortgage |
| Less than 2.0x | 7,710 (26.5%) | 102,944 (202.2%) |
| 2.0x to 2.9x | 4,254 (14.6%) | 15,980 (31.4%) |
| 3.0x to 3.9x | 3,729 (12.8%) | 13,901 (27.3%) |
| 4.0x or more | 13,251 (45.5%) | 7,614 (15.0%) |
| Total | 29,136 (100.0%) | 50,903 (100.0%) |
Real Estate Taxes by Mortgage Status in St. Tammany Parish
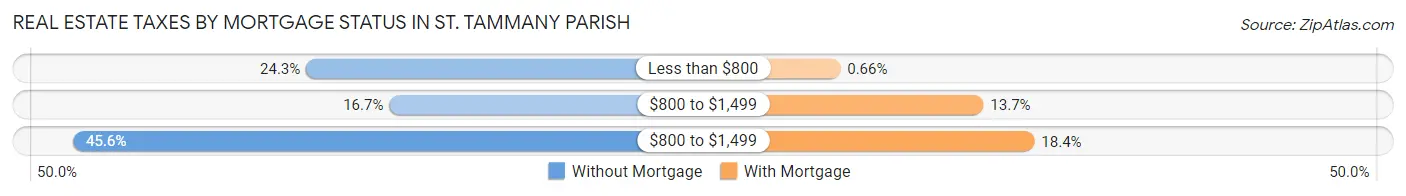
| Property Taxes | Without Mortgage | With Mortgage |
| Less than $800 | 7,077 (24.3%) | 338 (0.7%) |
| $800 to $1,499 | 4,867 (16.7%) | 6,988 (13.7%) |
| $800 to $1,499 | 13,279 (45.6%) | 9,362 (18.4%) |
| Total | 29,136 (100.0%) | 50,903 (100.0%) |
Health & Disability in St. Tammany Parish
Health Insurance Coverage by Age in St. Tammany Parish
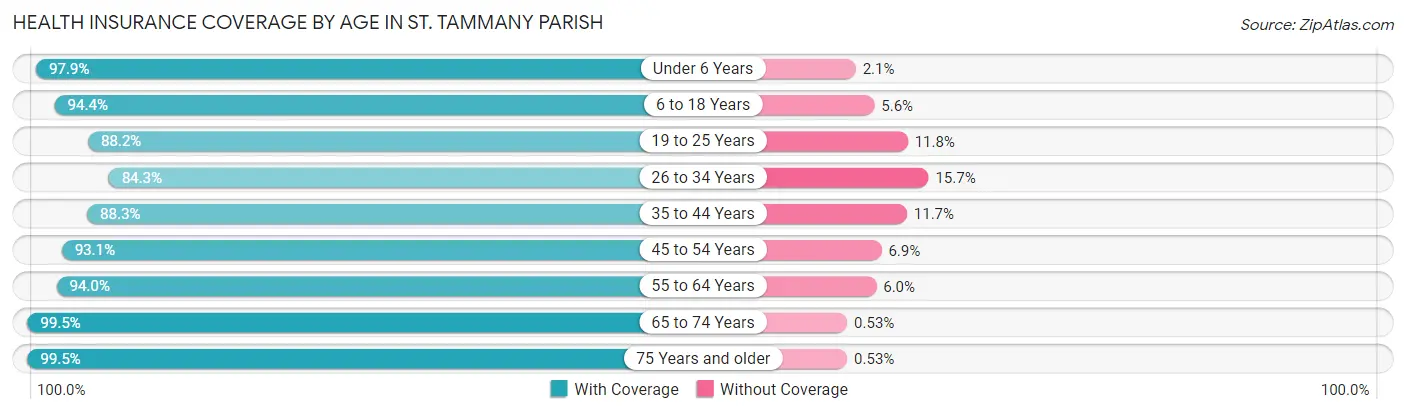
| Age Bracket | With Coverage | Without Coverage |
| Under 6 Years | 17,407 (97.9%) | 378 (2.1%) |
| 6 to 18 Years | 45,843 (94.4%) | 2,727 (5.6%) |
| 19 to 25 Years | 17,024 (88.2%) | 2,281 (11.8%) |
| 26 to 34 Years | 22,289 (84.3%) | 4,151 (15.7%) |
| 35 to 44 Years | 30,110 (88.3%) | 3,977 (11.7%) |
| 45 to 54 Years | 31,264 (93.1%) | 2,329 (6.9%) |
| 55 to 64 Years | 34,509 (94.0%) | 2,188 (6.0%) |
| 65 to 74 Years | 28,797 (99.5%) | 154 (0.5%) |
| 75 Years and older | 17,501 (99.5%) | 94 (0.5%) |
| Total | 244,744 (93.0%) | 18,279 (7.0%) |
Health Insurance Coverage by Citizenship Status in St. Tammany Parish
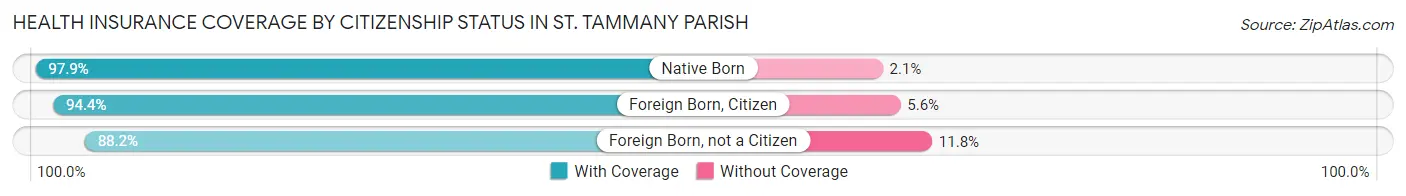
| Citizenship Status | With Coverage | Without Coverage |
| Native Born | 17,407 (97.9%) | 378 (2.1%) |
| Foreign Born, Citizen | 45,843 (94.4%) | 2,727 (5.6%) |
| Foreign Born, not a Citizen | 17,024 (88.2%) | 2,281 (11.8%) |
Health Insurance Coverage by Household Income in St. Tammany Parish
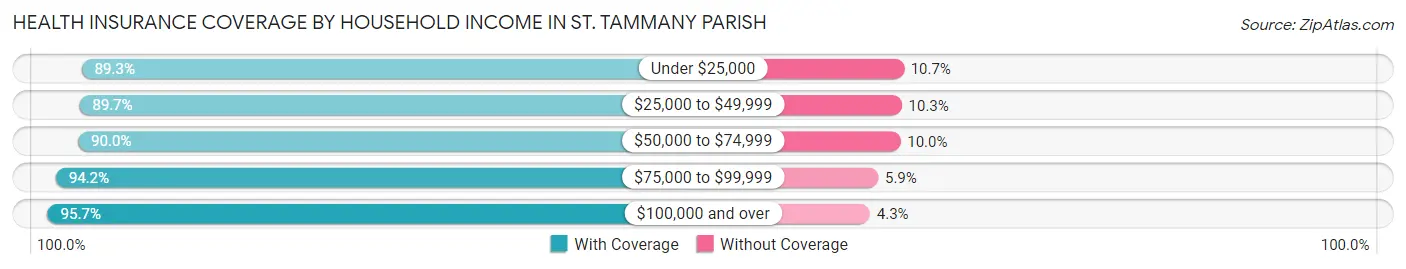
| Household Income | With Coverage | Without Coverage |
| Under $25,000 | 24,165 (89.3%) | 2,882 (10.7%) |
| $25,000 to $49,999 | 36,192 (89.7%) | 4,143 (10.3%) |
| $50,000 to $74,999 | 35,351 (90.0%) | 3,935 (10.0%) |
| $75,000 to $99,999 | 35,017 (94.2%) | 2,176 (5.9%) |
| $100,000 and over | 113,587 (95.7%) | 5,126 (4.3%) |
Public vs Private Health Insurance Coverage by Age in St. Tammany Parish
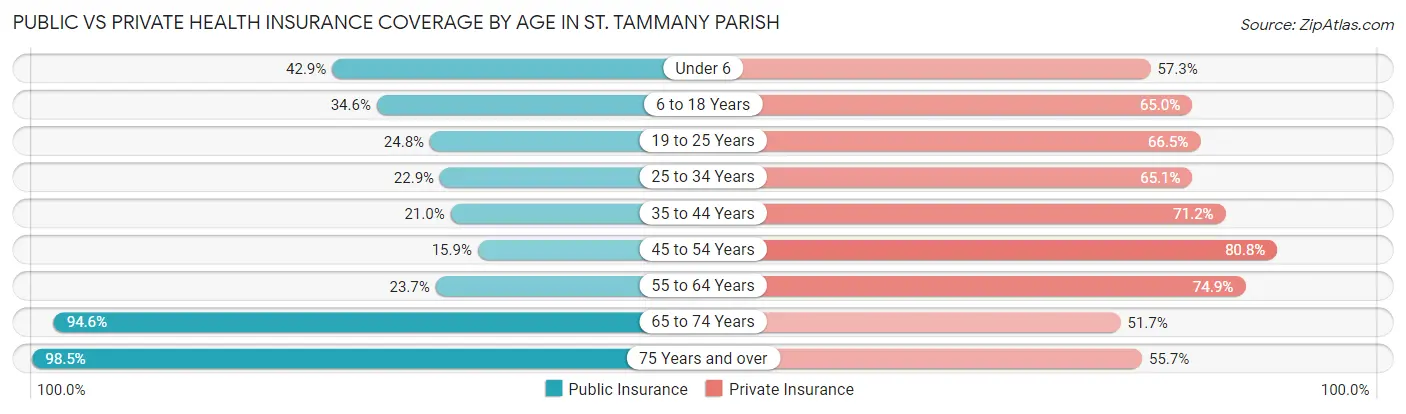
| Age Bracket | Public Insurance | Private Insurance |
| Under 6 | 7,634 (42.9%) | 10,191 (57.3%) |
| 6 to 18 Years | 16,826 (34.6%) | 31,574 (65.0%) |
| 19 to 25 Years | 4,782 (24.8%) | 12,839 (66.5%) |
| 25 to 34 Years | 6,057 (22.9%) | 17,201 (65.1%) |
| 35 to 44 Years | 7,141 (20.9%) | 24,269 (71.2%) |
| 45 to 54 Years | 5,337 (15.9%) | 27,148 (80.8%) |
| 55 to 64 Years | 8,708 (23.7%) | 27,470 (74.9%) |
| 65 to 74 Years | 27,379 (94.6%) | 14,978 (51.7%) |
| 75 Years and over | 17,338 (98.5%) | 9,806 (55.7%) |
| Total | 101,202 (38.5%) | 175,476 (66.7%) |
Disability Status by Sex by Age in St. Tammany Parish
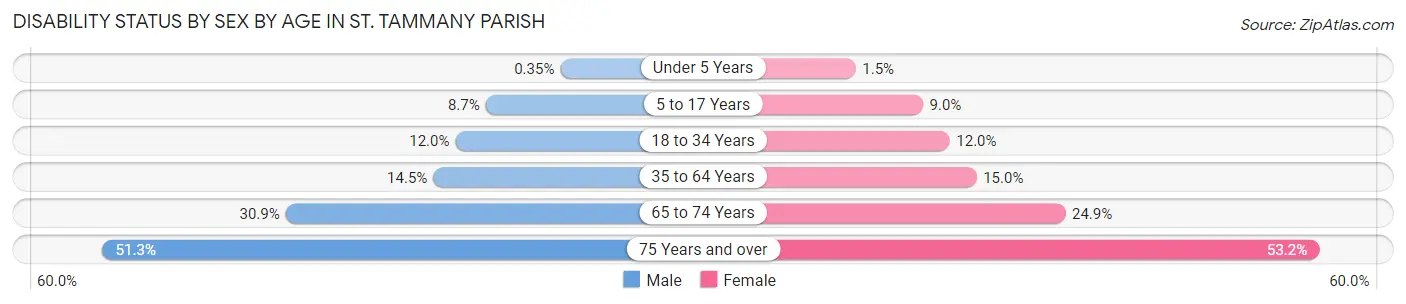
| Age Bracket | Male | Female |
| Under 5 Years | 27 (0.4%) | 113 (1.5%) |
| 5 to 17 Years | 2,103 (8.7%) | 2,085 (9.0%) |
| 18 to 34 Years | 2,924 (12.0%) | 3,003 (12.0%) |
| 35 to 64 Years | 7,342 (14.5%) | 8,046 (15.0%) |
| 65 to 74 Years | 4,243 (30.9%) | 3,789 (24.9%) |
| 75 Years and over | 3,886 (51.3%) | 5,326 (53.1%) |
Disability Class by Sex by Age in St. Tammany Parish
Disability Class: Hearing Difficulty
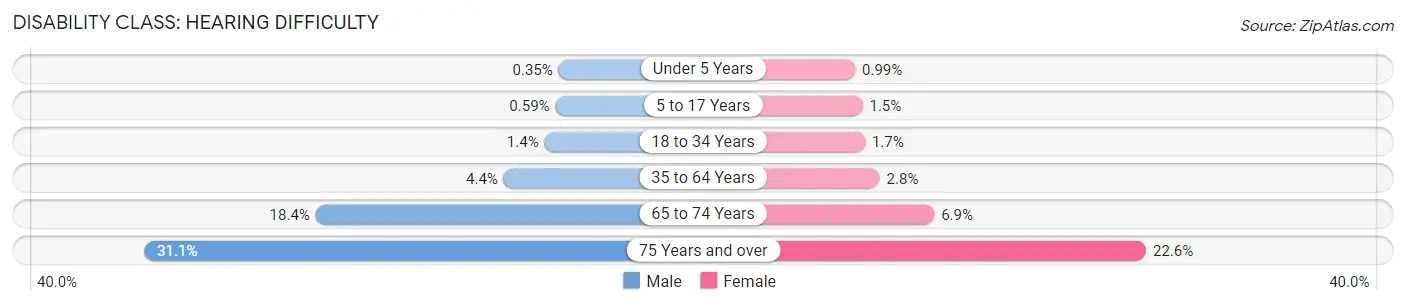
| Age Bracket | Male | Female |
| Under 5 Years | 27 (0.4%) | 74 (1.0%) |
| 5 to 17 Years | 143 (0.6%) | 356 (1.5%) |
| 18 to 34 Years | 340 (1.4%) | 432 (1.7%) |
| 35 to 64 Years | 2,246 (4.4%) | 1,512 (2.8%) |
| 65 to 74 Years | 2,521 (18.4%) | 1,046 (6.9%) |
| 75 Years and over | 2,357 (31.1%) | 2,264 (22.6%) |
Disability Class: Vision Difficulty
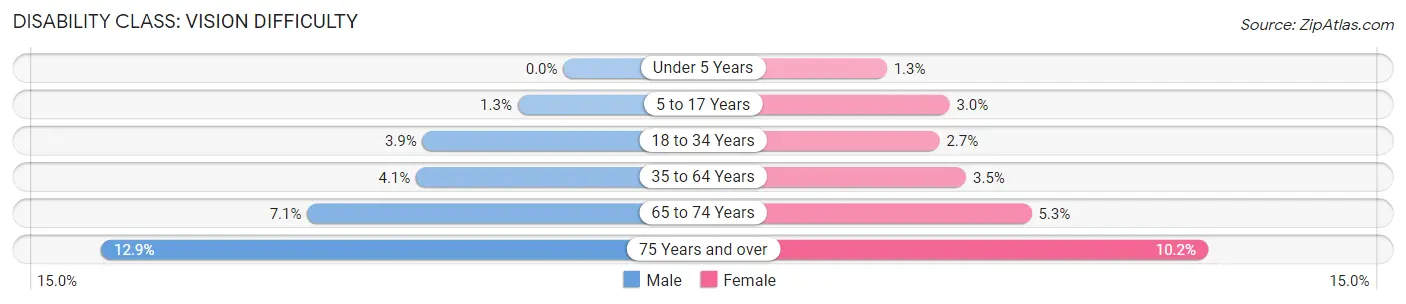
| Age Bracket | Male | Female |
| Under 5 Years | 0 (0.0%) | 94 (1.3%) |
| 5 to 17 Years | 308 (1.3%) | 695 (3.0%) |
| 18 to 34 Years | 954 (3.9%) | 683 (2.7%) |
| 35 to 64 Years | 2,077 (4.1%) | 1,858 (3.5%) |
| 65 to 74 Years | 977 (7.1%) | 805 (5.3%) |
| 75 Years and over | 975 (12.9%) | 1,021 (10.2%) |
Disability Class: Cognitive Difficulty
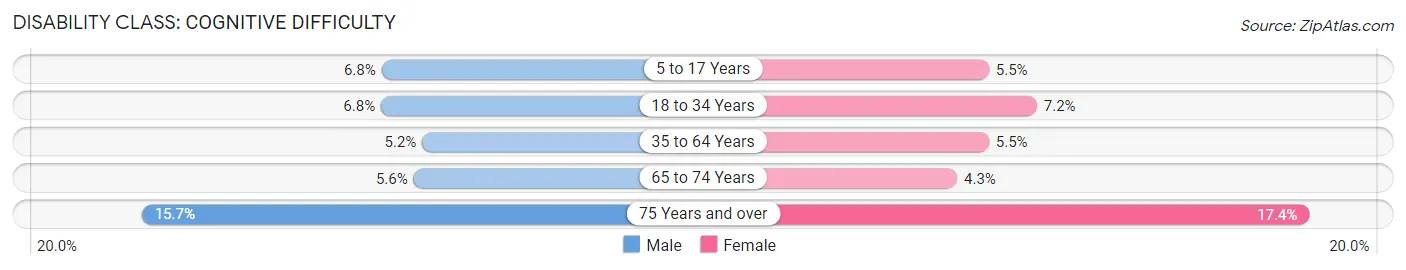
| Age Bracket | Male | Female |
| 5 to 17 Years | 1,639 (6.8%) | 1,264 (5.5%) |
| 18 to 34 Years | 1,646 (6.8%) | 1,816 (7.2%) |
| 35 to 64 Years | 2,654 (5.2%) | 2,932 (5.5%) |
| 65 to 74 Years | 763 (5.6%) | 652 (4.3%) |
| 75 Years and over | 1,185 (15.7%) | 1,739 (17.3%) |
Disability Class: Ambulatory Difficulty
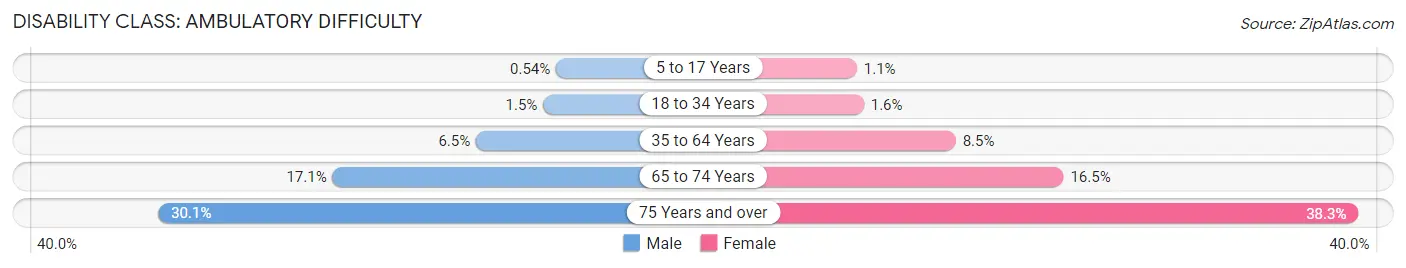
| Age Bracket | Male | Female |
| 5 to 17 Years | 132 (0.5%) | 259 (1.1%) |
| 18 to 34 Years | 364 (1.5%) | 409 (1.6%) |
| 35 to 64 Years | 3,282 (6.5%) | 4,545 (8.5%) |
| 65 to 74 Years | 2,350 (17.1%) | 2,508 (16.5%) |
| 75 Years and over | 2,279 (30.1%) | 3,842 (38.3%) |
Disability Class: Self-Care Difficulty
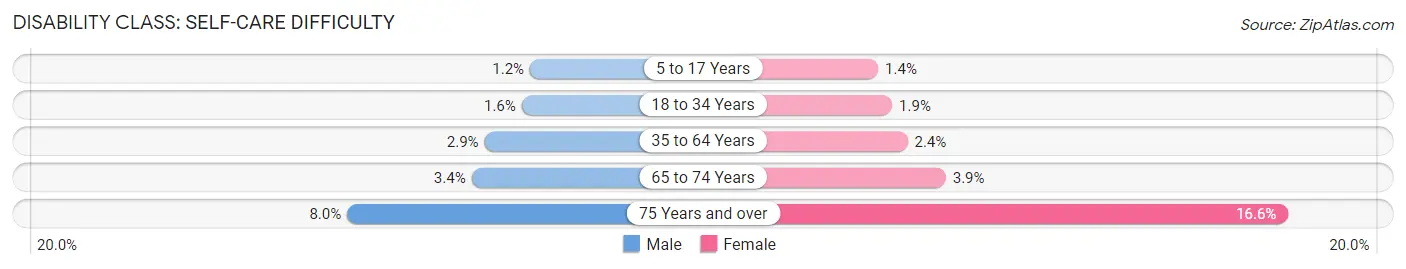
| Age Bracket | Male | Female |
| 5 to 17 Years | 300 (1.2%) | 312 (1.3%) |
| 18 to 34 Years | 378 (1.5%) | 469 (1.9%) |
| 35 to 64 Years | 1,482 (2.9%) | 1,311 (2.4%) |
| 65 to 74 Years | 467 (3.4%) | 588 (3.9%) |
| 75 Years and over | 608 (8.0%) | 1,660 (16.6%) |
Technology Access in St. Tammany Parish
Computing Device Access in St. Tammany Parish
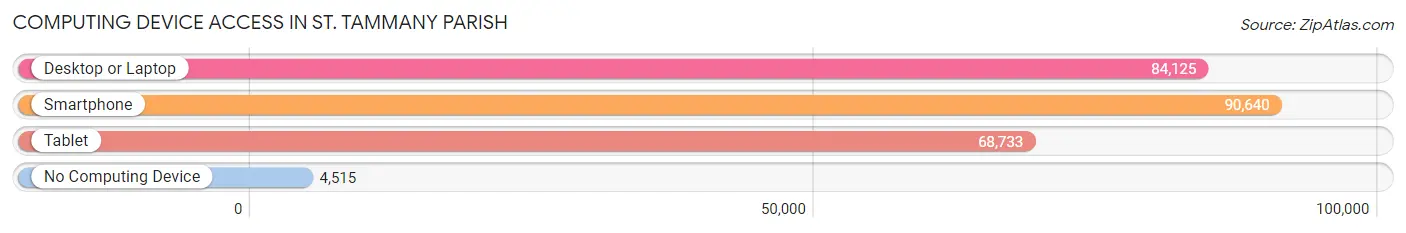
| Device Type | # Households | % Households |
| Desktop or Laptop | 84,125 | 83.1% |
| Smartphone | 90,640 | 89.5% |
| Tablet | 68,733 | 67.9% |
| No Computing Device | 4,515 | 4.5% |
| Total | 101,212 | 100.0% |
Internet Access in St. Tammany Parish
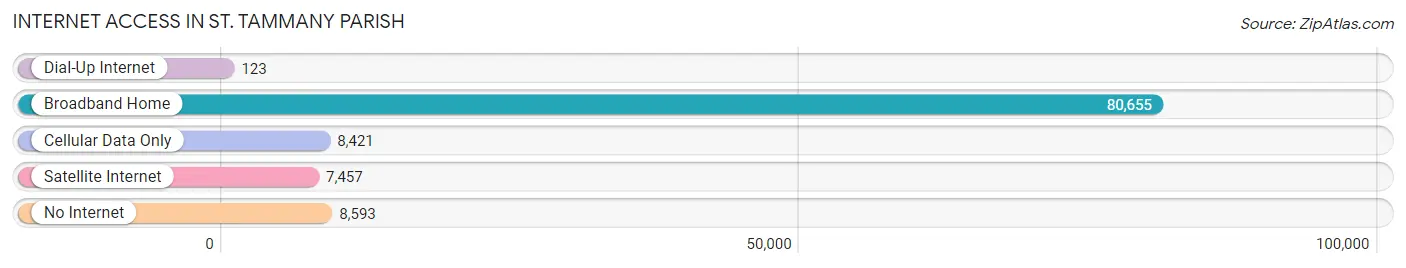
| Internet Type | # Households | % Households |
| Dial-Up Internet | 123 | 0.1% |
| Broadband Home | 80,655 | 79.7% |
| Cellular Data Only | 8,421 | 8.3% |
| Satellite Internet | 7,457 | 7.4% |
| No Internet | 8,593 | 8.5% |
| Total | 101,212 | 100.0% |
St. Tammany Parish Summary
St. Tammany Parish, Louisiana is located in the southeastern corner of the state, just north of Lake Pontchartrain and the city of New Orleans. It is part of the New Orleans-Metairie-Kenner Metropolitan Statistical Area and is the second most populous parish in Louisiana. The parish is named after the legendary Native American chief Tamanend, who was a leader of the Delaware tribe.
Geography
St. Tammany Parish is located in the southeastern corner of Louisiana, just north of Lake Pontchartrain and the city of New Orleans. It is bordered by Washington Parish to the north, Tangipahoa Parish to the east, and St. John the Baptist Parish to the south. The western border of the parish is the Pearl River, which separates it from Mississippi. The parish covers an area of 1,097 square miles and has a population of approximately 250,000 people.
The parish is divided into two distinct regions: the Northshore and the Southshore. The Northshore is located on the northern side of Lake Pontchartrain and is characterized by rolling hills, forests, and wetlands. The Southshore is located on the southern side of the lake and is characterized by flat, marshy land.
Economy
St. Tammany Parish has a diverse economy that is largely driven by tourism, manufacturing, and healthcare. Tourism is a major industry in the parish, with visitors coming to enjoy the area’s natural beauty, outdoor recreation, and cultural attractions. Manufacturing is also a major industry in the parish, with companies such as Northrop Grumman, Lockheed Martin, and Textron producing a variety of products. Healthcare is also a major industry in the parish, with hospitals such as Ochsner Medical Center and St. Tammany Parish Hospital providing a variety of services.
Demographics
As of the 2010 census, St. Tammany Parish had a population of 233,740 people. The racial makeup of the parish was 79.2% White, 15.3% African American, 0.5% Native American, 2.2% Asian, 0.1% Pacific Islander, 1.2% from other races, and 1.6% from two or more races. Hispanic or Latino of any race were 4.3% of the population.
The median income for a household in the parish was $50,945, and the median income for a family was $60,945. The per capita income for the parish was $27,845. About 8.7% of families and 11.2% of the population were below the poverty line, including 15.2% of those under age 18 and 8.2% of those age 65 or over.
St. Tammany Parish is a diverse and vibrant community that is home to a variety of people and industries. The parish is known for its natural beauty, outdoor recreation, and cultural attractions, and is a popular destination for tourists and residents alike. With its diverse economy and population, St. Tammany Parish is an important part of the state of Louisiana.
Common Questions
What is the Total Population of St. Tammany Parish?
Total Population of St. Tammany Parish is 266,168.
What is the Total Male Population of St. Tammany Parish?
Total Male Population of St. Tammany Parish is 130,486.
What is the Total Female Population of St. Tammany Parish?
Total Female Population of St. Tammany Parish is 135,682.
What is the Ratio of Males per 100 Females in St. Tammany Parish?
There are 96.17 Males per 100 Females in St. Tammany Parish.
What is the Ratio of Females per 100 Males in St. Tammany Parish?
There are 103.98 Females per 100 Males in St. Tammany Parish.
What is the Median Population Age in St. Tammany Parish?
Median Population Age in St. Tammany Parish is 40.6 Years.
What is the Average Family Size in St. Tammany Parish
Average Family Size in St. Tammany Parish is 3.1 People.
What is the Average Household Size in St. Tammany Parish
Average Household Size in St. Tammany Parish is 2.6 People.
What is Per Capita Income in St. Tammany Parish?
Per Capita income in St. Tammany Parish is $40,393.
What is the Median Family Income in St. Tammany Parish?
Median Family Income in St. Tammany Parish is $92,115.
What is the Median Household income in St. Tammany Parish?
Median Household Income in St. Tammany Parish is $76,914.
What is Income or Wage Gap in St. Tammany Parish?
Income or Wage Gap in St. Tammany Parish is 37.9%.
Women in St. Tammany Parish earn 62.1 cents for every dollar earned by a man.
What is Family Income Deficit in St. Tammany Parish?
Family Income Deficit in St. Tammany Parish is $10,333.
Families that are below poverty line in St. Tammany Parish earn $10,333 less on average than the poverty threshold level.
What is Inequality or Gini Index in St. Tammany Parish?
Inequality or Gini Index in St. Tammany Parish is 0.46.
How Large is the Labor Force in St. Tammany Parish?
There are 131,782 People in the Labor Forcein in St. Tammany Parish.
What is the Percentage of People in the Labor Force in St. Tammany Parish?
62.5% of People are in the Labor Force in St. Tammany Parish.
What is the Unemployment Rate in St. Tammany Parish?
Unemployment Rate in St. Tammany Parish is 5.2%.