St. Martin Parish, LA
St. Martin Parish Map
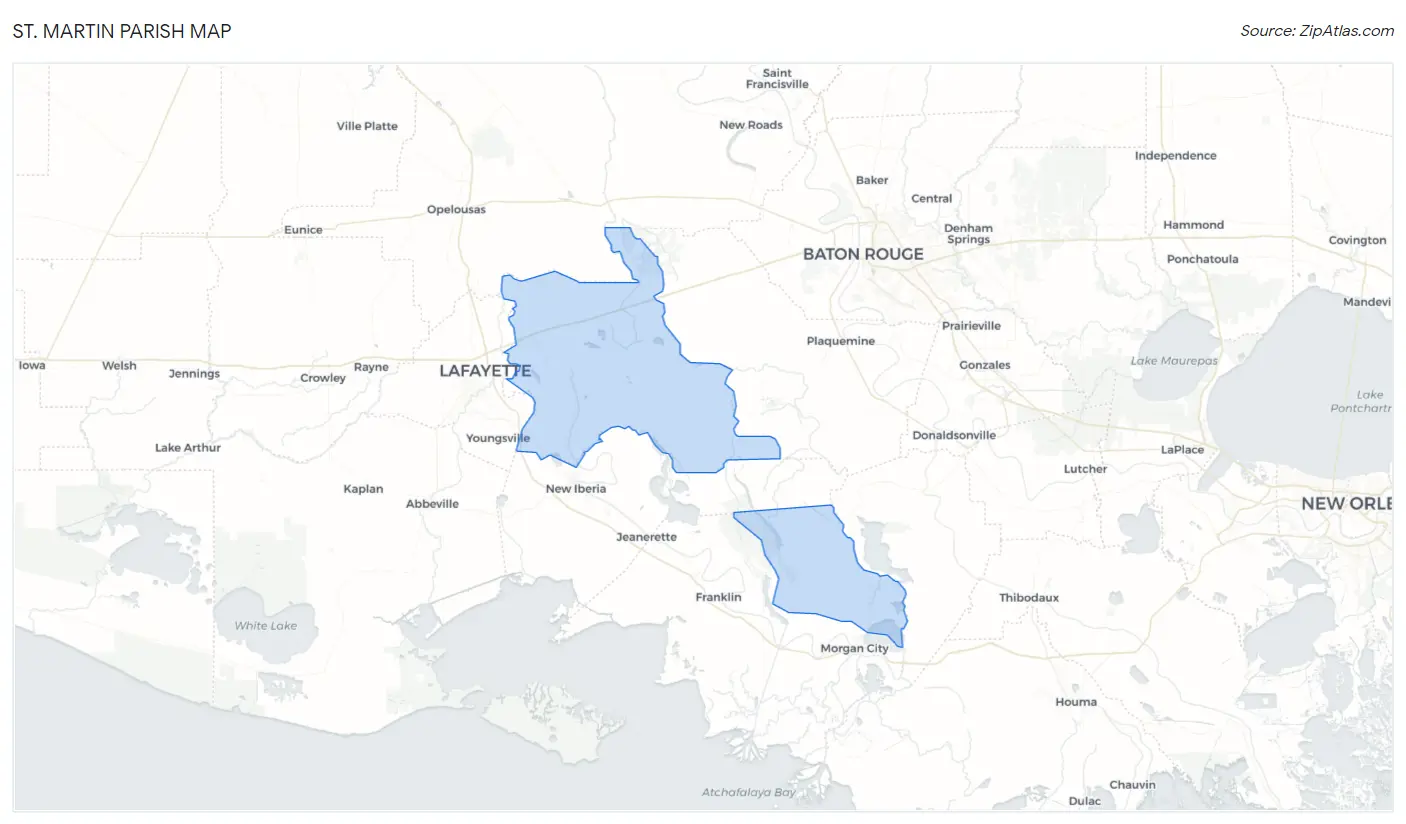
St. Martin Parish Overview
51,856
TOTAL POPULATION
25,442
MALE POPULATION
26,414
FEMALE POPULATION
96.32
MALES / 100 FEMALES
103.82
FEMALES / 100 MALES
39.5
MEDIAN AGE
3.3
AVG FAMILY SIZE
2.6
AVG HOUSEHOLD SIZE
$28,679
PER CAPITA INCOME
$66,417
AVG FAMILY INCOME
$50,806
AVG HOUSEHOLD INCOME
35.4%
WAGE / INCOME GAP [ % ]
64.6¢/ $1
WAGE / INCOME GAP [ $ ]
$9,326
FAMILY INCOME DEFICIT
0.48
INEQUALITY / GINI INDEX
23,510
LABOR FORCE [ PEOPLE ]
57.7%
PERCENT IN LABOR FORCE
6.2%
UNEMPLOYMENT RATE
St. Martin Parish Area Codes
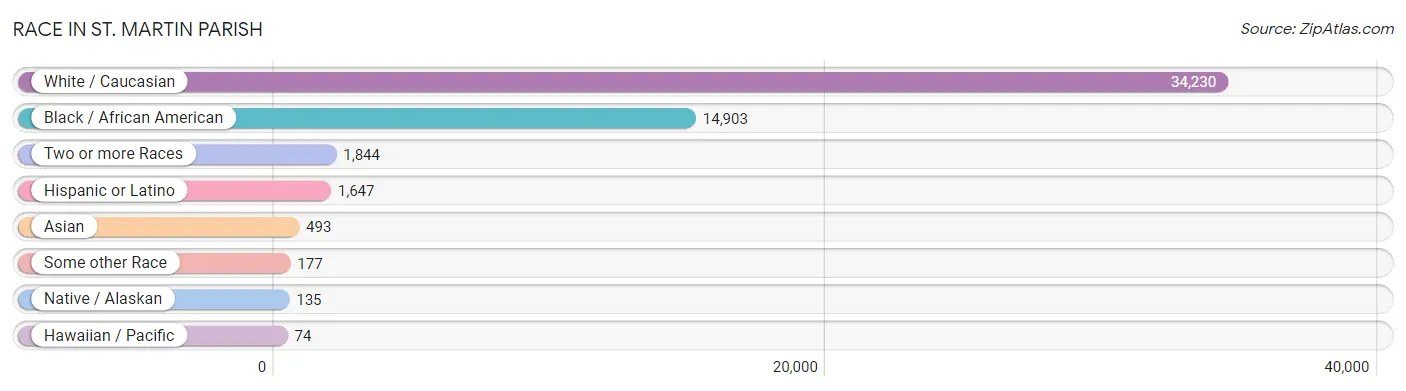
Race in St. Martin Parish
The most populous races in St. Martin Parish are White / Caucasian (34,230 | 66.0%), Black / African American (14,903 | 28.7%), and Two or more Races (1,844 | 3.6%).
| Race | # Population | % Population |
| Asian | 493 | 0.9% |
| Black / African American | 14,903 | 28.7% |
| Hawaiian / Pacific | 74 | 0.1% |
| Hispanic or Latino | 1,647 | 3.2% |
| Native / Alaskan | 135 | 0.3% |
| White / Caucasian | 34,230 | 66.0% |
| Two or more Races | 1,844 | 3.6% |
| Some other Race | 177 | 0.3% |
| Total | 51,856 | 100.0% |
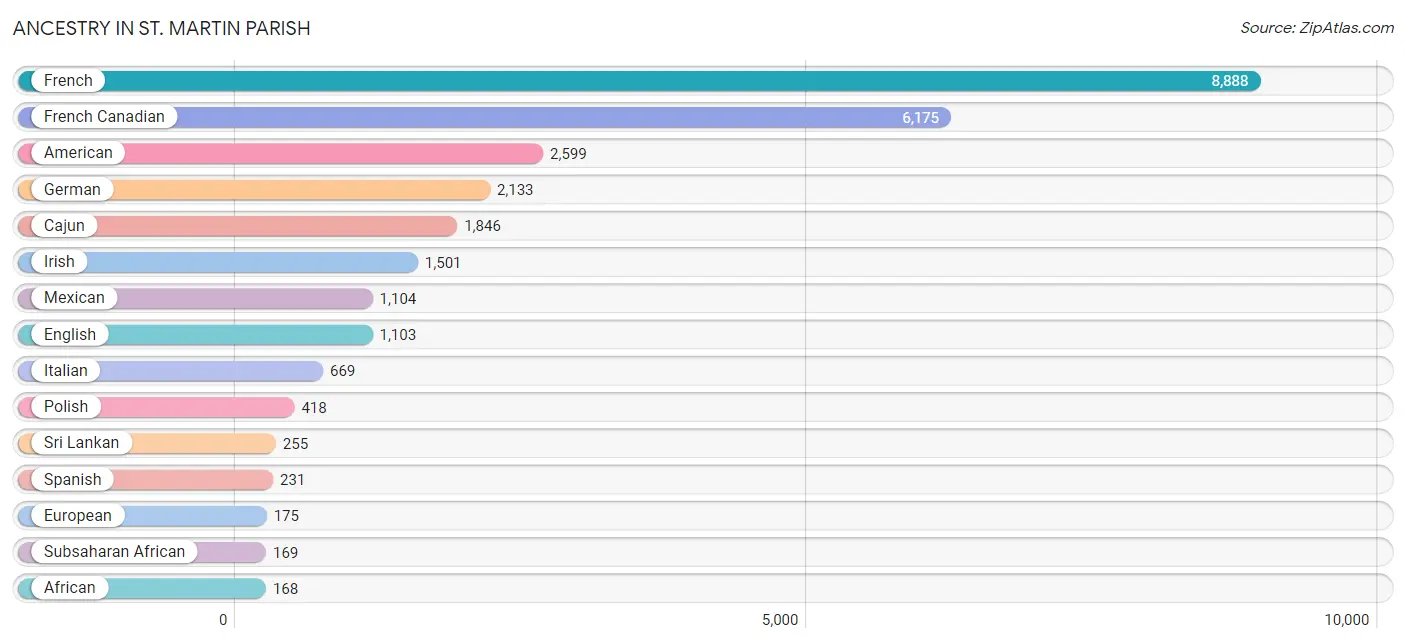
Ancestry in St. Martin Parish
The most populous ancestries reported in St. Martin Parish are French (8,888 | 17.1%), French Canadian (6,175 | 11.9%), American (2,599 | 5.0%), German (2,133 | 4.1%), and Cajun (1,846 | 3.6%), together accounting for 41.7% of all St. Martin Parish residents.
| Ancestry | # Population | % Population |
| African | 168 | 0.3% |
| American | 2,599 | 5.0% |
| Apache | 19 | 0.0% |
| Bhutanese | 15 | 0.0% |
| Blackfeet | 30 | 0.1% |
| British | 98 | 0.2% |
| Bulgarian | 14 | 0.0% |
| Burmese | 11 | 0.0% |
| Cajun | 1,846 | 3.6% |
| Canadian | 54 | 0.1% |
| Central American | 162 | 0.3% |
| Central American Indian | 16 | 0.0% |
| Cherokee | 136 | 0.3% |
| Choctaw | 23 | 0.0% |
| Costa Rican | 9 | 0.0% |
| Cuban | 36 | 0.1% |
| Czech | 33 | 0.1% |
| Czechoslovakian | 37 | 0.1% |
| Dutch | 12 | 0.0% |
| English | 1,103 | 2.1% |
| European | 175 | 0.3% |
| French | 8,888 | 17.1% |
| French Canadian | 6,175 | 11.9% |
| German | 2,133 | 4.1% |
| German Russian | 7 | 0.0% |
| Guatemalan | 101 | 0.2% |
| Haitian | 125 | 0.2% |
| Honduran | 40 | 0.1% |
| Houma | 36 | 0.1% |
| Hungarian | 21 | 0.0% |
| Indian (Asian) | 144 | 0.3% |
| Iranian | 13 | 0.0% |
| Irish | 1,501 | 2.9% |
| Italian | 669 | 1.3% |
| Korean | 19 | 0.0% |
| Malaysian | 101 | 0.2% |
| Mexican | 1,104 | 2.1% |
| Navajo | 26 | 0.1% |
| Nigerian | 1 | 0.0% |
| Norwegian | 14 | 0.0% |
| Polish | 418 | 0.8% |
| Portuguese | 29 | 0.1% |
| Puerto Rican | 43 | 0.1% |
| Russian | 144 | 0.3% |
| Salvadoran | 12 | 0.0% |
| Samoan | 74 | 0.1% |
| Scandinavian | 26 | 0.1% |
| Scotch-Irish | 114 | 0.2% |
| Scottish | 93 | 0.2% |
| Serbian | 8 | 0.0% |
| Spaniard | 44 | 0.1% |
| Spanish | 231 | 0.4% |
| Sri Lankan | 255 | 0.5% |
| Subsaharan African | 169 | 0.3% |
| Swedish | 31 | 0.1% |
| Swiss | 13 | 0.0% |
| Thai | 25 | 0.1% |
| Tongan | 51 | 0.1% |
| Welsh | 78 | 0.2% | View All 59 Rows |
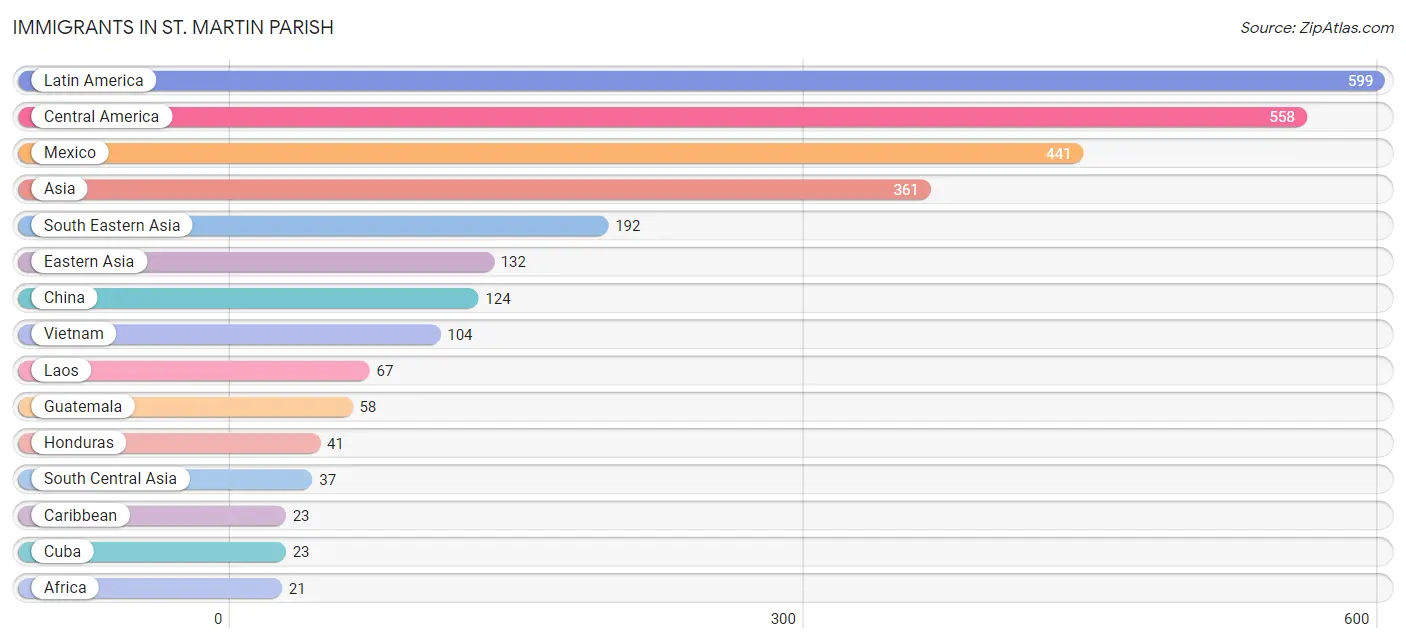
Immigrants in St. Martin Parish
The most numerous immigrant groups reported in St. Martin Parish came from Latin America (599 | 1.2%), Central America (558 | 1.1%), Mexico (441 | 0.9%), Asia (361 | 0.7%), and South Eastern Asia (192 | 0.4%), together accounting for 4.2% of all St. Martin Parish residents.
| Immigration Origin | # Population | % Population |
| Africa | 21 | 0.0% |
| Asia | 361 | 0.7% |
| Bangladesh | 20 | 0.0% |
| Caribbean | 23 | 0.0% |
| Central America | 558 | 1.1% |
| Chile | 9 | 0.0% |
| China | 124 | 0.2% |
| Colombia | 9 | 0.0% |
| Costa Rica | 9 | 0.0% |
| Cuba | 23 | 0.0% |
| Eastern Asia | 132 | 0.3% |
| Eastern Europe | 1 | 0.0% |
| El Salvador | 9 | 0.0% |
| Europe | 18 | 0.0% |
| Germany | 17 | 0.0% |
| Guatemala | 58 | 0.1% |
| Honduras | 41 | 0.1% |
| Hungary | 1 | 0.0% |
| India | 7 | 0.0% |
| Iran | 10 | 0.0% |
| Japan | 7 | 0.0% |
| Korea | 1 | 0.0% |
| Laos | 67 | 0.1% |
| Latin America | 599 | 1.2% |
| Mexico | 441 | 0.9% |
| Nigeria | 21 | 0.0% |
| Philippines | 21 | 0.0% |
| South America | 18 | 0.0% |
| South Central Asia | 37 | 0.1% |
| South Eastern Asia | 192 | 0.4% |
| Taiwan | 5 | 0.0% |
| Vietnam | 104 | 0.2% |
| Western Africa | 21 | 0.0% |
| Western Europe | 17 | 0.0% | View All 34 Rows |
Sex and Age in St. Martin Parish
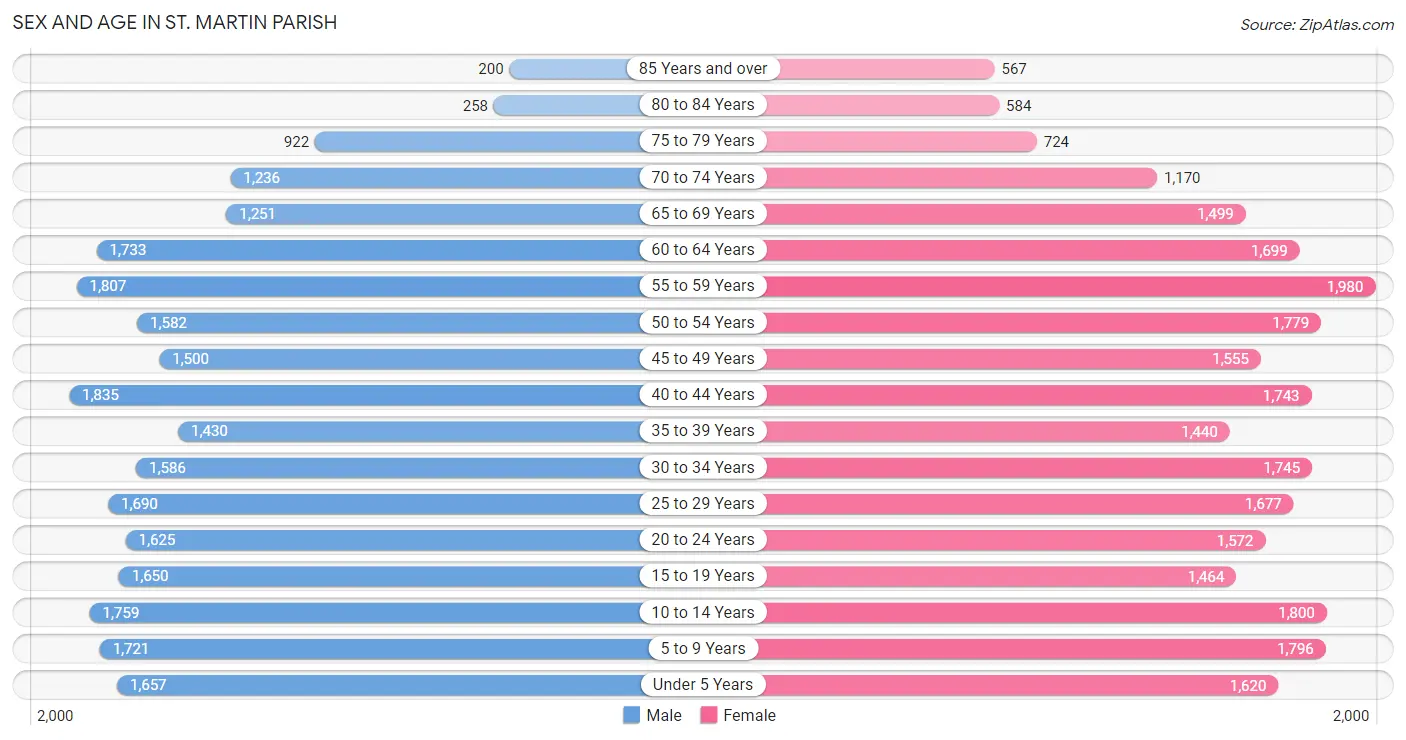
Sex and Age in St. Martin Parish
The most populous age groups in St. Martin Parish are 40 to 44 Years (1,835 | 7.2%) for men and 55 to 59 Years (1,980 | 7.5%) for women.
| Age Bracket | Male | Female |
| Under 5 Years | 1,657 (6.5%) | 1,620 (6.1%) |
| 5 to 9 Years | 1,721 (6.8%) | 1,796 (6.8%) |
| 10 to 14 Years | 1,759 (6.9%) | 1,800 (6.8%) |
| 15 to 19 Years | 1,650 (6.5%) | 1,464 (5.5%) |
| 20 to 24 Years | 1,625 (6.4%) | 1,572 (5.9%) |
| 25 to 29 Years | 1,690 (6.6%) | 1,677 (6.4%) |
| 30 to 34 Years | 1,586 (6.2%) | 1,745 (6.6%) |
| 35 to 39 Years | 1,430 (5.6%) | 1,440 (5.4%) |
| 40 to 44 Years | 1,835 (7.2%) | 1,743 (6.6%) |
| 45 to 49 Years | 1,500 (5.9%) | 1,555 (5.9%) |
| 50 to 54 Years | 1,582 (6.2%) | 1,779 (6.7%) |
| 55 to 59 Years | 1,807 (7.1%) | 1,980 (7.5%) |
| 60 to 64 Years | 1,733 (6.8%) | 1,699 (6.4%) |
| 65 to 69 Years | 1,251 (4.9%) | 1,499 (5.7%) |
| 70 to 74 Years | 1,236 (4.9%) | 1,170 (4.4%) |
| 75 to 79 Years | 922 (3.6%) | 724 (2.7%) |
| 80 to 84 Years | 258 (1.0%) | 584 (2.2%) |
| 85 Years and over | 200 (0.8%) | 567 (2.1%) |
| Total | 25,442 (100.0%) | 26,414 (100.0%) |
Families and Households in St. Martin Parish
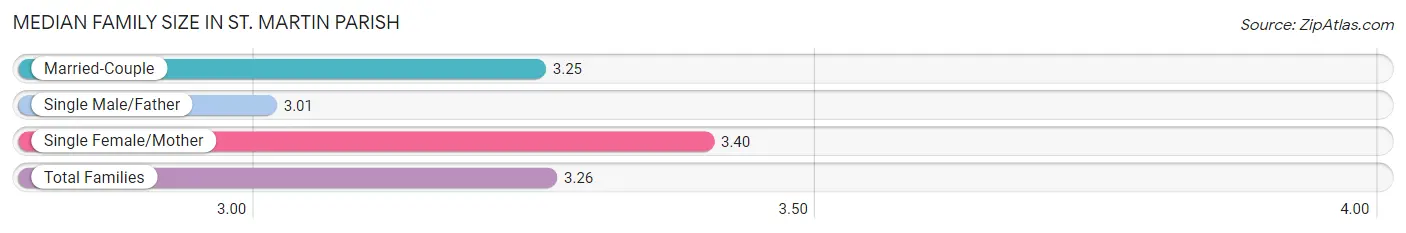
Median Family Size in St. Martin Parish
The median family size in St. Martin Parish is 3.26 persons per family, with single female/mother families (2,743 | 21.2%) accounting for the largest median family size of 3.4 persons per family. On the other hand, single male/father families (1,297 | 10.0%) represent the smallest median family size with 3.01 persons per family.
| Family Type | # Families | Family Size |
| Married-Couple | 8,904 (68.8%) | 3.25 |
| Single Male/Father | 1,297 (10.0%) | 3.01 |
| Single Female/Mother | 2,743 (21.2%) | 3.40 |
| Total Families | 12,944 (100.0%) | 3.26 |
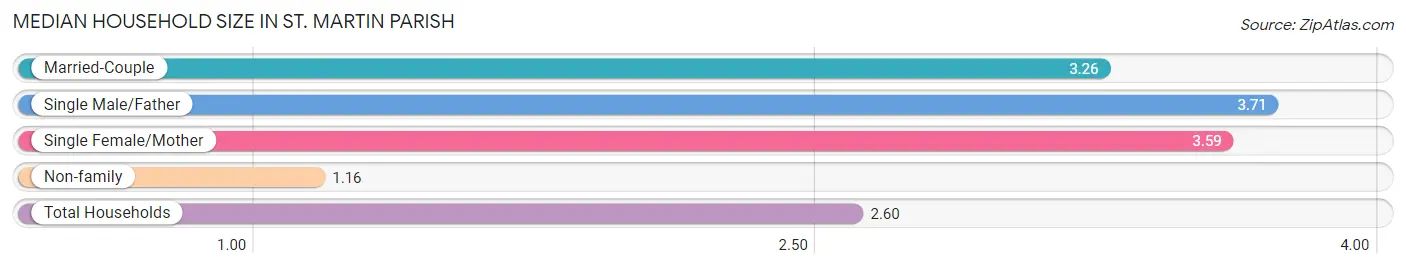
Median Household Size in St. Martin Parish
The median household size in St. Martin Parish is 2.60 persons per household, with single male/father households (1,297 | 6.5%) accounting for the largest median household size of 3.71 persons per household. non-family households (6,930 | 34.9%) represent the smallest median household size with 1.16 persons per household.
| Household Type | # Households | Household Size |
| Married-Couple | 8,904 (44.8%) | 3.26 |
| Single Male/Father | 1,297 (6.5%) | 3.71 |
| Single Female/Mother | 2,743 (13.8%) | 3.59 |
| Non-family | 6,930 (34.9%) | 1.16 |
| Total Households | 19,874 (100.0%) | 2.60 |
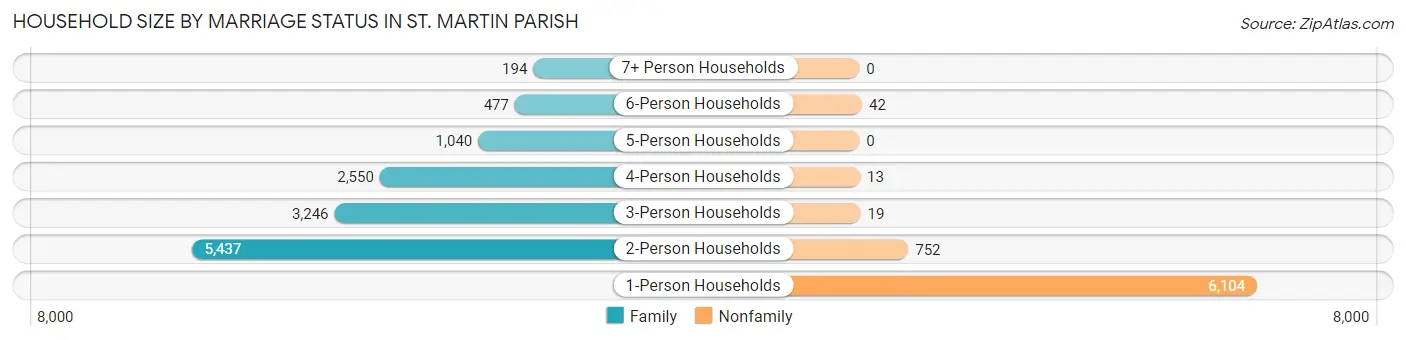
Household Size by Marriage Status in St. Martin Parish
Out of a total of 19,874 households in St. Martin Parish, 12,944 (65.1%) are family households, while 6,930 (34.9%) are nonfamily households. The most numerous type of family households are 2-person households, comprising 5,437, and the most common type of nonfamily households are 1-person households, comprising 6,104.
| Household Size | Family Households | Nonfamily Households |
| 1-Person Households | - | 6,104 (30.7%) |
| 2-Person Households | 5,437 (27.4%) | 752 (3.8%) |
| 3-Person Households | 3,246 (16.3%) | 19 (0.1%) |
| 4-Person Households | 2,550 (12.8%) | 13 (0.1%) |
| 5-Person Households | 1,040 (5.2%) | 0 (0.0%) |
| 6-Person Households | 477 (2.4%) | 42 (0.2%) |
| 7+ Person Households | 194 (1.0%) | 0 (0.0%) |
| Total | 12,944 (65.1%) | 6,930 (34.9%) |
Female Fertility in St. Martin Parish
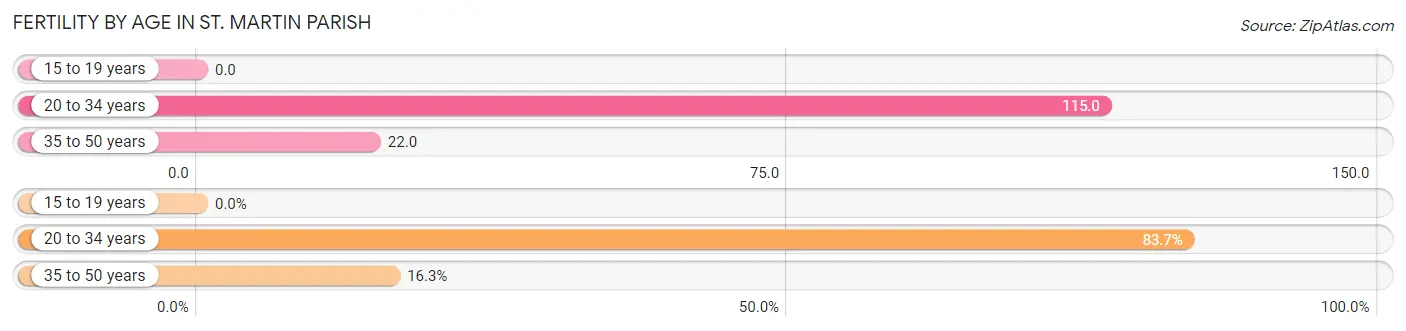
Fertility by Age in St. Martin Parish
Average fertility rate in St. Martin Parish is 59.0 births per 1,000 women. Women in the age bracket of 20 to 34 years have the highest fertility rate with 115.0 births per 1,000 women. Women in the age bracket of 20 to 34 years acount for 83.7% of all women with births.
| Age Bracket | Women with Births | Births / 1,000 Women |
| 15 to 19 years | 0 (0.0%) | 0.0 |
| 20 to 34 years | 575 (83.7%) | 115.0 |
| 35 to 50 years | 112 (16.3%) | 22.0 |
| Total | 687 (100.0%) | 59.0 |
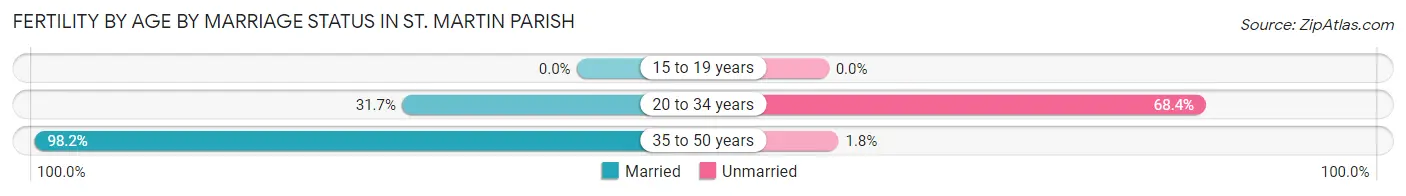
Fertility by Age by Marriage Status in St. Martin Parish
42.5% of women with births (687) in St. Martin Parish are married. The highest percentage of unmarried women with births falls into 20 to 34 years age bracket with 68.3% of them unmarried at the time of birth, while the lowest percentage of unmarried women with births belong to 35 to 50 years age bracket with 1.8% of them unmarried.
| Age Bracket | Married | Unmarried |
| 15 to 19 years | 0 (0.0%) | 0 (0.0%) |
| 20 to 34 years | 182 (31.7%) | 393 (68.3%) |
| 35 to 50 years | 110 (98.2%) | 2 (1.8%) |
| Total | 292 (42.5%) | 395 (57.5%) |
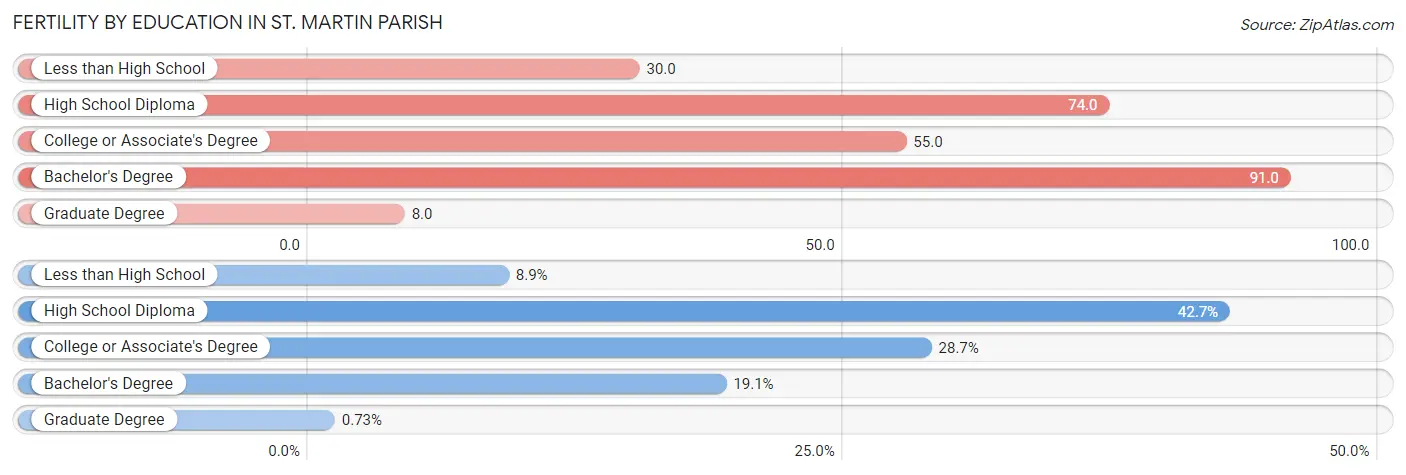
Fertility by Education in St. Martin Parish
Average fertility rate in St. Martin Parish is 59.0 births per 1,000 women. Women with the education attainment of bachelor's degree have the highest fertility rate of 91.0 births per 1,000 women, while women with the education attainment of graduate degree have the lowest fertility at 8.0 births per 1,000 women. Women with the education attainment of high school diploma represent 42.6% of all women with births.
| Educational Attainment | Women with Births | Births / 1,000 Women |
| Less than High School | 61 (8.9%) | 30.0 |
| High School Diploma | 293 (42.6%) | 74.0 |
| College or Associate's Degree | 197 (28.7%) | 55.0 |
| Bachelor's Degree | 131 (19.1%) | 91.0 |
| Graduate Degree | 5 (0.7%) | 8.0 |
| Total | 687 (100.0%) | 59.0 |
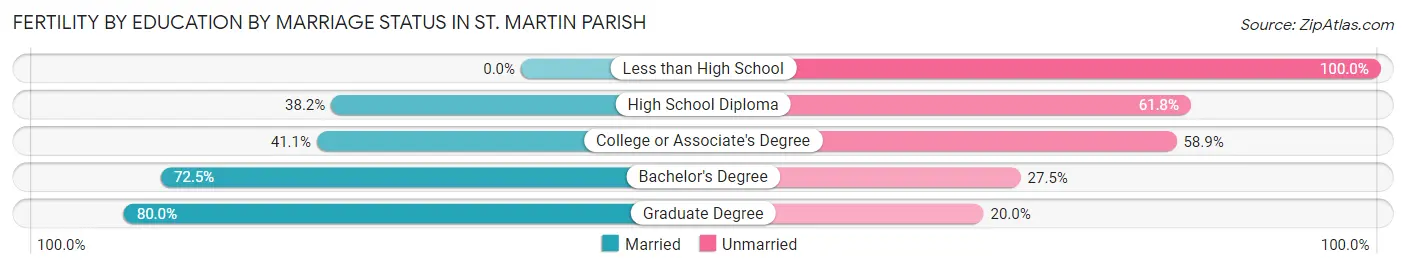
Fertility by Education by Marriage Status in St. Martin Parish
57.5% of women with births in St. Martin Parish are unmarried. Women with the educational attainment of graduate degree are most likely to be married with 80.0% of them married at childbirth, while women with the educational attainment of less than high school are least likely to be married with 100.0% of them unmarried at childbirth.
| Educational Attainment | Married | Unmarried |
| Less than High School | 0 (0.0%) | 61 (100.0%) |
| High School Diploma | 112 (38.2%) | 181 (61.8%) |
| College or Associate's Degree | 81 (41.1%) | 116 (58.9%) |
| Bachelor's Degree | 95 (72.5%) | 36 (27.5%) |
| Graduate Degree | 4 (80.0%) | 1 (20.0%) |
| Total | 292 (42.5%) | 395 (57.5%) |
Income in St. Martin Parish
Income Overview in St. Martin Parish
Per Capita Income in St. Martin Parish is $28,679, while median incomes of families and households are $66,417 and $50,806 respectively.
| Characteristic | Number | Measure |
| Per Capita Income | 51,856 | $28,679 |
| Median Family Income | 12,944 | $66,417 |
| Mean Family Income | 12,944 | $87,409 |
| Median Household Income | 19,874 | $50,806 |
| Mean Household Income | 19,874 | $71,266 |
| Income Deficit | 12,944 | $9,326 |
| Wage / Income Gap (%) | 51,856 | 35.37% |
| Wage / Income Gap ($) | 51,856 | 64.63¢ per $1 |
| Gini / Inequality Index | 51,856 | 0.48 |
Earnings by Sex in St. Martin Parish
Average Earnings in St. Martin Parish are $36,436, $47,092 for men and $30,434 for women, a difference of 35.4%.
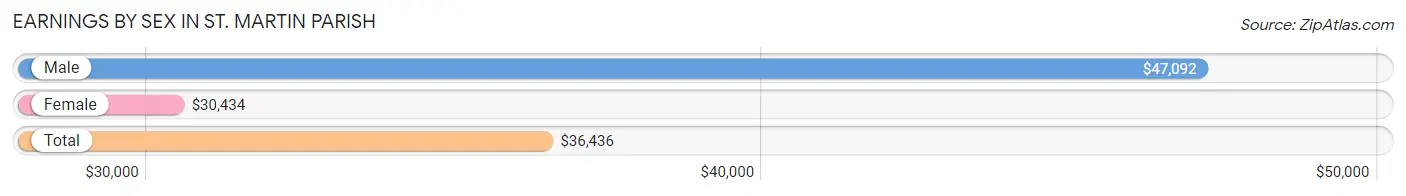
| Sex | Number | Average Earnings |
| Male | 12,669 (52.4%) | $47,092 |
| Female | 11,504 (47.6%) | $30,434 |
| Total | 24,173 (100.0%) | $36,436 |
Earnings by Sex by Income Bracket in St. Martin Parish
The most common earnings brackets in St. Martin Parish are $75,000 to $99,999 for men (1,893 | 14.9%) and $30,000 to $34,999 for women (1,101 | 9.6%).
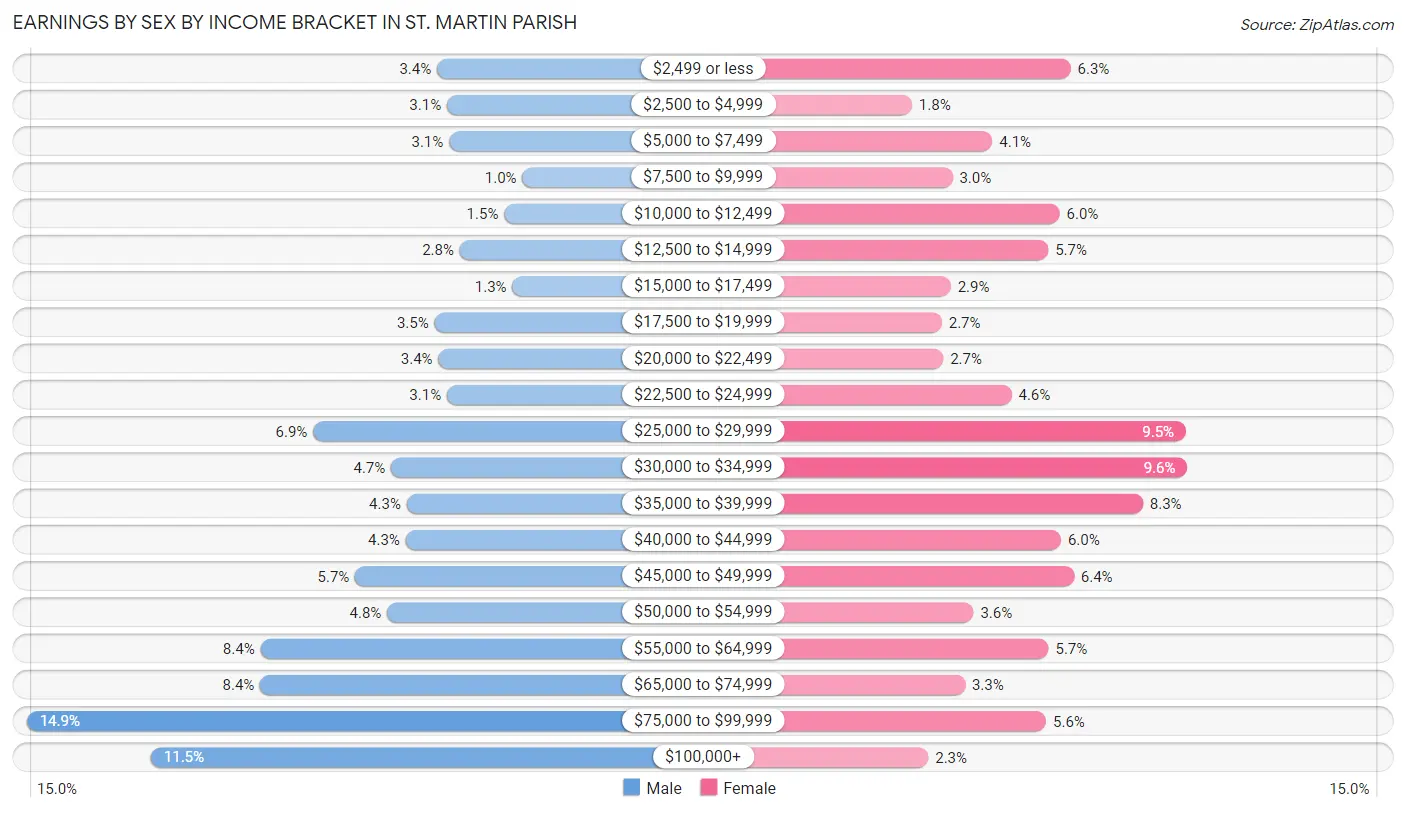
| Income | Male | Female |
| $2,499 or less | 432 (3.4%) | 724 (6.3%) |
| $2,500 to $4,999 | 396 (3.1%) | 210 (1.8%) |
| $5,000 to $7,499 | 389 (3.1%) | 471 (4.1%) |
| $7,500 to $9,999 | 128 (1.0%) | 342 (3.0%) |
| $10,000 to $12,499 | 193 (1.5%) | 688 (6.0%) |
| $12,500 to $14,999 | 351 (2.8%) | 651 (5.7%) |
| $15,000 to $17,499 | 164 (1.3%) | 336 (2.9%) |
| $17,500 to $19,999 | 441 (3.5%) | 307 (2.7%) |
| $20,000 to $22,499 | 427 (3.4%) | 312 (2.7%) |
| $22,500 to $24,999 | 397 (3.1%) | 533 (4.6%) |
| $25,000 to $29,999 | 873 (6.9%) | 1,096 (9.5%) |
| $30,000 to $34,999 | 596 (4.7%) | 1,101 (9.6%) |
| $35,000 to $39,999 | 540 (4.3%) | 957 (8.3%) |
| $40,000 to $44,999 | 544 (4.3%) | 692 (6.0%) |
| $45,000 to $49,999 | 723 (5.7%) | 734 (6.4%) |
| $50,000 to $54,999 | 610 (4.8%) | 409 (3.6%) |
| $55,000 to $64,999 | 1,060 (8.4%) | 652 (5.7%) |
| $65,000 to $74,999 | 1,062 (8.4%) | 382 (3.3%) |
| $75,000 to $99,999 | 1,893 (14.9%) | 644 (5.6%) |
| $100,000+ | 1,450 (11.5%) | 263 (2.3%) |
| Total | 12,669 (100.0%) | 11,504 (100.0%) |
Earnings by Sex by Educational Attainment in St. Martin Parish
Average earnings in St. Martin Parish are $52,814 for men and $33,716 for women, a difference of 36.2%. Men with an educational attainment of bachelor's degree enjoy the highest average annual earnings of $84,674, while those with less than high school education earn the least with $33,887. Women with an educational attainment of graduate degree earn the most with the average annual earnings of $59,484, while those with less than high school education have the smallest earnings of $14,661.
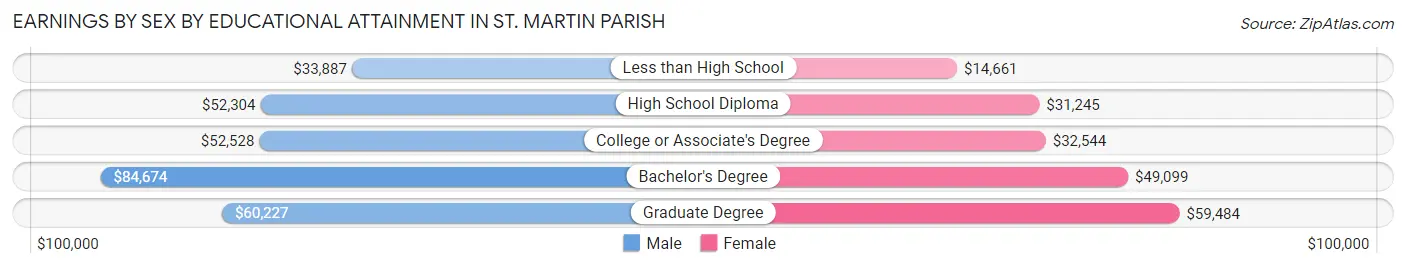
| Educational Attainment | Male Income | Female Income |
| Less than High School | $33,887 | $14,661 |
| High School Diploma | $52,304 | $31,245 |
| College or Associate's Degree | $52,528 | $32,544 |
| Bachelor's Degree | $84,674 | $49,099 |
| Graduate Degree | $60,227 | $59,484 |
| Total | $52,814 | $33,716 |
Family Income in St. Martin Parish
Family Income Brackets in St. Martin Parish
According to the St. Martin Parish family income data, there are 2,356 families falling into the $100,000 to $149,999 income range, which is the most common income bracket and makes up 18.2% of all families. Conversely, the $10,000 to $14,999 income bracket is the least frequent group with only 388 families (3.0%) belonging to this category.
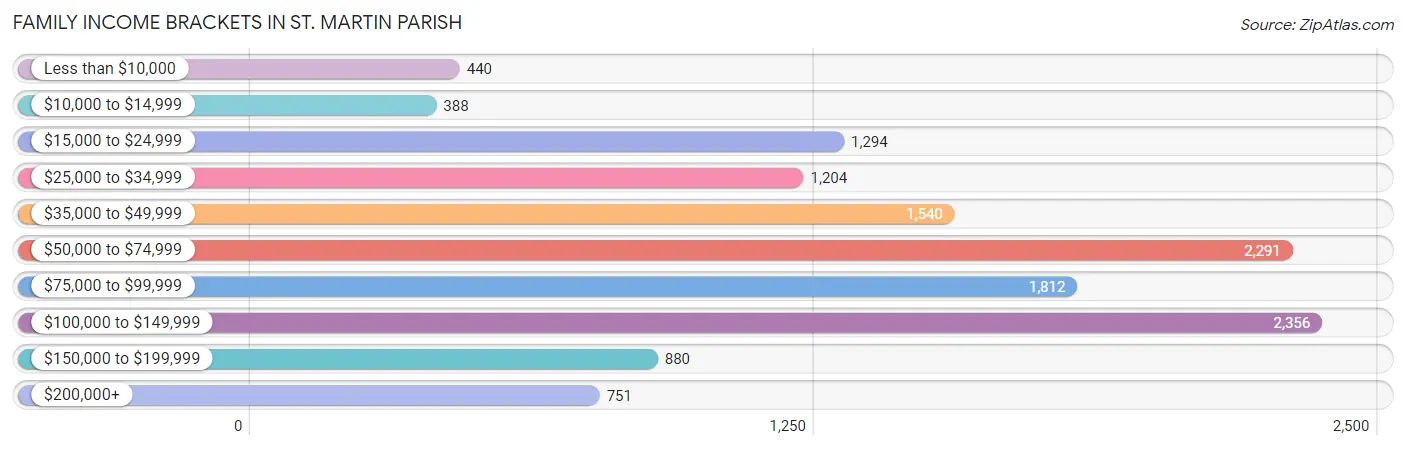
| Income Bracket | # Families | % Families |
| Less than $10,000 | 440 | 3.4% |
| $10,000 to $14,999 | 388 | 3.0% |
| $15,000 to $24,999 | 1,294 | 10.0% |
| $25,000 to $34,999 | 1,204 | 9.3% |
| $35,000 to $49,999 | 1,540 | 11.9% |
| $50,000 to $74,999 | 2,291 | 17.7% |
| $75,000 to $99,999 | 1,812 | 14.0% |
| $100,000 to $149,999 | 2,356 | 18.2% |
| $150,000 to $199,999 | 880 | 6.8% |
| $200,000+ | 751 | 5.8% |
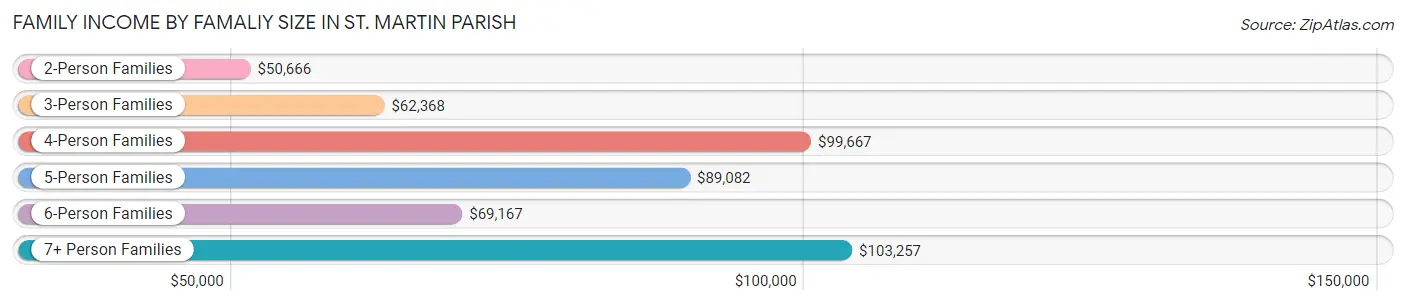
Family Income by Famaliy Size in St. Martin Parish
7+ person families (157 | 1.2%) account for the highest median family income in St. Martin Parish with $103,257 per family, while 2-person families (6,057 | 46.8%) have the highest median income of $25,333 per family member.
| Income Bracket | # Families | Median Income |
| 2-Person Families | 6,057 (46.8%) | $50,666 |
| 3-Person Families | 2,926 (22.6%) | $62,368 |
| 4-Person Families | 2,480 (19.2%) | $99,667 |
| 5-Person Families | 938 (7.2%) | $89,082 |
| 6-Person Families | 386 (3.0%) | $69,167 |
| 7+ Person Families | 157 (1.2%) | $103,257 |
| Total | 12,944 (100.0%) | $66,417 |
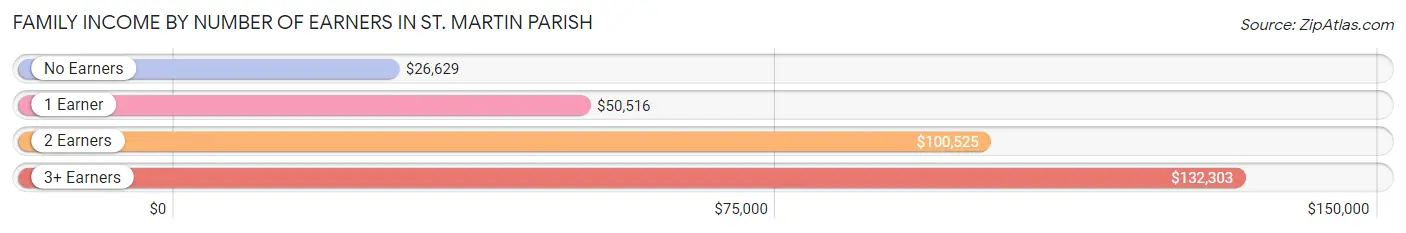
Family Income by Number of Earners in St. Martin Parish
The median family income in St. Martin Parish is $66,417, with families comprising 3+ earners (1,131) having the highest median family income of $132,303, while families with no earners (2,674) have the lowest median family income of $26,629, accounting for 8.7% and 20.7% of families, respectively.
| Number of Earners | # Families | Median Income |
| No Earners | 2,674 (20.7%) | $26,629 |
| 1 Earner | 4,539 (35.1%) | $50,516 |
| 2 Earners | 4,600 (35.5%) | $100,525 |
| 3+ Earners | 1,131 (8.7%) | $132,303 |
| Total | 12,944 (100.0%) | $66,417 |
Household Income in St. Martin Parish
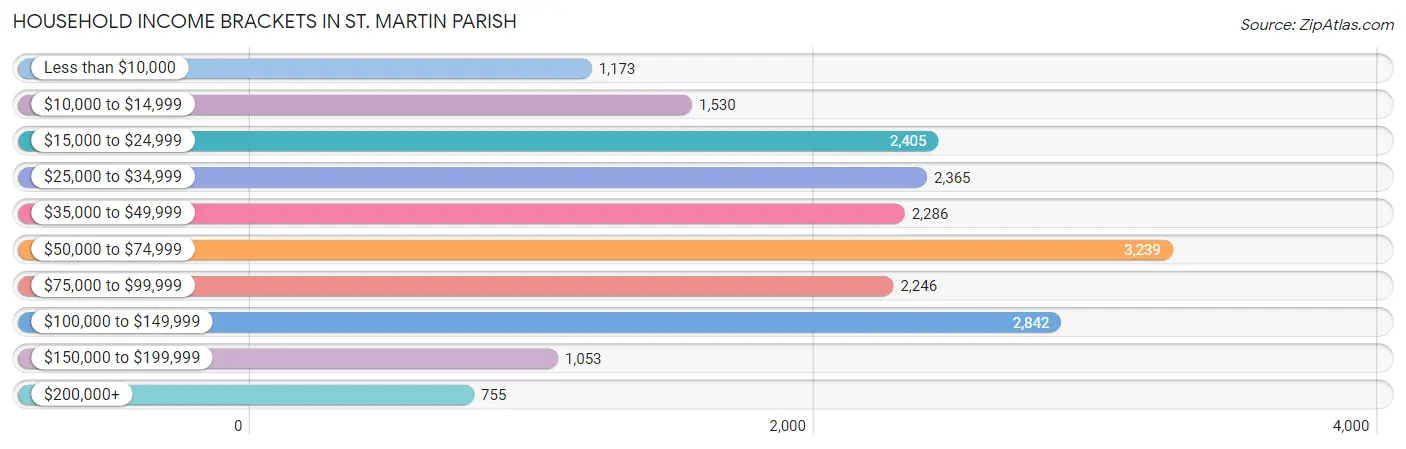
Household Income Brackets in St. Martin Parish
With 3,239 households falling in the category, the $50,000 to $74,999 income range is the most frequent in St. Martin Parish, accounting for 16.3% of all households. In contrast, only 755 households (3.8%) fall into the $200,000+ income bracket, making it the least populous group.
| Income Bracket | # Households | % Households |
| Less than $10,000 | 1,173 | 5.9% |
| $10,000 to $14,999 | 1,530 | 7.7% |
| $15,000 to $24,999 | 2,405 | 12.1% |
| $25,000 to $34,999 | 2,365 | 11.9% |
| $35,000 to $49,999 | 2,286 | 11.5% |
| $50,000 to $74,999 | 3,239 | 16.3% |
| $75,000 to $99,999 | 2,246 | 11.3% |
| $100,000 to $149,999 | 2,842 | 14.3% |
| $150,000 to $199,999 | 1,053 | 5.3% |
| $200,000+ | 755 | 3.8% |
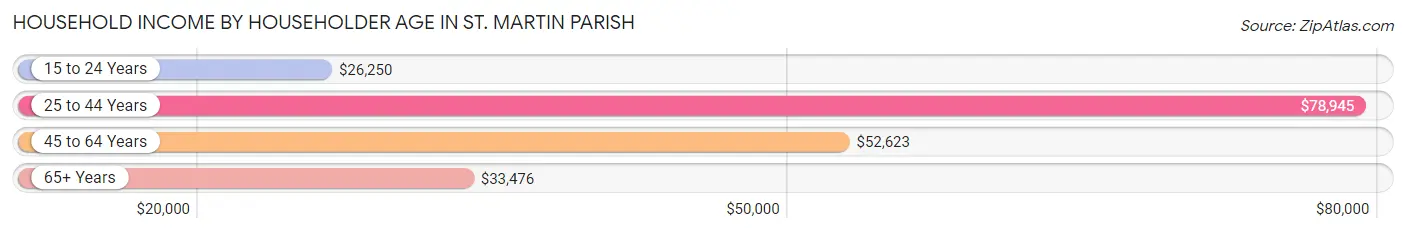
Household Income by Householder Age in St. Martin Parish
The median household income in St. Martin Parish is $50,806, with the highest median household income of $78,945 found in the 25 to 44 years age bracket for the primary householder. A total of 6,053 households (30.5%) fall into this category. Meanwhile, the 15 to 24 years age bracket for the primary householder has the lowest median household income of $26,250, with 467 households (2.4%) in this group.
| Income Bracket | # Households | Median Income |
| 15 to 24 Years | 467 (2.4%) | $26,250 |
| 25 to 44 Years | 6,053 (30.5%) | $78,945 |
| 45 to 64 Years | 7,916 (39.8%) | $52,623 |
| 65+ Years | 5,438 (27.4%) | $33,476 |
| Total | 19,874 (100.0%) | $50,806 |
Poverty in St. Martin Parish
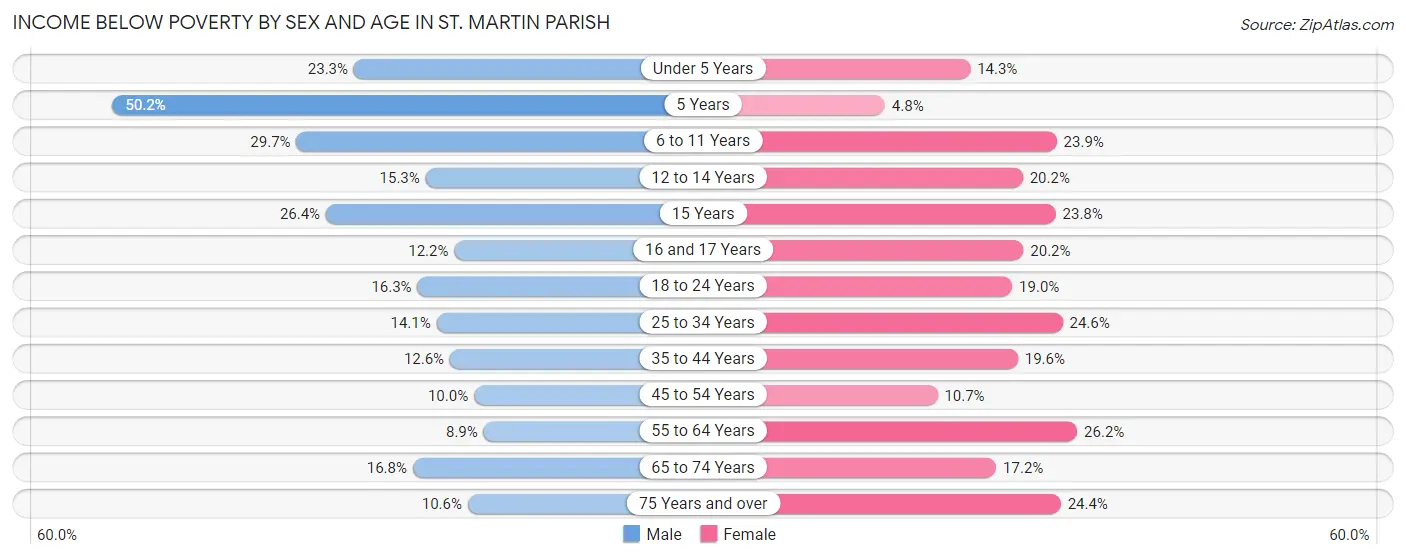
Income Below Poverty by Sex and Age in St. Martin Parish
With 15.2% poverty level for males and 19.9% for females among the residents of St. Martin Parish, 5 year old males and 55 to 64 year old females are the most vulnerable to poverty, with 116 males (50.2%) and 961 females (26.2%) in their respective age groups living below the poverty level.
| Age Bracket | Male | Female |
| Under 5 Years | 339 (23.3%) | 218 (14.3%) |
| 5 Years | 116 (50.2%) | 27 (4.8%) |
| 6 to 11 Years | 580 (29.7%) | 442 (23.9%) |
| 12 to 14 Years | 194 (15.3%) | 239 (20.2%) |
| 15 Years | 78 (26.4%) | 110 (23.8%) |
| 16 and 17 Years | 95 (12.1%) | 110 (20.2%) |
| 18 to 24 Years | 355 (16.3%) | 385 (19.0%) |
| 25 to 34 Years | 462 (14.1%) | 841 (24.6%) |
| 35 to 44 Years | 410 (12.6%) | 624 (19.6%) |
| 45 to 54 Years | 306 (10.0%) | 355 (10.6%) |
| 55 to 64 Years | 313 (8.9%) | 961 (26.2%) |
| 65 to 74 Years | 414 (16.8%) | 457 (17.2%) |
| 75 Years and over | 145 (10.6%) | 443 (24.4%) |
| Total | 3,807 (15.2%) | 5,212 (19.9%) |
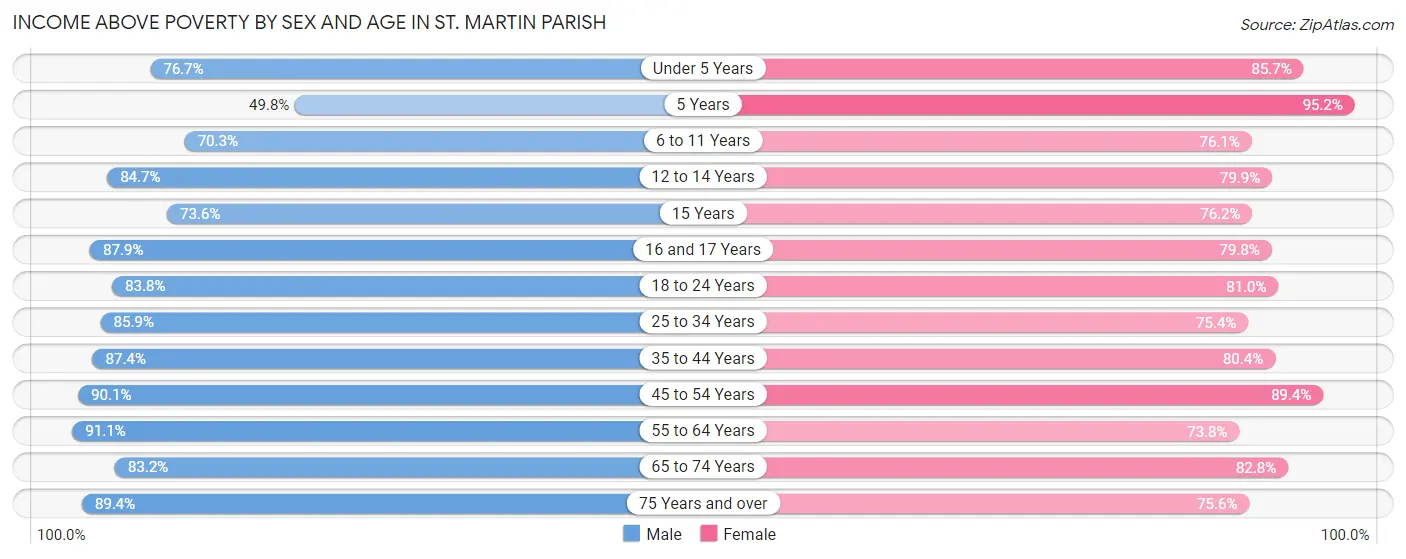
Income Above Poverty by Sex and Age in St. Martin Parish
According to the poverty statistics in St. Martin Parish, males aged 55 to 64 years and females aged 5 years are the age groups that are most secure financially, with 91.1% of males and 95.2% of females in these age groups living above the poverty line.
| Age Bracket | Male | Female |
| Under 5 Years | 1,114 (76.7%) | 1,307 (85.7%) |
| 5 Years | 115 (49.8%) | 536 (95.2%) |
| 6 to 11 Years | 1,371 (70.3%) | 1,405 (76.1%) |
| 12 to 14 Years | 1,071 (84.7%) | 947 (79.8%) |
| 15 Years | 217 (73.6%) | 352 (76.2%) |
| 16 and 17 Years | 687 (87.8%) | 434 (79.8%) |
| 18 to 24 Years | 1,829 (83.8%) | 1,645 (81.0%) |
| 25 to 34 Years | 2,809 (85.9%) | 2,581 (75.4%) |
| 35 to 44 Years | 2,837 (87.4%) | 2,559 (80.4%) |
| 45 to 54 Years | 2,770 (90.0%) | 2,979 (89.3%) |
| 55 to 64 Years | 3,210 (91.1%) | 2,706 (73.8%) |
| 65 to 74 Years | 2,055 (83.2%) | 2,201 (82.8%) |
| 75 Years and over | 1,218 (89.4%) | 1,374 (75.6%) |
| Total | 21,303 (84.8%) | 21,026 (80.1%) |
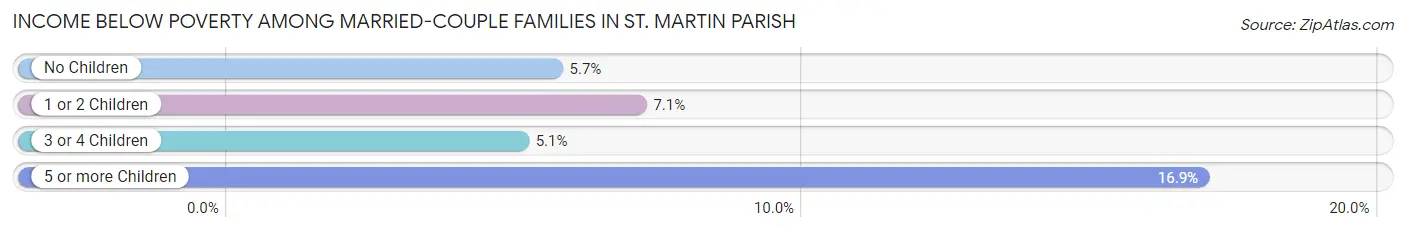
Income Below Poverty Among Married-Couple Families in St. Martin Parish
The poverty statistics for married-couple families in St. Martin Parish show that 6.2% or 551 of the total 8,904 families live below the poverty line. Families with 5 or more children have the highest poverty rate of 16.9%, comprising of 11 families. On the other hand, families with 3 or 4 children have the lowest poverty rate of 5.1%, which includes 34 families.
| Children | Above Poverty | Below Poverty |
| No Children | 4,813 (94.4%) | 288 (5.7%) |
| 1 or 2 Children | 2,848 (92.9%) | 218 (7.1%) |
| 3 or 4 Children | 638 (94.9%) | 34 (5.1%) |
| 5 or more Children | 54 (83.1%) | 11 (16.9%) |
| Total | 8,353 (93.8%) | 551 (6.2%) |
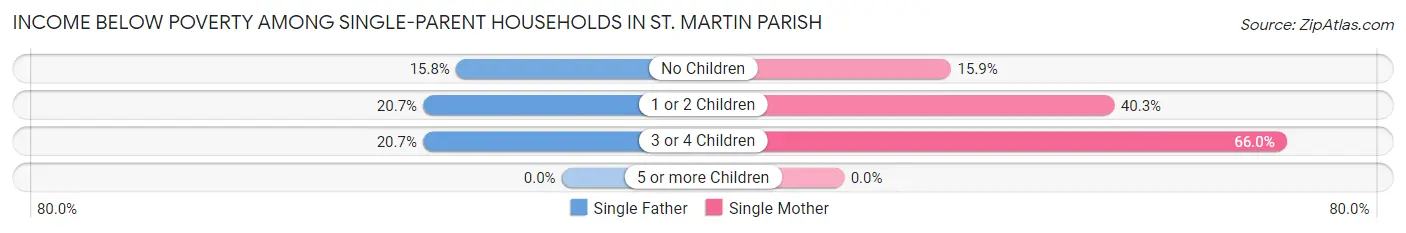
Income Below Poverty Among Single-Parent Households in St. Martin Parish
According to the poverty data in St. Martin Parish, 18.2% or 236 single-father households and 33.6% or 922 single-mother households are living below the poverty line. Among single-father households, those with 3 or 4 children have the highest poverty rate, with 31 households (20.7%) experiencing poverty. Likewise, among single-mother households, those with 3 or 4 children have the highest poverty rate, with 229 households (66.0%) falling below the poverty line.
| Children | Single Father | Single Mother |
| No Children | 84 (15.8%) | 178 (15.9%) |
| 1 or 2 Children | 121 (20.6%) | 515 (40.3%) |
| 3 or 4 Children | 31 (20.7%) | 229 (66.0%) |
| 5 or more Children | 0 (0.0%) | 0 (0.0%) |
| Total | 236 (18.2%) | 922 (33.6%) |
Income Below Poverty Among Married-Couple vs Single-Parent Households in St. Martin Parish
The poverty data for St. Martin Parish shows that 551 of the married-couple family households (6.2%) and 1,158 of the single-parent households (28.7%) are living below the poverty level. Within the married-couple family households, those with 5 or more children have the highest poverty rate, with 11 households (16.9%) falling below the poverty line. Among the single-parent households, those with 3 or 4 children have the highest poverty rate, with 260 household (52.3%) living below poverty.
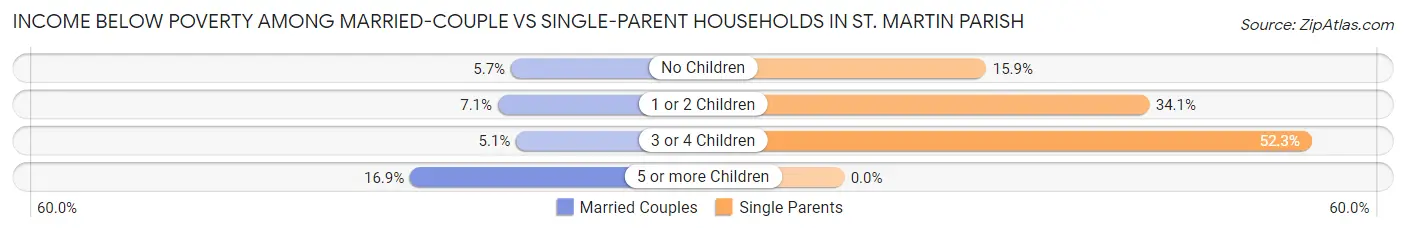
| Children | Married-Couple Families | Single-Parent Households |
| No Children | 288 (5.7%) | 262 (15.9%) |
| 1 or 2 Children | 218 (7.1%) | 636 (34.1%) |
| 3 or 4 Children | 34 (5.1%) | 260 (52.3%) |
| 5 or more Children | 11 (16.9%) | 0 (0.0%) |
| Total | 551 (6.2%) | 1,158 (28.7%) |
Employment Characteristics in St. Martin Parish
Employment by Class of Employer in St. Martin Parish
Among the 21,696 employed individuals in St. Martin Parish, private company employees (15,407 | 71.0%), self-employed (not incorporated) (1,921 | 8.8%), and local government employees (1,635 | 7.5%) make up the most common classes of employment.
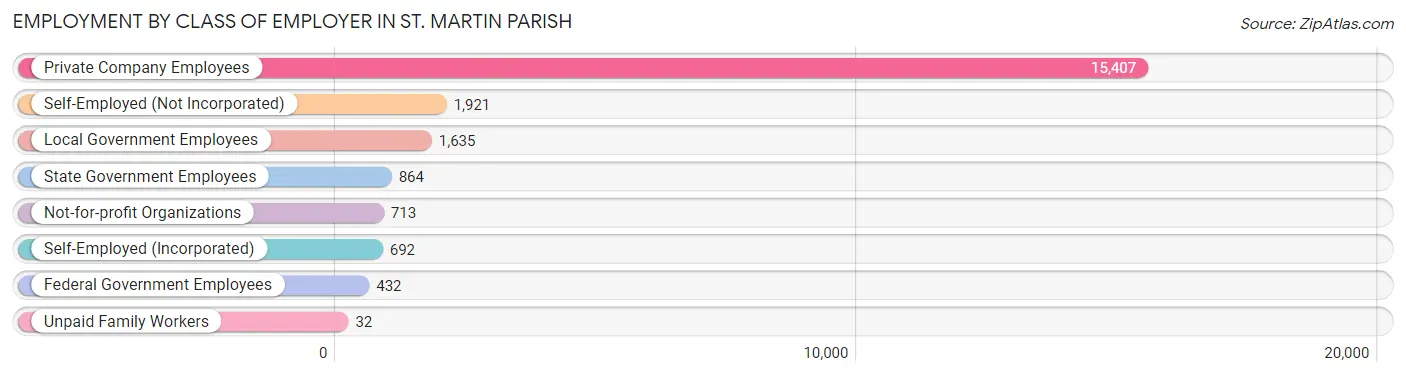
| Employer Class | # Employees | % Employees |
| Private Company Employees | 15,407 | 71.0% |
| Self-Employed (Incorporated) | 692 | 3.2% |
| Self-Employed (Not Incorporated) | 1,921 | 8.8% |
| Not-for-profit Organizations | 713 | 3.3% |
| Local Government Employees | 1,635 | 7.5% |
| State Government Employees | 864 | 4.0% |
| Federal Government Employees | 432 | 2.0% |
| Unpaid Family Workers | 32 | 0.2% |
| Total | 21,696 | 100.0% |
Employment Status by Age in St. Martin Parish
According to the labor force statistics for St. Martin Parish, out of the total population over 16 years of age (40,746), 57.7% or 23,510 individuals are in the labor force, with 6.2% or 1,458 of them unemployed. The age group with the highest labor force participation rate is 30 to 34 years, with 81.8% or 2,725 individuals in the labor force. Within the labor force, the 16 to 19 years age range has the highest percentage of unemployed individuals, with 19.3% or 181 of them being unemployed.
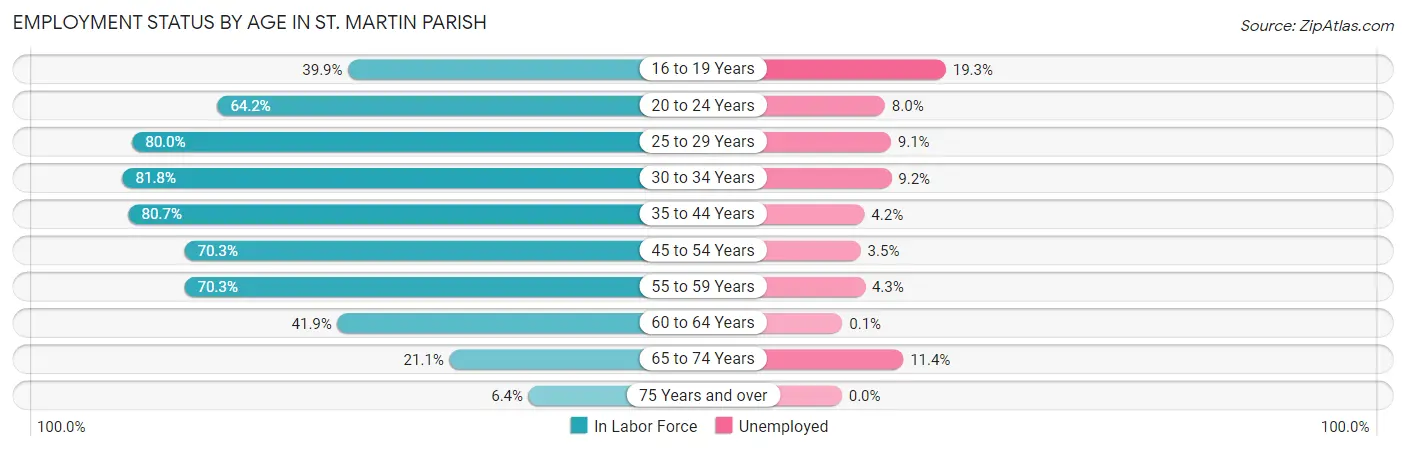
| Age Bracket | In Labor Force | Unemployed |
| 16 to 19 Years | 940 (39.9%) | 181 (19.3%) |
| 20 to 24 Years | 2,052 (64.2%) | 164 (8.0%) |
| 25 to 29 Years | 2,694 (80.0%) | 245 (9.1%) |
| 30 to 34 Years | 2,725 (81.8%) | 251 (9.2%) |
| 35 to 44 Years | 5,204 (80.7%) | 219 (4.2%) |
| 45 to 54 Years | 4,510 (70.3%) | 158 (3.5%) |
| 55 to 59 Years | 2,662 (70.3%) | 114 (4.3%) |
| 60 to 64 Years | 1,438 (41.9%) | 1 (0.1%) |
| 65 to 74 Years | 1,088 (21.1%) | 124 (11.4%) |
| 75 Years and over | 208 (6.4%) | 0 (0.0%) |
| Total | 23,510 (57.7%) | 1,458 (6.2%) |
Employment Status by Educational Attainment in St. Martin Parish
According to labor force statistics for St. Martin Parish, 71.8% of individuals (19,229) out of the total population between 25 and 64 years of age (26,781) are in the labor force, with 5.1% or 981 of them being unemployed. The group with the highest labor force participation rate are those with the educational attainment of bachelor's degree or higher, with 81.9% or 3,487 individuals in the labor force. Within the labor force, individuals with less than high school education have the highest percentage of unemployment, with 14.5% or 294 of them being unemployed.
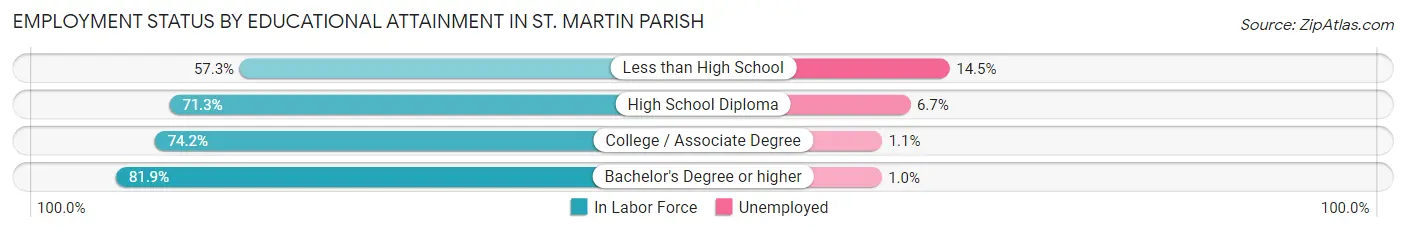
| Educational Attainment | In Labor Force | Unemployed |
| Less than High School | 2,028 (57.3%) | 513 (14.5%) |
| High School Diploma | 8,991 (71.3%) | 845 (6.7%) |
| College / Associate Degree | 4,729 (74.2%) | 70 (1.1%) |
| Bachelor's Degree or higher | 3,487 (81.9%) | 43 (1.0%) |
| Total | 19,229 (71.8%) | 1,366 (5.1%) |
Employment Occupations by Sex in St. Martin Parish
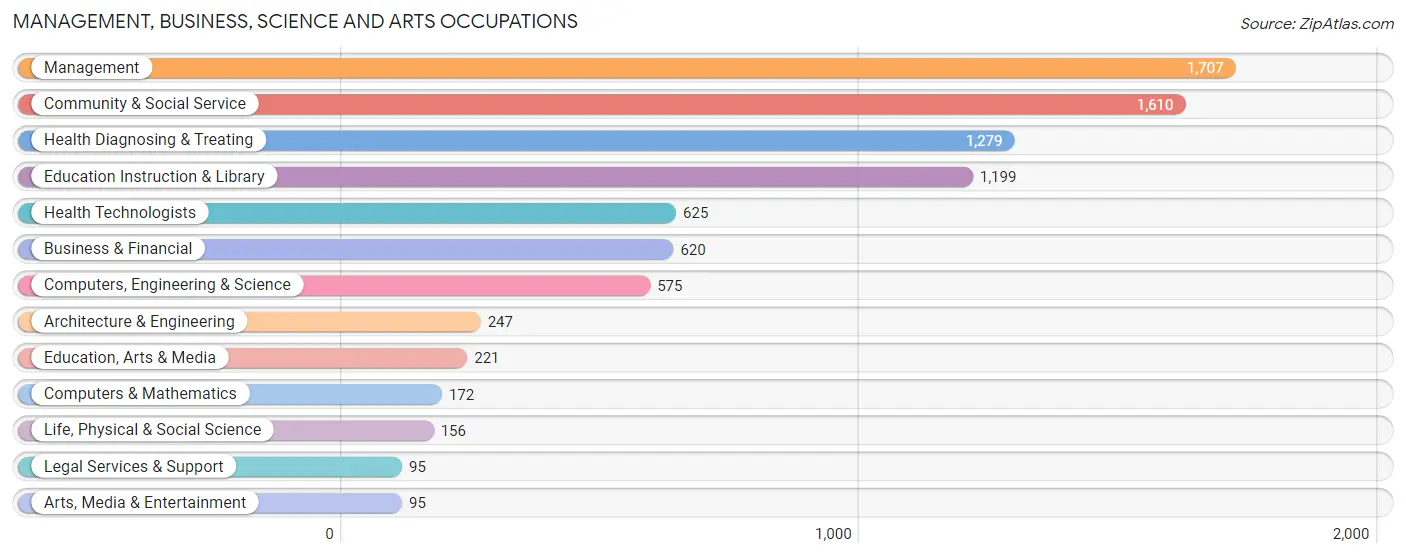
Management, Business, Science and Arts Occupations
The most common Management, Business, Science and Arts occupations in St. Martin Parish are Management (1,707 | 7.8%), Community & Social Service (1,610 | 7.3%), Health Diagnosing & Treating (1,279 | 5.8%), Education Instruction & Library (1,199 | 5.5%), and Health Technologists (625 | 2.9%).
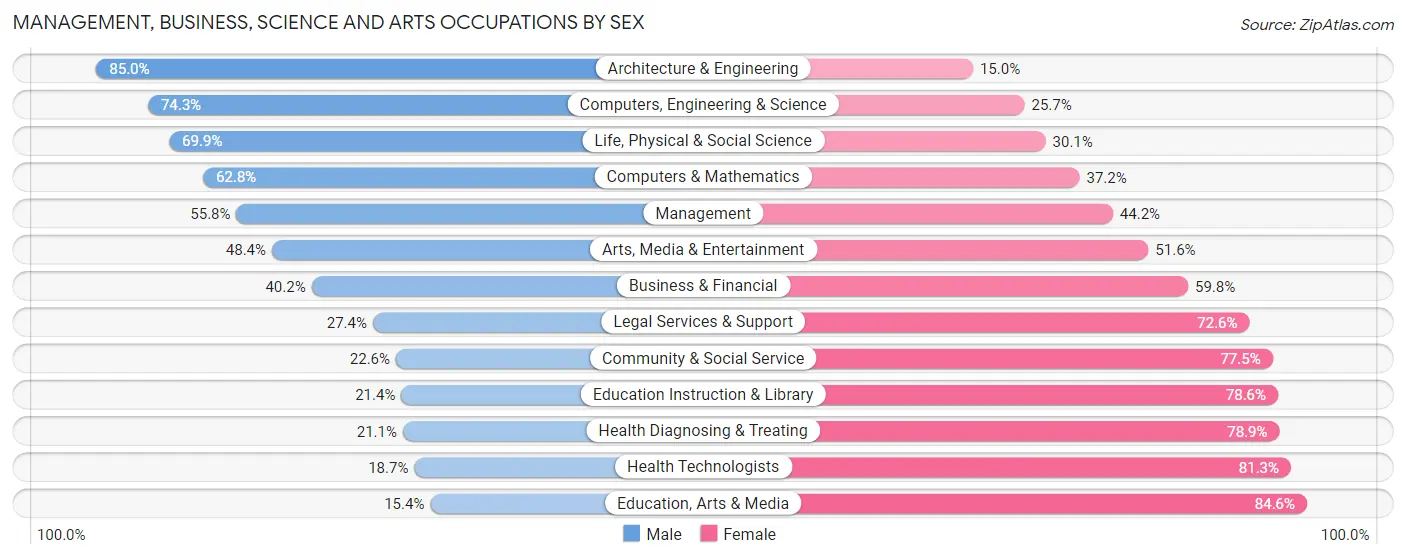
Management, Business, Science and Arts Occupations by Sex
Within the Management, Business, Science and Arts occupations in St. Martin Parish, the most male-oriented occupations are Architecture & Engineering (85.0%), Computers, Engineering & Science (74.3%), and Life, Physical & Social Science (69.9%), while the most female-oriented occupations are Education, Arts & Media (84.6%), Health Technologists (81.3%), and Health Diagnosing & Treating (78.9%).
| Occupation | Male | Female |
| Management | 953 (55.8%) | 754 (44.2%) |
| Business & Financial | 249 (40.2%) | 371 (59.8%) |
| Computers, Engineering & Science | 427 (74.3%) | 148 (25.7%) |
| Computers & Mathematics | 108 (62.8%) | 64 (37.2%) |
| Architecture & Engineering | 210 (85.0%) | 37 (15.0%) |
| Life, Physical & Social Science | 109 (69.9%) | 47 (30.1%) |
| Community & Social Service | 363 (22.6%) | 1,247 (77.4%) |
| Education, Arts & Media | 34 (15.4%) | 187 (84.6%) |
| Legal Services & Support | 26 (27.4%) | 69 (72.6%) |
| Education Instruction & Library | 257 (21.4%) | 942 (78.6%) |
| Arts, Media & Entertainment | 46 (48.4%) | 49 (51.6%) |
| Health Diagnosing & Treating | 270 (21.1%) | 1,009 (78.9%) |
| Health Technologists | 117 (18.7%) | 508 (81.3%) |
| Total (Category) | 2,262 (39.1%) | 3,529 (60.9%) |
| Total (Overall) | 11,187 (51.0%) | 10,765 (49.0%) |
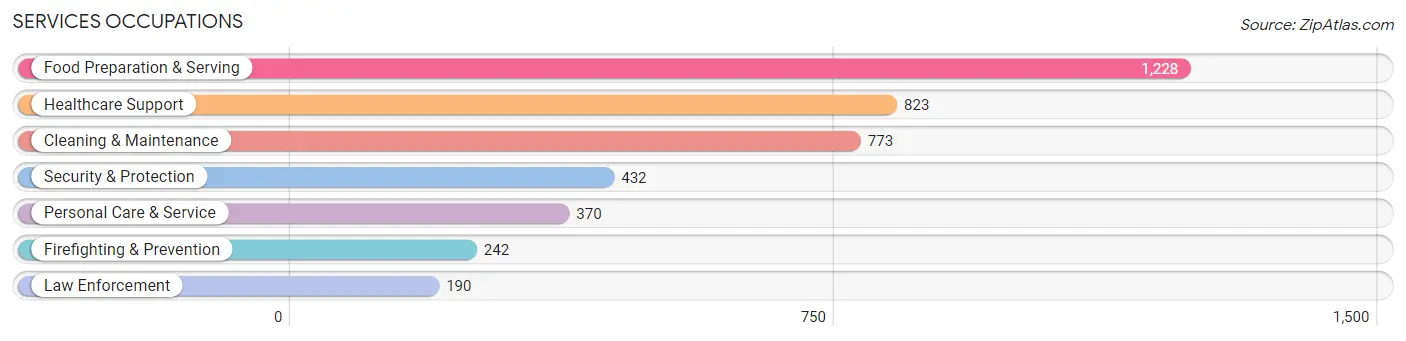
Services Occupations
The most common Services occupations in St. Martin Parish are Food Preparation & Serving (1,228 | 5.6%), Healthcare Support (823 | 3.7%), Cleaning & Maintenance (773 | 3.5%), Security & Protection (432 | 2.0%), and Personal Care & Service (370 | 1.7%).
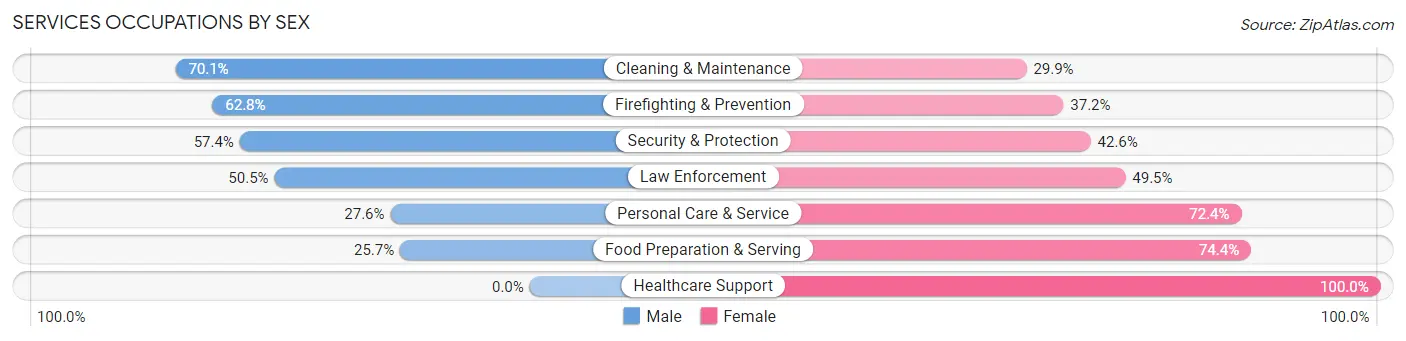
Services Occupations by Sex
Within the Services occupations in St. Martin Parish, the most male-oriented occupations are Cleaning & Maintenance (70.1%), Firefighting & Prevention (62.8%), and Security & Protection (57.4%), while the most female-oriented occupations are Healthcare Support (100.0%), Food Preparation & Serving (74.4%), and Personal Care & Service (72.4%).
| Occupation | Male | Female |
| Healthcare Support | 0 (0.0%) | 823 (100.0%) |
| Security & Protection | 248 (57.4%) | 184 (42.6%) |
| Firefighting & Prevention | 152 (62.8%) | 90 (37.2%) |
| Law Enforcement | 96 (50.5%) | 94 (49.5%) |
| Food Preparation & Serving | 315 (25.7%) | 913 (74.4%) |
| Cleaning & Maintenance | 542 (70.1%) | 231 (29.9%) |
| Personal Care & Service | 102 (27.6%) | 268 (72.4%) |
| Total (Category) | 1,207 (33.3%) | 2,419 (66.7%) |
| Total (Overall) | 11,187 (51.0%) | 10,765 (49.0%) |
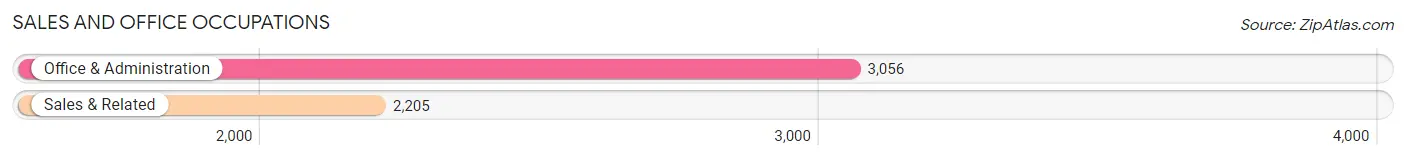
Sales and Office Occupations
The most common Sales and Office occupations in St. Martin Parish are Office & Administration (3,056 | 13.9%), and Sales & Related (2,205 | 10.0%).
Sales and Office Occupations by Sex
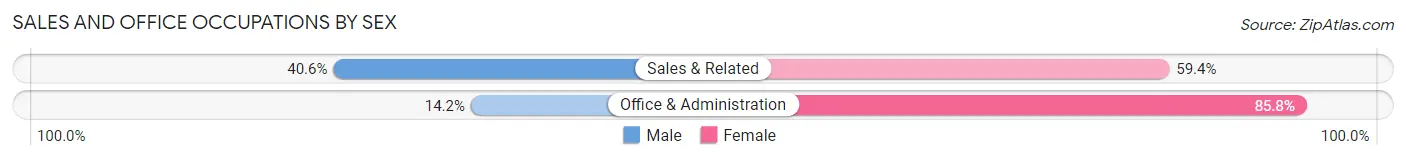
| Occupation | Male | Female |
| Sales & Related | 896 (40.6%) | 1,309 (59.4%) |
| Office & Administration | 434 (14.2%) | 2,622 (85.8%) |
| Total (Category) | 1,330 (25.3%) | 3,931 (74.7%) |
| Total (Overall) | 11,187 (51.0%) | 10,765 (49.0%) |
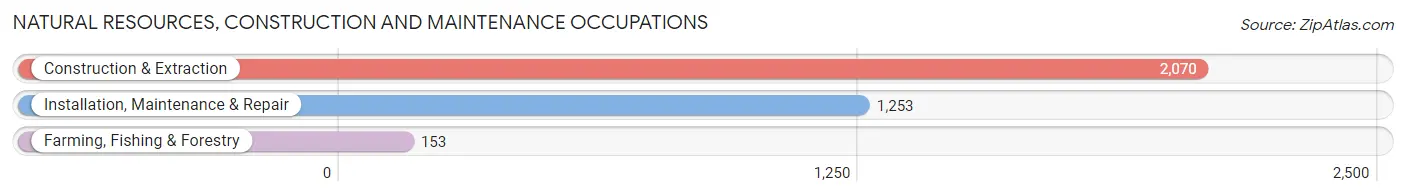
Natural Resources, Construction and Maintenance Occupations
The most common Natural Resources, Construction and Maintenance occupations in St. Martin Parish are Construction & Extraction (2,070 | 9.4%), Installation, Maintenance & Repair (1,253 | 5.7%), and Farming, Fishing & Forestry (153 | 0.7%).
Natural Resources, Construction and Maintenance Occupations by Sex
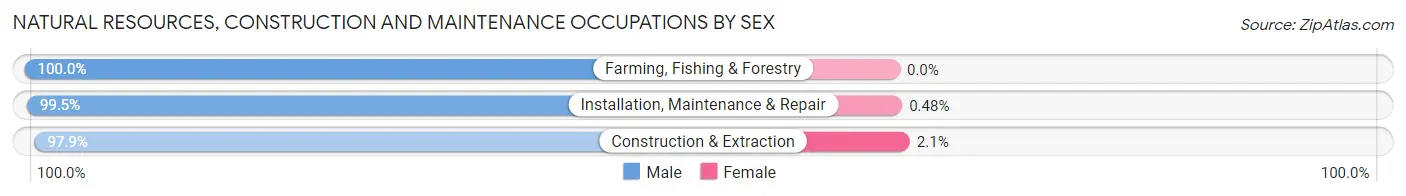
| Occupation | Male | Female |
| Farming, Fishing & Forestry | 153 (100.0%) | 0 (0.0%) |
| Construction & Extraction | 2,027 (97.9%) | 43 (2.1%) |
| Installation, Maintenance & Repair | 1,247 (99.5%) | 6 (0.5%) |
| Total (Category) | 3,427 (98.6%) | 49 (1.4%) |
| Total (Overall) | 11,187 (51.0%) | 10,765 (49.0%) |
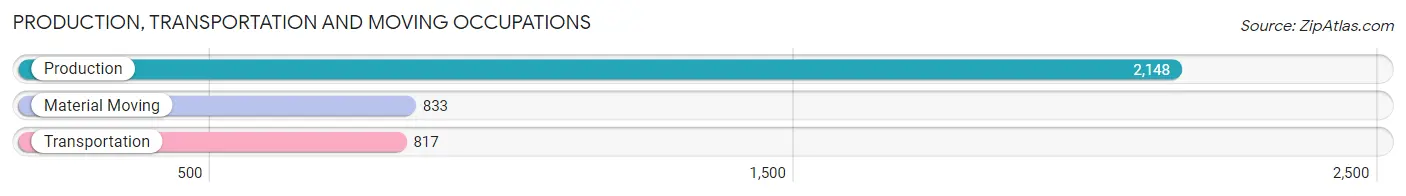
Production, Transportation and Moving Occupations
The most common Production, Transportation and Moving occupations in St. Martin Parish are Production (2,148 | 9.8%), Material Moving (833 | 3.8%), and Transportation (817 | 3.7%).
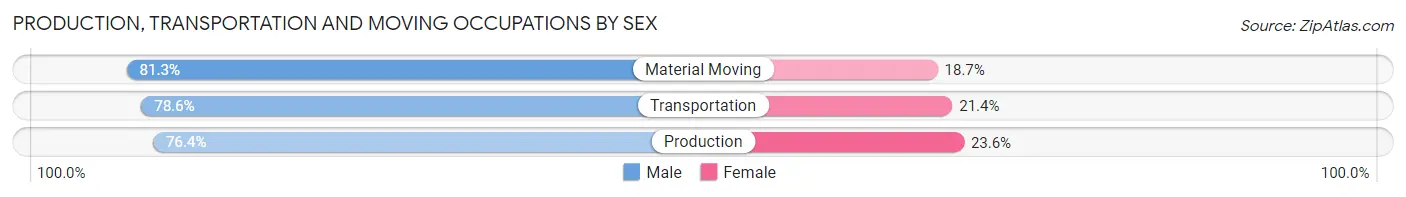
Production, Transportation and Moving Occupations by Sex
| Occupation | Male | Female |
| Production | 1,642 (76.4%) | 506 (23.6%) |
| Transportation | 642 (78.6%) | 175 (21.4%) |
| Material Moving | 677 (81.3%) | 156 (18.7%) |
| Total (Category) | 2,961 (78.0%) | 837 (22.0%) |
| Total (Overall) | 11,187 (51.0%) | 10,765 (49.0%) |
Employment Industries by Sex in St. Martin Parish
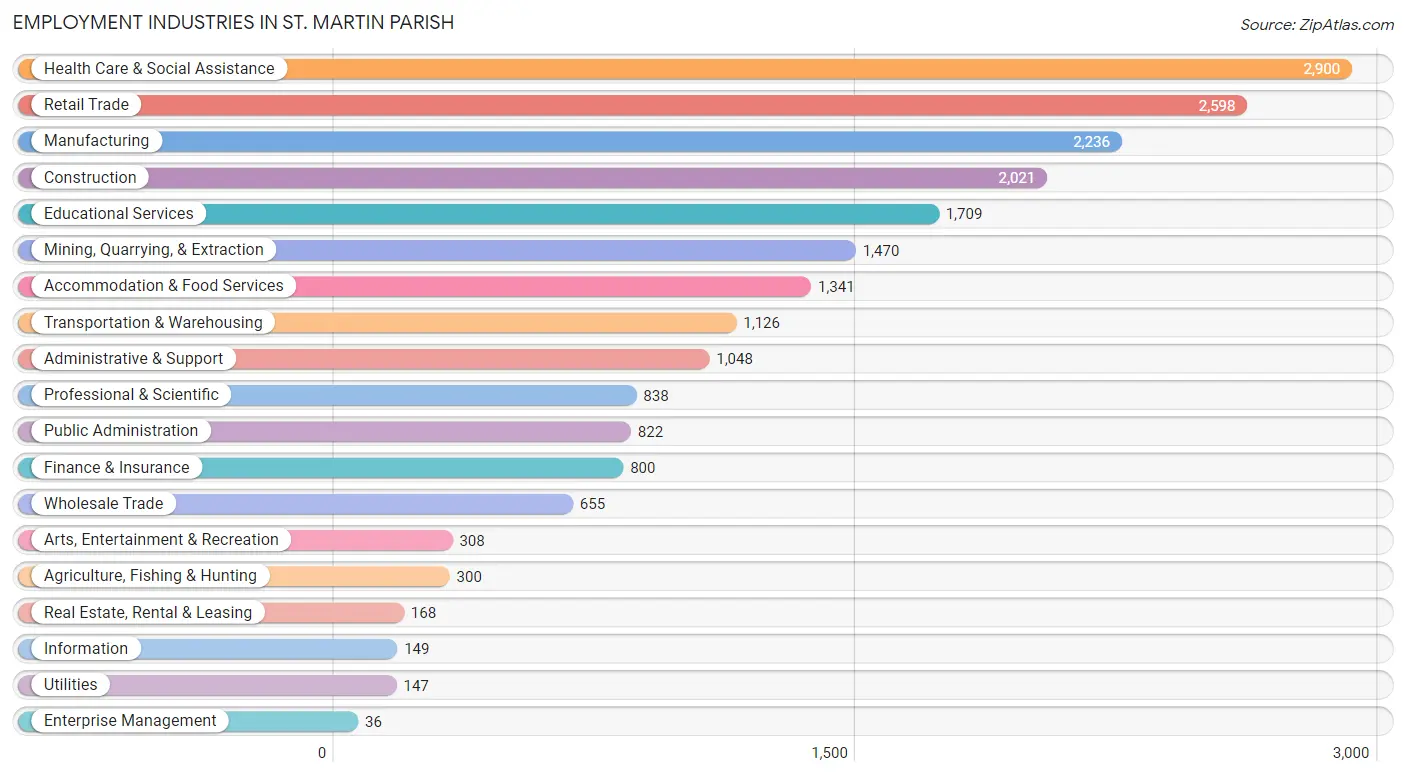
Employment Industries in St. Martin Parish
The major employment industries in St. Martin Parish include Health Care & Social Assistance (2,900 | 13.2%), Retail Trade (2,598 | 11.8%), Manufacturing (2,236 | 10.2%), Construction (2,021 | 9.2%), and Educational Services (1,709 | 7.8%).
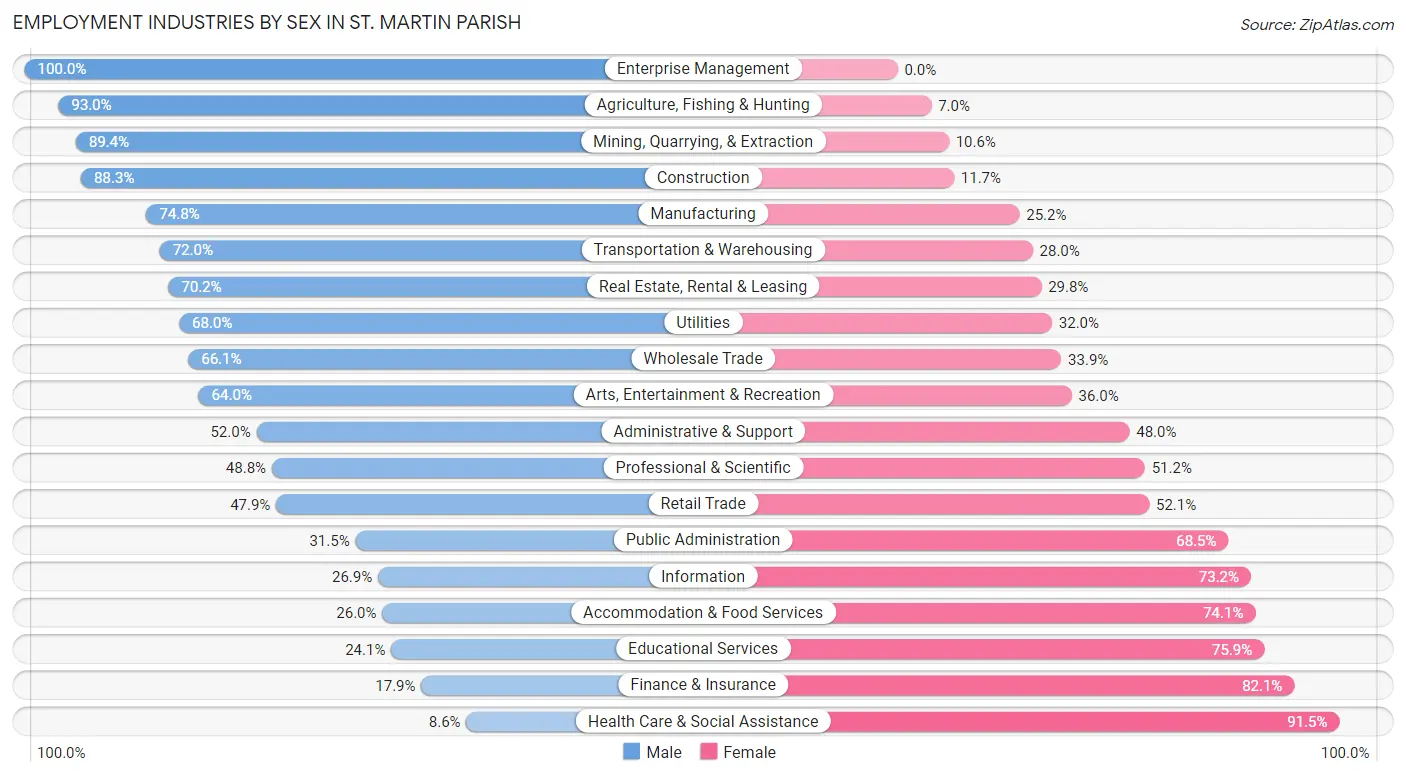
Employment Industries by Sex in St. Martin Parish
The St. Martin Parish industries that see more men than women are Enterprise Management (100.0%), Agriculture, Fishing & Hunting (93.0%), and Mining, Quarrying, & Extraction (89.4%), whereas the industries that tend to have a higher number of women are Health Care & Social Assistance (91.4%), Finance & Insurance (82.1%), and Educational Services (75.9%).
| Industry | Male | Female |
| Agriculture, Fishing & Hunting | 279 (93.0%) | 21 (7.0%) |
| Mining, Quarrying, & Extraction | 1,314 (89.4%) | 156 (10.6%) |
| Construction | 1,785 (88.3%) | 236 (11.7%) |
| Manufacturing | 1,672 (74.8%) | 564 (25.2%) |
| Wholesale Trade | 433 (66.1%) | 222 (33.9%) |
| Retail Trade | 1,245 (47.9%) | 1,353 (52.1%) |
| Transportation & Warehousing | 811 (72.0%) | 315 (28.0%) |
| Utilities | 100 (68.0%) | 47 (32.0%) |
| Information | 40 (26.9%) | 109 (73.2%) |
| Finance & Insurance | 143 (17.9%) | 657 (82.1%) |
| Real Estate, Rental & Leasing | 118 (70.2%) | 50 (29.8%) |
| Professional & Scientific | 409 (48.8%) | 429 (51.2%) |
| Enterprise Management | 36 (100.0%) | 0 (0.0%) |
| Administrative & Support | 545 (52.0%) | 503 (48.0%) |
| Educational Services | 412 (24.1%) | 1,297 (75.9%) |
| Health Care & Social Assistance | 248 (8.6%) | 2,652 (91.4%) |
| Arts, Entertainment & Recreation | 197 (64.0%) | 111 (36.0%) |
| Accommodation & Food Services | 348 (26.0%) | 993 (74.1%) |
| Public Administration | 259 (31.5%) | 563 (68.5%) |
| Total | 11,187 (51.0%) | 10,765 (49.0%) |
Education in St. Martin Parish
School Enrollment in St. Martin Parish
The most common levels of schooling among the 12,123 students in St. Martin Parish are high school (3,039 | 25.1%), middle school (2,802 | 23.1%), and elementary school (2,495 | 20.6%).
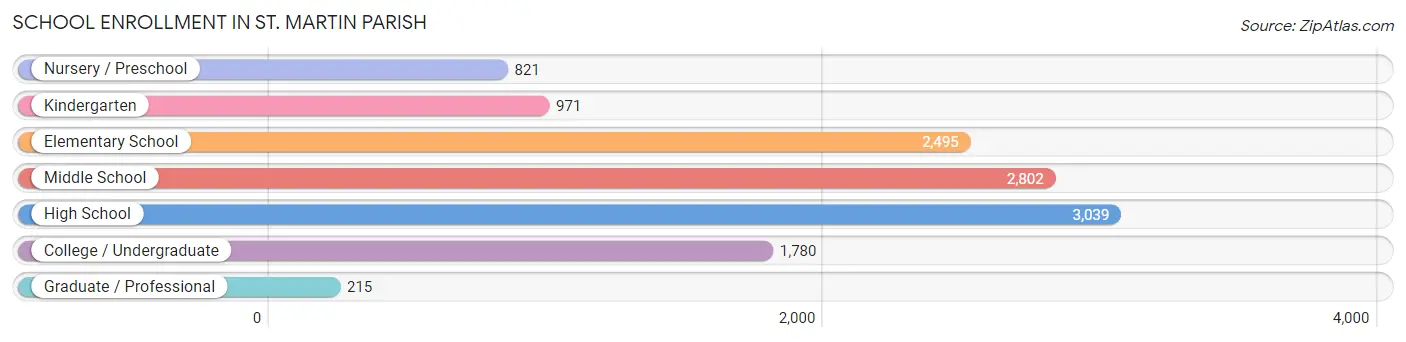
| School Level | # Students | % Students |
| Nursery / Preschool | 821 | 6.8% |
| Kindergarten | 971 | 8.0% |
| Elementary School | 2,495 | 20.6% |
| Middle School | 2,802 | 23.1% |
| High School | 3,039 | 25.1% |
| College / Undergraduate | 1,780 | 14.7% |
| Graduate / Professional | 215 | 1.8% |
| Total | 12,123 | 100.0% |
School Enrollment by Age by Funding Source in St. Martin Parish
Out of a total of 12,123 students who are enrolled in schools in St. Martin Parish, 2,243 (18.5%) attend a private institution, while the remaining 9,880 (81.5%) are enrolled in public schools. The age group of 3 to 4 year olds has the highest likelihood of being enrolled in private schools, with 167 (26.0% in the age bracket) enrolled. Conversely, the age group of 20 to 24 year olds has the lowest likelihood of being enrolled in a private school, with 780 (88.9% in the age bracket) attending a public institution.
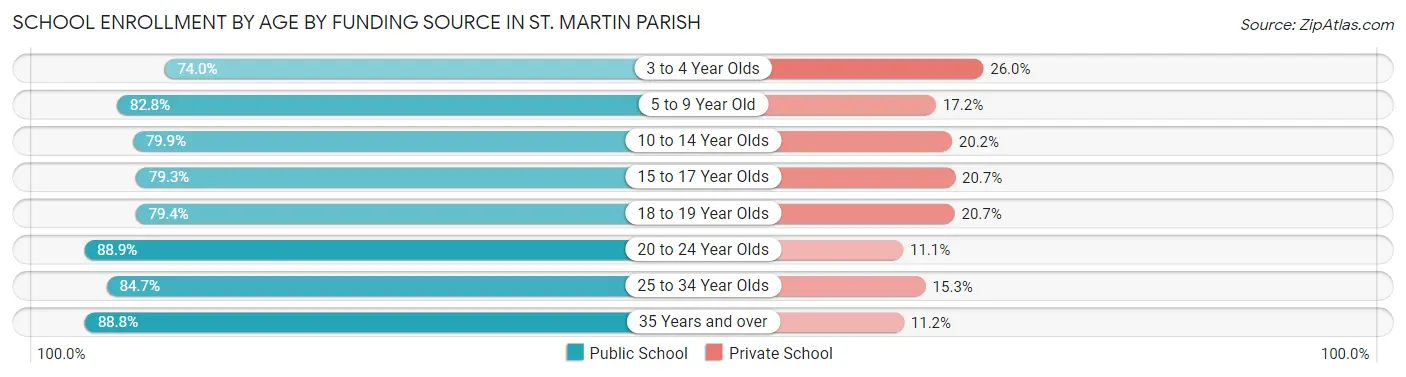
| Age Bracket | Public School | Private School |
| 3 to 4 Year Olds | 475 (74.0%) | 167 (26.0%) |
| 5 to 9 Year Old | 2,881 (82.8%) | 598 (17.2%) |
| 10 to 14 Year Olds | 2,774 (79.8%) | 700 (20.2%) |
| 15 to 17 Year Olds | 1,613 (79.3%) | 422 (20.7%) |
| 18 to 19 Year Olds | 488 (79.3%) | 127 (20.6%) |
| 20 to 24 Year Olds | 780 (88.9%) | 97 (11.1%) |
| 25 to 34 Year Olds | 455 (84.7%) | 82 (15.3%) |
| 35 Years and over | 412 (88.8%) | 52 (11.2%) |
| Total | 9,880 (81.5%) | 2,243 (18.5%) |
Educational Attainment by Field of Study in St. Martin Parish
Education (1,175 | 21.9%), business (816 | 15.2%), science & technology (657 | 12.3%), liberal arts & history (600 | 11.2%), and social sciences (387 | 7.2%) are the most common fields of study among 5,361 individuals in St. Martin Parish who have obtained a bachelor's degree or higher.
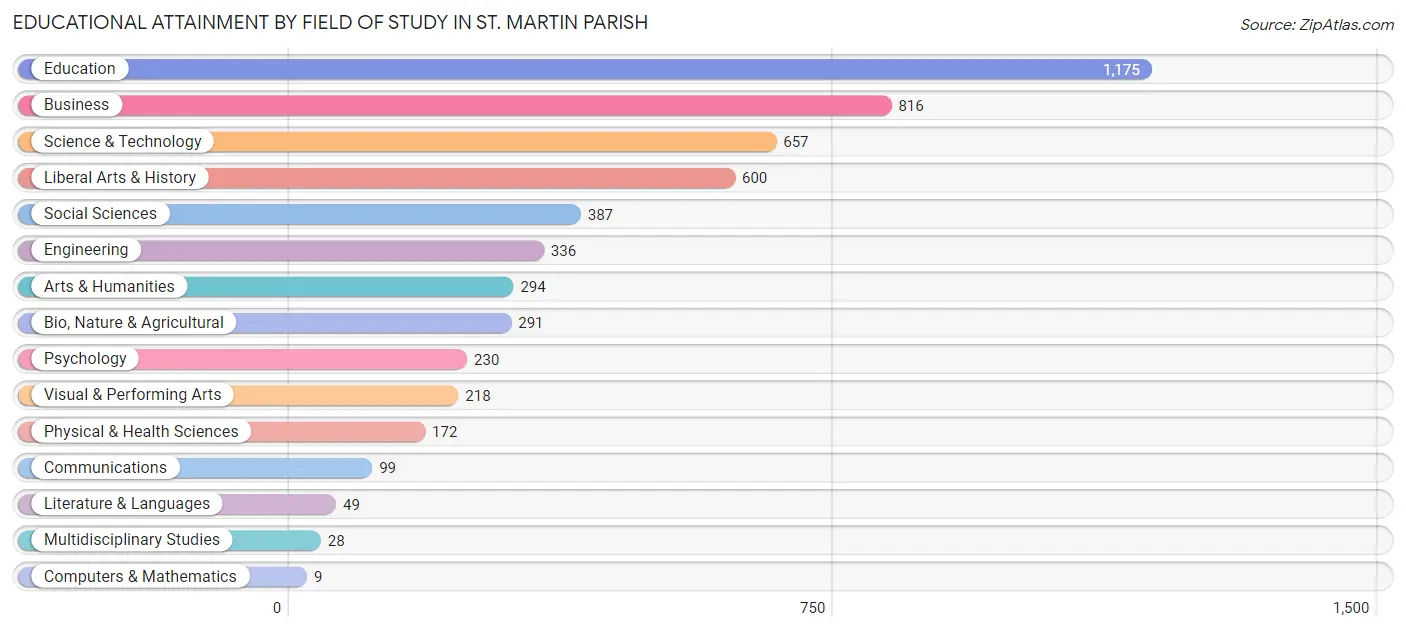
| Field of Study | # Graduates | % Graduates |
| Computers & Mathematics | 9 | 0.2% |
| Bio, Nature & Agricultural | 291 | 5.4% |
| Physical & Health Sciences | 172 | 3.2% |
| Psychology | 230 | 4.3% |
| Social Sciences | 387 | 7.2% |
| Engineering | 336 | 6.3% |
| Multidisciplinary Studies | 28 | 0.5% |
| Science & Technology | 657 | 12.3% |
| Business | 816 | 15.2% |
| Education | 1,175 | 21.9% |
| Literature & Languages | 49 | 0.9% |
| Liberal Arts & History | 600 | 11.2% |
| Visual & Performing Arts | 218 | 4.1% |
| Communications | 99 | 1.8% |
| Arts & Humanities | 294 | 5.5% |
| Total | 5,361 | 100.0% |
Transportation & Commute in St. Martin Parish
Vehicle Availability by Sex in St. Martin Parish
The most prevalent vehicle ownership categories in St. Martin Parish are males with 2 vehicles (5,440, accounting for 49.0%) and females with 2 vehicles (4,271, making up 51.4%).
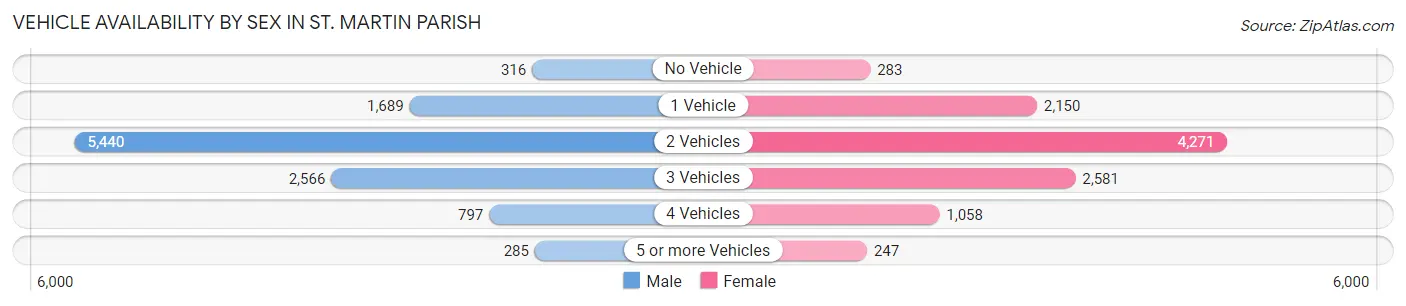
| Vehicles Available | Male | Female |
| No Vehicle | 316 (2.9%) | 283 (2.7%) |
| 1 Vehicle | 1,689 (15.2%) | 2,150 (20.3%) |
| 2 Vehicles | 5,440 (49.0%) | 4,271 (40.3%) |
| 3 Vehicles | 2,566 (23.1%) | 2,581 (24.4%) |
| 4 Vehicles | 797 (7.2%) | 1,058 (10.0%) |
| 5 or more Vehicles | 285 (2.6%) | 247 (2.3%) |
| Total | 11,093 (100.0%) | 10,590 (100.0%) |
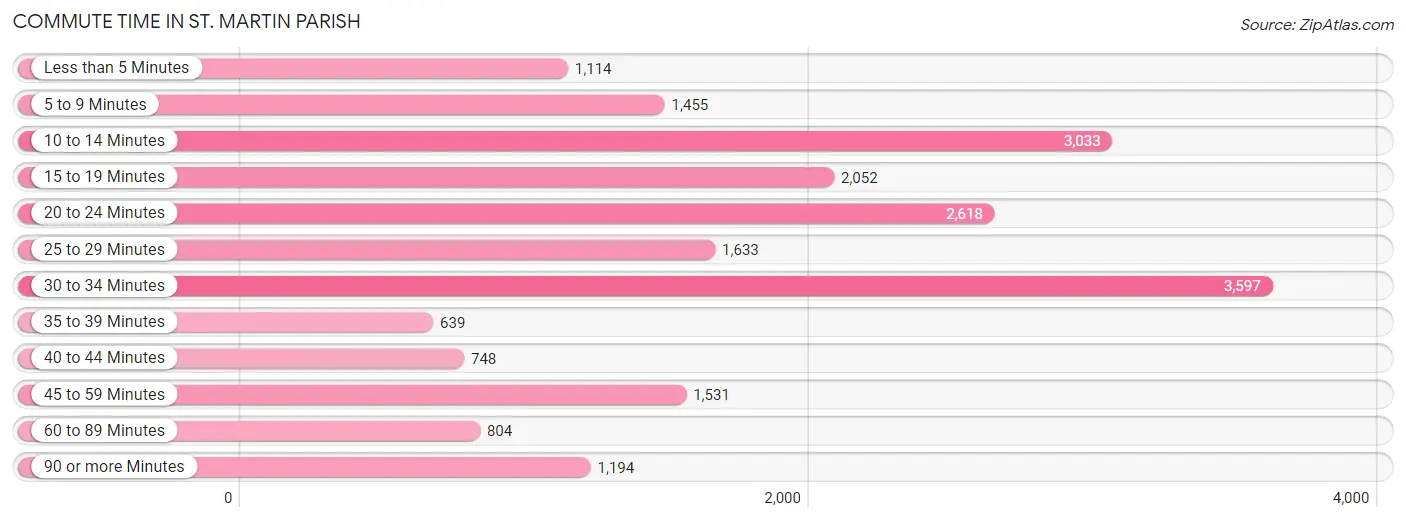
Commute Time in St. Martin Parish
The most frequently occuring commute durations in St. Martin Parish are 30 to 34 minutes (3,597 commuters, 17.6%), 10 to 14 minutes (3,033 commuters, 14.8%), and 20 to 24 minutes (2,618 commuters, 12.8%).
| Commute Time | # Commuters | % Commuters |
| Less than 5 Minutes | 1,114 | 5.5% |
| 5 to 9 Minutes | 1,455 | 7.1% |
| 10 to 14 Minutes | 3,033 | 14.8% |
| 15 to 19 Minutes | 2,052 | 10.1% |
| 20 to 24 Minutes | 2,618 | 12.8% |
| 25 to 29 Minutes | 1,633 | 8.0% |
| 30 to 34 Minutes | 3,597 | 17.6% |
| 35 to 39 Minutes | 639 | 3.1% |
| 40 to 44 Minutes | 748 | 3.7% |
| 45 to 59 Minutes | 1,531 | 7.5% |
| 60 to 89 Minutes | 804 | 3.9% |
| 90 or more Minutes | 1,194 | 5.9% |
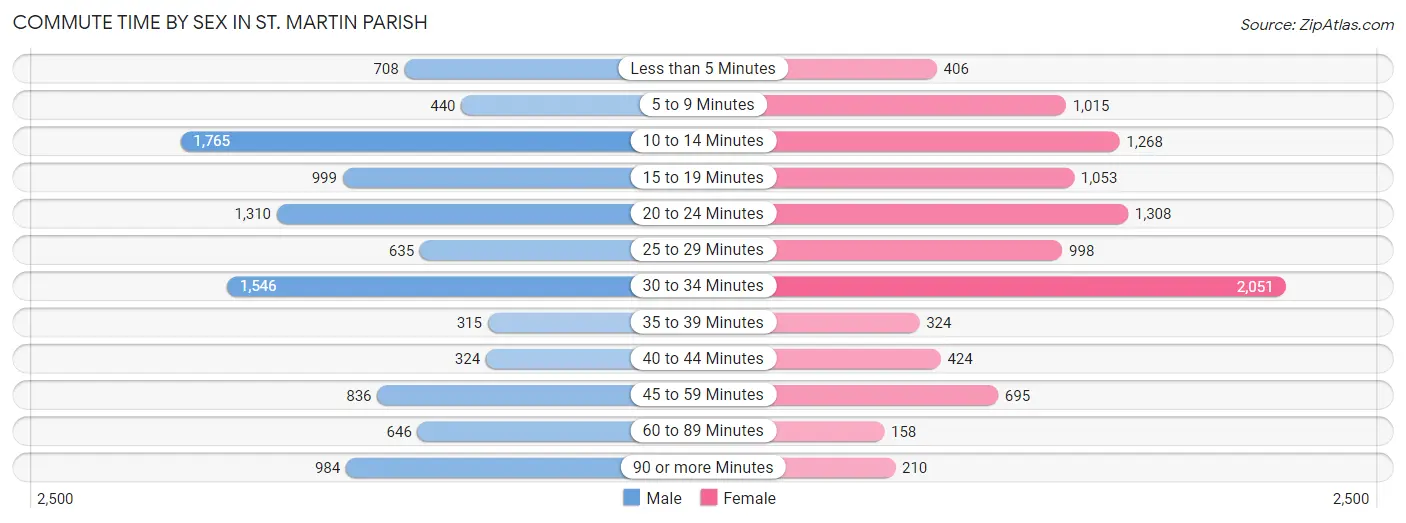
Commute Time by Sex in St. Martin Parish
The most common commute times in St. Martin Parish are 10 to 14 minutes (1,765 commuters, 16.8%) for males and 30 to 34 minutes (2,051 commuters, 20.7%) for females.
| Commute Time | Male | Female |
| Less than 5 Minutes | 708 (6.7%) | 406 (4.1%) |
| 5 to 9 Minutes | 440 (4.2%) | 1,015 (10.2%) |
| 10 to 14 Minutes | 1,765 (16.8%) | 1,268 (12.8%) |
| 15 to 19 Minutes | 999 (9.5%) | 1,053 (10.6%) |
| 20 to 24 Minutes | 1,310 (12.5%) | 1,308 (13.2%) |
| 25 to 29 Minutes | 635 (6.0%) | 998 (10.1%) |
| 30 to 34 Minutes | 1,546 (14.7%) | 2,051 (20.7%) |
| 35 to 39 Minutes | 315 (3.0%) | 324 (3.3%) |
| 40 to 44 Minutes | 324 (3.1%) | 424 (4.3%) |
| 45 to 59 Minutes | 836 (8.0%) | 695 (7.0%) |
| 60 to 89 Minutes | 646 (6.1%) | 158 (1.6%) |
| 90 or more Minutes | 984 (9.4%) | 210 (2.1%) |
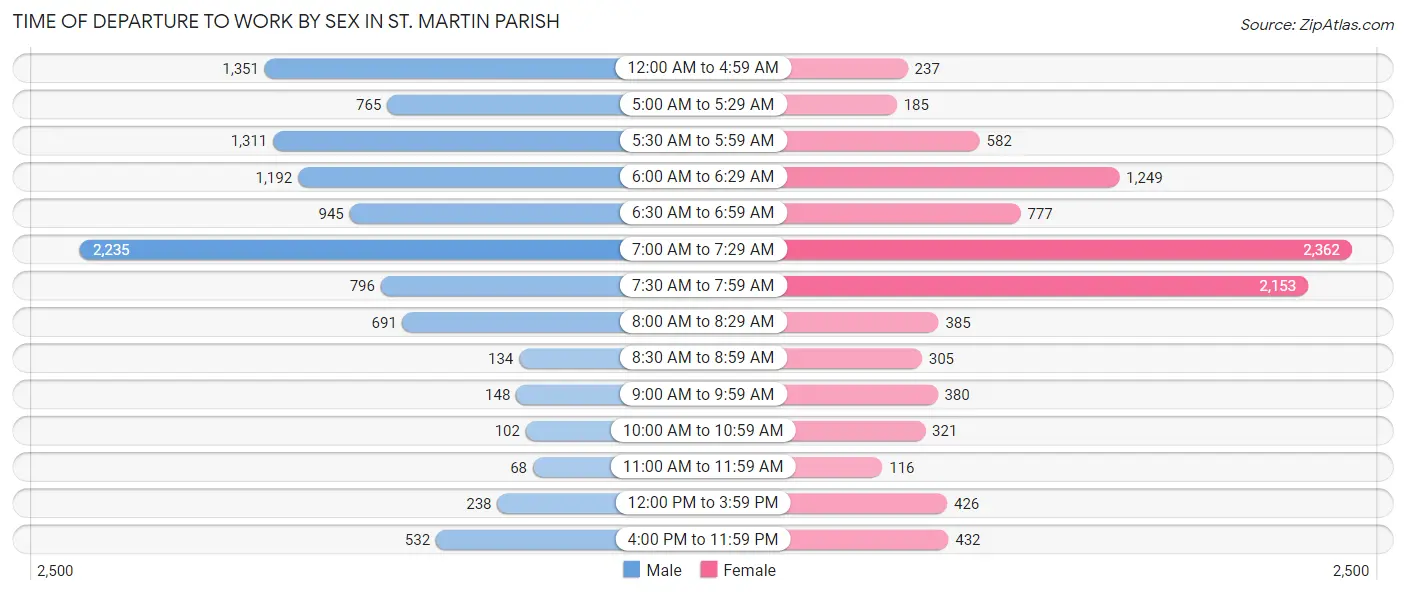
Time of Departure to Work by Sex in St. Martin Parish
The most frequent times of departure to work in St. Martin Parish are 7:00 AM to 7:29 AM (2,235, 21.3%) for males and 7:00 AM to 7:29 AM (2,362, 23.8%) for females.
| Time of Departure | Male | Female |
| 12:00 AM to 4:59 AM | 1,351 (12.9%) | 237 (2.4%) |
| 5:00 AM to 5:29 AM | 765 (7.3%) | 185 (1.9%) |
| 5:30 AM to 5:59 AM | 1,311 (12.5%) | 582 (5.9%) |
| 6:00 AM to 6:29 AM | 1,192 (11.3%) | 1,249 (12.6%) |
| 6:30 AM to 6:59 AM | 945 (9.0%) | 777 (7.8%) |
| 7:00 AM to 7:29 AM | 2,235 (21.3%) | 2,362 (23.8%) |
| 7:30 AM to 7:59 AM | 796 (7.6%) | 2,153 (21.7%) |
| 8:00 AM to 8:29 AM | 691 (6.6%) | 385 (3.9%) |
| 8:30 AM to 8:59 AM | 134 (1.3%) | 305 (3.1%) |
| 9:00 AM to 9:59 AM | 148 (1.4%) | 380 (3.8%) |
| 10:00 AM to 10:59 AM | 102 (1.0%) | 321 (3.2%) |
| 11:00 AM to 11:59 AM | 68 (0.6%) | 116 (1.2%) |
| 12:00 PM to 3:59 PM | 238 (2.3%) | 426 (4.3%) |
| 4:00 PM to 11:59 PM | 532 (5.1%) | 432 (4.4%) |
| Total | 10,508 (100.0%) | 9,910 (100.0%) |
Housing Occupancy in St. Martin Parish
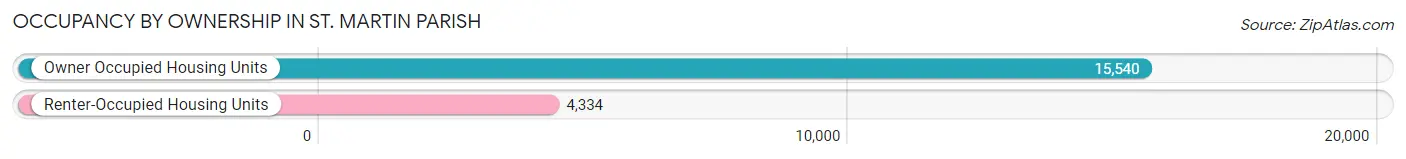
Occupancy by Ownership in St. Martin Parish
Of the total 19,874 dwellings in St. Martin Parish, owner-occupied units account for 15,540 (78.2%), while renter-occupied units make up 4,334 (21.8%).
| Occupancy | # Housing Units | % Housing Units |
| Owner Occupied Housing Units | 15,540 | 78.2% |
| Renter-Occupied Housing Units | 4,334 | 21.8% |
| Total Occupied Housing Units | 19,874 | 100.0% |
Occupancy by Household Size in St. Martin Parish
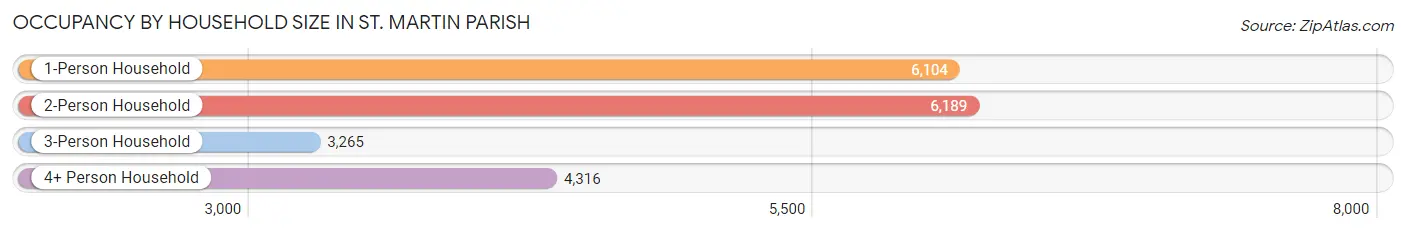
| Household Size | # Housing Units | % Housing Units |
| 1-Person Household | 6,104 | 30.7% |
| 2-Person Household | 6,189 | 31.1% |
| 3-Person Household | 3,265 | 16.4% |
| 4+ Person Household | 4,316 | 21.7% |
| Total Housing Units | 19,874 | 100.0% |
Occupancy by Ownership by Household Size in St. Martin Parish
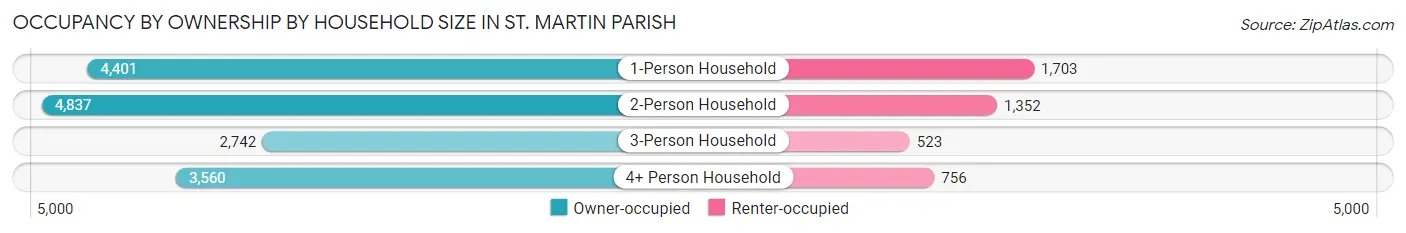
| Household Size | Owner-occupied | Renter-occupied |
| 1-Person Household | 4,401 (72.1%) | 1,703 (27.9%) |
| 2-Person Household | 4,837 (78.1%) | 1,352 (21.8%) |
| 3-Person Household | 2,742 (84.0%) | 523 (16.0%) |
| 4+ Person Household | 3,560 (82.5%) | 756 (17.5%) |
| Total Housing Units | 15,540 (78.2%) | 4,334 (21.8%) |
Occupancy by Educational Attainment in St. Martin Parish
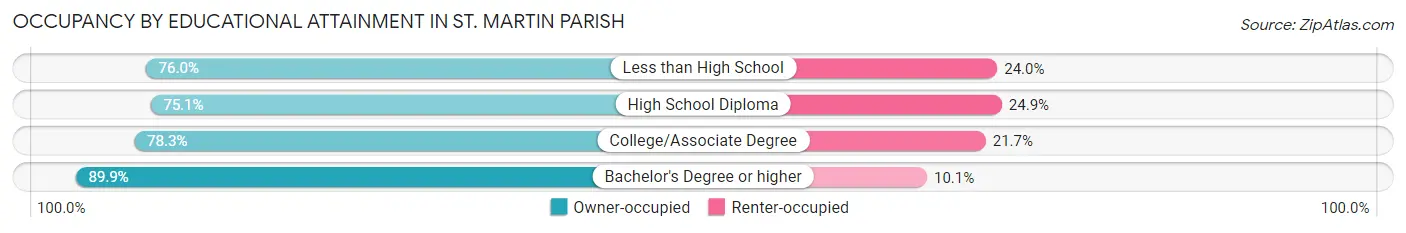
| Household Size | Owner-occupied | Renter-occupied |
| Less than High School | 2,599 (76.0%) | 821 (24.0%) |
| High School Diploma | 6,437 (75.1%) | 2,138 (24.9%) |
| College/Associate Degree | 3,902 (78.3%) | 1,083 (21.7%) |
| Bachelor's Degree or higher | 2,602 (89.9%) | 292 (10.1%) |
Occupancy by Age of Householder in St. Martin Parish
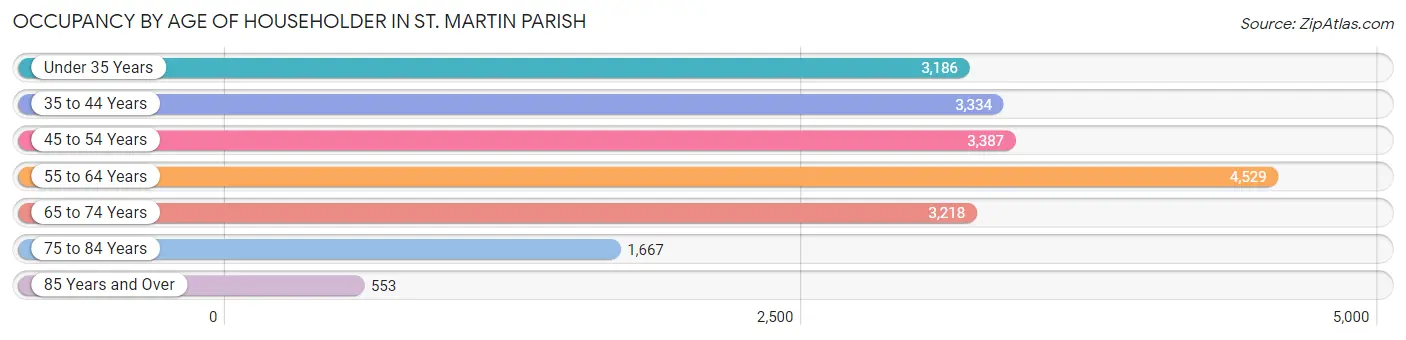
| Age Bracket | # Households | % Households |
| Under 35 Years | 3,186 | 16.0% |
| 35 to 44 Years | 3,334 | 16.8% |
| 45 to 54 Years | 3,387 | 17.0% |
| 55 to 64 Years | 4,529 | 22.8% |
| 65 to 74 Years | 3,218 | 16.2% |
| 75 to 84 Years | 1,667 | 8.4% |
| 85 Years and Over | 553 | 2.8% |
| Total | 19,874 | 100.0% |
Housing Finances in St. Martin Parish
Median Income by Occupancy in St. Martin Parish
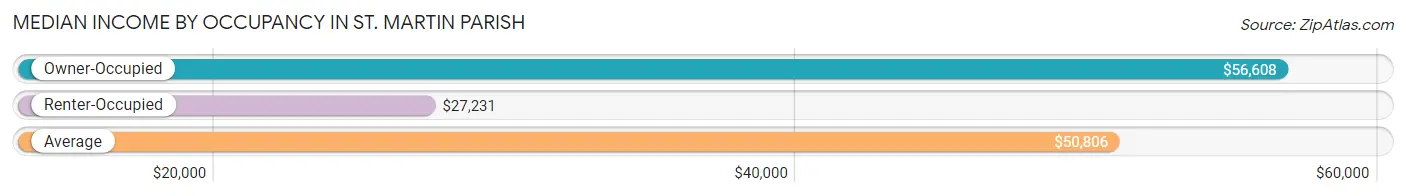
| Occupancy Type | # Households | Median Income |
| Owner-Occupied | 15,540 (78.2%) | $56,608 |
| Renter-Occupied | 4,334 (21.8%) | $27,231 |
| Average | 19,874 (100.0%) | $50,806 |
Occupancy by Householder Income Bracket in St. Martin Parish
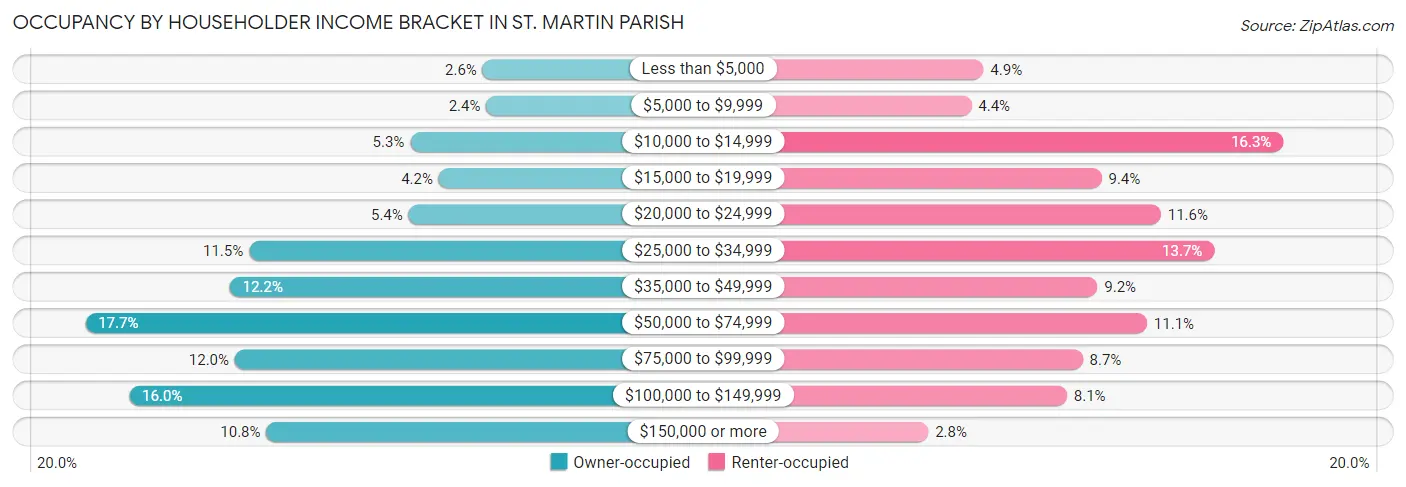
| Income Bracket | Owner-occupied | Renter-occupied |
| Less than $5,000 | 396 (2.5%) | 211 (4.9%) |
| $5,000 to $9,999 | 375 (2.4%) | 191 (4.4%) |
| $10,000 to $14,999 | 825 (5.3%) | 706 (16.3%) |
| $15,000 to $19,999 | 656 (4.2%) | 406 (9.4%) |
| $20,000 to $24,999 | 835 (5.4%) | 504 (11.6%) |
| $25,000 to $34,999 | 1,780 (11.5%) | 592 (13.7%) |
| $35,000 to $49,999 | 1,895 (12.2%) | 399 (9.2%) |
| $50,000 to $74,999 | 2,749 (17.7%) | 481 (11.1%) |
| $75,000 to $99,999 | 1,863 (12.0%) | 375 (8.6%) |
| $100,000 to $149,999 | 2,489 (16.0%) | 349 (8.1%) |
| $150,000 or more | 1,677 (10.8%) | 120 (2.8%) |
| Total | 15,540 (100.0%) | 4,334 (100.0%) |
Monthly Housing Cost Tiers in St. Martin Parish
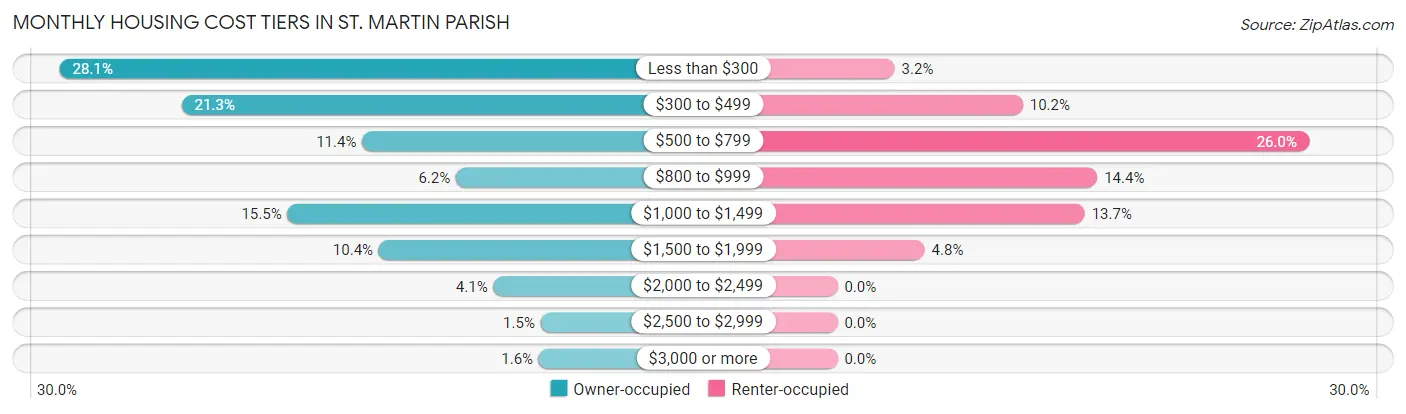
| Monthly Cost | Owner-occupied | Renter-occupied |
| Less than $300 | 4,362 (28.1%) | 137 (3.2%) |
| $300 to $499 | 3,314 (21.3%) | 444 (10.2%) |
| $500 to $799 | 1,764 (11.4%) | 1,128 (26.0%) |
| $800 to $999 | 959 (6.2%) | 622 (14.3%) |
| $1,000 to $1,499 | 2,405 (15.5%) | 592 (13.7%) |
| $1,500 to $1,999 | 1,621 (10.4%) | 209 (4.8%) |
| $2,000 to $2,499 | 637 (4.1%) | 0 (0.0%) |
| $2,500 to $2,999 | 231 (1.5%) | 0 (0.0%) |
| $3,000 or more | 247 (1.6%) | 0 (0.0%) |
| Total | 15,540 (100.0%) | 4,334 (100.0%) |
Physical Housing Characteristics in St. Martin Parish
Housing Structures in St. Martin Parish
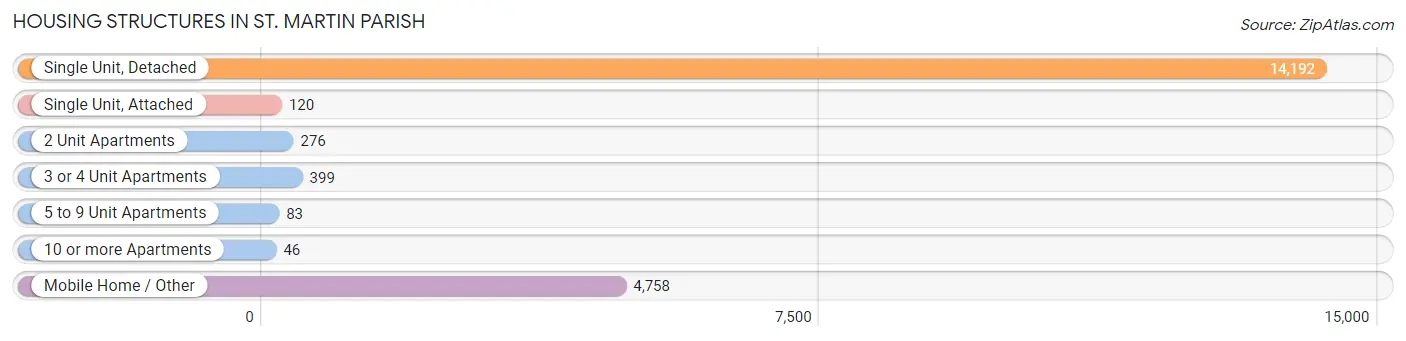
| Structure Type | # Housing Units | % Housing Units |
| Single Unit, Detached | 14,192 | 71.4% |
| Single Unit, Attached | 120 | 0.6% |
| 2 Unit Apartments | 276 | 1.4% |
| 3 or 4 Unit Apartments | 399 | 2.0% |
| 5 to 9 Unit Apartments | 83 | 0.4% |
| 10 or more Apartments | 46 | 0.2% |
| Mobile Home / Other | 4,758 | 23.9% |
| Total | 19,874 | 100.0% |
Housing Structures by Occupancy in St. Martin Parish
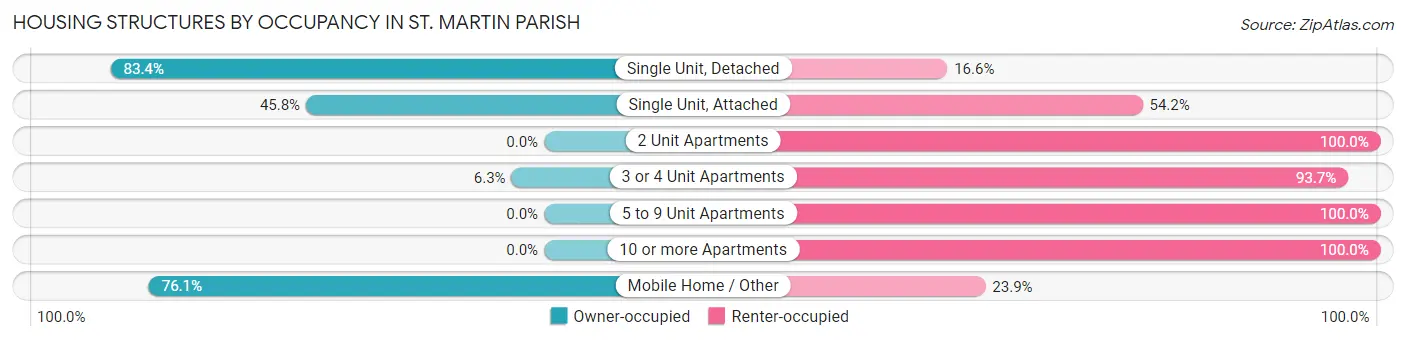
| Structure Type | Owner-occupied | Renter-occupied |
| Single Unit, Detached | 11,840 (83.4%) | 2,352 (16.6%) |
| Single Unit, Attached | 55 (45.8%) | 65 (54.2%) |
| 2 Unit Apartments | 0 (0.0%) | 276 (100.0%) |
| 3 or 4 Unit Apartments | 25 (6.3%) | 374 (93.7%) |
| 5 to 9 Unit Apartments | 0 (0.0%) | 83 (100.0%) |
| 10 or more Apartments | 0 (0.0%) | 46 (100.0%) |
| Mobile Home / Other | 3,620 (76.1%) | 1,138 (23.9%) |
| Total | 15,540 (78.2%) | 4,334 (21.8%) |
Housing Structures by Number of Rooms in St. Martin Parish
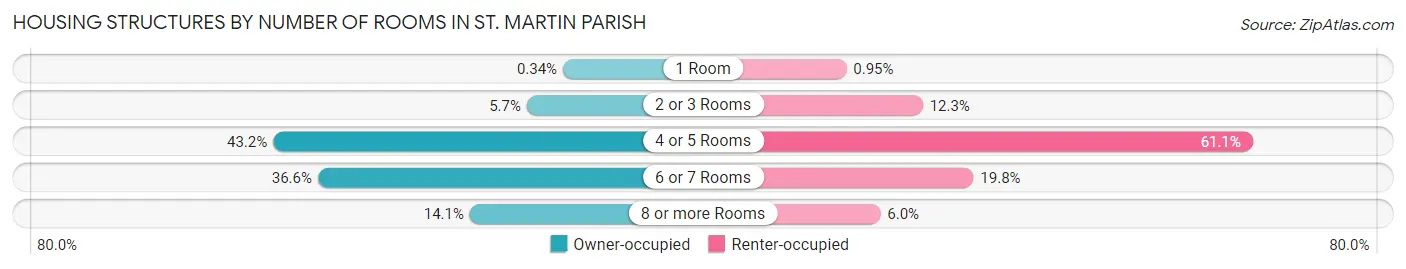
| Number of Rooms | Owner-occupied | Renter-occupied |
| 1 Room | 53 (0.3%) | 41 (0.9%) |
| 2 or 3 Rooms | 884 (5.7%) | 531 (12.2%) |
| 4 or 5 Rooms | 6,719 (43.2%) | 2,647 (61.1%) |
| 6 or 7 Rooms | 5,689 (36.6%) | 856 (19.8%) |
| 8 or more Rooms | 2,195 (14.1%) | 259 (6.0%) |
| Total | 15,540 (100.0%) | 4,334 (100.0%) |
Housing Structure by Heating Type in St. Martin Parish
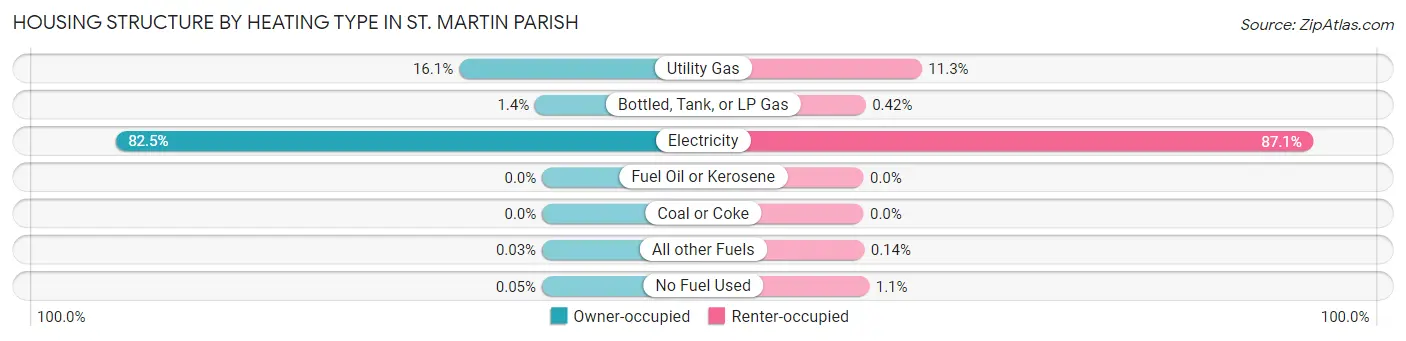
| Heating Type | Owner-occupied | Renter-occupied |
| Utility Gas | 2,496 (16.1%) | 489 (11.3%) |
| Bottled, Tank, or LP Gas | 213 (1.4%) | 18 (0.4%) |
| Electricity | 12,819 (82.5%) | 3,773 (87.1%) |
| Fuel Oil or Kerosene | 0 (0.0%) | 0 (0.0%) |
| Coal or Coke | 0 (0.0%) | 0 (0.0%) |
| All other Fuels | 4 (0.0%) | 6 (0.1%) |
| No Fuel Used | 8 (0.1%) | 48 (1.1%) |
| Total | 15,540 (100.0%) | 4,334 (100.0%) |
Household Vehicle Usage in St. Martin Parish
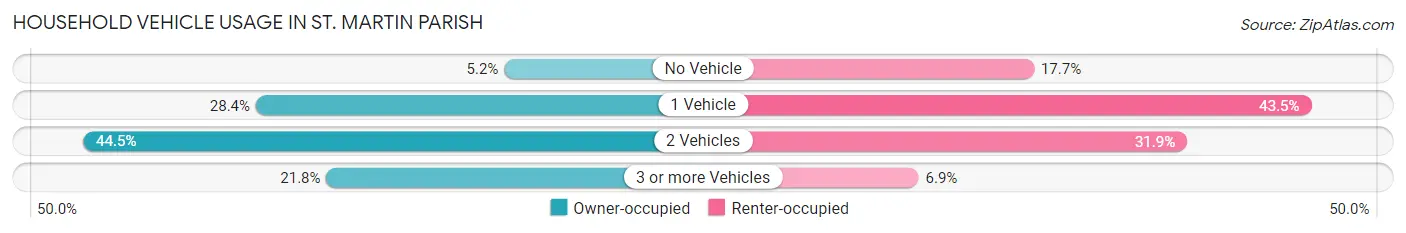
| Vehicles per Household | Owner-occupied | Renter-occupied |
| No Vehicle | 812 (5.2%) | 765 (17.6%) |
| 1 Vehicle | 4,415 (28.4%) | 1,887 (43.5%) |
| 2 Vehicles | 6,921 (44.5%) | 1,384 (31.9%) |
| 3 or more Vehicles | 3,392 (21.8%) | 298 (6.9%) |
| Total | 15,540 (100.0%) | 4,334 (100.0%) |
Real Estate & Mortgages in St. Martin Parish
Real Estate and Mortgage Overview in St. Martin Parish
| Characteristic | Without Mortgage | With Mortgage |
| Housing Units | 8,938 | 6,602 |
| Median Property Value | $97,500 | $196,000 |
| Median Household Income | $38,605 | $1,166 |
| Monthly Housing Costs | $307 | $205 |
| Real Estate Taxes | $343 | $1,182 |
Property Value by Mortgage Status in St. Martin Parish
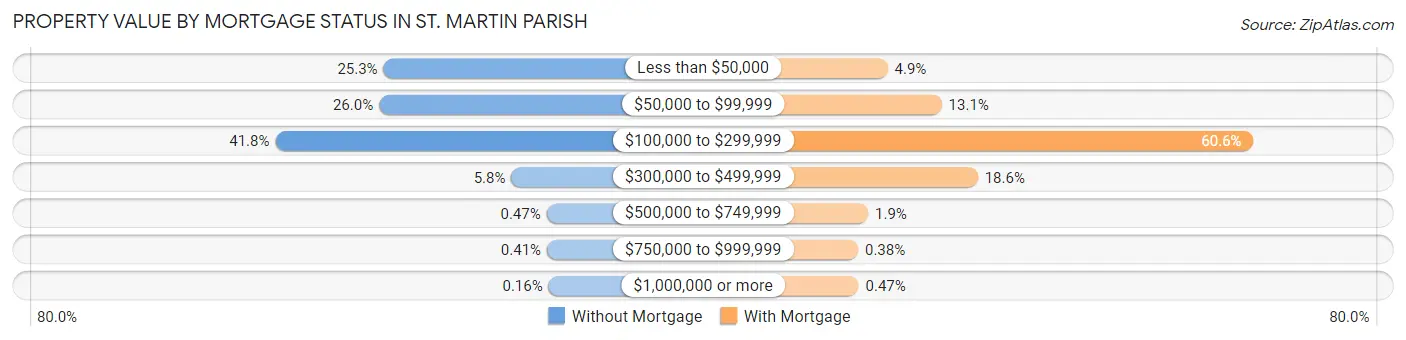
| Property Value | Without Mortgage | With Mortgage |
| Less than $50,000 | 2,263 (25.3%) | 322 (4.9%) |
| $50,000 to $99,999 | 2,324 (26.0%) | 866 (13.1%) |
| $100,000 to $299,999 | 3,736 (41.8%) | 4,003 (60.6%) |
| $300,000 to $499,999 | 522 (5.8%) | 1,229 (18.6%) |
| $500,000 to $749,999 | 42 (0.5%) | 126 (1.9%) |
| $750,000 to $999,999 | 37 (0.4%) | 25 (0.4%) |
| $1,000,000 or more | 14 (0.2%) | 31 (0.5%) |
| Total | 8,938 (100.0%) | 6,602 (100.0%) |
Household Income by Mortgage Status in St. Martin Parish
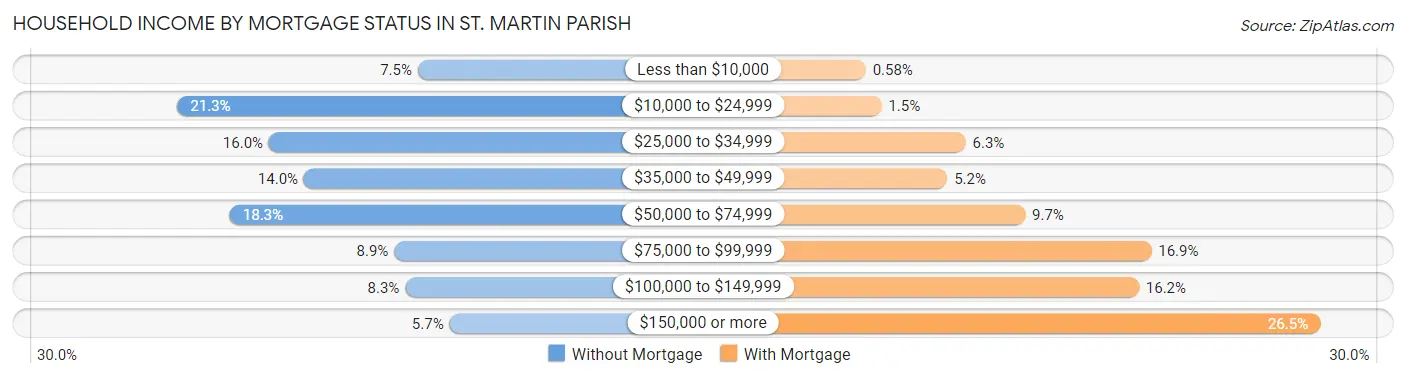
| Household Income | Without Mortgage | With Mortgage |
| Less than $10,000 | 673 (7.5%) | 38 (0.6%) |
| $10,000 to $24,999 | 1,901 (21.3%) | 98 (1.5%) |
| $25,000 to $34,999 | 1,434 (16.0%) | 415 (6.3%) |
| $35,000 to $49,999 | 1,255 (14.0%) | 346 (5.2%) |
| $50,000 to $74,999 | 1,633 (18.3%) | 640 (9.7%) |
| $75,000 to $99,999 | 794 (8.9%) | 1,116 (16.9%) |
| $100,000 to $149,999 | 737 (8.3%) | 1,069 (16.2%) |
| $150,000 or more | 511 (5.7%) | 1,752 (26.5%) |
| Total | 8,938 (100.0%) | 6,602 (100.0%) |
Property Value to Household Income Ratio in St. Martin Parish
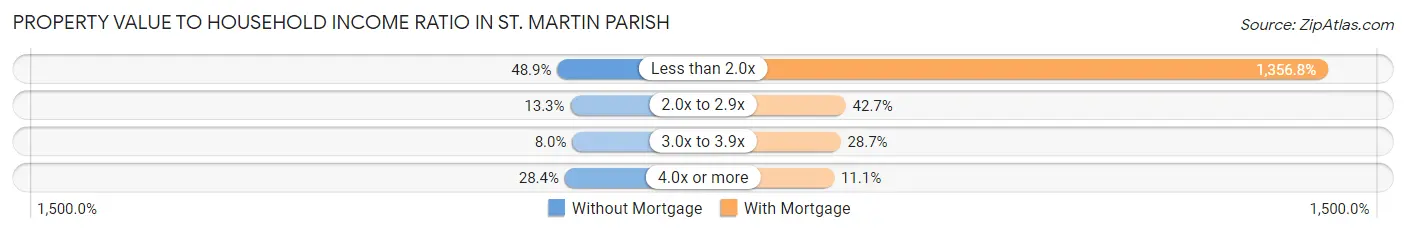
| Value-to-Income Ratio | Without Mortgage | With Mortgage |
| Less than 2.0x | 4,373 (48.9%) | 89,578 (1,356.8%) |
| 2.0x to 2.9x | 1,189 (13.3%) | 2,822 (42.7%) |
| 3.0x to 3.9x | 717 (8.0%) | 1,894 (28.7%) |
| 4.0x or more | 2,540 (28.4%) | 730 (11.1%) |
| Total | 8,938 (100.0%) | 6,602 (100.0%) |
Real Estate Taxes by Mortgage Status in St. Martin Parish
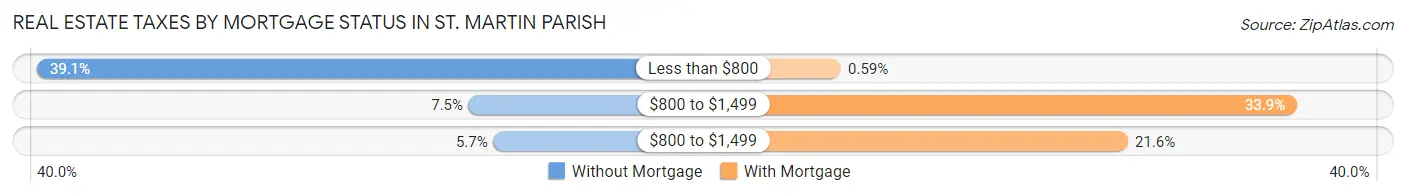
| Property Taxes | Without Mortgage | With Mortgage |
| Less than $800 | 3,495 (39.1%) | 39 (0.6%) |
| $800 to $1,499 | 674 (7.5%) | 2,238 (33.9%) |
| $800 to $1,499 | 513 (5.7%) | 1,423 (21.5%) |
| Total | 8,938 (100.0%) | 6,602 (100.0%) |
Health & Disability in St. Martin Parish
Health Insurance Coverage by Age in St. Martin Parish
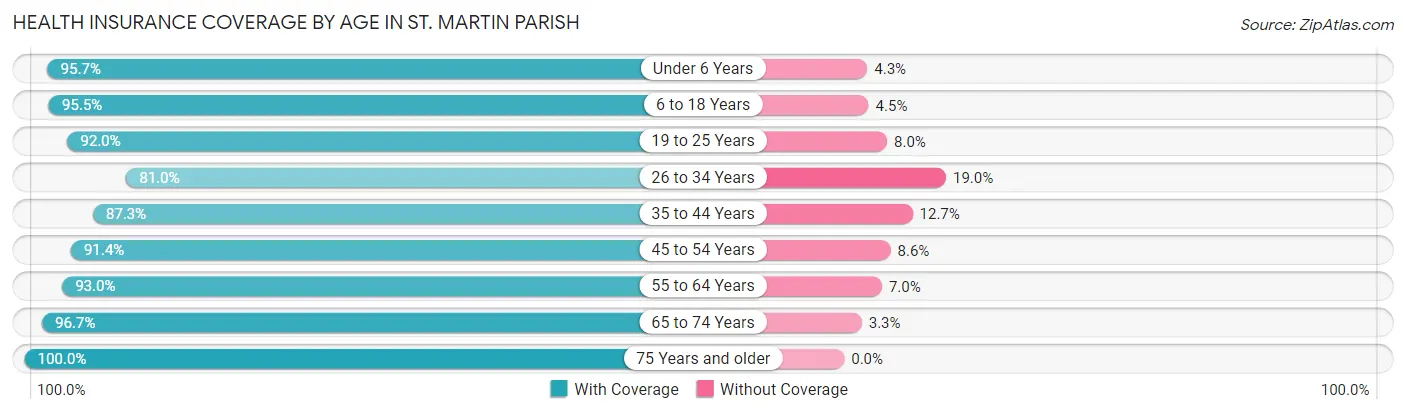
| Age Bracket | With Coverage | Without Coverage |
| Under 6 Years | 3,896 (95.7%) | 175 (4.3%) |
| 6 to 18 Years | 8,638 (95.5%) | 411 (4.5%) |
| 19 to 25 Years | 3,863 (92.0%) | 335 (8.0%) |
| 26 to 34 Years | 4,814 (81.0%) | 1,127 (19.0%) |
| 35 to 44 Years | 5,577 (87.3%) | 814 (12.7%) |
| 45 to 54 Years | 5,856 (91.4%) | 554 (8.6%) |
| 55 to 64 Years | 6,685 (93.0%) | 505 (7.0%) |
| 65 to 74 Years | 4,960 (96.7%) | 167 (3.3%) |
| 75 Years and older | 3,180 (100.0%) | 0 (0.0%) |
| Total | 47,469 (92.1%) | 4,088 (7.9%) |
Health Insurance Coverage by Citizenship Status in St. Martin Parish
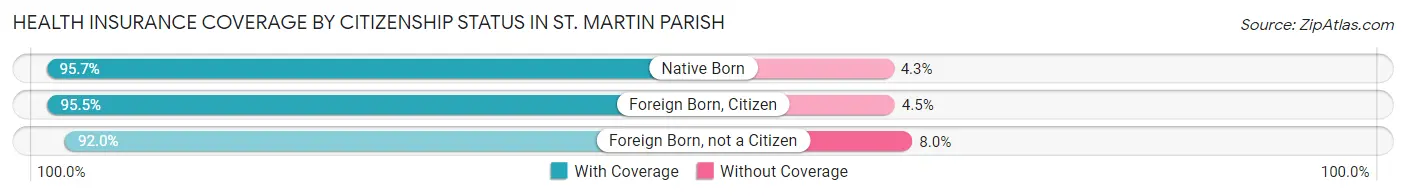
| Citizenship Status | With Coverage | Without Coverage |
| Native Born | 3,896 (95.7%) | 175 (4.3%) |
| Foreign Born, Citizen | 8,638 (95.5%) | 411 (4.5%) |
| Foreign Born, not a Citizen | 3,863 (92.0%) | 335 (8.0%) |
Health Insurance Coverage by Household Income in St. Martin Parish
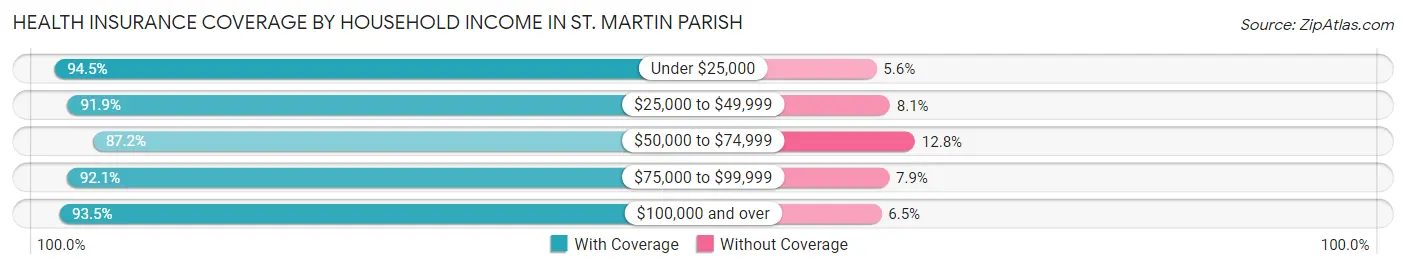
| Household Income | With Coverage | Without Coverage |
| Under $25,000 | 8,562 (94.5%) | 503 (5.6%) |
| $25,000 to $49,999 | 9,773 (91.9%) | 857 (8.1%) |
| $50,000 to $74,999 | 7,774 (87.2%) | 1,137 (12.8%) |
| $75,000 to $99,999 | 6,138 (92.1%) | 529 (7.9%) |
| $100,000 and over | 15,200 (93.5%) | 1,053 (6.5%) |
Public vs Private Health Insurance Coverage by Age in St. Martin Parish
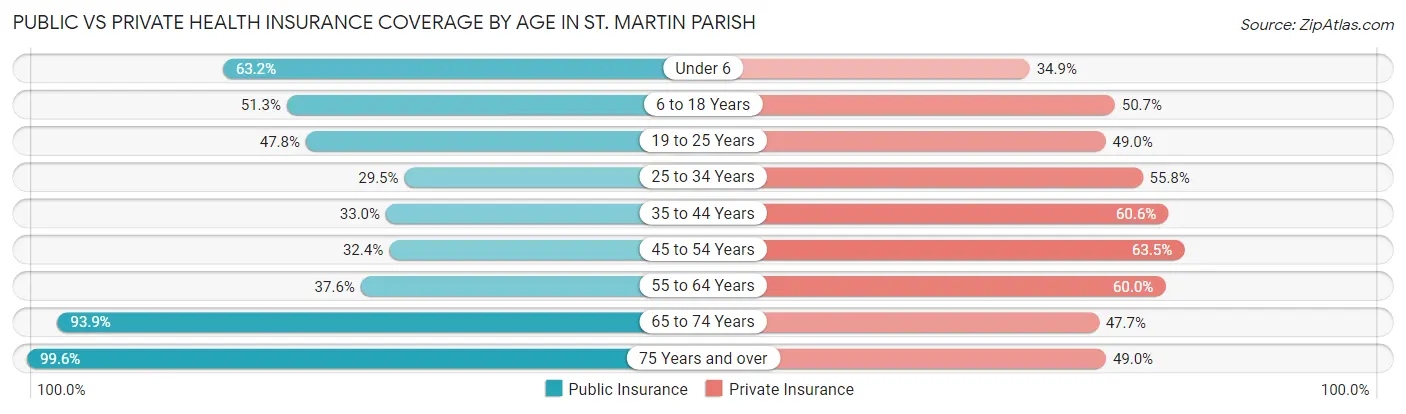
| Age Bracket | Public Insurance | Private Insurance |
| Under 6 | 2,573 (63.2%) | 1,420 (34.9%) |
| 6 to 18 Years | 4,645 (51.3%) | 4,586 (50.7%) |
| 19 to 25 Years | 2,007 (47.8%) | 2,055 (48.9%) |
| 25 to 34 Years | 1,753 (29.5%) | 3,317 (55.8%) |
| 35 to 44 Years | 2,106 (33.0%) | 3,871 (60.6%) |
| 45 to 54 Years | 2,074 (32.4%) | 4,072 (63.5%) |
| 55 to 64 Years | 2,705 (37.6%) | 4,315 (60.0%) |
| 65 to 74 Years | 4,814 (93.9%) | 2,445 (47.7%) |
| 75 Years and over | 3,166 (99.6%) | 1,559 (49.0%) |
| Total | 25,843 (50.1%) | 27,640 (53.6%) |
Disability Status by Sex by Age in St. Martin Parish
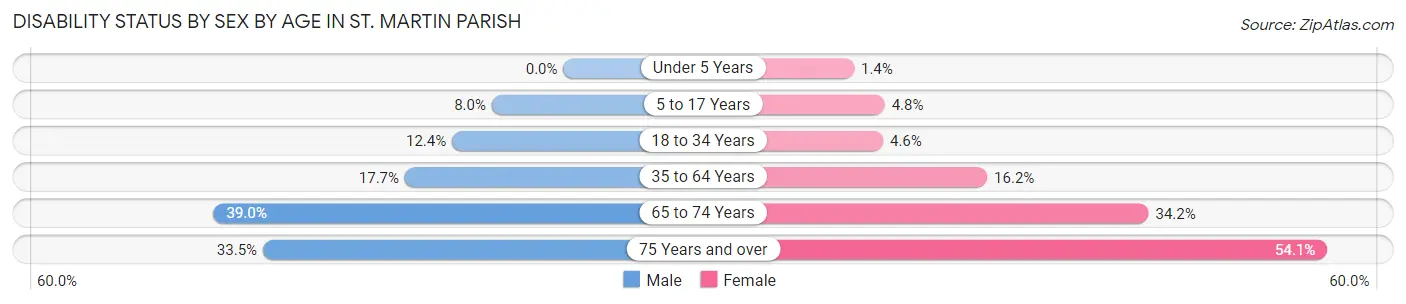
| Age Bracket | Male | Female |
| Under 5 Years | 0 (0.0%) | 22 (1.4%) |
| 5 to 17 Years | 363 (8.0%) | 220 (4.8%) |
| 18 to 34 Years | 666 (12.4%) | 250 (4.6%) |
| 35 to 64 Years | 1,731 (17.6%) | 1,649 (16.2%) |
| 65 to 74 Years | 962 (39.0%) | 908 (34.2%) |
| 75 Years and over | 456 (33.5%) | 982 (54.0%) |
Disability Class by Sex by Age in St. Martin Parish
Disability Class: Hearing Difficulty
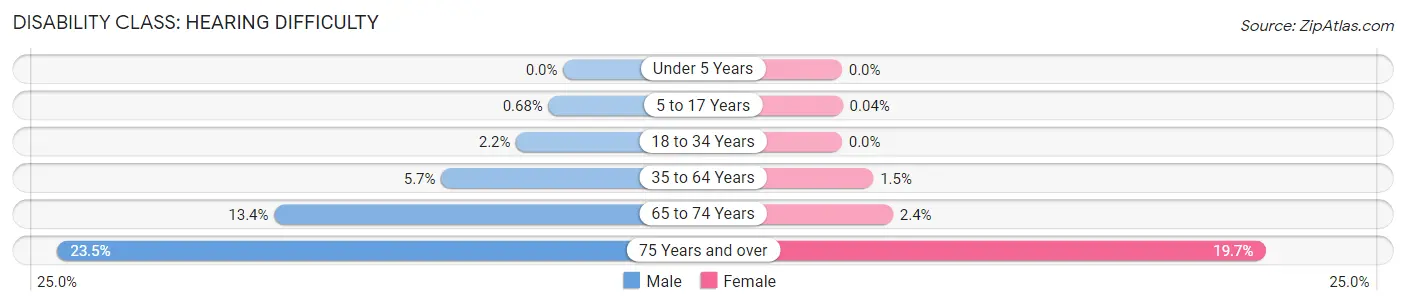
| Age Bracket | Male | Female |
| Under 5 Years | 0 (0.0%) | 0 (0.0%) |
| 5 to 17 Years | 31 (0.7%) | 2 (0.0%) |
| 18 to 34 Years | 117 (2.2%) | 0 (0.0%) |
| 35 to 64 Years | 555 (5.7%) | 149 (1.5%) |
| 65 to 74 Years | 331 (13.4%) | 63 (2.4%) |
| 75 Years and over | 320 (23.5%) | 357 (19.7%) |
Disability Class: Vision Difficulty
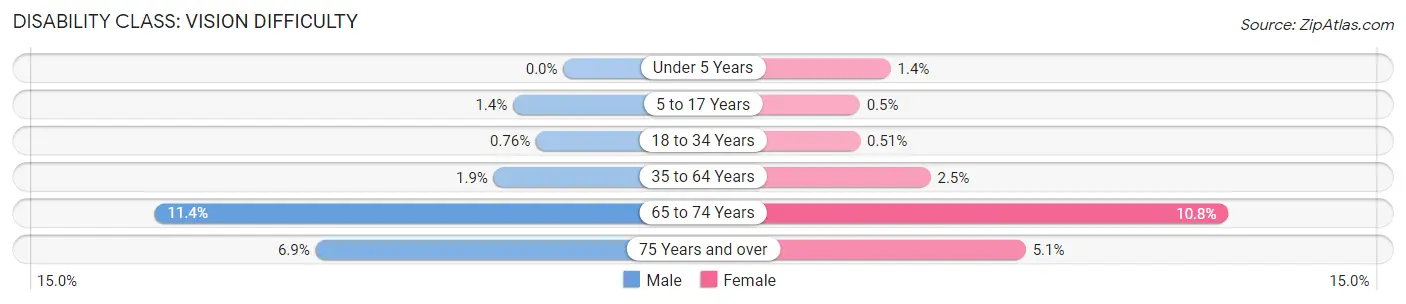
| Age Bracket | Male | Female |
| Under 5 Years | 0 (0.0%) | 22 (1.4%) |
| 5 to 17 Years | 64 (1.4%) | 23 (0.5%) |
| 18 to 34 Years | 41 (0.8%) | 28 (0.5%) |
| 35 to 64 Years | 190 (1.9%) | 252 (2.5%) |
| 65 to 74 Years | 281 (11.4%) | 286 (10.8%) |
| 75 Years and over | 94 (6.9%) | 93 (5.1%) |
Disability Class: Cognitive Difficulty
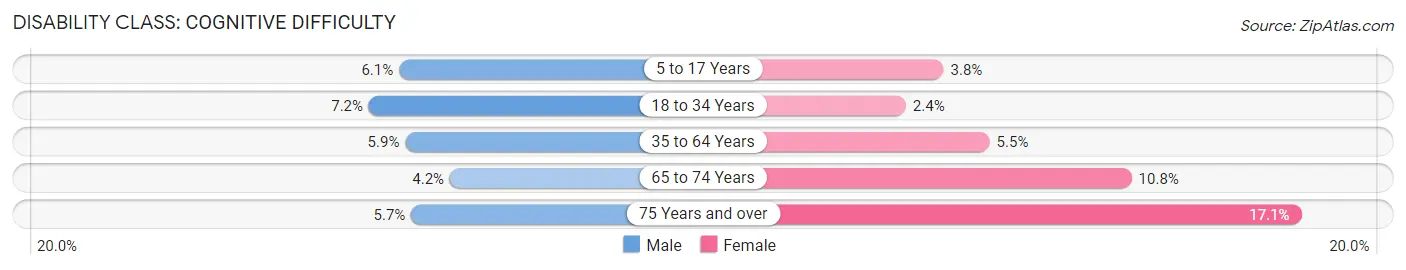
| Age Bracket | Male | Female |
| 5 to 17 Years | 278 (6.1%) | 174 (3.8%) |
| 18 to 34 Years | 388 (7.2%) | 130 (2.4%) |
| 35 to 64 Years | 576 (5.9%) | 559 (5.5%) |
| 65 to 74 Years | 104 (4.2%) | 286 (10.8%) |
| 75 Years and over | 77 (5.7%) | 310 (17.1%) |
Disability Class: Ambulatory Difficulty
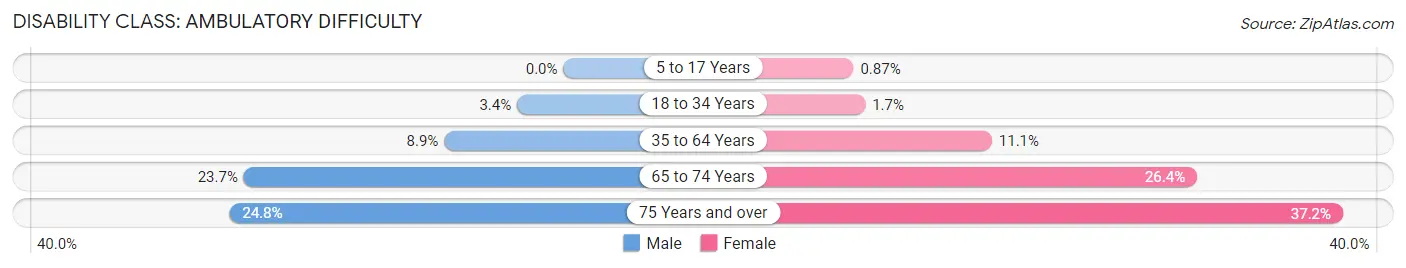
| Age Bracket | Male | Female |
| 5 to 17 Years | 0 (0.0%) | 40 (0.9%) |
| 18 to 34 Years | 185 (3.4%) | 95 (1.7%) |
| 35 to 64 Years | 868 (8.8%) | 1,135 (11.1%) |
| 65 to 74 Years | 586 (23.7%) | 701 (26.4%) |
| 75 Years and over | 338 (24.8%) | 676 (37.2%) |
Disability Class: Self-Care Difficulty

| Age Bracket | Male | Female |
| 5 to 17 Years | 0 (0.0%) | 58 (1.3%) |
| 18 to 34 Years | 129 (2.4%) | 96 (1.8%) |
| 35 to 64 Years | 274 (2.8%) | 323 (3.2%) |
| 65 to 74 Years | 304 (12.3%) | 160 (6.0%) |
| 75 Years and over | 47 (3.5%) | 356 (19.6%) |
Technology Access in St. Martin Parish
Computing Device Access in St. Martin Parish
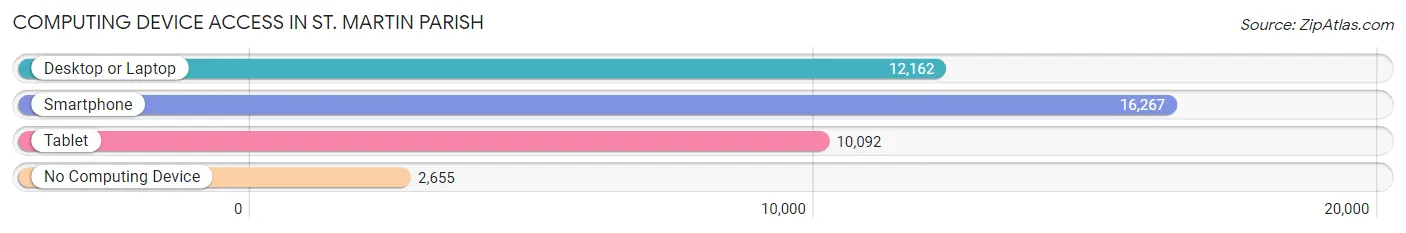
| Device Type | # Households | % Households |
| Desktop or Laptop | 12,162 | 61.2% |
| Smartphone | 16,267 | 81.9% |
| Tablet | 10,092 | 50.8% |
| No Computing Device | 2,655 | 13.4% |
| Total | 19,874 | 100.0% |
Internet Access in St. Martin Parish
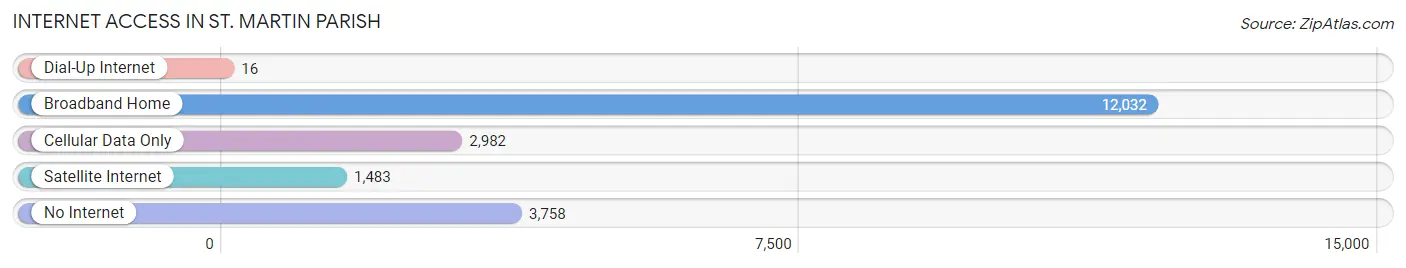
| Internet Type | # Households | % Households |
| Dial-Up Internet | 16 | 0.1% |
| Broadband Home | 12,032 | 60.5% |
| Cellular Data Only | 2,982 | 15.0% |
| Satellite Internet | 1,483 | 7.5% |
| No Internet | 3,758 | 18.9% |
| Total | 19,874 | 100.0% |
St. Martin Parish Summary
St. Martin Parish is a parish located in the state of Louisiana in the United States. It is located in the Acadiana region of the state and is part of the Lafayette Metropolitan Statistical Area. The parish seat is St. Martinville. As of the 2010 census, the population was 52,160.
Geography
St. Martin Parish is located in south-central Louisiana, bordered by Iberia, St. Mary, and Vermilion parishes to the west, Lafayette Parish to the north, and St. Landry Parish to the east. The parish is located in the Atchafalaya Basin and is home to the Atchafalaya National Wildlife Refuge. The parish has a total area of 837 square miles, of which 814 square miles is land and 23 square miles (2.7%) is water.
Economy
St. Martin Parish is home to a diverse economy. The parish is home to a variety of industries, including oil and gas, agriculture, manufacturing, and tourism. The parish is also home to several large employers, including the Port of Morgan City, the Port of Fourchon, and the Port of St. Martinville.
Agriculture is a major part of the economy in St. Martin Parish. The parish is home to a variety of crops, including sugarcane, corn, soybeans, and rice. The parish is also home to a variety of livestock, including cattle, hogs, and poultry.
Oil and gas is also a major part of the economy in St. Martin Parish. The parish is home to several oil and gas fields, including the Bayou Sale Field, the Bayou Sale South Field, and the Bayou Sale West Field.
Manufacturing is also a major part of the economy in St. Martin Parish. The parish is home to several large manufacturing companies, including the St. Martinville Manufacturing Company, the St. Martinville Refinery, and the St. Martinville Steel Mill.
Tourism is also a major part of the economy in St. Martin Parish. The parish is home to several popular tourist attractions, including the Atchafalaya National Wildlife Refuge, the St. Martinville Historic District, and the St. Martinville Cultural Heritage Center.
Demographics
As of the 2010 census, there were 52,160 people, 18,845 households, and 13,845 families residing in the parish. The population density was 64 people per square mile. There were 20,845 housing units at an average density of 26 per square mile. The racial makeup of the parish was 68.2% White, 28.3% African American, 0.3% Native American, 0.6% Asian, 0.1% Pacific Islander, 0.7% from other races, and 1.8% from two or more races. Hispanic or Latino of any race were 2.9% of the population.
There were 18,845 households, out of which 34.2% had children under the age of 18 living with them, 51.2% were married couples living together, 15.2% had a female householder with no husband present, and 28.7% were non-families. 24.2% of all households were made up of individuals, and 9.7% had someone living alone who was 65 years of age or older. The average household size was 2.68 and the average family size was 3.20.
In the parish, the population was spread out, with 26.7% under the age of 18, 9.2% from 18 to 24, 27.2% from 25 to 44, 23.7% from 45 to 64, and 13.2% who were 65 years of age or older. The median age was 36 years. For every 100 females, there were 95.2 males. For every 100 females age 18 and over, there were 92.2 males.
The median income for a household in the parish was $35,921, and the median income for a family was $42,922. Males had a median income of $35,921 versus $21,945 for females. The per capita income for the parish was $17,837. About 14.2% of families and 17.7% of the population were below the poverty line, including 24.2% of those under age 18 and 14.7% of those age 65 or over.
St. Martin Parish is a diverse and vibrant parish with a rich history and culture. The parish is home to a variety of industries, including oil and gas, agriculture, manufacturing, and tourism. The parish is also home to a variety of attractions, including the Atchafalaya National Wildlife Refuge, the St. Martinville Historic District, and the St. Martinville Cultural Heritage Center. The parish is home to a diverse population, with a median age of 36 and a median household income of $35,921.
Common Questions
What is the Total Population of St. Martin Parish?
Total Population of St. Martin Parish is 51,856.
What is the Total Male Population of St. Martin Parish?
Total Male Population of St. Martin Parish is 25,442.
What is the Total Female Population of St. Martin Parish?
Total Female Population of St. Martin Parish is 26,414.
What is the Ratio of Males per 100 Females in St. Martin Parish?
There are 96.32 Males per 100 Females in St. Martin Parish.
What is the Ratio of Females per 100 Males in St. Martin Parish?
There are 103.82 Females per 100 Males in St. Martin Parish.
What is the Median Population Age in St. Martin Parish?
Median Population Age in St. Martin Parish is 39.5 Years.
What is the Average Family Size in St. Martin Parish
Average Family Size in St. Martin Parish is 3.3 People.
What is the Average Household Size in St. Martin Parish
Average Household Size in St. Martin Parish is 2.6 People.
What is Per Capita Income in St. Martin Parish?
Per Capita income in St. Martin Parish is $28,679.
What is the Median Family Income in St. Martin Parish?
Median Family Income in St. Martin Parish is $66,417.
What is the Median Household income in St. Martin Parish?
Median Household Income in St. Martin Parish is $50,806.
What is Income or Wage Gap in St. Martin Parish?
Income or Wage Gap in St. Martin Parish is 35.4%.
Women in St. Martin Parish earn 64.6 cents for every dollar earned by a man.
What is Family Income Deficit in St. Martin Parish?
Family Income Deficit in St. Martin Parish is $9,326.
Families that are below poverty line in St. Martin Parish earn $9,326 less on average than the poverty threshold level.
What is Inequality or Gini Index in St. Martin Parish?
Inequality or Gini Index in St. Martin Parish is 0.48.
How Large is the Labor Force in St. Martin Parish?
There are 23,510 People in the Labor Forcein in St. Martin Parish.
What is the Percentage of People in the Labor Force in St. Martin Parish?
57.7% of People are in the Labor Force in St. Martin Parish.
What is the Unemployment Rate in St. Martin Parish?
Unemployment Rate in St. Martin Parish is 6.2%.