St. Landry Parish, LA
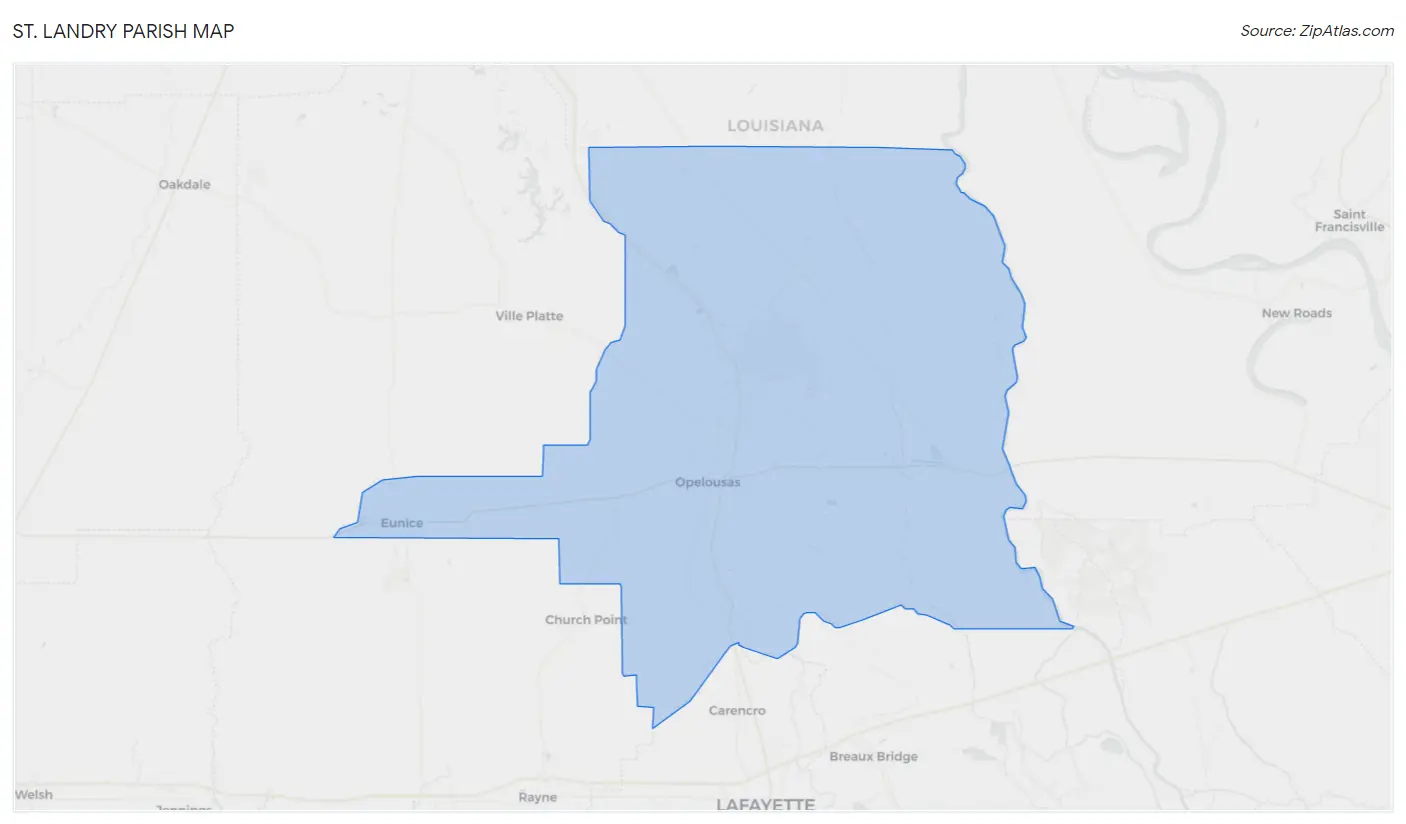
St. Landry Parish Map
St. Landry Parish Overview
82,574
TOTAL POPULATION
40,045
MALE POPULATION
42,529
FEMALE POPULATION
94.16
MALES / 100 FEMALES
106.20
FEMALES / 100 MALES
37.3
MEDIAN AGE
3.2
AVG FAMILY SIZE
2.6
AVG HOUSEHOLD SIZE
$24,413
PER CAPITA INCOME
$53,278
AVG FAMILY INCOME
$44,478
AVG HOUSEHOLD INCOME
37.9%
WAGE / INCOME GAP [ % ]
62.1¢/ $1
WAGE / INCOME GAP [ $ ]
$11,901
FAMILY INCOME DEFICIT
0.50
INEQUALITY / GINI INDEX
33,126
LABOR FORCE [ PEOPLE ]
52.4%
PERCENT IN LABOR FORCE
6.9%
UNEMPLOYMENT RATE
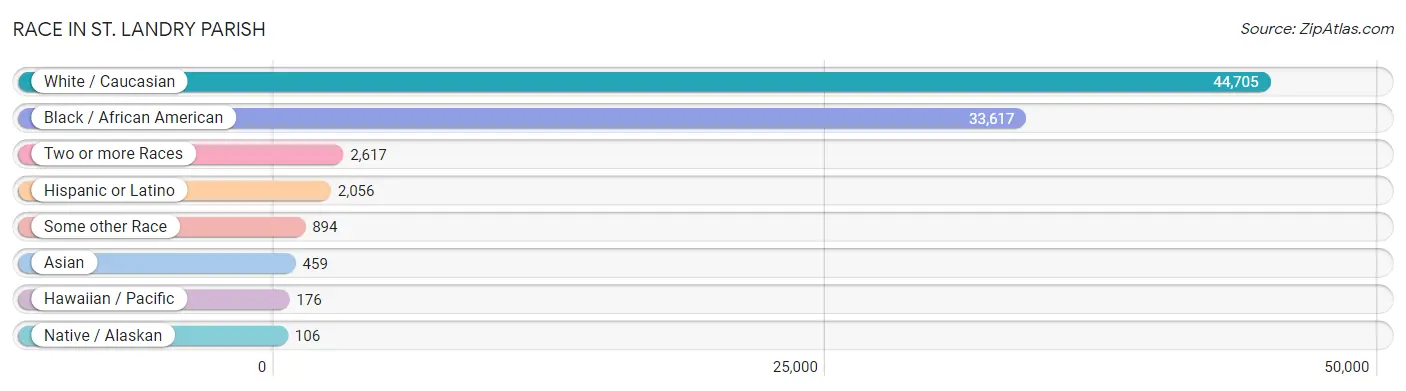
Race in St. Landry Parish
The most populous races in St. Landry Parish are White / Caucasian (44,705 | 54.1%), Black / African American (33,617 | 40.7%), and Two or more Races (2,617 | 3.2%).
| Race | # Population | % Population |
| Asian | 459 | 0.6% |
| Black / African American | 33,617 | 40.7% |
| Hawaiian / Pacific | 176 | 0.2% |
| Hispanic or Latino | 2,056 | 2.5% |
| Native / Alaskan | 106 | 0.1% |
| White / Caucasian | 44,705 | 54.1% |
| Two or more Races | 2,617 | 3.2% |
| Some other Race | 894 | 1.1% |
| Total | 82,574 | 100.0% |
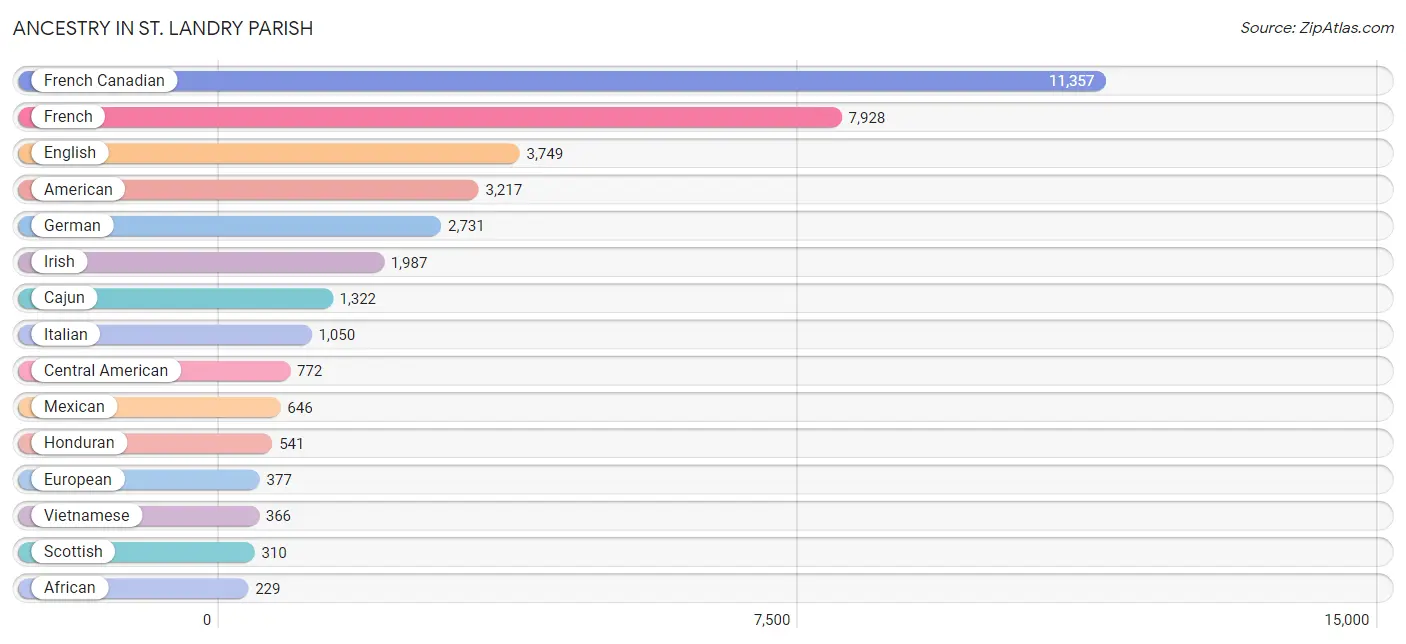
Ancestry in St. Landry Parish
The most populous ancestries reported in St. Landry Parish are French Canadian (11,357 | 13.8%), French (7,928 | 9.6%), English (3,749 | 4.5%), American (3,217 | 3.9%), and German (2,731 | 3.3%), together accounting for 35.1% of all St. Landry Parish residents.
| Ancestry | # Population | % Population |
| African | 229 | 0.3% |
| American | 3,217 | 3.9% |
| Apache | 40 | 0.1% |
| Arab | 37 | 0.0% |
| Belgian | 113 | 0.1% |
| Bhutanese | 49 | 0.1% |
| Blackfeet | 52 | 0.1% |
| Brazilian | 1 | 0.0% |
| British | 6 | 0.0% |
| Burmese | 7 | 0.0% |
| Cajun | 1,322 | 1.6% |
| Canadian | 13 | 0.0% |
| Central American | 772 | 0.9% |
| Central American Indian | 10 | 0.0% |
| Cherokee | 194 | 0.2% |
| Chilean | 32 | 0.0% |
| Chippewa | 10 | 0.0% |
| Choctaw | 20 | 0.0% |
| Colombian | 11 | 0.0% |
| Comanche | 11 | 0.0% |
| Cuban | 18 | 0.0% |
| Czech | 51 | 0.1% |
| Dominican | 175 | 0.2% |
| Dutch | 137 | 0.2% |
| Eastern European | 61 | 0.1% |
| Ecuadorian | 1 | 0.0% |
| Egyptian | 17 | 0.0% |
| English | 3,749 | 4.5% |
| European | 377 | 0.5% |
| Finnish | 12 | 0.0% |
| French | 7,928 | 9.6% |
| French American Indian | 1 | 0.0% |
| French Canadian | 11,357 | 13.8% |
| German | 2,731 | 3.3% |
| Greek | 6 | 0.0% |
| Guatemalan | 53 | 0.1% |
| Haitian | 28 | 0.0% |
| Honduran | 541 | 0.7% |
| Houma | 33 | 0.0% |
| Indian (Asian) | 25 | 0.0% |
| Irish | 1,987 | 2.4% |
| Italian | 1,050 | 1.3% |
| Laotian | 2 | 0.0% |
| Lebanese | 3 | 0.0% |
| Lithuanian | 15 | 0.0% |
| Mexican | 646 | 0.8% |
| Native Hawaiian | 197 | 0.2% |
| Navajo | 16 | 0.0% |
| Norwegian | 22 | 0.0% |
| Panamanian | 168 | 0.2% |
| Polish | 15 | 0.0% |
| Portuguese | 43 | 0.1% |
| Puerto Rican | 12 | 0.0% |
| Russian | 44 | 0.1% |
| Salvadoran | 10 | 0.0% |
| Scandinavian | 46 | 0.1% |
| Scotch-Irish | 184 | 0.2% |
| Scottish | 310 | 0.4% |
| Seminole | 17 | 0.0% |
| Slovak | 17 | 0.0% |
| South American | 44 | 0.1% |
| Spaniard | 66 | 0.1% |
| Spanish | 118 | 0.1% |
| Spanish American | 118 | 0.1% |
| Sri Lankan | 37 | 0.0% |
| Subsaharan African | 229 | 0.3% |
| Swedish | 53 | 0.1% |
| Swiss | 6 | 0.0% |
| Syrian | 17 | 0.0% |
| Thai | 24 | 0.0% |
| Ukrainian | 202 | 0.2% |
| Vietnamese | 366 | 0.4% |
| Welsh | 25 | 0.0% | View All 73 Rows |
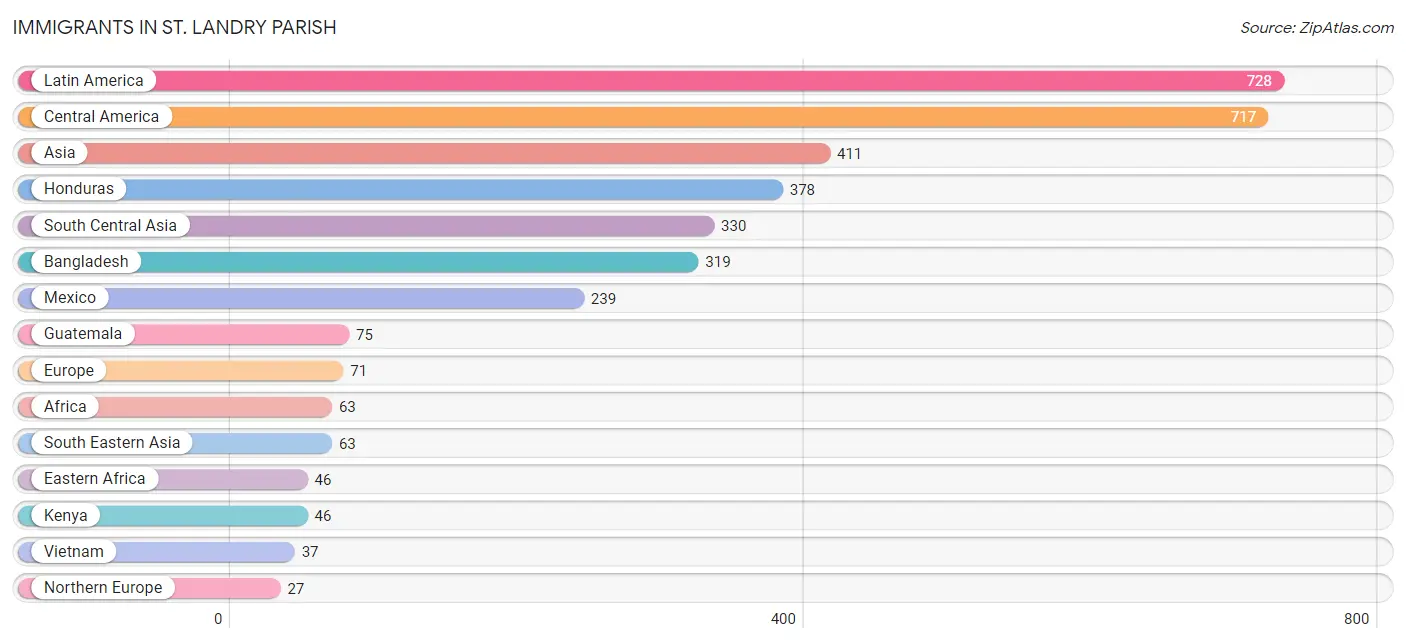
Immigrants in St. Landry Parish
The most numerous immigrant groups reported in St. Landry Parish came from Latin America (728 | 0.9%), Central America (717 | 0.9%), Asia (411 | 0.5%), Honduras (378 | 0.5%), and South Central Asia (330 | 0.4%), together accounting for 3.1% of all St. Landry Parish residents.
| Immigration Origin | # Population | % Population |
| Africa | 63 | 0.1% |
| Asia | 411 | 0.5% |
| Bangladesh | 319 | 0.4% |
| Brazil | 1 | 0.0% |
| Caribbean | 10 | 0.0% |
| Central America | 717 | 0.9% |
| Cuba | 8 | 0.0% |
| Dominican Republic | 2 | 0.0% |
| Eastern Africa | 46 | 0.1% |
| Eastern Asia | 14 | 0.0% |
| Eastern Europe | 21 | 0.0% |
| Egypt | 17 | 0.0% |
| Europe | 71 | 0.1% |
| France | 1 | 0.0% |
| Germany | 22 | 0.0% |
| Guatemala | 75 | 0.1% |
| Honduras | 378 | 0.5% |
| India | 4 | 0.0% |
| Indonesia | 2 | 0.0% |
| Ireland | 19 | 0.0% |
| Japan | 14 | 0.0% |
| Kenya | 46 | 0.1% |
| Kuwait | 4 | 0.0% |
| Latin America | 728 | 0.9% |
| Mexico | 239 | 0.3% |
| Nepal | 7 | 0.0% |
| Northern Africa | 17 | 0.0% |
| Northern Europe | 27 | 0.0% |
| Panama | 25 | 0.0% |
| Philippines | 24 | 0.0% |
| South America | 1 | 0.0% |
| South Central Asia | 330 | 0.4% |
| South Eastern Asia | 63 | 0.1% |
| Ukraine | 21 | 0.0% |
| Vietnam | 37 | 0.0% |
| Western Asia | 4 | 0.0% |
| Western Europe | 23 | 0.0% | View All 37 Rows |
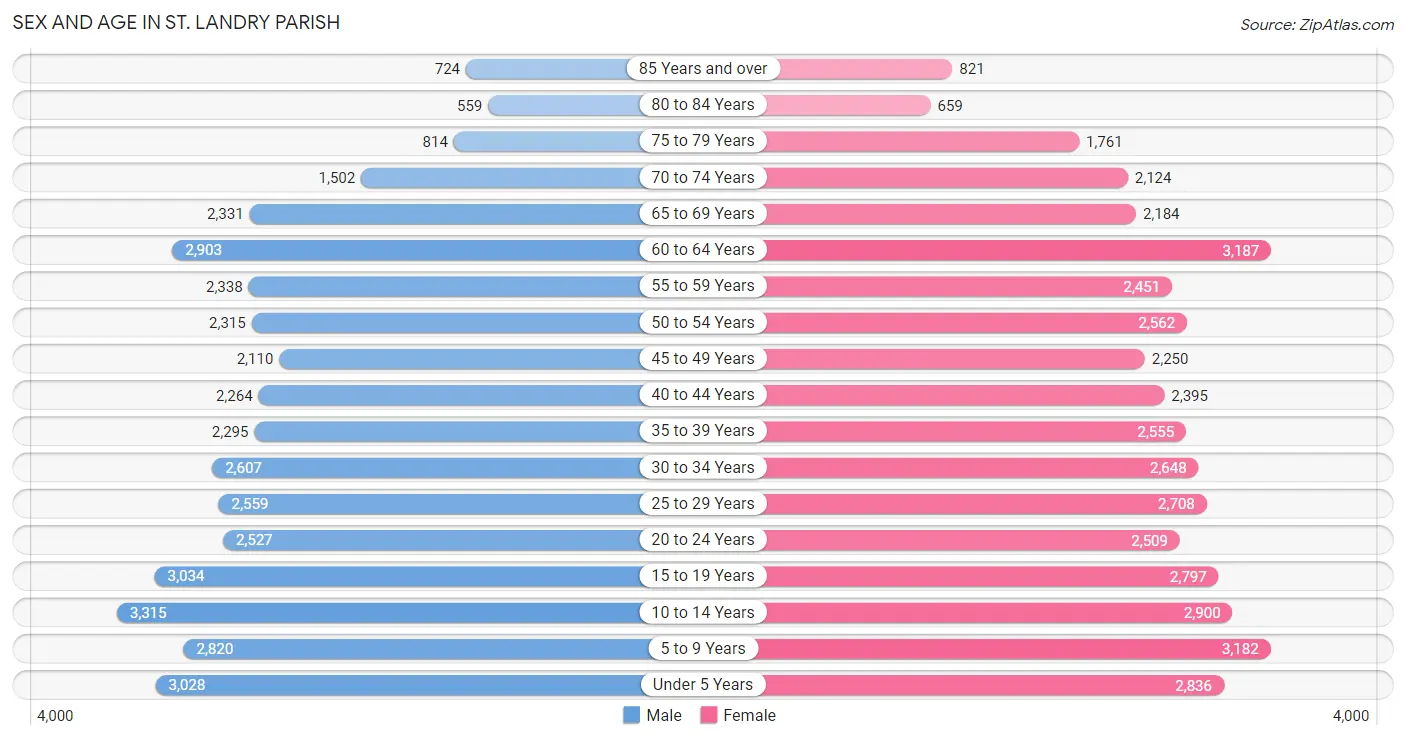
Sex and Age in St. Landry Parish
Sex and Age in St. Landry Parish
The most populous age groups in St. Landry Parish are 10 to 14 Years (3,315 | 8.3%) for men and 60 to 64 Years (3,187 | 7.5%) for women.
| Age Bracket | Male | Female |
| Under 5 Years | 3,028 (7.6%) | 2,836 (6.7%) |
| 5 to 9 Years | 2,820 (7.0%) | 3,182 (7.5%) |
| 10 to 14 Years | 3,315 (8.3%) | 2,900 (6.8%) |
| 15 to 19 Years | 3,034 (7.6%) | 2,797 (6.6%) |
| 20 to 24 Years | 2,527 (6.3%) | 2,509 (5.9%) |
| 25 to 29 Years | 2,559 (6.4%) | 2,708 (6.4%) |
| 30 to 34 Years | 2,607 (6.5%) | 2,648 (6.2%) |
| 35 to 39 Years | 2,295 (5.7%) | 2,555 (6.0%) |
| 40 to 44 Years | 2,264 (5.7%) | 2,395 (5.6%) |
| 45 to 49 Years | 2,110 (5.3%) | 2,250 (5.3%) |
| 50 to 54 Years | 2,315 (5.8%) | 2,562 (6.0%) |
| 55 to 59 Years | 2,338 (5.8%) | 2,451 (5.8%) |
| 60 to 64 Years | 2,903 (7.2%) | 3,187 (7.5%) |
| 65 to 69 Years | 2,331 (5.8%) | 2,184 (5.1%) |
| 70 to 74 Years | 1,502 (3.7%) | 2,124 (5.0%) |
| 75 to 79 Years | 814 (2.0%) | 1,761 (4.1%) |
| 80 to 84 Years | 559 (1.4%) | 659 (1.5%) |
| 85 Years and over | 724 (1.8%) | 821 (1.9%) |
| Total | 40,045 (100.0%) | 42,529 (100.0%) |
Families and Households in St. Landry Parish
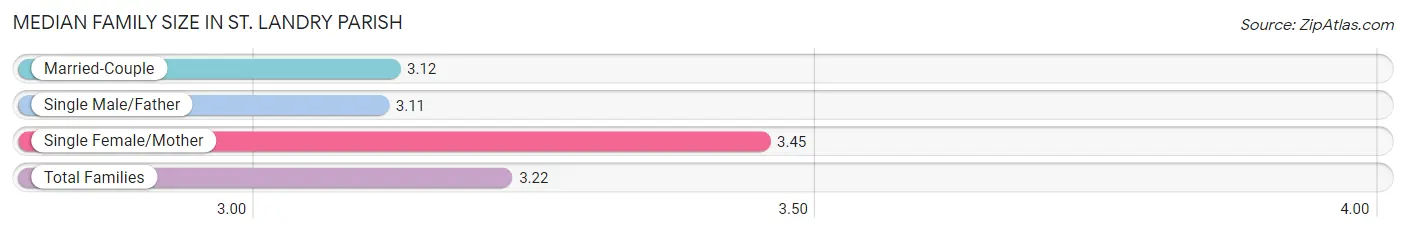
Median Family Size in St. Landry Parish
The median family size in St. Landry Parish is 3.22 persons per family, with single female/mother families (6,071 | 29.1%) accounting for the largest median family size of 3.45 persons per family. On the other hand, single male/father families (1,844 | 8.8%) represent the smallest median family size with 3.11 persons per family.
| Family Type | # Families | Family Size |
| Married-Couple | 12,920 (62.0%) | 3.12 |
| Single Male/Father | 1,844 (8.8%) | 3.11 |
| Single Female/Mother | 6,071 (29.1%) | 3.45 |
| Total Families | 20,835 (100.0%) | 3.22 |
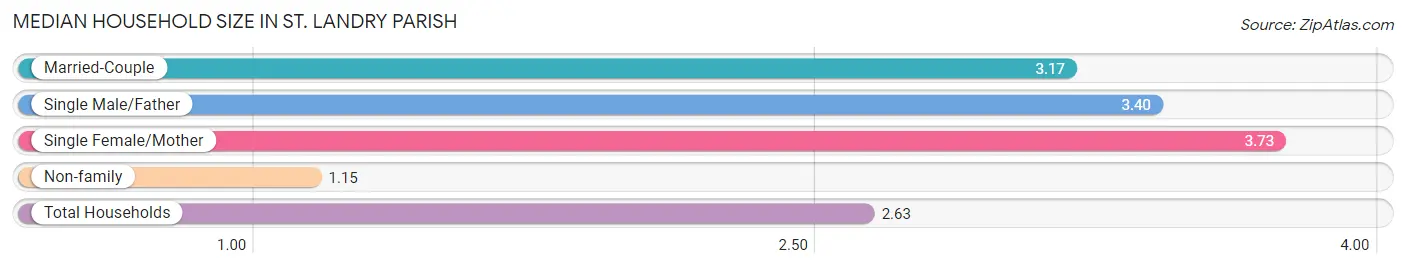
Median Household Size in St. Landry Parish
The median household size in St. Landry Parish is 2.63 persons per household, with single female/mother households (6,071 | 19.7%) accounting for the largest median household size of 3.73 persons per household. non-family households (10,053 | 32.6%) represent the smallest median household size with 1.15 persons per household.
| Household Type | # Households | Household Size |
| Married-Couple | 12,920 (41.8%) | 3.17 |
| Single Male/Father | 1,844 (6.0%) | 3.40 |
| Single Female/Mother | 6,071 (19.7%) | 3.73 |
| Non-family | 10,053 (32.6%) | 1.15 |
| Total Households | 30,888 (100.0%) | 2.63 |
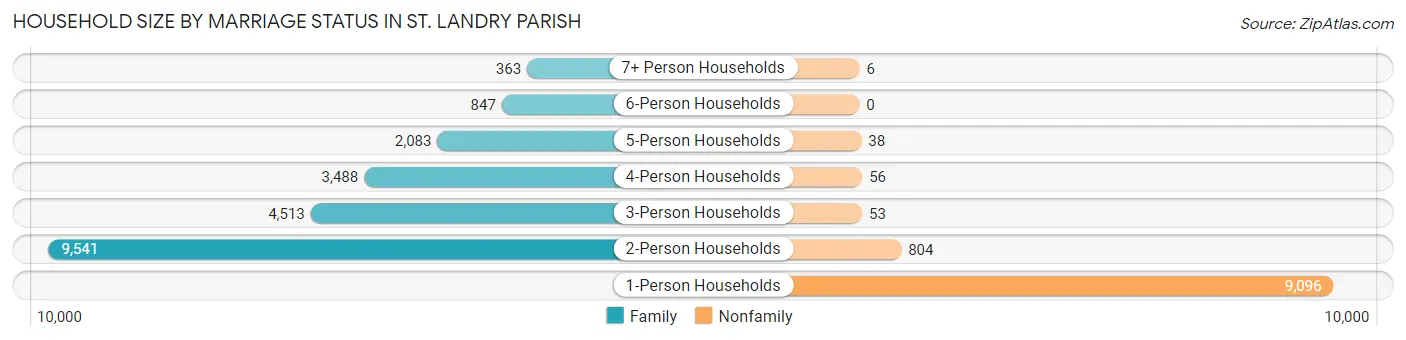
Household Size by Marriage Status in St. Landry Parish
Out of a total of 30,888 households in St. Landry Parish, 20,835 (67.4%) are family households, while 10,053 (32.6%) are nonfamily households. The most numerous type of family households are 2-person households, comprising 9,541, and the most common type of nonfamily households are 1-person households, comprising 9,096.
| Household Size | Family Households | Nonfamily Households |
| 1-Person Households | - | 9,096 (29.4%) |
| 2-Person Households | 9,541 (30.9%) | 804 (2.6%) |
| 3-Person Households | 4,513 (14.6%) | 53 (0.2%) |
| 4-Person Households | 3,488 (11.3%) | 56 (0.2%) |
| 5-Person Households | 2,083 (6.7%) | 38 (0.1%) |
| 6-Person Households | 847 (2.7%) | 0 (0.0%) |
| 7+ Person Households | 363 (1.2%) | 6 (0.0%) |
| Total | 20,835 (67.4%) | 10,053 (32.6%) |
Female Fertility in St. Landry Parish
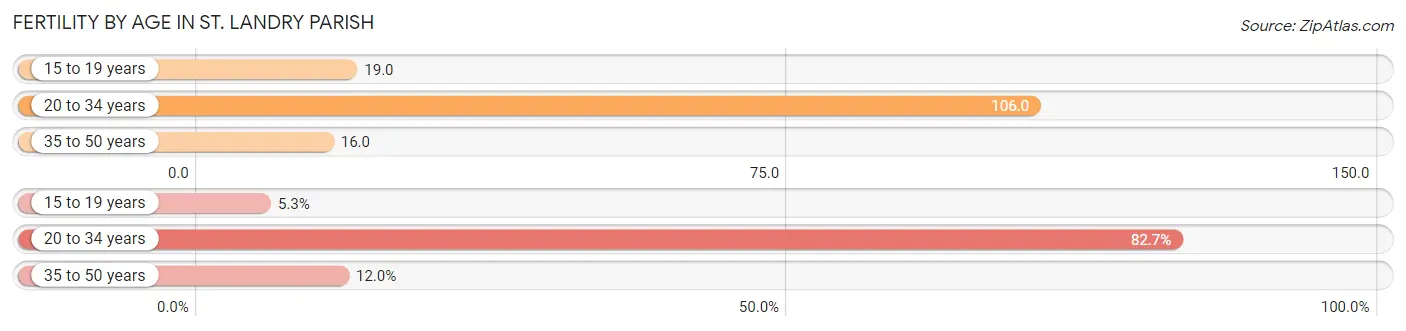
Fertility by Age in St. Landry Parish
Average fertility rate in St. Landry Parish is 55.0 births per 1,000 women. Women in the age bracket of 20 to 34 years have the highest fertility rate with 106.0 births per 1,000 women. Women in the age bracket of 20 to 34 years acount for 82.7% of all women with births.
| Age Bracket | Women with Births | Births / 1,000 Women |
| 15 to 19 years | 54 (5.3%) | 19.0 |
| 20 to 34 years | 837 (82.7%) | 106.0 |
| 35 to 50 years | 121 (12.0%) | 16.0 |
| Total | 1,012 (100.0%) | 55.0 |
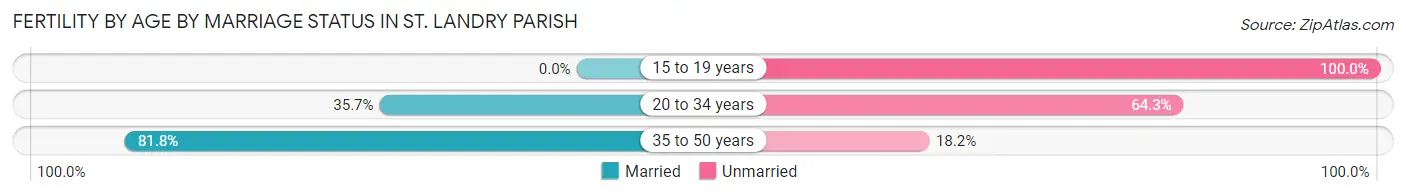
Fertility by Age by Marriage Status in St. Landry Parish
39.3% of women with births (1,012) in St. Landry Parish are married. The highest percentage of unmarried women with births falls into 15 to 19 years age bracket with 100.0% of them unmarried at the time of birth, while the lowest percentage of unmarried women with births belong to 35 to 50 years age bracket with 18.2% of them unmarried.
| Age Bracket | Married | Unmarried |
| 15 to 19 years | 0 (0.0%) | 54 (100.0%) |
| 20 to 34 years | 299 (35.7%) | 538 (64.3%) |
| 35 to 50 years | 99 (81.8%) | 22 (18.2%) |
| Total | 398 (39.3%) | 614 (60.7%) |
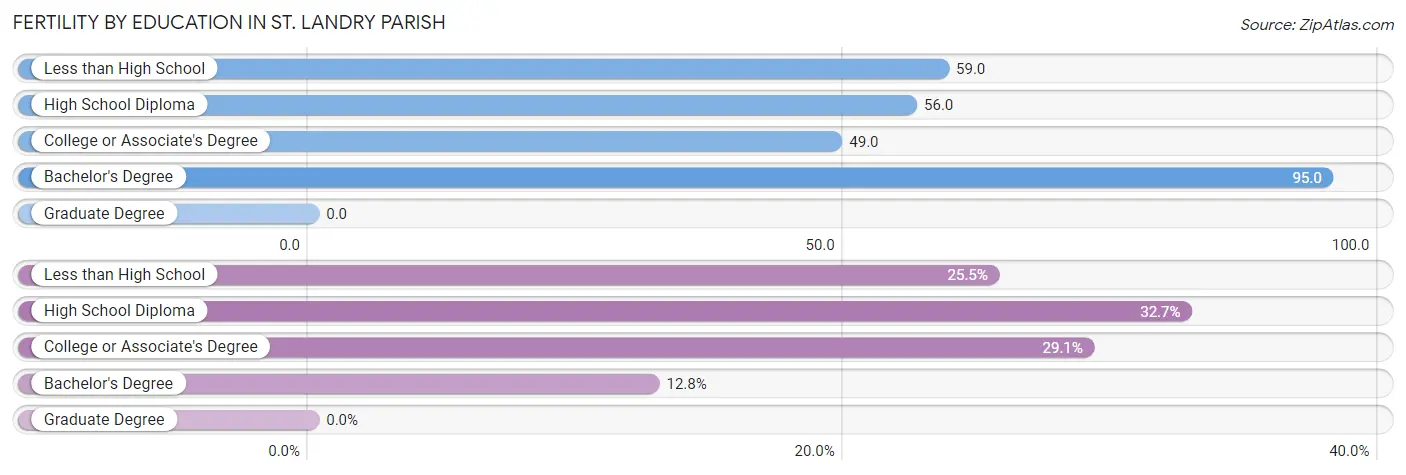
Fertility by Education in St. Landry Parish
| Educational Attainment | Women with Births | Births / 1,000 Women |
| Less than High School | 258 (25.5%) | 59.0 |
| High School Diploma | 331 (32.7%) | 56.0 |
| College or Associate's Degree | 294 (29.0%) | 49.0 |
| Bachelor's Degree | 129 (12.8%) | 95.0 |
| Graduate Degree | 0 (0.0%) | 0.0 |
| Total | 1,012 (100.0%) | 55.0 |
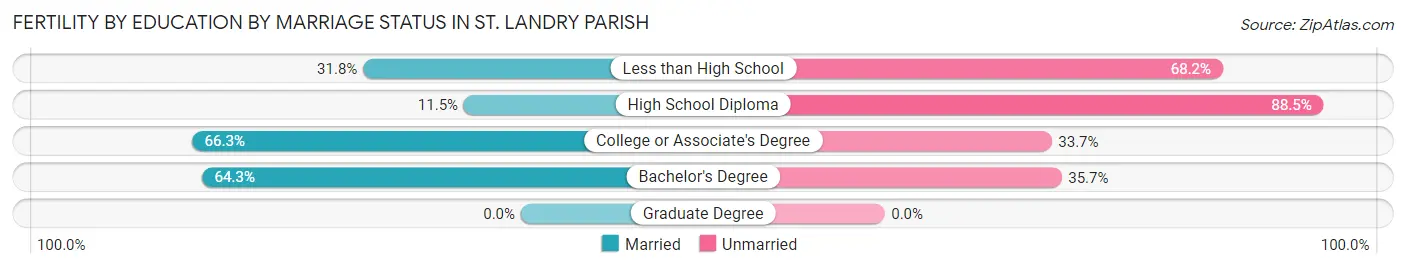
Fertility by Education by Marriage Status in St. Landry Parish
60.7% of women with births in St. Landry Parish are unmarried. Women with the educational attainment of college or associate's degree are most likely to be married with 66.3% of them married at childbirth, while women with the educational attainment of high school diploma are least likely to be married with 88.5% of them unmarried at childbirth.
| Educational Attainment | Married | Unmarried |
| Less than High School | 82 (31.8%) | 176 (68.2%) |
| High School Diploma | 38 (11.5%) | 293 (88.5%) |
| College or Associate's Degree | 195 (66.3%) | 99 (33.7%) |
| Bachelor's Degree | 83 (64.3%) | 46 (35.7%) |
| Graduate Degree | 0 (0.0%) | 0 (0.0%) |
| Total | 398 (39.3%) | 614 (60.7%) |
Income in St. Landry Parish
Income Overview in St. Landry Parish
Per Capita Income in St. Landry Parish is $24,413, while median incomes of families and households are $53,278 and $44,478 respectively.
| Characteristic | Number | Measure |
| Per Capita Income | 82,574 | $24,413 |
| Median Family Income | 20,835 | $53,278 |
| Mean Family Income | 20,835 | $70,099 |
| Median Household Income | 30,888 | $44,478 |
| Mean Household Income | 30,888 | $62,361 |
| Income Deficit | 20,835 | $11,901 |
| Wage / Income Gap (%) | 82,574 | 37.94% |
| Wage / Income Gap ($) | 82,574 | 62.06¢ per $1 |
| Gini / Inequality Index | 82,574 | 0.50 |
Earnings by Sex in St. Landry Parish
Average Earnings in St. Landry Parish are $33,204, $42,635 for men and $26,461 for women, a difference of 37.9%.
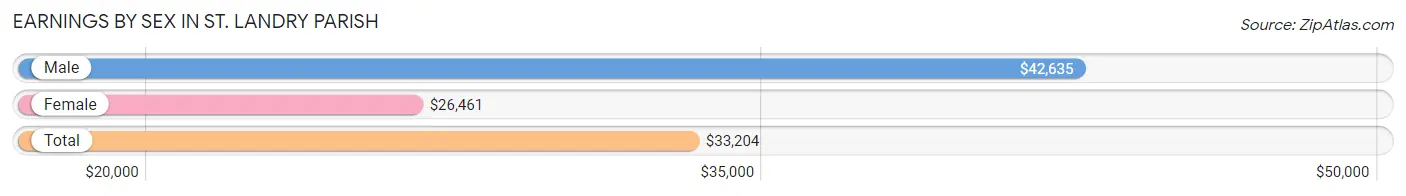
| Sex | Number | Average Earnings |
| Male | 17,671 (52.4%) | $42,635 |
| Female | 16,017 (47.5%) | $26,461 |
| Total | 33,688 (100.0%) | $33,204 |
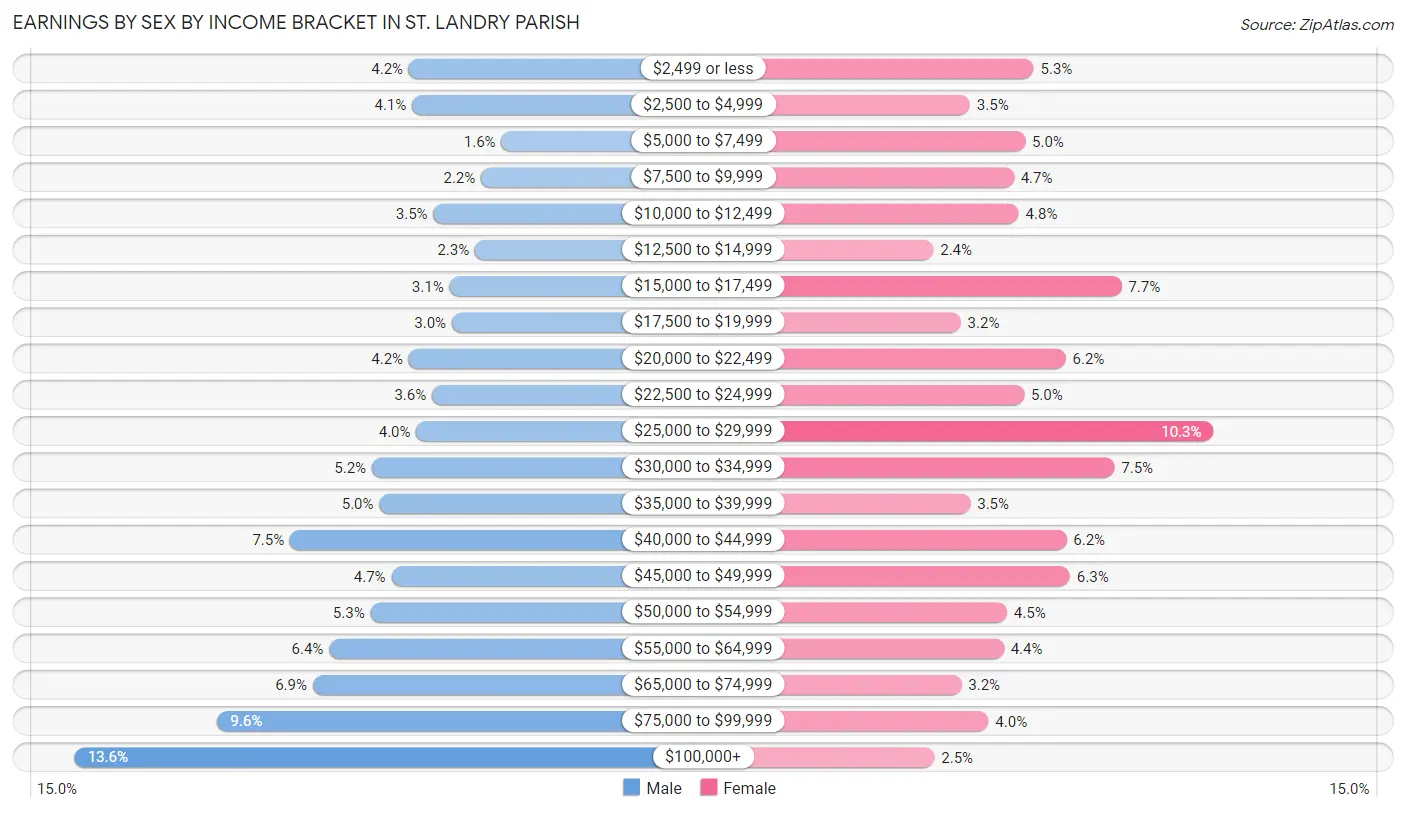
Earnings by Sex by Income Bracket in St. Landry Parish
The most common earnings brackets in St. Landry Parish are $100,000+ for men (2,401 | 13.6%) and $25,000 to $29,999 for women (1,649 | 10.3%).
| Income | Male | Female |
| $2,499 or less | 743 (4.2%) | 841 (5.2%) |
| $2,500 to $4,999 | 726 (4.1%) | 554 (3.5%) |
| $5,000 to $7,499 | 282 (1.6%) | 802 (5.0%) |
| $7,500 to $9,999 | 384 (2.2%) | 751 (4.7%) |
| $10,000 to $12,499 | 620 (3.5%) | 774 (4.8%) |
| $12,500 to $14,999 | 414 (2.3%) | 389 (2.4%) |
| $15,000 to $17,499 | 540 (3.1%) | 1,236 (7.7%) |
| $17,500 to $19,999 | 528 (3.0%) | 513 (3.2%) |
| $20,000 to $22,499 | 742 (4.2%) | 985 (6.1%) |
| $22,500 to $24,999 | 628 (3.5%) | 797 (5.0%) |
| $25,000 to $29,999 | 705 (4.0%) | 1,649 (10.3%) |
| $30,000 to $34,999 | 926 (5.2%) | 1,205 (7.5%) |
| $35,000 to $39,999 | 888 (5.0%) | 555 (3.5%) |
| $40,000 to $44,999 | 1,332 (7.5%) | 989 (6.2%) |
| $45,000 to $49,999 | 828 (4.7%) | 1,004 (6.3%) |
| $50,000 to $54,999 | 933 (5.3%) | 720 (4.5%) |
| $55,000 to $64,999 | 1,138 (6.4%) | 706 (4.4%) |
| $65,000 to $74,999 | 1,220 (6.9%) | 515 (3.2%) |
| $75,000 to $99,999 | 1,693 (9.6%) | 638 (4.0%) |
| $100,000+ | 2,401 (13.6%) | 394 (2.5%) |
| Total | 17,671 (100.0%) | 16,017 (100.0%) |
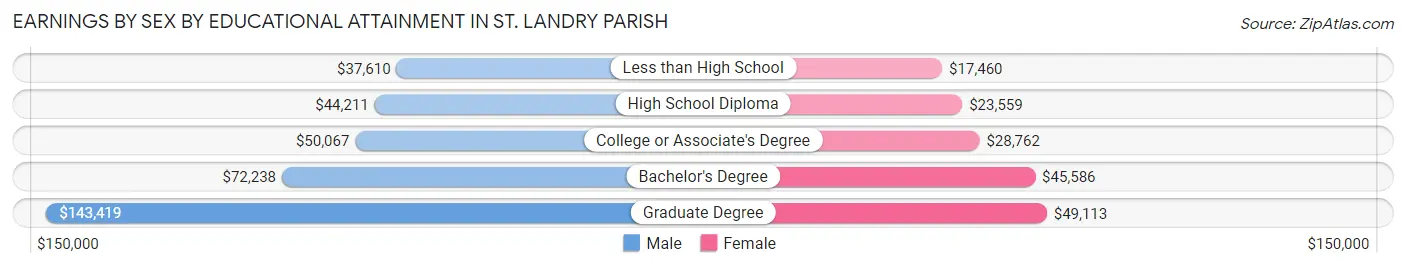
Earnings by Sex by Educational Attainment in St. Landry Parish
Average earnings in St. Landry Parish are $47,337 for men and $29,135 for women, a difference of 38.5%. Men with an educational attainment of graduate degree enjoy the highest average annual earnings of $143,419, while those with less than high school education earn the least with $37,610. Women with an educational attainment of graduate degree earn the most with the average annual earnings of $49,113, while those with less than high school education have the smallest earnings of $17,460.
| Educational Attainment | Male Income | Female Income |
| Less than High School | $37,610 | $17,460 |
| High School Diploma | $44,211 | $23,559 |
| College or Associate's Degree | $50,067 | $28,762 |
| Bachelor's Degree | $72,238 | $45,586 |
| Graduate Degree | $143,419 | $49,113 |
| Total | $47,337 | $29,135 |
Family Income in St. Landry Parish
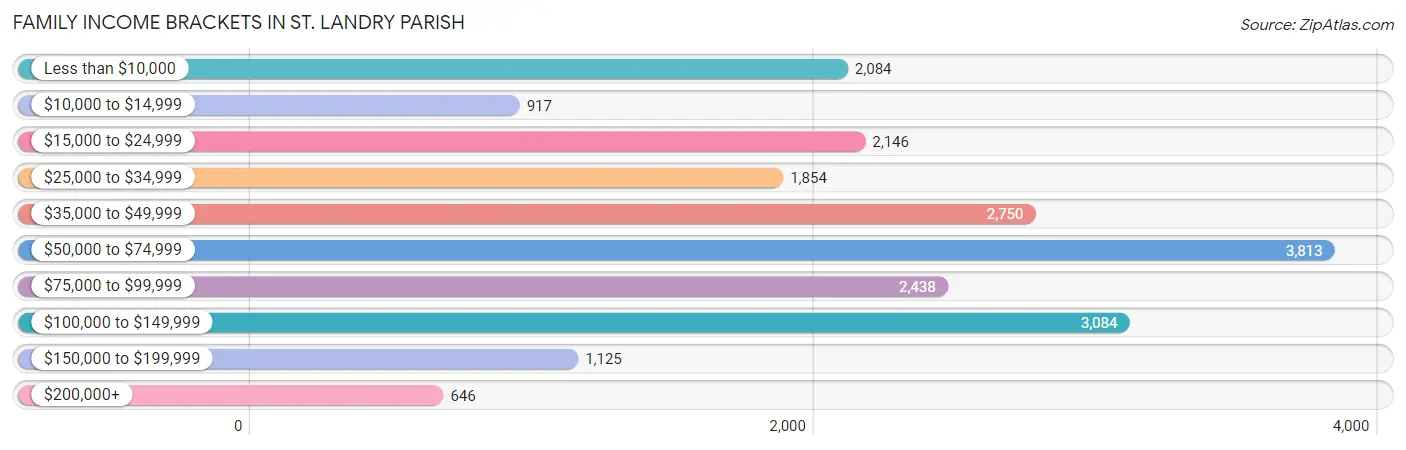
Family Income Brackets in St. Landry Parish
According to the St. Landry Parish family income data, there are 3,813 families falling into the $50,000 to $74,999 income range, which is the most common income bracket and makes up 18.3% of all families. Conversely, the $200,000+ income bracket is the least frequent group with only 646 families (3.1%) belonging to this category.
| Income Bracket | # Families | % Families |
| Less than $10,000 | 2,084 | 10.0% |
| $10,000 to $14,999 | 917 | 4.4% |
| $15,000 to $24,999 | 2,146 | 10.3% |
| $25,000 to $34,999 | 1,854 | 8.9% |
| $35,000 to $49,999 | 2,750 | 13.2% |
| $50,000 to $74,999 | 3,813 | 18.3% |
| $75,000 to $99,999 | 2,438 | 11.7% |
| $100,000 to $149,999 | 3,084 | 14.8% |
| $150,000 to $199,999 | 1,125 | 5.4% |
| $200,000+ | 646 | 3.1% |
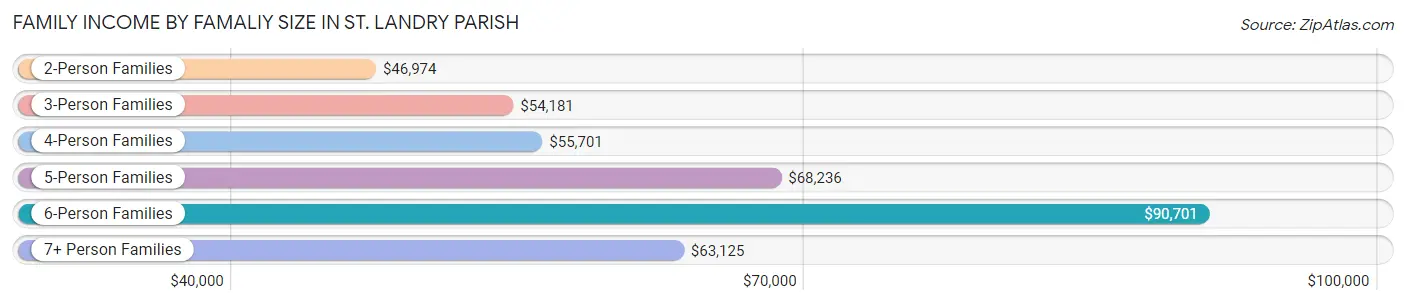
Family Income by Famaliy Size in St. Landry Parish
6-person families (615 | 2.9%) account for the highest median family income in St. Landry Parish with $90,701 per family, while 2-person families (10,458 | 50.2%) have the highest median income of $23,487 per family member.
| Income Bracket | # Families | Median Income |
| 2-Person Families | 10,458 (50.2%) | $46,974 |
| 3-Person Families | 4,289 (20.6%) | $54,181 |
| 4-Person Families | 3,372 (16.2%) | $55,701 |
| 5-Person Families | 1,803 (8.6%) | $68,236 |
| 6-Person Families | 615 (2.9%) | $90,701 |
| 7+ Person Families | 298 (1.4%) | $63,125 |
| Total | 20,835 (100.0%) | $53,278 |
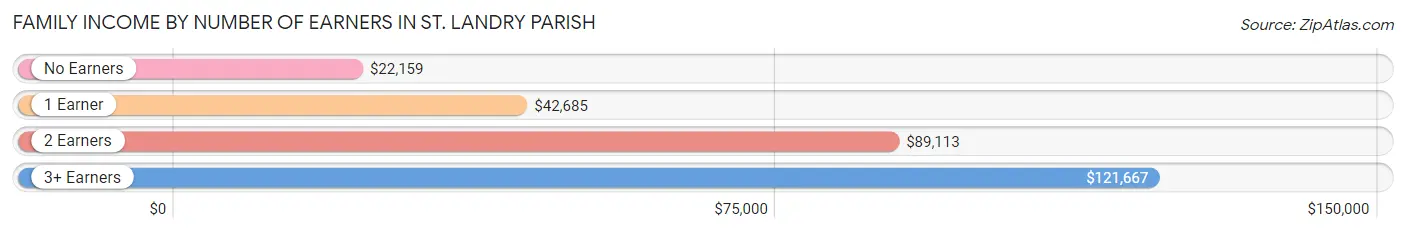
Family Income by Number of Earners in St. Landry Parish
The median family income in St. Landry Parish is $53,278, with families comprising 3+ earners (1,128) having the highest median family income of $121,667, while families with no earners (4,954) have the lowest median family income of $22,159, accounting for 5.4% and 23.8% of families, respectively.
| Number of Earners | # Families | Median Income |
| No Earners | 4,954 (23.8%) | $22,159 |
| 1 Earner | 8,436 (40.5%) | $42,685 |
| 2 Earners | 6,317 (30.3%) | $89,113 |
| 3+ Earners | 1,128 (5.4%) | $121,667 |
| Total | 20,835 (100.0%) | $53,278 |
Household Income in St. Landry Parish
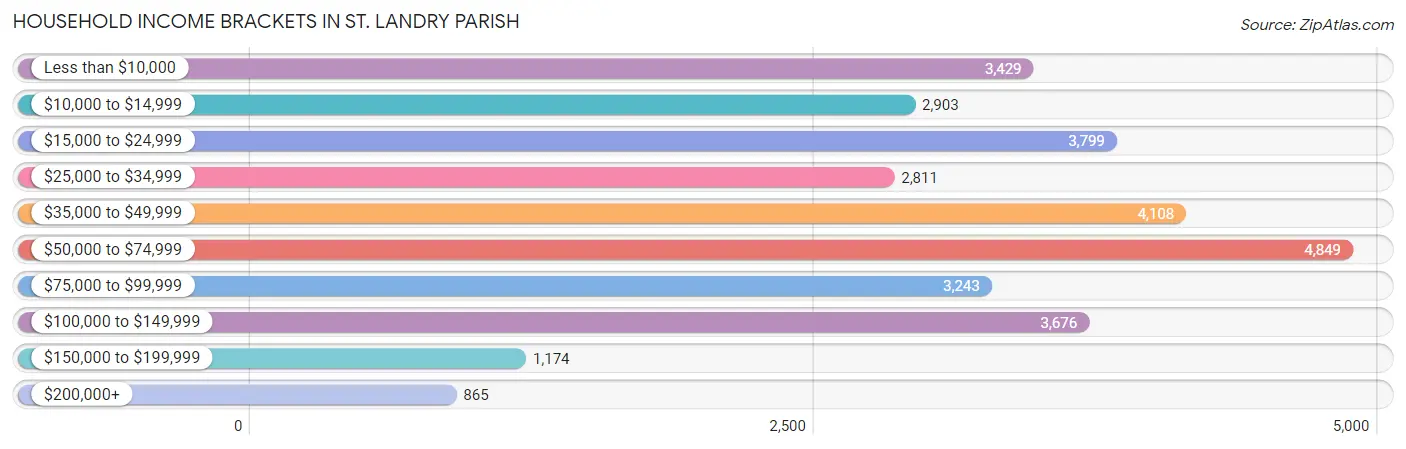
Household Income Brackets in St. Landry Parish
With 4,849 households falling in the category, the $50,000 to $74,999 income range is the most frequent in St. Landry Parish, accounting for 15.7% of all households. In contrast, only 865 households (2.8%) fall into the $200,000+ income bracket, making it the least populous group.
| Income Bracket | # Households | % Households |
| Less than $10,000 | 3,429 | 11.1% |
| $10,000 to $14,999 | 2,903 | 9.4% |
| $15,000 to $24,999 | 3,799 | 12.3% |
| $25,000 to $34,999 | 2,811 | 9.1% |
| $35,000 to $49,999 | 4,108 | 13.3% |
| $50,000 to $74,999 | 4,849 | 15.7% |
| $75,000 to $99,999 | 3,243 | 10.5% |
| $100,000 to $149,999 | 3,676 | 11.9% |
| $150,000 to $199,999 | 1,174 | 3.8% |
| $200,000+ | 865 | 2.8% |
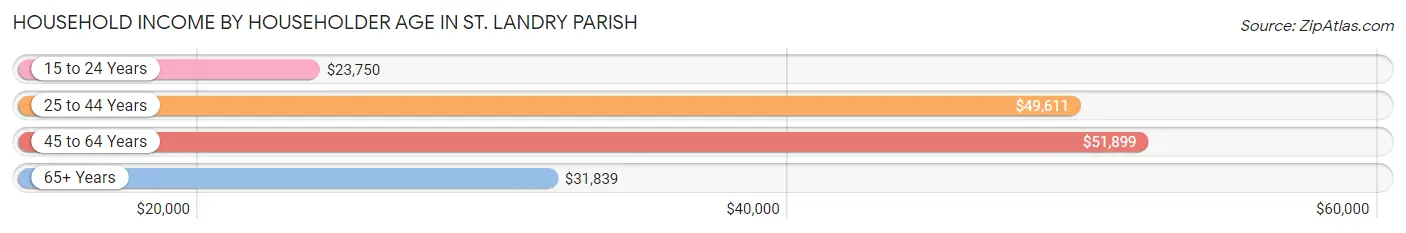
Household Income by Householder Age in St. Landry Parish
The median household income in St. Landry Parish is $44,478, with the highest median household income of $51,899 found in the 45 to 64 years age bracket for the primary householder. A total of 11,839 households (38.3%) fall into this category. Meanwhile, the 15 to 24 years age bracket for the primary householder has the lowest median household income of $23,750, with 1,060 households (3.4%) in this group.
| Income Bracket | # Households | Median Income |
| 15 to 24 Years | 1,060 (3.4%) | $23,750 |
| 25 to 44 Years | 9,341 (30.2%) | $49,611 |
| 45 to 64 Years | 11,839 (38.3%) | $51,899 |
| 65+ Years | 8,648 (28.0%) | $31,839 |
| Total | 30,888 (100.0%) | $44,478 |
Poverty in St. Landry Parish
Income Below Poverty by Sex and Age in St. Landry Parish
With 24.8% poverty level for males and 30.0% for females among the residents of St. Landry Parish, under 5 year old males and under 5 year old females are the most vulnerable to poverty, with 1,084 males (38.6%) and 1,200 females (45.8%) in their respective age groups living below the poverty level.
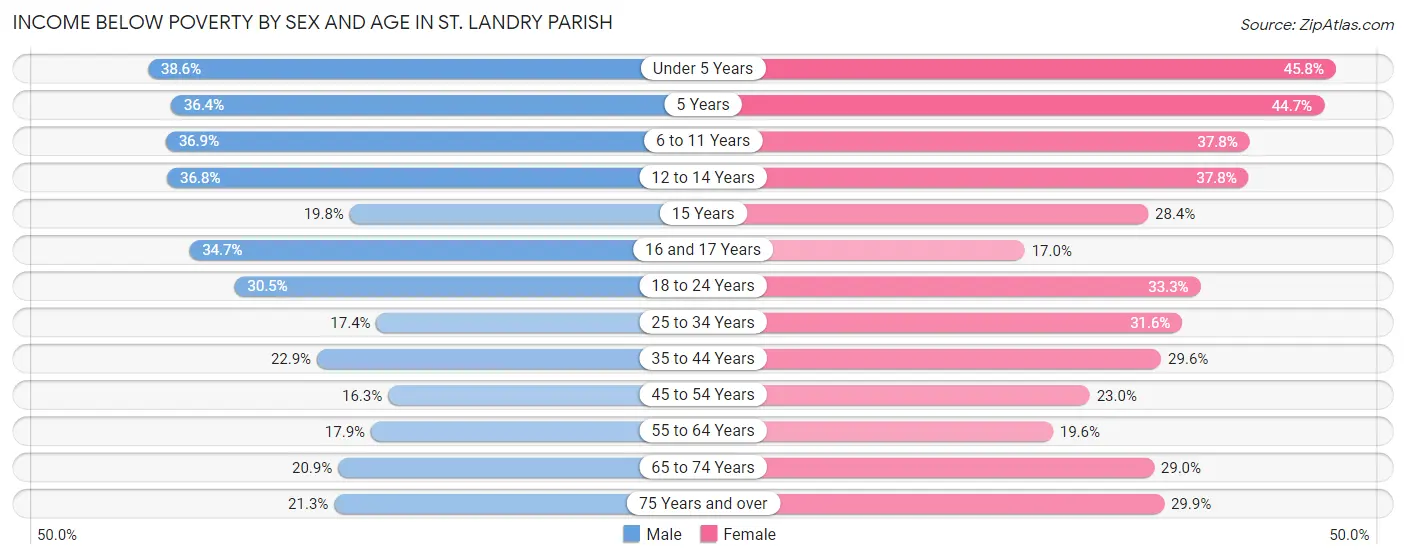
| Age Bracket | Male | Female |
| Under 5 Years | 1,084 (38.6%) | 1,200 (45.8%) |
| 5 Years | 181 (36.4%) | 323 (44.7%) |
| 6 to 11 Years | 1,302 (36.9%) | 1,400 (37.8%) |
| 12 to 14 Years | 733 (36.8%) | 615 (37.8%) |
| 15 Years | 117 (19.8%) | 195 (28.4%) |
| 16 and 17 Years | 476 (34.7%) | 187 (17.0%) |
| 18 to 24 Years | 1,082 (30.5%) | 1,171 (33.3%) |
| 25 to 34 Years | 875 (17.3%) | 1,692 (31.6%) |
| 35 to 44 Years | 1,017 (22.9%) | 1,467 (29.6%) |
| 45 to 54 Years | 718 (16.3%) | 1,106 (23.0%) |
| 55 to 64 Years | 925 (17.9%) | 1,102 (19.6%) |
| 65 to 74 Years | 791 (20.9%) | 1,233 (29.0%) |
| 75 Years and over | 409 (21.3%) | 875 (29.9%) |
| Total | 9,710 (24.8%) | 12,566 (30.0%) |
Income Above Poverty by Sex and Age in St. Landry Parish
According to the poverty statistics in St. Landry Parish, males aged 45 to 54 years and females aged 16 and 17 years are the age groups that are most secure financially, with 83.7% of males and 83.0% of females in these age groups living above the poverty line.
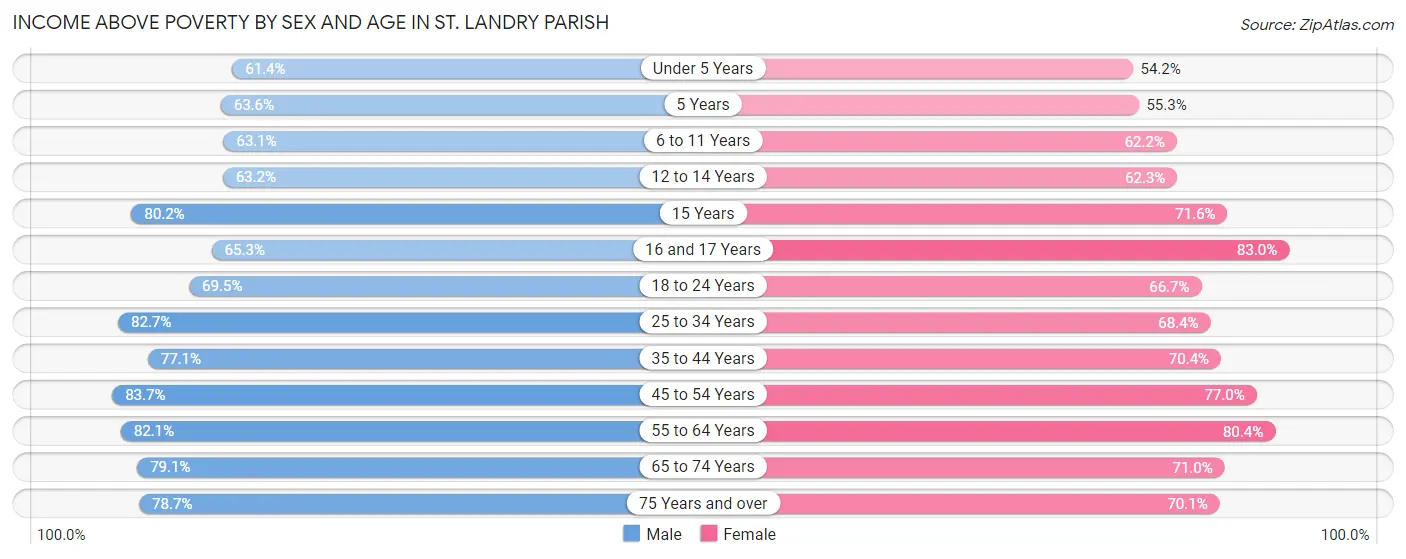
| Age Bracket | Male | Female |
| Under 5 Years | 1,727 (61.4%) | 1,418 (54.2%) |
| 5 Years | 316 (63.6%) | 399 (55.3%) |
| 6 to 11 Years | 2,226 (63.1%) | 2,300 (62.2%) |
| 12 to 14 Years | 1,260 (63.2%) | 1,014 (62.3%) |
| 15 Years | 473 (80.2%) | 491 (71.6%) |
| 16 and 17 Years | 895 (65.3%) | 914 (83.0%) |
| 18 to 24 Years | 2,462 (69.5%) | 2,348 (66.7%) |
| 25 to 34 Years | 4,169 (82.7%) | 3,664 (68.4%) |
| 35 to 44 Years | 3,430 (77.1%) | 3,483 (70.4%) |
| 45 to 54 Years | 3,696 (83.7%) | 3,700 (77.0%) |
| 55 to 64 Years | 4,255 (82.1%) | 4,526 (80.4%) |
| 65 to 74 Years | 2,992 (79.1%) | 3,025 (71.0%) |
| 75 Years and over | 1,514 (78.7%) | 2,051 (70.1%) |
| Total | 29,415 (75.2%) | 29,333 (70.0%) |
Income Below Poverty Among Married-Couple Families in St. Landry Parish
The poverty statistics for married-couple families in St. Landry Parish show that 9.0% or 1,160 of the total 12,920 families live below the poverty line. Families with 3 or 4 children have the highest poverty rate of 12.2%, comprising of 173 families. On the other hand, families with 1 or 2 children have the lowest poverty rate of 6.2%, which includes 203 families.
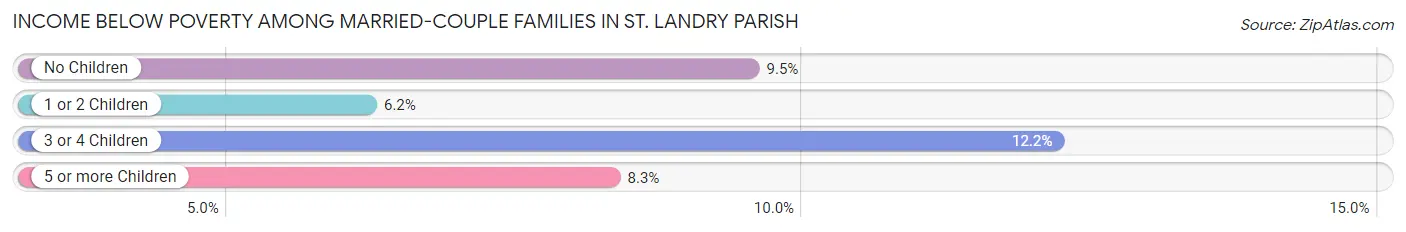
| Children | Above Poverty | Below Poverty |
| No Children | 7,337 (90.5%) | 774 (9.5%) |
| 1 or 2 Children | 3,067 (93.8%) | 203 (6.2%) |
| 3 or 4 Children | 1,246 (87.8%) | 173 (12.2%) |
| 5 or more Children | 110 (91.7%) | 10 (8.3%) |
| Total | 11,760 (91.0%) | 1,160 (9.0%) |
Income Below Poverty Among Single-Parent Households in St. Landry Parish
According to the poverty data in St. Landry Parish, 23.9% or 440 single-father households and 52.2% or 3,172 single-mother households are living below the poverty line. Among single-father households, those with 1 or 2 children have the highest poverty rate, with 302 households (43.3%) experiencing poverty. Likewise, among single-mother households, those with 5 or more children have the highest poverty rate, with 25 households (100.0%) falling below the poverty line.
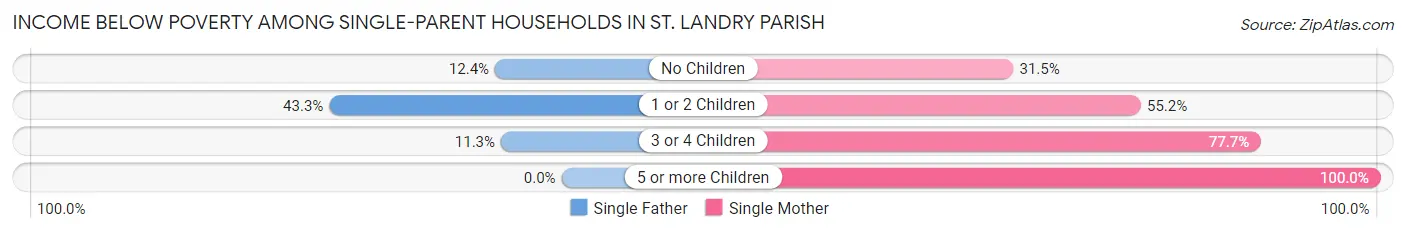
| Children | Single Father | Single Mother |
| No Children | 97 (12.4%) | 578 (31.5%) |
| 1 or 2 Children | 302 (43.3%) | 1,721 (55.2%) |
| 3 or 4 Children | 41 (11.3%) | 848 (77.7%) |
| 5 or more Children | 0 (0.0%) | 25 (100.0%) |
| Total | 440 (23.9%) | 3,172 (52.2%) |
Income Below Poverty Among Married-Couple vs Single-Parent Households in St. Landry Parish
The poverty data for St. Landry Parish shows that 1,160 of the married-couple family households (9.0%) and 3,612 of the single-parent households (45.6%) are living below the poverty level. Within the married-couple family households, those with 3 or 4 children have the highest poverty rate, with 173 households (12.2%) falling below the poverty line. Among the single-parent households, those with 5 or more children have the highest poverty rate, with 25 household (100.0%) living below poverty.
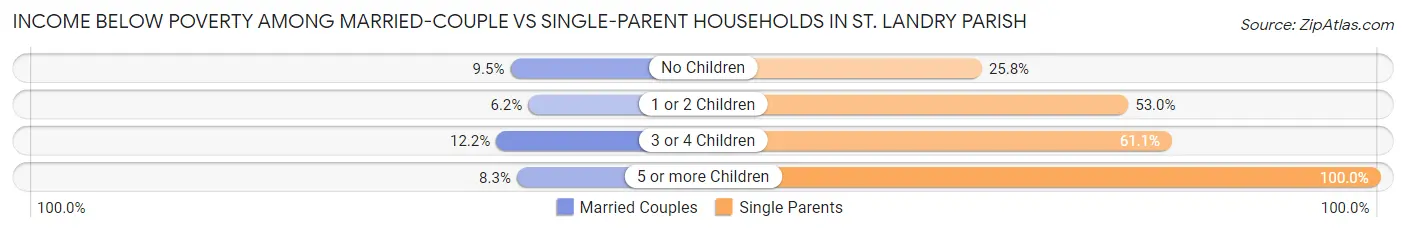
| Children | Married-Couple Families | Single-Parent Households |
| No Children | 774 (9.5%) | 675 (25.8%) |
| 1 or 2 Children | 203 (6.2%) | 2,023 (53.0%) |
| 3 or 4 Children | 173 (12.2%) | 889 (61.1%) |
| 5 or more Children | 10 (8.3%) | 25 (100.0%) |
| Total | 1,160 (9.0%) | 3,612 (45.6%) |
Employment Characteristics in St. Landry Parish
Employment by Class of Employer in St. Landry Parish
Among the 29,973 employed individuals in St. Landry Parish, private company employees (21,172 | 70.6%), local government employees (2,295 | 7.7%), and self-employed (not incorporated) (1,953 | 6.5%) make up the most common classes of employment.
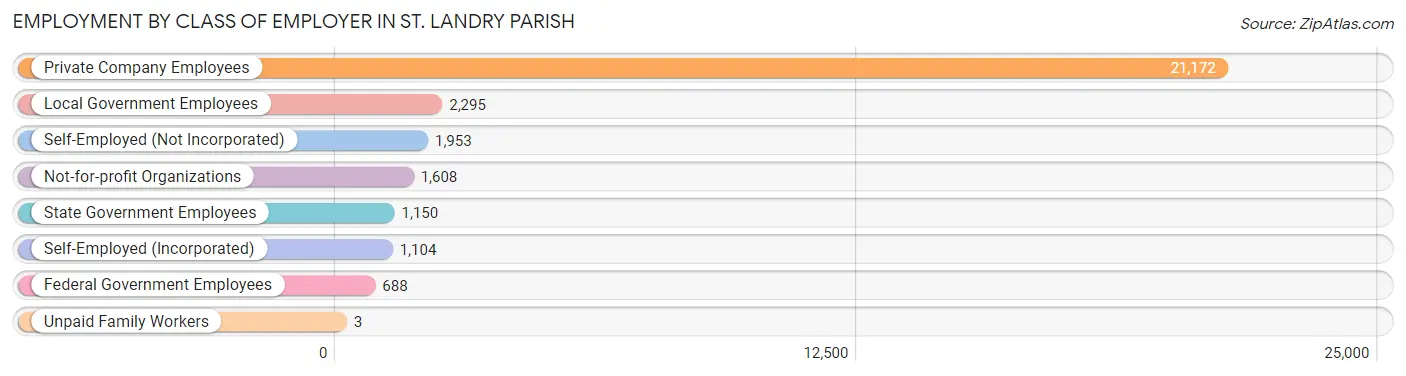
| Employer Class | # Employees | % Employees |
| Private Company Employees | 21,172 | 70.6% |
| Self-Employed (Incorporated) | 1,104 | 3.7% |
| Self-Employed (Not Incorporated) | 1,953 | 6.5% |
| Not-for-profit Organizations | 1,608 | 5.4% |
| Local Government Employees | 2,295 | 7.7% |
| State Government Employees | 1,150 | 3.8% |
| Federal Government Employees | 688 | 2.3% |
| Unpaid Family Workers | 3 | 0.0% |
| Total | 29,973 | 100.0% |
Employment Status by Age in St. Landry Parish
According to the labor force statistics for St. Landry Parish, out of the total population over 16 years of age (63,217), 52.4% or 33,126 individuals are in the labor force, with 6.9% or 2,286 of them unemployed. The age group with the highest labor force participation rate is 25 to 29 years, with 72.9% or 3,840 individuals in the labor force. Within the labor force, the 16 to 19 years age range has the highest percentage of unemployed individuals, with 17.0% or 215 of them being unemployed.
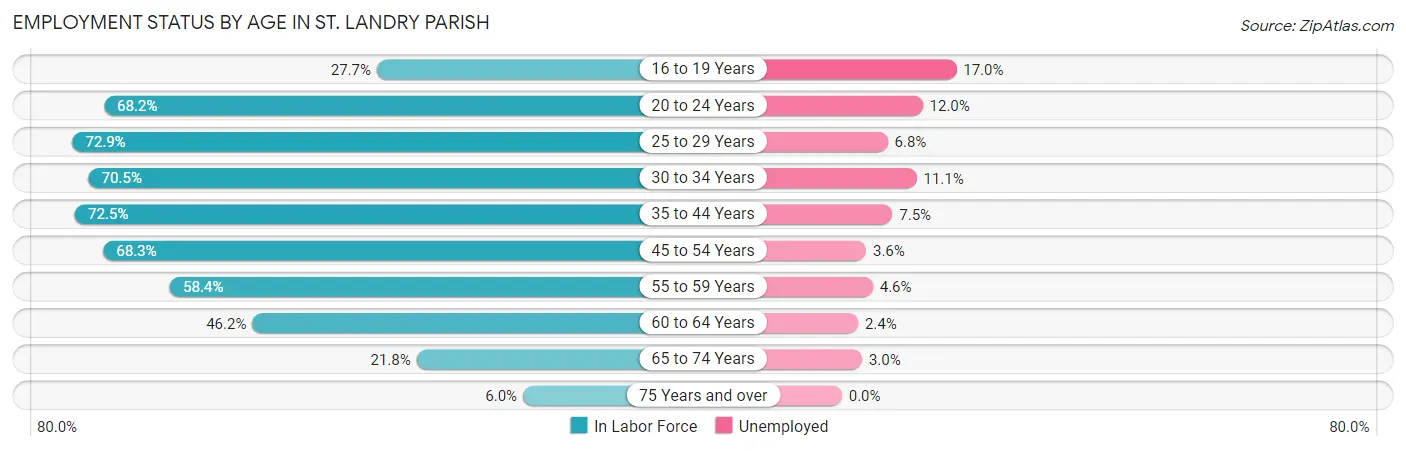
| Age Bracket | In Labor Force | Unemployed |
| 16 to 19 Years | 1,262 (27.7%) | 215 (17.0%) |
| 20 to 24 Years | 3,435 (68.2%) | 412 (12.0%) |
| 25 to 29 Years | 3,840 (72.9%) | 261 (6.8%) |
| 30 to 34 Years | 3,705 (70.5%) | 411 (11.1%) |
| 35 to 44 Years | 6,894 (72.5%) | 517 (7.5%) |
| 45 to 54 Years | 6,309 (68.3%) | 227 (3.6%) |
| 55 to 59 Years | 2,797 (58.4%) | 129 (4.6%) |
| 60 to 64 Years | 2,814 (46.2%) | 68 (2.4%) |
| 65 to 74 Years | 1,775 (21.8%) | 53 (3.0%) |
| 75 Years and over | 320 (6.0%) | 0 (0.0%) |
| Total | 33,126 (52.4%) | 2,286 (6.9%) |
Employment Status by Educational Attainment in St. Landry Parish
According to labor force statistics for St. Landry Parish, 65.7% of individuals (26,377) out of the total population between 25 and 64 years of age (40,147) are in the labor force, with 6.1% or 1,609 of them being unemployed. The group with the highest labor force participation rate are those with the educational attainment of bachelor's degree or higher, with 85.7% or 4,360 individuals in the labor force. Within the labor force, individuals with less than high school education have the highest percentage of unemployment, with 14.1% or 471 of them being unemployed.
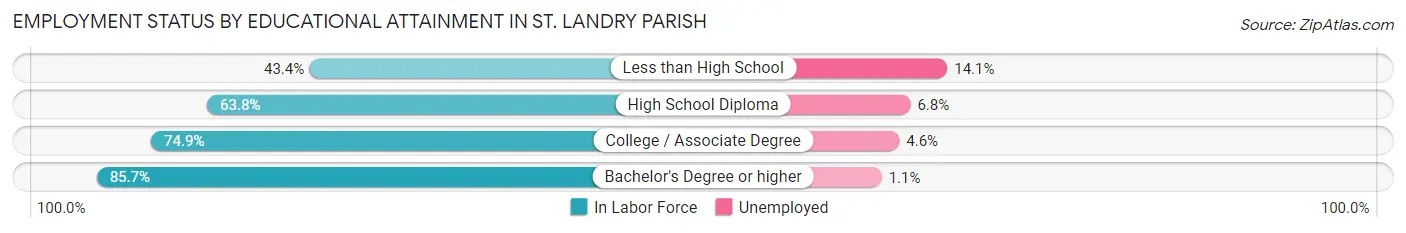
| Educational Attainment | In Labor Force | Unemployed |
| Less than High School | 3,337 (43.4%) | 1,084 (14.1%) |
| High School Diploma | 10,647 (63.8%) | 1,135 (6.8%) |
| College / Associate Degree | 8,001 (74.9%) | 491 (4.6%) |
| Bachelor's Degree or higher | 4,360 (85.7%) | 56 (1.1%) |
| Total | 26,377 (65.7%) | 2,449 (6.1%) |
Employment Occupations by Sex in St. Landry Parish
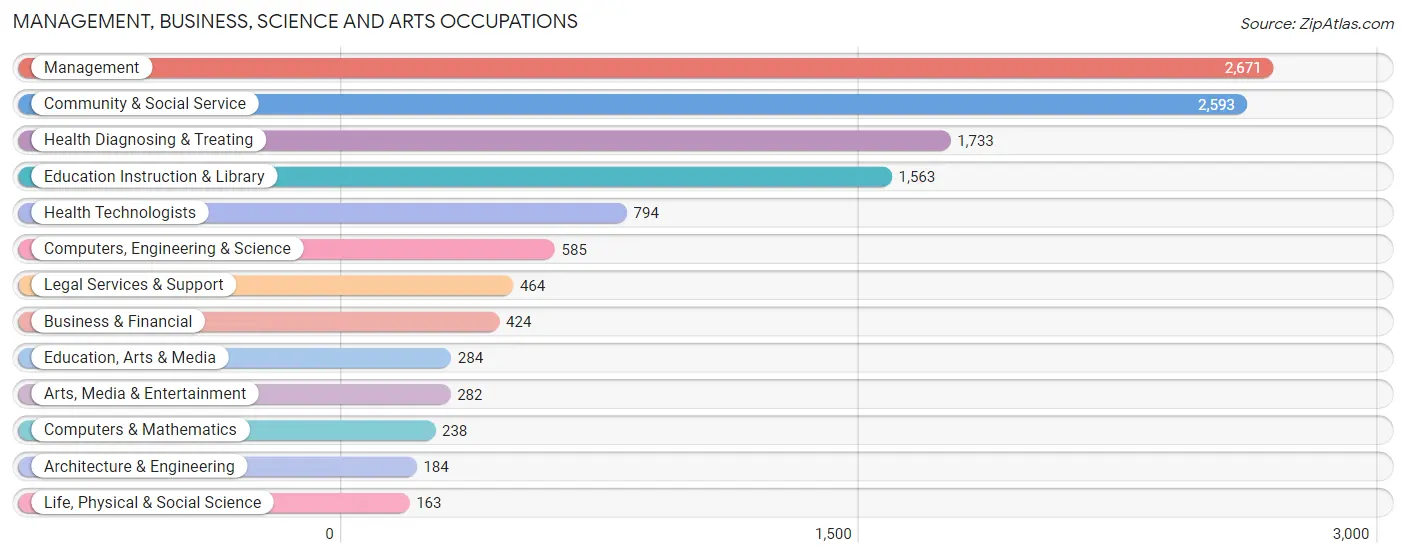
Management, Business, Science and Arts Occupations
The most common Management, Business, Science and Arts occupations in St. Landry Parish are Management (2,671 | 8.7%), Community & Social Service (2,593 | 8.4%), Health Diagnosing & Treating (1,733 | 5.6%), Education Instruction & Library (1,563 | 5.1%), and Health Technologists (794 | 2.6%).
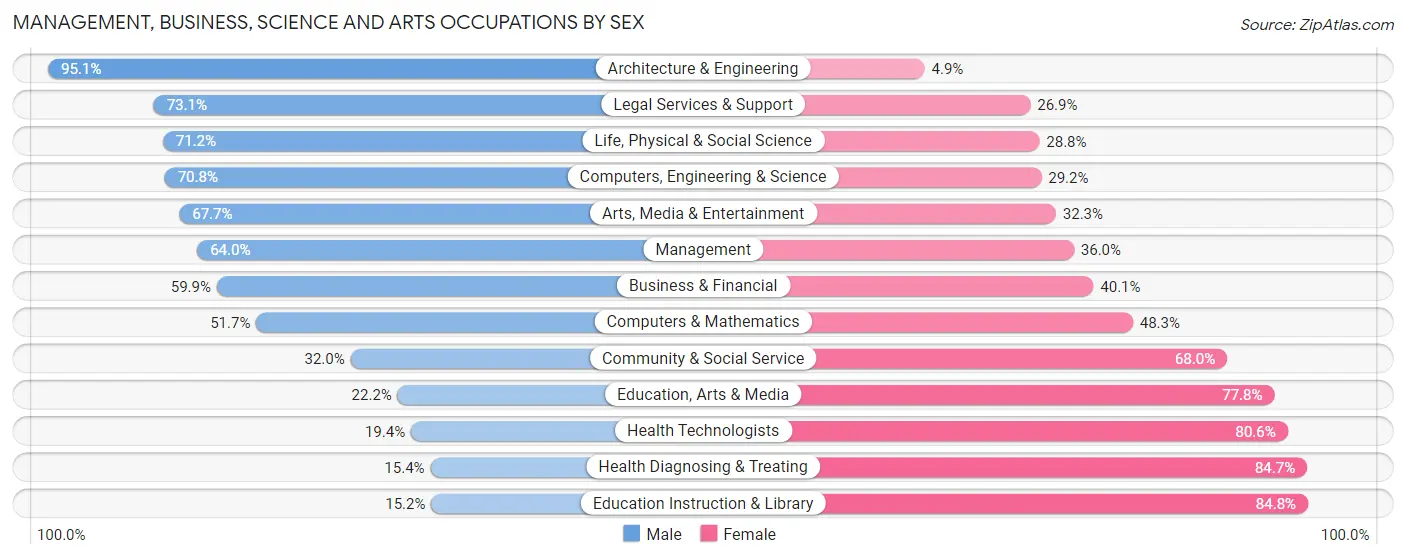
Management, Business, Science and Arts Occupations by Sex
Within the Management, Business, Science and Arts occupations in St. Landry Parish, the most male-oriented occupations are Architecture & Engineering (95.1%), Legal Services & Support (73.1%), and Life, Physical & Social Science (71.2%), while the most female-oriented occupations are Education Instruction & Library (84.8%), Health Diagnosing & Treating (84.7%), and Health Technologists (80.6%).
| Occupation | Male | Female |
| Management | 1,709 (64.0%) | 962 (36.0%) |
| Business & Financial | 254 (59.9%) | 170 (40.1%) |
| Computers, Engineering & Science | 414 (70.8%) | 171 (29.2%) |
| Computers & Mathematics | 123 (51.7%) | 115 (48.3%) |
| Architecture & Engineering | 175 (95.1%) | 9 (4.9%) |
| Life, Physical & Social Science | 116 (71.2%) | 47 (28.8%) |
| Community & Social Service | 830 (32.0%) | 1,763 (68.0%) |
| Education, Arts & Media | 63 (22.2%) | 221 (77.8%) |
| Legal Services & Support | 339 (73.1%) | 125 (26.9%) |
| Education Instruction & Library | 237 (15.2%) | 1,326 (84.8%) |
| Arts, Media & Entertainment | 191 (67.7%) | 91 (32.3%) |
| Health Diagnosing & Treating | 266 (15.3%) | 1,467 (84.7%) |
| Health Technologists | 154 (19.4%) | 640 (80.6%) |
| Total (Category) | 3,473 (43.4%) | 4,533 (56.6%) |
| Total (Overall) | 16,109 (52.4%) | 14,608 (47.6%) |
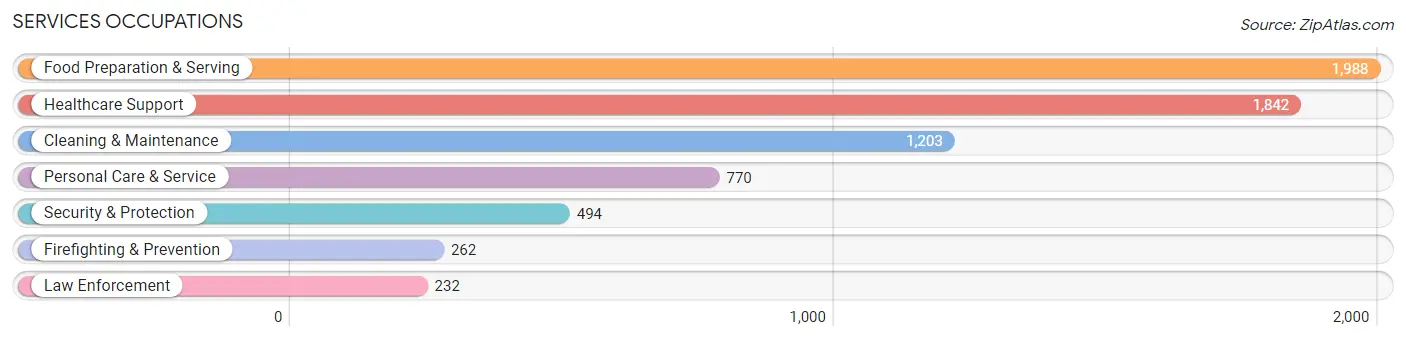
Services Occupations
The most common Services occupations in St. Landry Parish are Food Preparation & Serving (1,988 | 6.5%), Healthcare Support (1,842 | 6.0%), Cleaning & Maintenance (1,203 | 3.9%), Personal Care & Service (770 | 2.5%), and Security & Protection (494 | 1.6%).
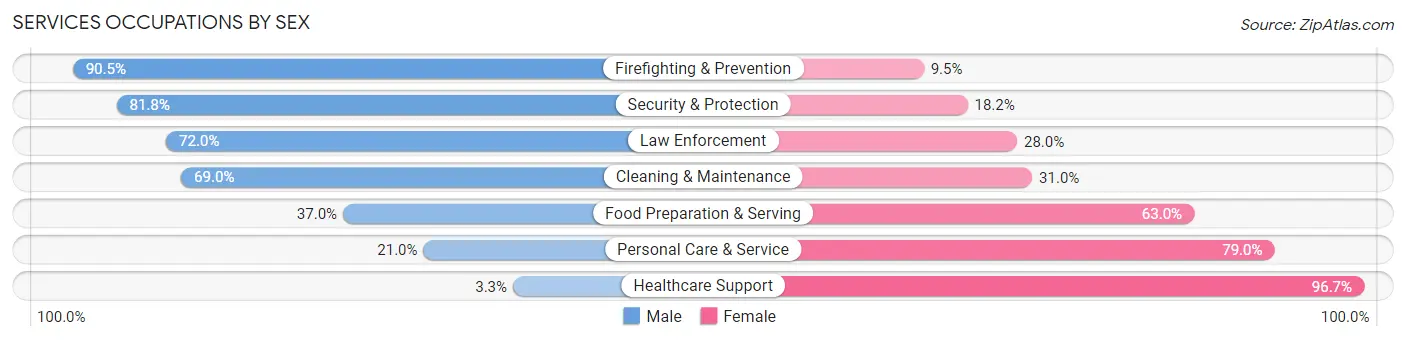
Services Occupations by Sex
Within the Services occupations in St. Landry Parish, the most male-oriented occupations are Firefighting & Prevention (90.5%), Security & Protection (81.8%), and Law Enforcement (72.0%), while the most female-oriented occupations are Healthcare Support (96.7%), Personal Care & Service (79.0%), and Food Preparation & Serving (63.0%).
| Occupation | Male | Female |
| Healthcare Support | 61 (3.3%) | 1,781 (96.7%) |
| Security & Protection | 404 (81.8%) | 90 (18.2%) |
| Firefighting & Prevention | 237 (90.5%) | 25 (9.5%) |
| Law Enforcement | 167 (72.0%) | 65 (28.0%) |
| Food Preparation & Serving | 735 (37.0%) | 1,253 (63.0%) |
| Cleaning & Maintenance | 830 (69.0%) | 373 (31.0%) |
| Personal Care & Service | 162 (21.0%) | 608 (79.0%) |
| Total (Category) | 2,192 (34.8%) | 4,105 (65.2%) |
| Total (Overall) | 16,109 (52.4%) | 14,608 (47.6%) |
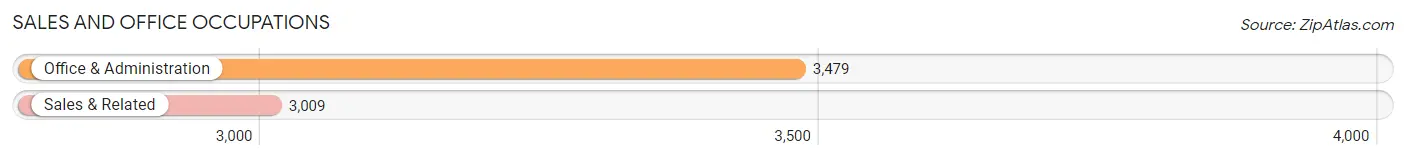
Sales and Office Occupations
The most common Sales and Office occupations in St. Landry Parish are Office & Administration (3,479 | 11.3%), and Sales & Related (3,009 | 9.8%).
Sales and Office Occupations by Sex
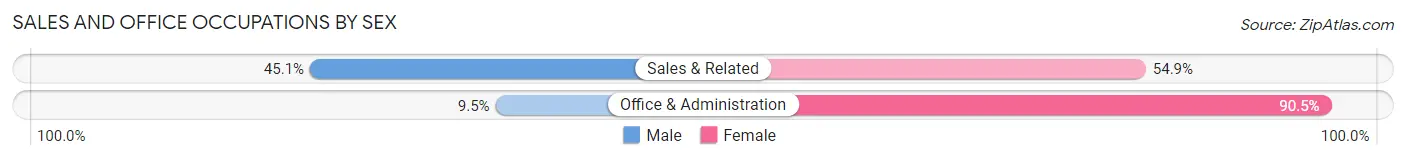
| Occupation | Male | Female |
| Sales & Related | 1,358 (45.1%) | 1,651 (54.9%) |
| Office & Administration | 329 (9.5%) | 3,150 (90.5%) |
| Total (Category) | 1,687 (26.0%) | 4,801 (74.0%) |
| Total (Overall) | 16,109 (52.4%) | 14,608 (47.6%) |
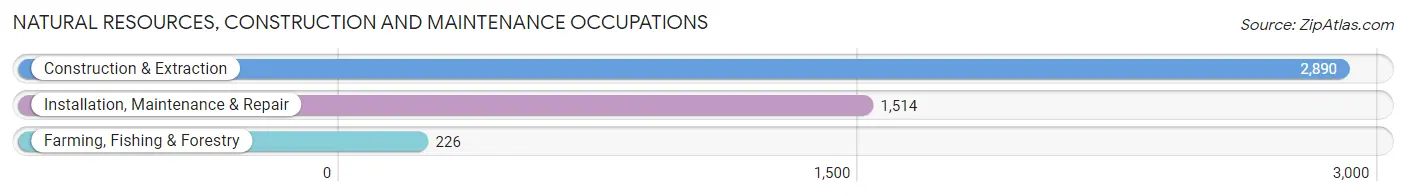
Natural Resources, Construction and Maintenance Occupations
The most common Natural Resources, Construction and Maintenance occupations in St. Landry Parish are Construction & Extraction (2,890 | 9.4%), Installation, Maintenance & Repair (1,514 | 4.9%), and Farming, Fishing & Forestry (226 | 0.7%).
Natural Resources, Construction and Maintenance Occupations by Sex
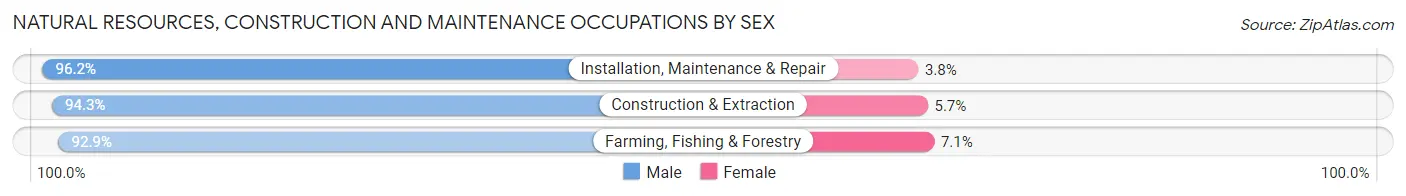
| Occupation | Male | Female |
| Farming, Fishing & Forestry | 210 (92.9%) | 16 (7.1%) |
| Construction & Extraction | 2,724 (94.3%) | 166 (5.7%) |
| Installation, Maintenance & Repair | 1,457 (96.2%) | 57 (3.8%) |
| Total (Category) | 4,391 (94.8%) | 239 (5.2%) |
| Total (Overall) | 16,109 (52.4%) | 14,608 (47.6%) |
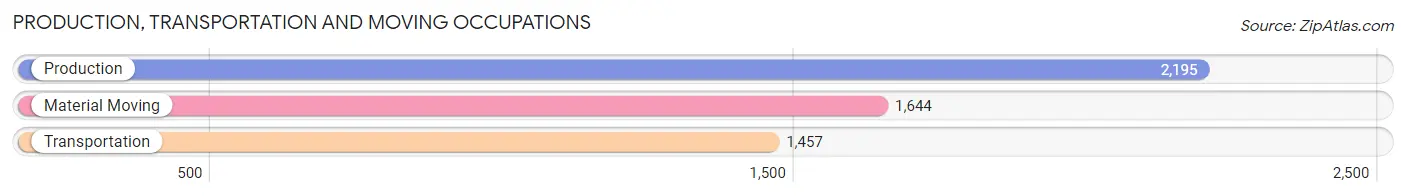
Production, Transportation and Moving Occupations
The most common Production, Transportation and Moving occupations in St. Landry Parish are Production (2,195 | 7.1%), Material Moving (1,644 | 5.3%), and Transportation (1,457 | 4.7%).
Production, Transportation and Moving Occupations by Sex
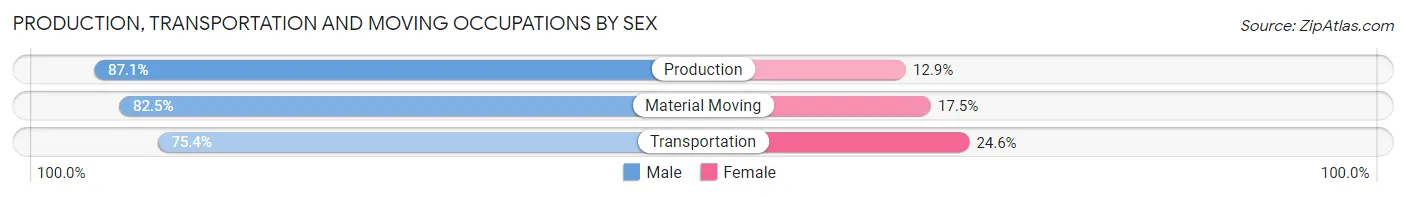
| Occupation | Male | Female |
| Production | 1,911 (87.1%) | 284 (12.9%) |
| Transportation | 1,099 (75.4%) | 358 (24.6%) |
| Material Moving | 1,356 (82.5%) | 288 (17.5%) |
| Total (Category) | 4,366 (82.4%) | 930 (17.6%) |
| Total (Overall) | 16,109 (52.4%) | 14,608 (47.6%) |
Employment Industries by Sex in St. Landry Parish
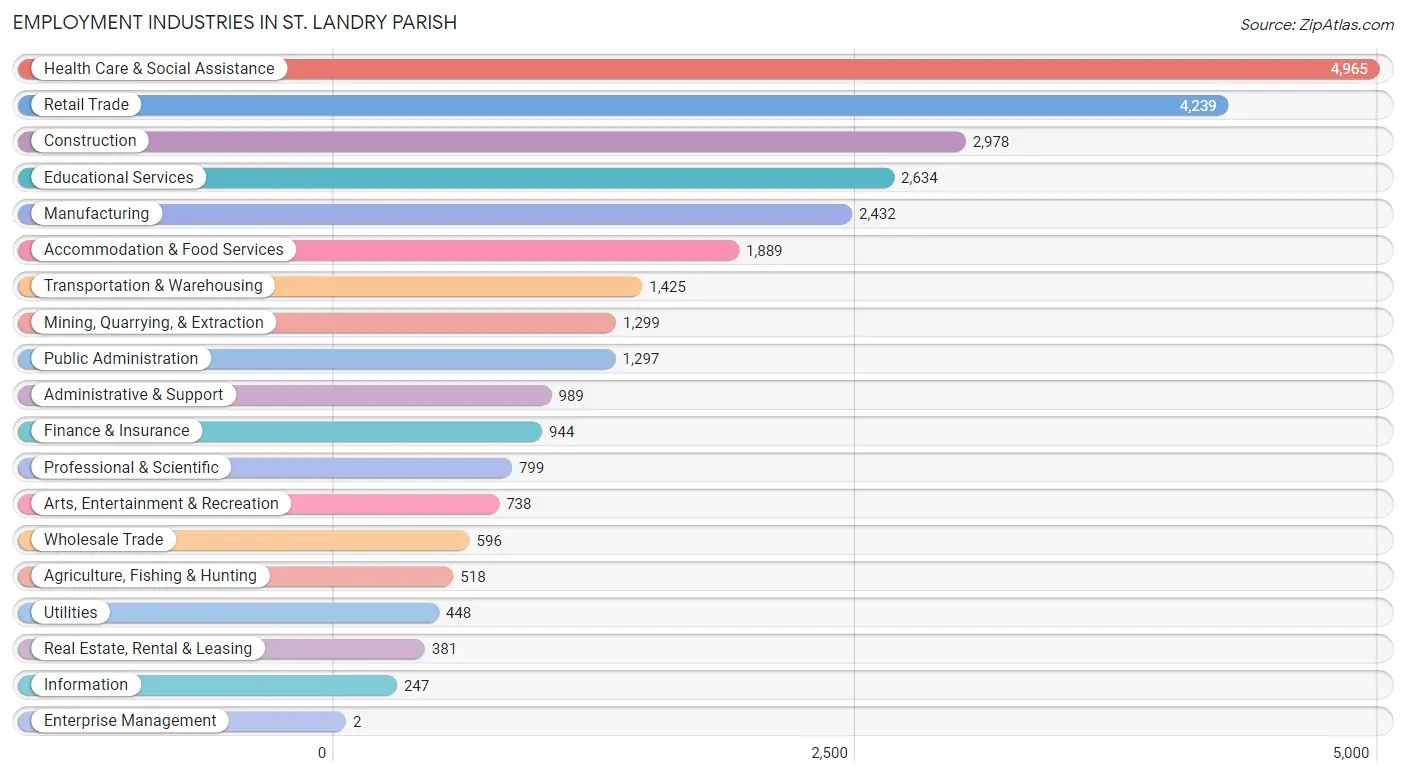
Employment Industries in St. Landry Parish
The major employment industries in St. Landry Parish include Health Care & Social Assistance (4,965 | 16.2%), Retail Trade (4,239 | 13.8%), Construction (2,978 | 9.7%), Educational Services (2,634 | 8.6%), and Manufacturing (2,432 | 7.9%).
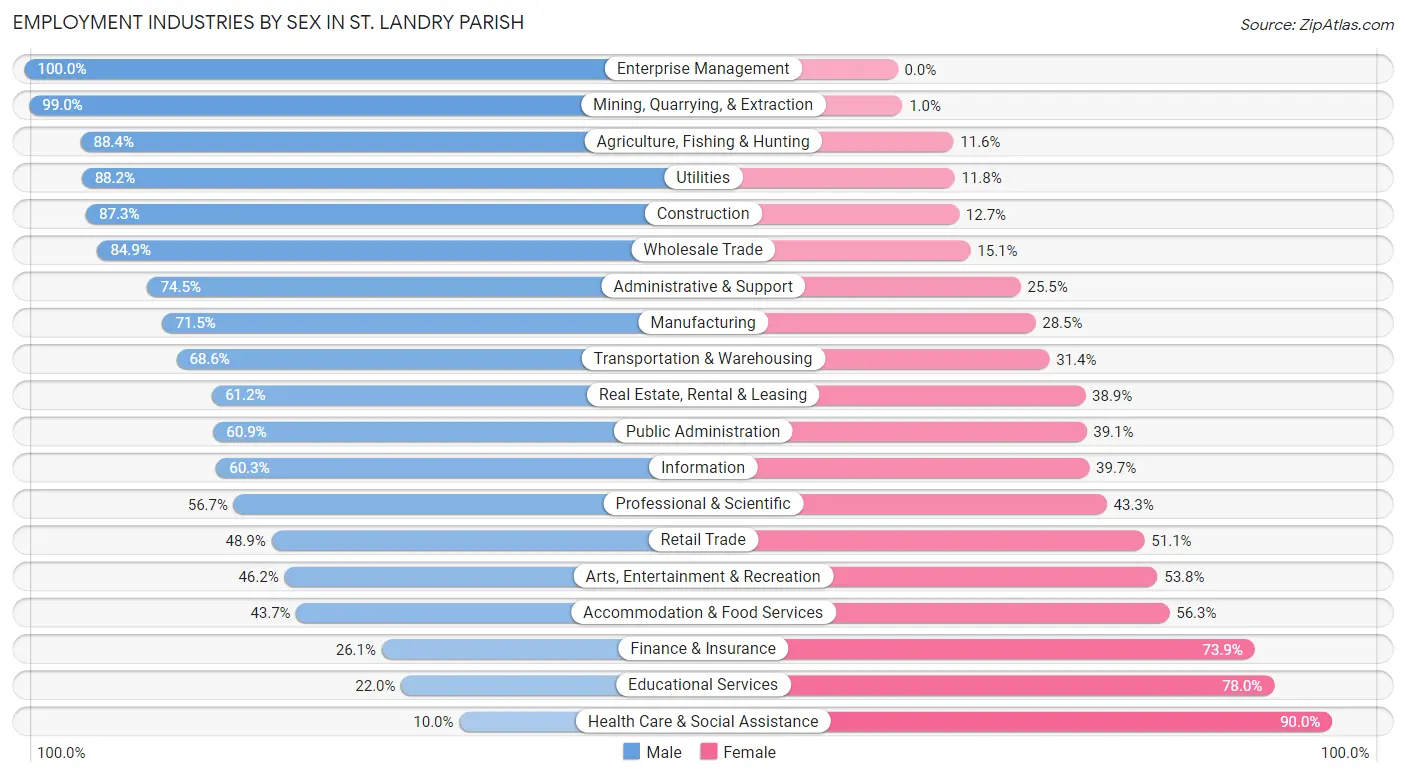
Employment Industries by Sex in St. Landry Parish
The St. Landry Parish industries that see more men than women are Enterprise Management (100.0%), Mining, Quarrying, & Extraction (99.0%), and Agriculture, Fishing & Hunting (88.4%), whereas the industries that tend to have a higher number of women are Health Care & Social Assistance (90.0%), Educational Services (78.0%), and Finance & Insurance (73.9%).
| Industry | Male | Female |
| Agriculture, Fishing & Hunting | 458 (88.4%) | 60 (11.6%) |
| Mining, Quarrying, & Extraction | 1,286 (99.0%) | 13 (1.0%) |
| Construction | 2,599 (87.3%) | 379 (12.7%) |
| Manufacturing | 1,738 (71.5%) | 694 (28.5%) |
| Wholesale Trade | 506 (84.9%) | 90 (15.1%) |
| Retail Trade | 2,072 (48.9%) | 2,167 (51.1%) |
| Transportation & Warehousing | 977 (68.6%) | 448 (31.4%) |
| Utilities | 395 (88.2%) | 53 (11.8%) |
| Information | 149 (60.3%) | 98 (39.7%) |
| Finance & Insurance | 246 (26.1%) | 698 (73.9%) |
| Real Estate, Rental & Leasing | 233 (61.2%) | 148 (38.9%) |
| Professional & Scientific | 453 (56.7%) | 346 (43.3%) |
| Enterprise Management | 2 (100.0%) | 0 (0.0%) |
| Administrative & Support | 737 (74.5%) | 252 (25.5%) |
| Educational Services | 580 (22.0%) | 2,054 (78.0%) |
| Health Care & Social Assistance | 497 (10.0%) | 4,468 (90.0%) |
| Arts, Entertainment & Recreation | 341 (46.2%) | 397 (53.8%) |
| Accommodation & Food Services | 826 (43.7%) | 1,063 (56.3%) |
| Public Administration | 790 (60.9%) | 507 (39.1%) |
| Total | 16,109 (52.4%) | 14,608 (47.6%) |
Education in St. Landry Parish
School Enrollment in St. Landry Parish
The most common levels of schooling among the 19,914 students in St. Landry Parish are middle school (5,175 | 26.0%), elementary school (4,772 | 24.0%), and high school (4,601 | 23.1%).
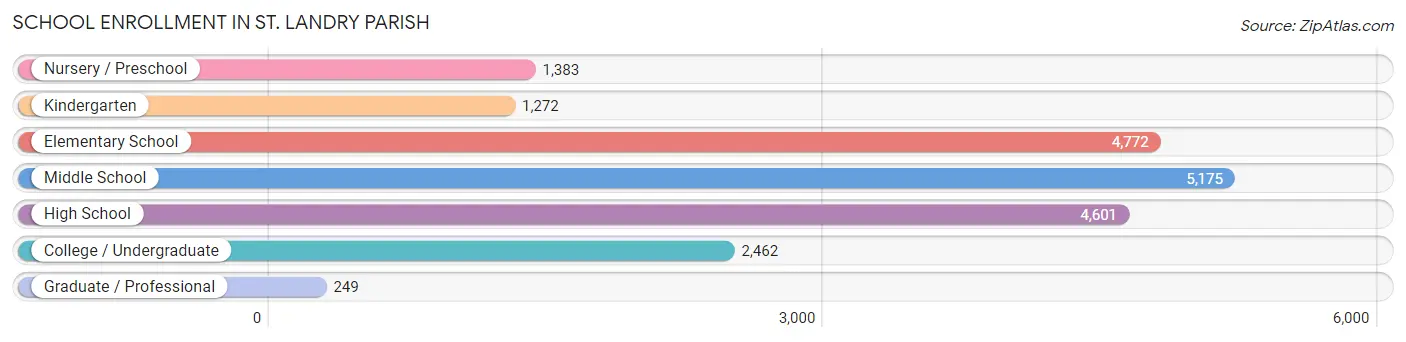
| School Level | # Students | % Students |
| Nursery / Preschool | 1,383 | 6.9% |
| Kindergarten | 1,272 | 6.4% |
| Elementary School | 4,772 | 24.0% |
| Middle School | 5,175 | 26.0% |
| High School | 4,601 | 23.1% |
| College / Undergraduate | 2,462 | 12.4% |
| Graduate / Professional | 249 | 1.3% |
| Total | 19,914 | 100.0% |
School Enrollment by Age by Funding Source in St. Landry Parish
Out of a total of 19,914 students who are enrolled in schools in St. Landry Parish, 3,684 (18.5%) attend a private institution, while the remaining 16,230 (81.5%) are enrolled in public schools. The age group of 3 to 4 year olds has the highest likelihood of being enrolled in private schools, with 271 (30.7% in the age bracket) enrolled. Conversely, the age group of 18 to 19 year olds has the lowest likelihood of being enrolled in a private school, with 878 (90.0% in the age bracket) attending a public institution.
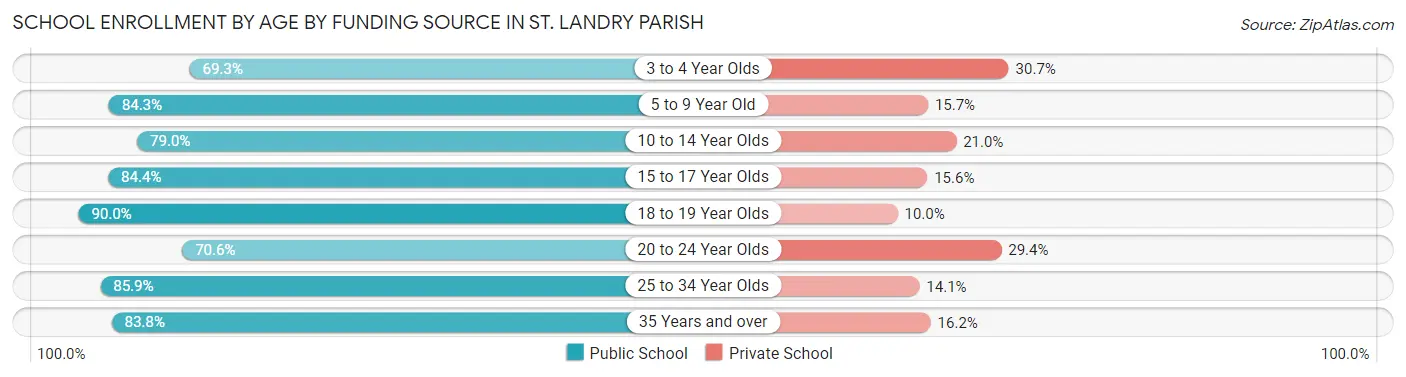
| Age Bracket | Public School | Private School |
| 3 to 4 Year Olds | 611 (69.3%) | 271 (30.7%) |
| 5 to 9 Year Old | 4,936 (84.3%) | 919 (15.7%) |
| 10 to 14 Year Olds | 4,755 (79.0%) | 1,261 (21.0%) |
| 15 to 17 Year Olds | 3,119 (84.4%) | 575 (15.6%) |
| 18 to 19 Year Olds | 878 (90.0%) | 98 (10.0%) |
| 20 to 24 Year Olds | 936 (70.6%) | 389 (29.4%) |
| 25 to 34 Year Olds | 572 (85.9%) | 94 (14.1%) |
| 35 Years and over | 419 (83.8%) | 81 (16.2%) |
| Total | 16,230 (81.5%) | 3,684 (18.5%) |
Educational Attainment by Field of Study in St. Landry Parish
Education (2,547 | 31.4%), business (1,341 | 16.5%), science & technology (884 | 10.9%), physical & health sciences (582 | 7.2%), and liberal arts & history (502 | 6.2%) are the most common fields of study among 8,108 individuals in St. Landry Parish who have obtained a bachelor's degree or higher.
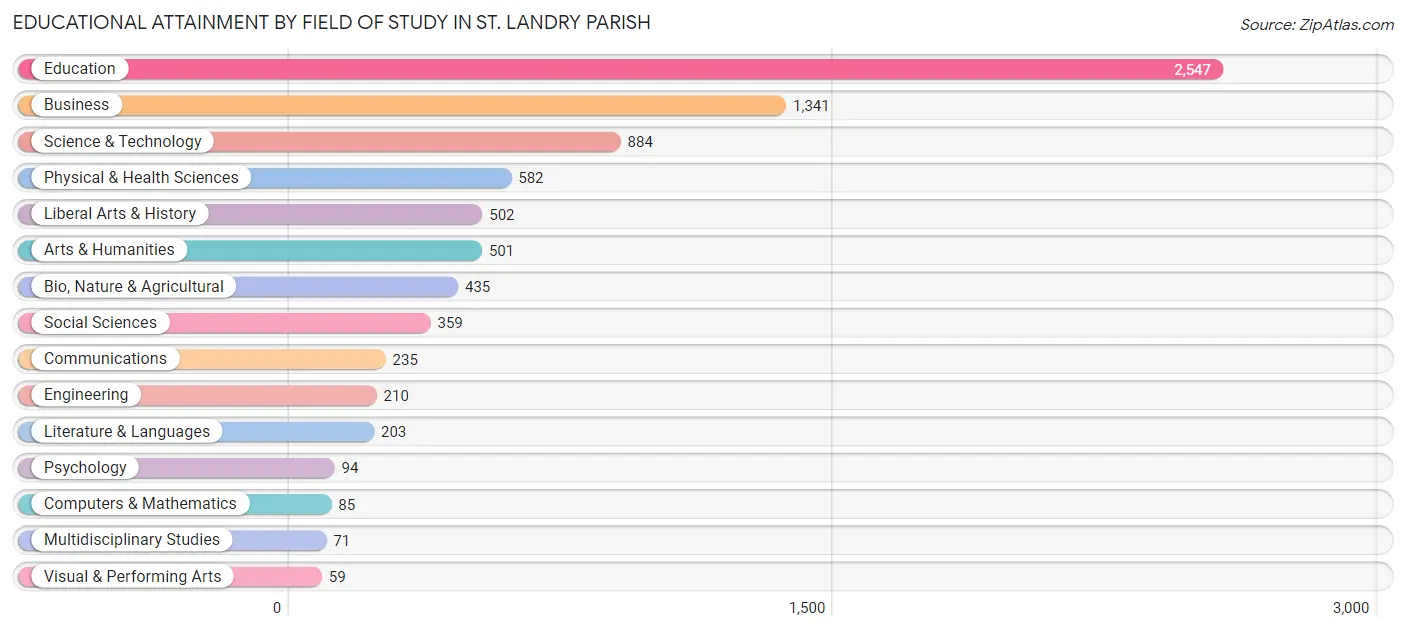
| Field of Study | # Graduates | % Graduates |
| Computers & Mathematics | 85 | 1.1% |
| Bio, Nature & Agricultural | 435 | 5.4% |
| Physical & Health Sciences | 582 | 7.2% |
| Psychology | 94 | 1.2% |
| Social Sciences | 359 | 4.4% |
| Engineering | 210 | 2.6% |
| Multidisciplinary Studies | 71 | 0.9% |
| Science & Technology | 884 | 10.9% |
| Business | 1,341 | 16.5% |
| Education | 2,547 | 31.4% |
| Literature & Languages | 203 | 2.5% |
| Liberal Arts & History | 502 | 6.2% |
| Visual & Performing Arts | 59 | 0.7% |
| Communications | 235 | 2.9% |
| Arts & Humanities | 501 | 6.2% |
| Total | 8,108 | 100.0% |
Transportation & Commute in St. Landry Parish
Vehicle Availability by Sex in St. Landry Parish
The most prevalent vehicle ownership categories in St. Landry Parish are males with 2 vehicles (6,977, accounting for 44.1%) and females with 2 vehicles (5,344, making up 49.4%).
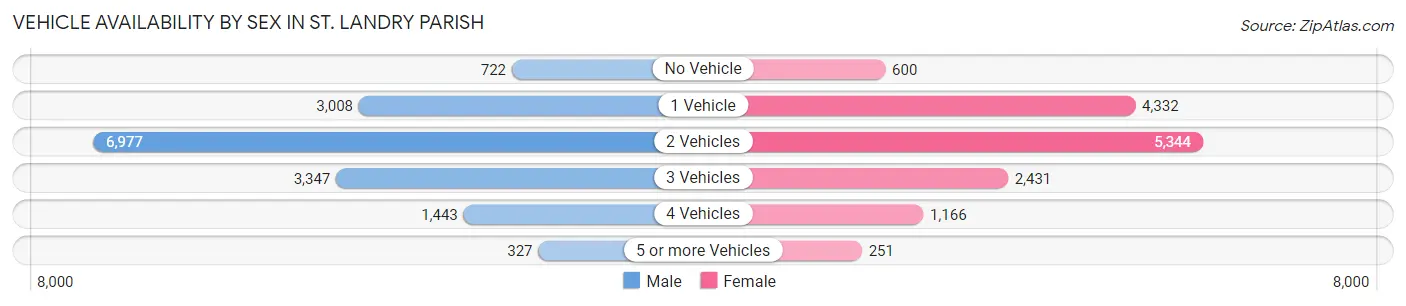
| Vehicles Available | Male | Female |
| No Vehicle | 722 (4.6%) | 600 (4.3%) |
| 1 Vehicle | 3,008 (19.0%) | 4,332 (30.7%) |
| 2 Vehicles | 6,977 (44.1%) | 5,344 (37.8%) |
| 3 Vehicles | 3,347 (21.1%) | 2,431 (17.2%) |
| 4 Vehicles | 1,443 (9.1%) | 1,166 (8.3%) |
| 5 or more Vehicles | 327 (2.1%) | 251 (1.8%) |
| Total | 15,824 (100.0%) | 14,124 (100.0%) |
Commute Time in St. Landry Parish
The most frequently occuring commute durations in St. Landry Parish are 30 to 34 minutes (4,028 commuters, 14.2%), 10 to 14 minutes (3,927 commuters, 13.9%), and 15 to 19 minutes (3,763 commuters, 13.3%).
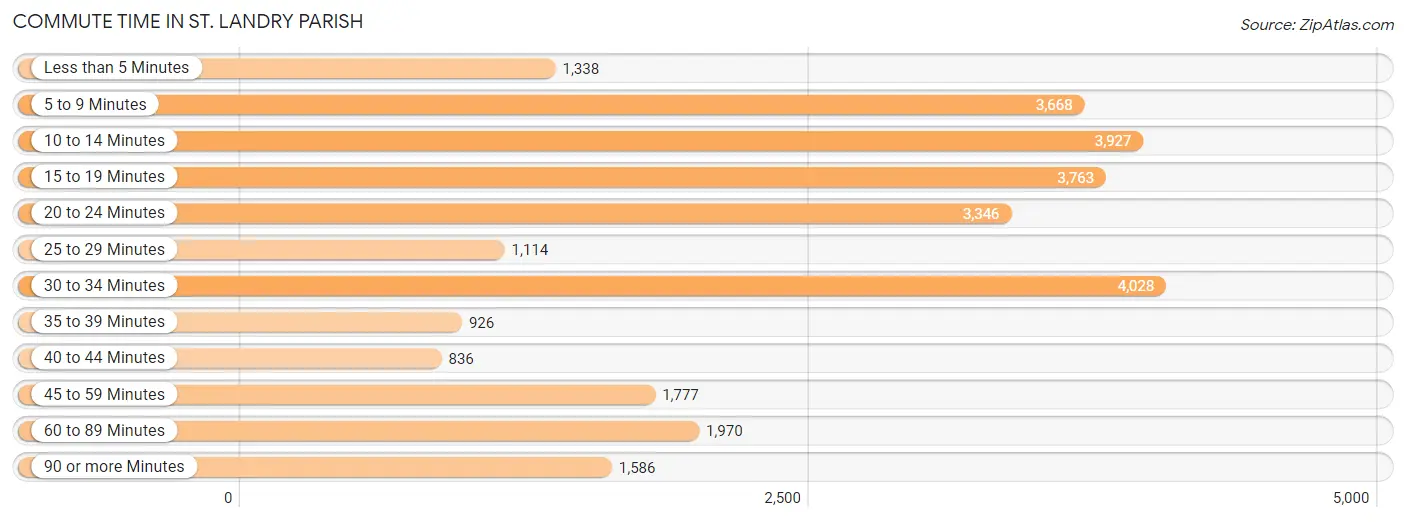
| Commute Time | # Commuters | % Commuters |
| Less than 5 Minutes | 1,338 | 4.7% |
| 5 to 9 Minutes | 3,668 | 13.0% |
| 10 to 14 Minutes | 3,927 | 13.9% |
| 15 to 19 Minutes | 3,763 | 13.3% |
| 20 to 24 Minutes | 3,346 | 11.8% |
| 25 to 29 Minutes | 1,114 | 3.9% |
| 30 to 34 Minutes | 4,028 | 14.2% |
| 35 to 39 Minutes | 926 | 3.3% |
| 40 to 44 Minutes | 836 | 3.0% |
| 45 to 59 Minutes | 1,777 | 6.3% |
| 60 to 89 Minutes | 1,970 | 7.0% |
| 90 or more Minutes | 1,586 | 5.6% |
Commute Time by Sex in St. Landry Parish
The most common commute times in St. Landry Parish are 15 to 19 minutes (2,145 commuters, 14.3%) for males and 5 to 9 minutes (2,382 commuters, 18.0%) for females.
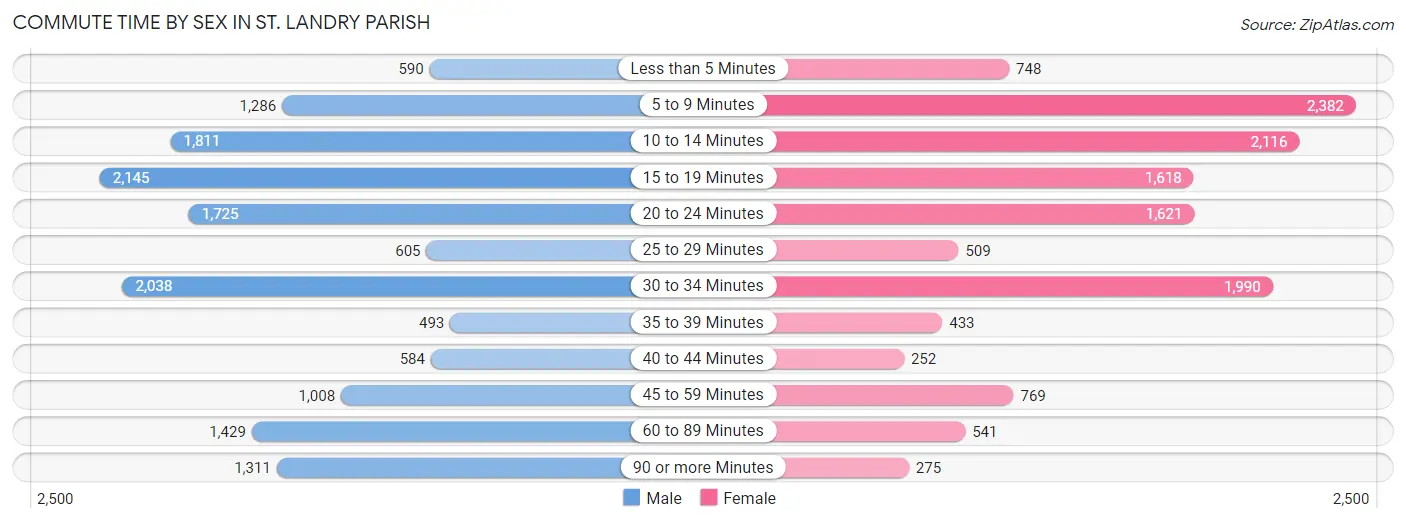
| Commute Time | Male | Female |
| Less than 5 Minutes | 590 (3.9%) | 748 (5.6%) |
| 5 to 9 Minutes | 1,286 (8.6%) | 2,382 (18.0%) |
| 10 to 14 Minutes | 1,811 (12.0%) | 2,116 (16.0%) |
| 15 to 19 Minutes | 2,145 (14.3%) | 1,618 (12.2%) |
| 20 to 24 Minutes | 1,725 (11.5%) | 1,621 (12.2%) |
| 25 to 29 Minutes | 605 (4.0%) | 509 (3.8%) |
| 30 to 34 Minutes | 2,038 (13.6%) | 1,990 (15.0%) |
| 35 to 39 Minutes | 493 (3.3%) | 433 (3.3%) |
| 40 to 44 Minutes | 584 (3.9%) | 252 (1.9%) |
| 45 to 59 Minutes | 1,008 (6.7%) | 769 (5.8%) |
| 60 to 89 Minutes | 1,429 (9.5%) | 541 (4.1%) |
| 90 or more Minutes | 1,311 (8.7%) | 275 (2.1%) |
Time of Departure to Work by Sex in St. Landry Parish
The most frequent times of departure to work in St. Landry Parish are 7:00 AM to 7:29 AM (3,035, 20.2%) for males and 7:00 AM to 7:29 AM (3,198, 24.1%) for females.
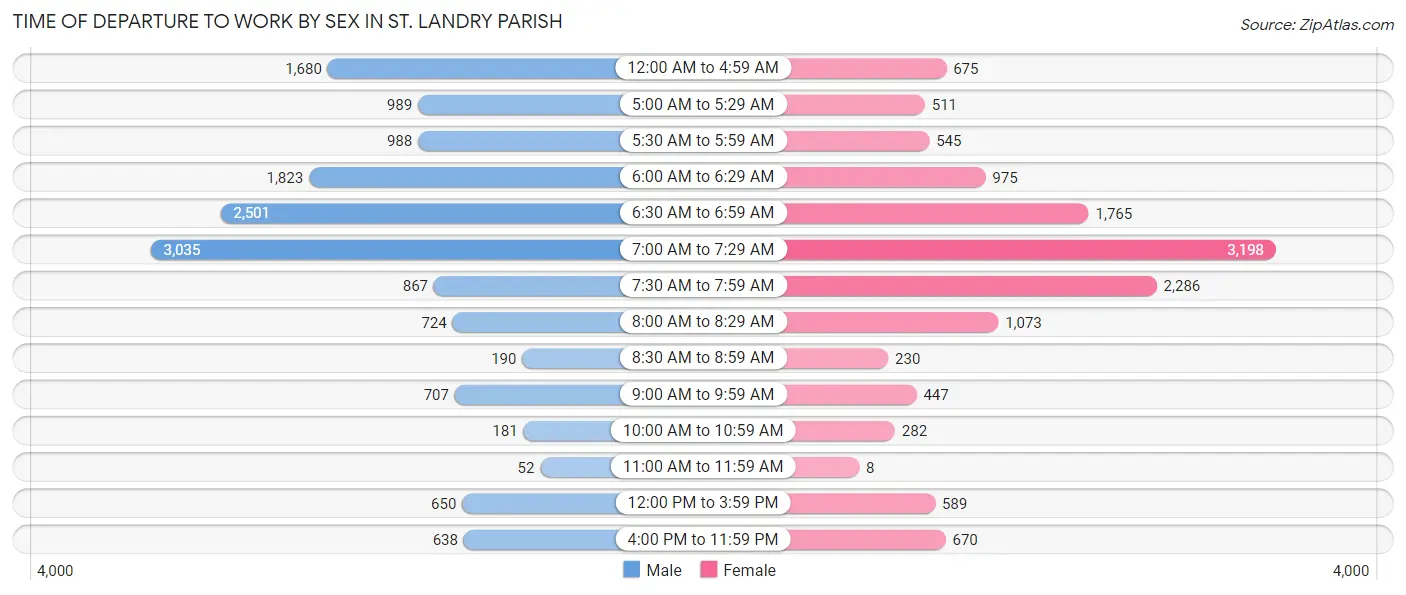
| Time of Departure | Male | Female |
| 12:00 AM to 4:59 AM | 1,680 (11.2%) | 675 (5.1%) |
| 5:00 AM to 5:29 AM | 989 (6.6%) | 511 (3.9%) |
| 5:30 AM to 5:59 AM | 988 (6.6%) | 545 (4.1%) |
| 6:00 AM to 6:29 AM | 1,823 (12.1%) | 975 (7.4%) |
| 6:30 AM to 6:59 AM | 2,501 (16.7%) | 1,765 (13.3%) |
| 7:00 AM to 7:29 AM | 3,035 (20.2%) | 3,198 (24.1%) |
| 7:30 AM to 7:59 AM | 867 (5.8%) | 2,286 (17.2%) |
| 8:00 AM to 8:29 AM | 724 (4.8%) | 1,073 (8.1%) |
| 8:30 AM to 8:59 AM | 190 (1.3%) | 230 (1.7%) |
| 9:00 AM to 9:59 AM | 707 (4.7%) | 447 (3.4%) |
| 10:00 AM to 10:59 AM | 181 (1.2%) | 282 (2.1%) |
| 11:00 AM to 11:59 AM | 52 (0.4%) | 8 (0.1%) |
| 12:00 PM to 3:59 PM | 650 (4.3%) | 589 (4.4%) |
| 4:00 PM to 11:59 PM | 638 (4.3%) | 670 (5.1%) |
| Total | 15,025 (100.0%) | 13,254 (100.0%) |
Housing Occupancy in St. Landry Parish
Occupancy by Ownership in St. Landry Parish
Of the total 30,888 dwellings in St. Landry Parish, owner-occupied units account for 21,194 (68.6%), while renter-occupied units make up 9,694 (31.4%).
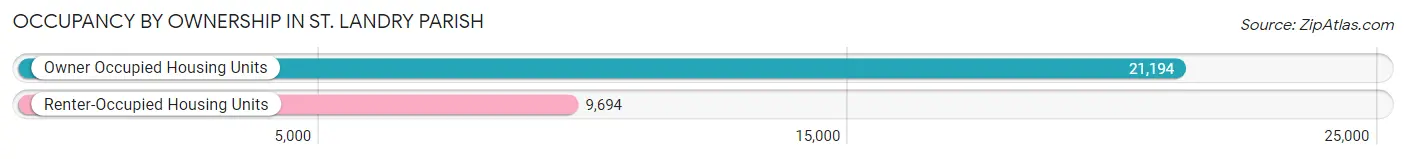
| Occupancy | # Housing Units | % Housing Units |
| Owner Occupied Housing Units | 21,194 | 68.6% |
| Renter-Occupied Housing Units | 9,694 | 31.4% |
| Total Occupied Housing Units | 30,888 | 100.0% |
Occupancy by Household Size in St. Landry Parish
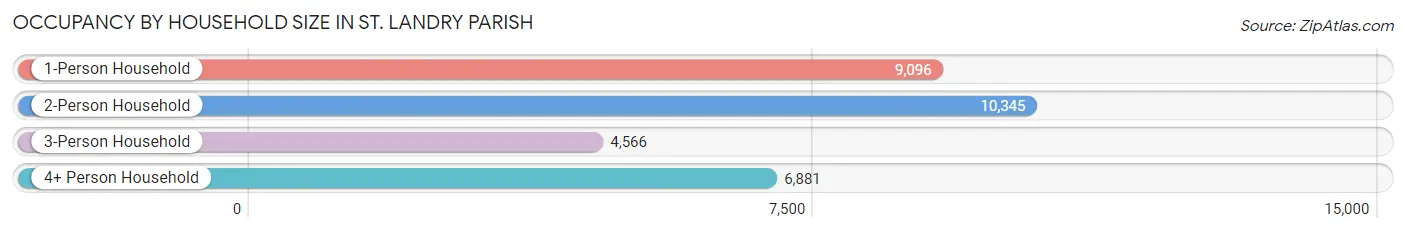
| Household Size | # Housing Units | % Housing Units |
| 1-Person Household | 9,096 | 29.4% |
| 2-Person Household | 10,345 | 33.5% |
| 3-Person Household | 4,566 | 14.8% |
| 4+ Person Household | 6,881 | 22.3% |
| Total Housing Units | 30,888 | 100.0% |
Occupancy by Ownership by Household Size in St. Landry Parish
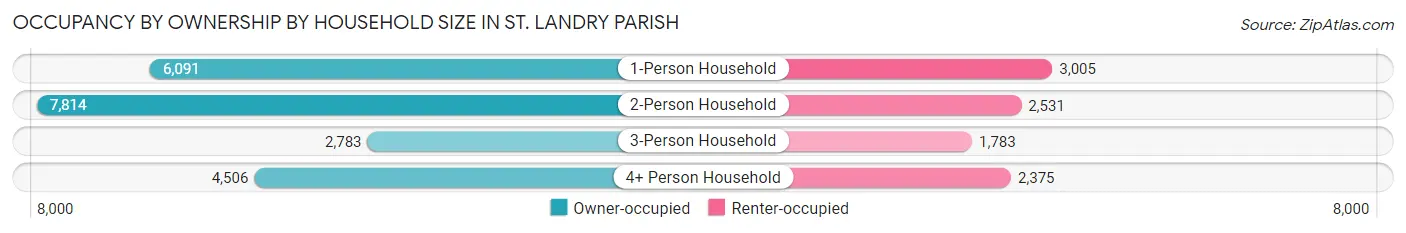
| Household Size | Owner-occupied | Renter-occupied |
| 1-Person Household | 6,091 (67.0%) | 3,005 (33.0%) |
| 2-Person Household | 7,814 (75.5%) | 2,531 (24.5%) |
| 3-Person Household | 2,783 (61.0%) | 1,783 (39.1%) |
| 4+ Person Household | 4,506 (65.5%) | 2,375 (34.5%) |
| Total Housing Units | 21,194 (68.6%) | 9,694 (31.4%) |
Occupancy by Educational Attainment in St. Landry Parish
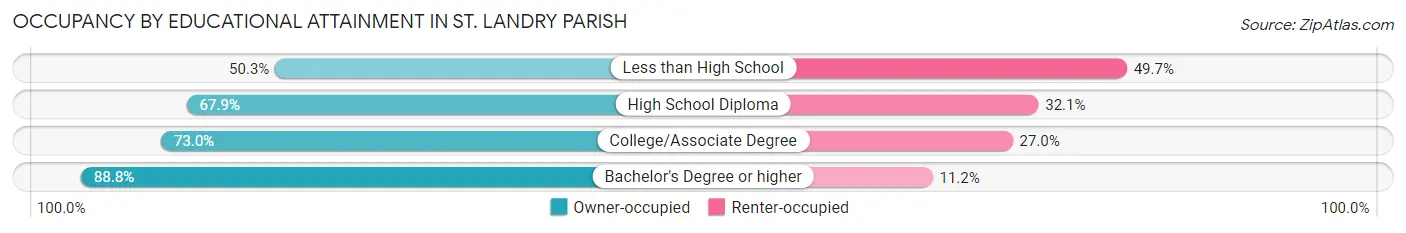
| Household Size | Owner-occupied | Renter-occupied |
| Less than High School | 3,338 (50.3%) | 3,295 (49.7%) |
| High School Diploma | 7,495 (67.9%) | 3,550 (32.1%) |
| College/Associate Degree | 6,314 (73.0%) | 2,340 (27.0%) |
| Bachelor's Degree or higher | 4,047 (88.8%) | 509 (11.2%) |
Occupancy by Age of Householder in St. Landry Parish
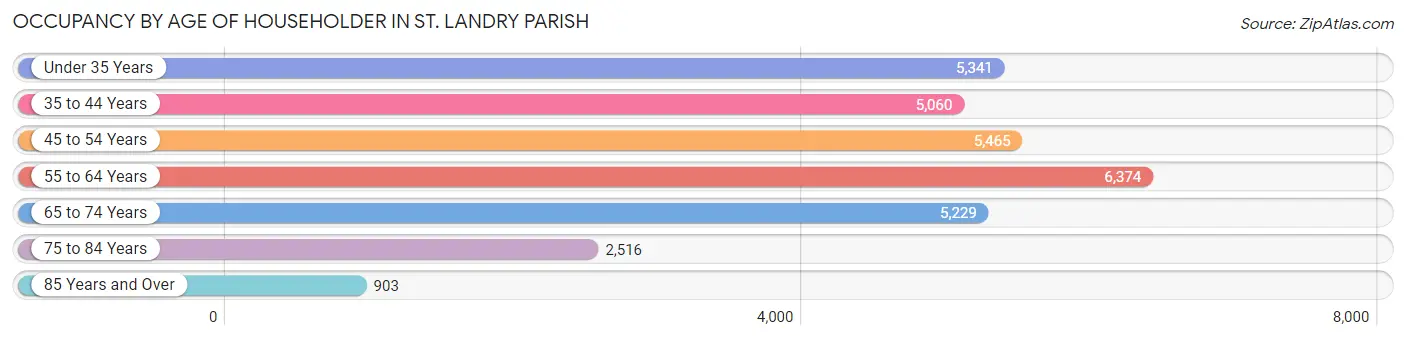
| Age Bracket | # Households | % Households |
| Under 35 Years | 5,341 | 17.3% |
| 35 to 44 Years | 5,060 | 16.4% |
| 45 to 54 Years | 5,465 | 17.7% |
| 55 to 64 Years | 6,374 | 20.6% |
| 65 to 74 Years | 5,229 | 16.9% |
| 75 to 84 Years | 2,516 | 8.2% |
| 85 Years and Over | 903 | 2.9% |
| Total | 30,888 | 100.0% |
Housing Finances in St. Landry Parish
Median Income by Occupancy in St. Landry Parish
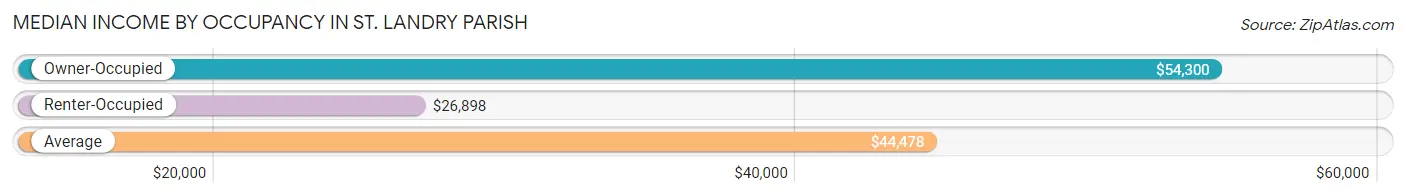
| Occupancy Type | # Households | Median Income |
| Owner-Occupied | 21,194 (68.6%) | $54,300 |
| Renter-Occupied | 9,694 (31.4%) | $26,898 |
| Average | 30,888 (100.0%) | $44,478 |
Occupancy by Householder Income Bracket in St. Landry Parish
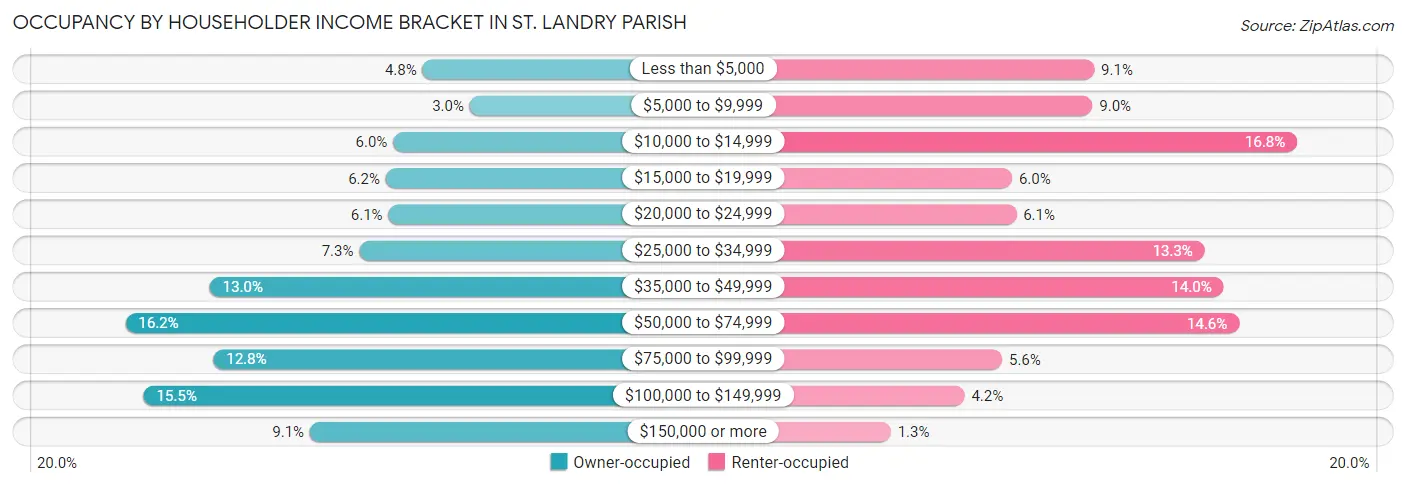
| Income Bracket | Owner-occupied | Renter-occupied |
| Less than $5,000 | 1,026 (4.8%) | 881 (9.1%) |
| $5,000 to $9,999 | 645 (3.0%) | 874 (9.0%) |
| $10,000 to $14,999 | 1,264 (6.0%) | 1,631 (16.8%) |
| $15,000 to $19,999 | 1,322 (6.2%) | 578 (6.0%) |
| $20,000 to $24,999 | 1,302 (6.1%) | 593 (6.1%) |
| $25,000 to $34,999 | 1,536 (7.2%) | 1,289 (13.3%) |
| $35,000 to $49,999 | 2,744 (13.0%) | 1,359 (14.0%) |
| $50,000 to $74,999 | 3,426 (16.2%) | 1,416 (14.6%) |
| $75,000 to $99,999 | 2,715 (12.8%) | 541 (5.6%) |
| $100,000 to $149,999 | 3,278 (15.5%) | 402 (4.2%) |
| $150,000 or more | 1,936 (9.1%) | 130 (1.3%) |
| Total | 21,194 (100.0%) | 9,694 (100.0%) |
Monthly Housing Cost Tiers in St. Landry Parish
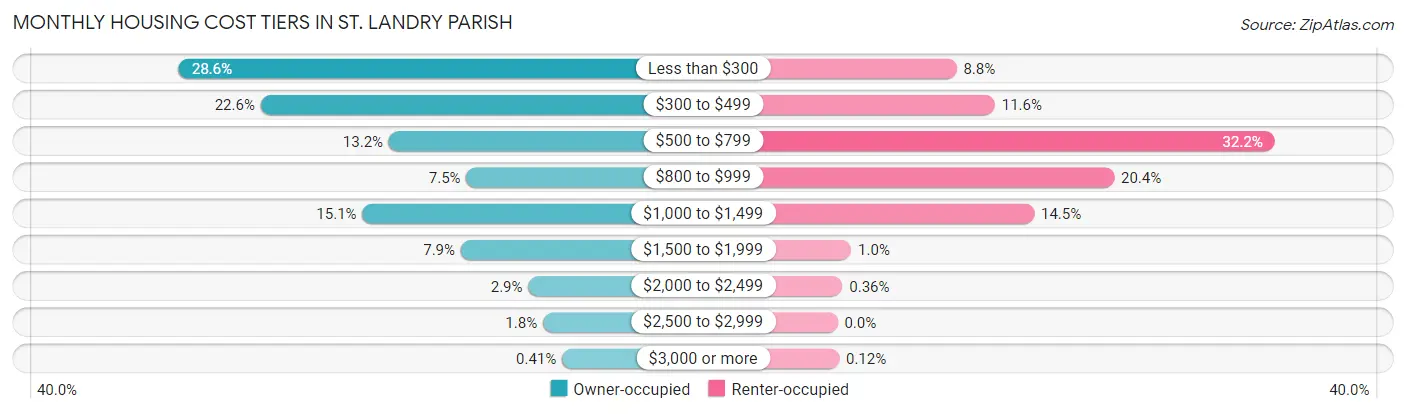
| Monthly Cost | Owner-occupied | Renter-occupied |
| Less than $300 | 6,069 (28.6%) | 850 (8.8%) |
| $300 to $499 | 4,792 (22.6%) | 1,124 (11.6%) |
| $500 to $799 | 2,792 (13.2%) | 3,121 (32.2%) |
| $800 to $999 | 1,581 (7.5%) | 1,975 (20.4%) |
| $1,000 to $1,499 | 3,204 (15.1%) | 1,404 (14.5%) |
| $1,500 to $1,999 | 1,668 (7.9%) | 98 (1.0%) |
| $2,000 to $2,499 | 615 (2.9%) | 35 (0.4%) |
| $2,500 to $2,999 | 386 (1.8%) | 0 (0.0%) |
| $3,000 or more | 87 (0.4%) | 12 (0.1%) |
| Total | 21,194 (100.0%) | 9,694 (100.0%) |
Physical Housing Characteristics in St. Landry Parish
Housing Structures in St. Landry Parish
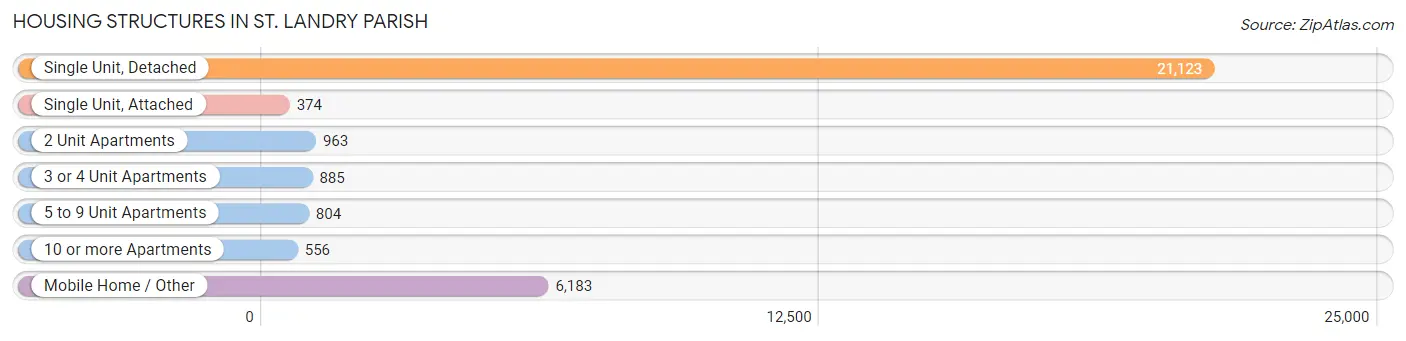
| Structure Type | # Housing Units | % Housing Units |
| Single Unit, Detached | 21,123 | 68.4% |
| Single Unit, Attached | 374 | 1.2% |
| 2 Unit Apartments | 963 | 3.1% |
| 3 or 4 Unit Apartments | 885 | 2.9% |
| 5 to 9 Unit Apartments | 804 | 2.6% |
| 10 or more Apartments | 556 | 1.8% |
| Mobile Home / Other | 6,183 | 20.0% |
| Total | 30,888 | 100.0% |
Housing Structures by Occupancy in St. Landry Parish
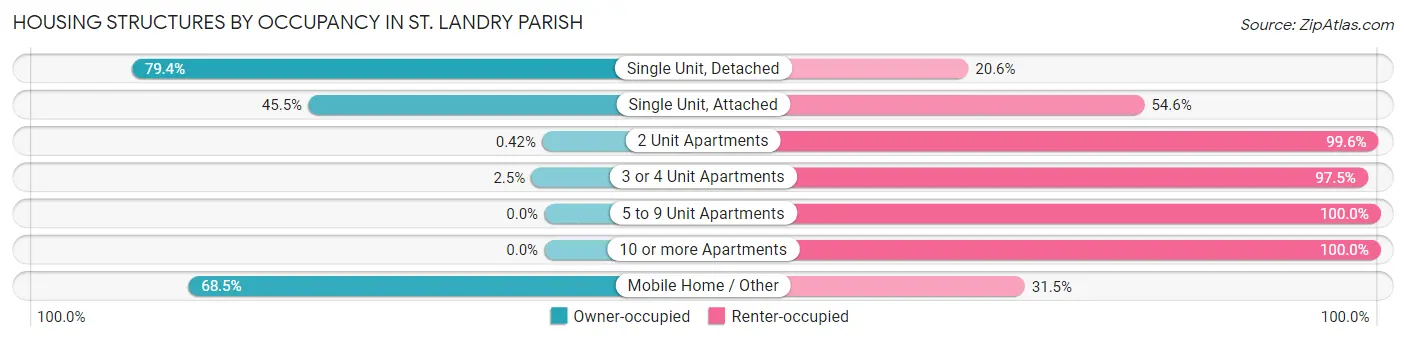
| Structure Type | Owner-occupied | Renter-occupied |
| Single Unit, Detached | 16,764 (79.4%) | 4,359 (20.6%) |
| Single Unit, Attached | 170 (45.5%) | 204 (54.5%) |
| 2 Unit Apartments | 4 (0.4%) | 959 (99.6%) |
| 3 or 4 Unit Apartments | 22 (2.5%) | 863 (97.5%) |
| 5 to 9 Unit Apartments | 0 (0.0%) | 804 (100.0%) |
| 10 or more Apartments | 0 (0.0%) | 556 (100.0%) |
| Mobile Home / Other | 4,234 (68.5%) | 1,949 (31.5%) |
| Total | 21,194 (68.6%) | 9,694 (31.4%) |
Housing Structures by Number of Rooms in St. Landry Parish
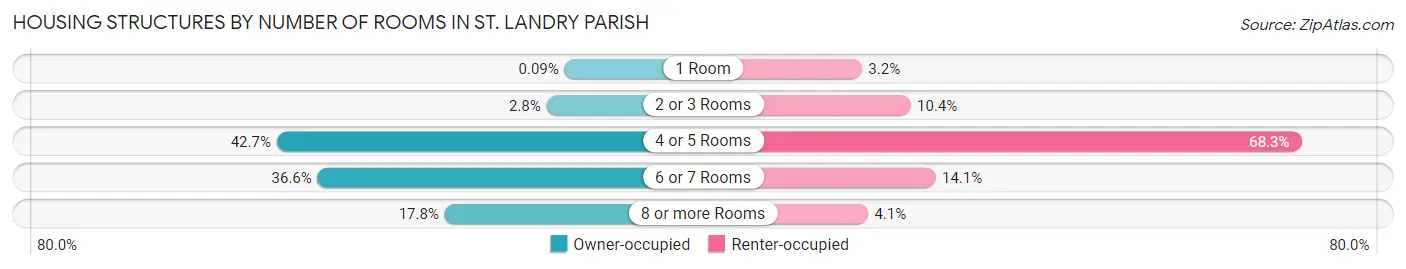
| Number of Rooms | Owner-occupied | Renter-occupied |
| 1 Room | 20 (0.1%) | 308 (3.2%) |
| 2 or 3 Rooms | 582 (2.8%) | 1,007 (10.4%) |
| 4 or 5 Rooms | 9,048 (42.7%) | 6,619 (68.3%) |
| 6 or 7 Rooms | 7,765 (36.6%) | 1,365 (14.1%) |
| 8 or more Rooms | 3,779 (17.8%) | 395 (4.1%) |
| Total | 21,194 (100.0%) | 9,694 (100.0%) |
Housing Structure by Heating Type in St. Landry Parish
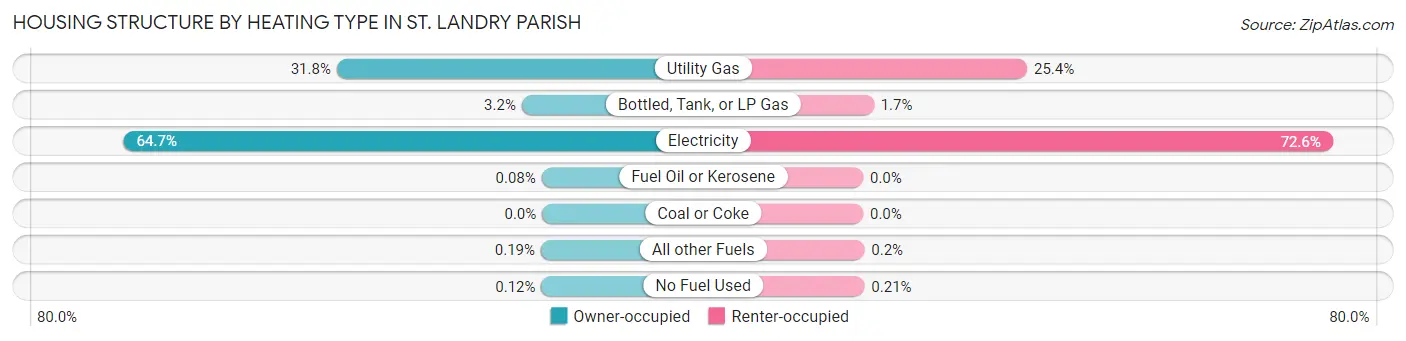
| Heating Type | Owner-occupied | Renter-occupied |
| Utility Gas | 6,729 (31.8%) | 2,457 (25.4%) |
| Bottled, Tank, or LP Gas | 667 (3.2%) | 160 (1.7%) |
| Electricity | 13,715 (64.7%) | 7,038 (72.6%) |
| Fuel Oil or Kerosene | 18 (0.1%) | 0 (0.0%) |
| Coal or Coke | 0 (0.0%) | 0 (0.0%) |
| All other Fuels | 40 (0.2%) | 19 (0.2%) |
| No Fuel Used | 25 (0.1%) | 20 (0.2%) |
| Total | 21,194 (100.0%) | 9,694 (100.0%) |
Household Vehicle Usage in St. Landry Parish
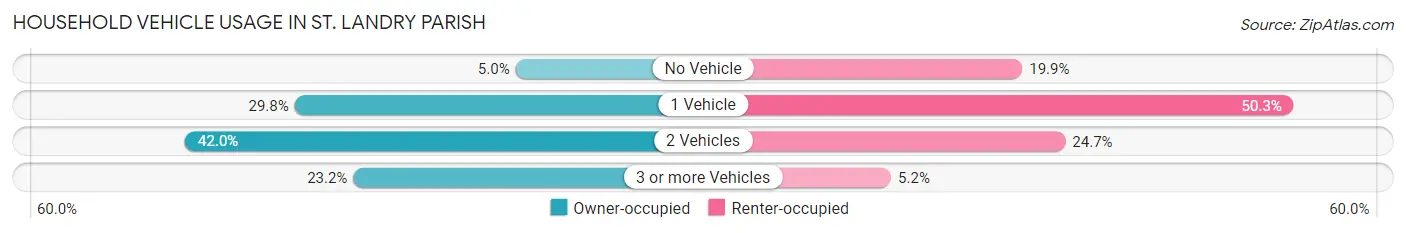
| Vehicles per Household | Owner-occupied | Renter-occupied |
| No Vehicle | 1,062 (5.0%) | 1,926 (19.9%) |
| 1 Vehicle | 6,308 (29.8%) | 4,872 (50.3%) |
| 2 Vehicles | 8,909 (42.0%) | 2,394 (24.7%) |
| 3 or more Vehicles | 4,915 (23.2%) | 502 (5.2%) |
| Total | 21,194 (100.0%) | 9,694 (100.0%) |
Real Estate & Mortgages in St. Landry Parish
Real Estate and Mortgage Overview in St. Landry Parish
| Characteristic | Without Mortgage | With Mortgage |
| Housing Units | 12,609 | 8,585 |
| Median Property Value | $115,000 | $184,400 |
| Median Household Income | $41,534 | $1,322 |
| Monthly Housing Costs | $308 | $83 |
| Real Estate Taxes | $272 | $3,234 |
Property Value by Mortgage Status in St. Landry Parish
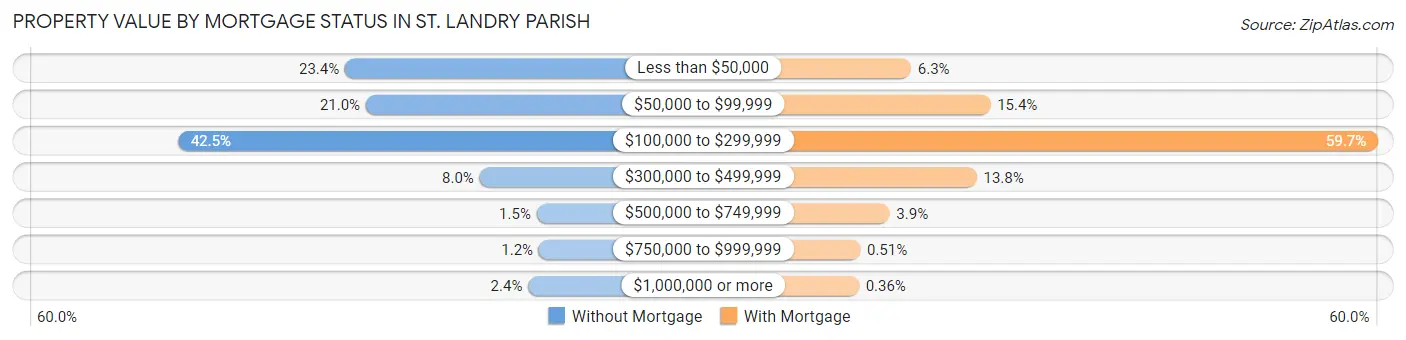
| Property Value | Without Mortgage | With Mortgage |
| Less than $50,000 | 2,948 (23.4%) | 543 (6.3%) |
| $50,000 to $99,999 | 2,647 (21.0%) | 1,321 (15.4%) |
| $100,000 to $299,999 | 5,359 (42.5%) | 5,127 (59.7%) |
| $300,000 to $499,999 | 1,008 (8.0%) | 1,187 (13.8%) |
| $500,000 to $749,999 | 185 (1.5%) | 332 (3.9%) |
| $750,000 to $999,999 | 154 (1.2%) | 44 (0.5%) |
| $1,000,000 or more | 308 (2.4%) | 31 (0.4%) |
| Total | 12,609 (100.0%) | 8,585 (100.0%) |
Household Income by Mortgage Status in St. Landry Parish
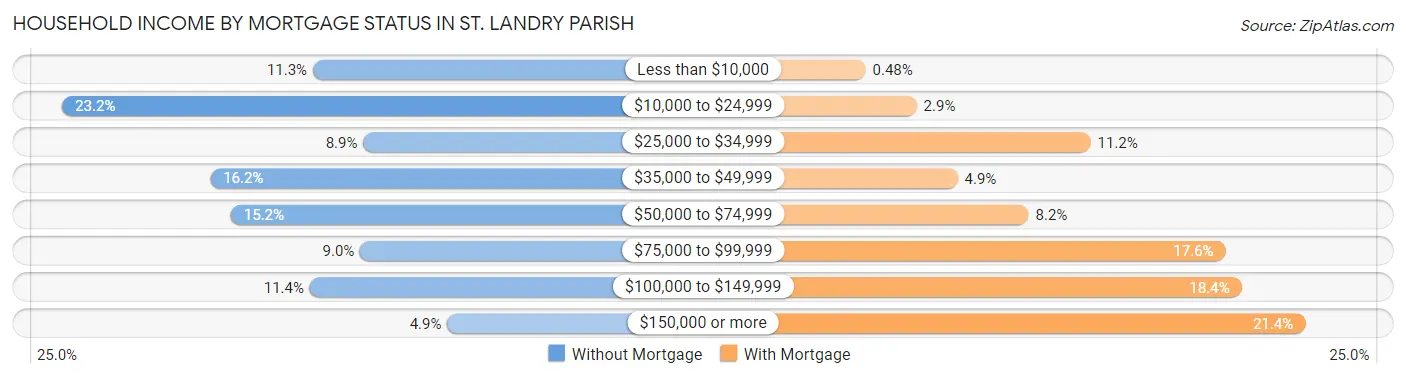
| Household Income | Without Mortgage | With Mortgage |
| Less than $10,000 | 1,421 (11.3%) | 41 (0.5%) |
| $10,000 to $24,999 | 2,927 (23.2%) | 250 (2.9%) |
| $25,000 to $34,999 | 1,119 (8.9%) | 961 (11.2%) |
| $35,000 to $49,999 | 2,037 (16.2%) | 417 (4.9%) |
| $50,000 to $74,999 | 1,914 (15.2%) | 707 (8.2%) |
| $75,000 to $99,999 | 1,137 (9.0%) | 1,512 (17.6%) |
| $100,000 to $149,999 | 1,440 (11.4%) | 1,578 (18.4%) |
| $150,000 or more | 614 (4.9%) | 1,838 (21.4%) |
| Total | 12,609 (100.0%) | 8,585 (100.0%) |
Property Value to Household Income Ratio in St. Landry Parish
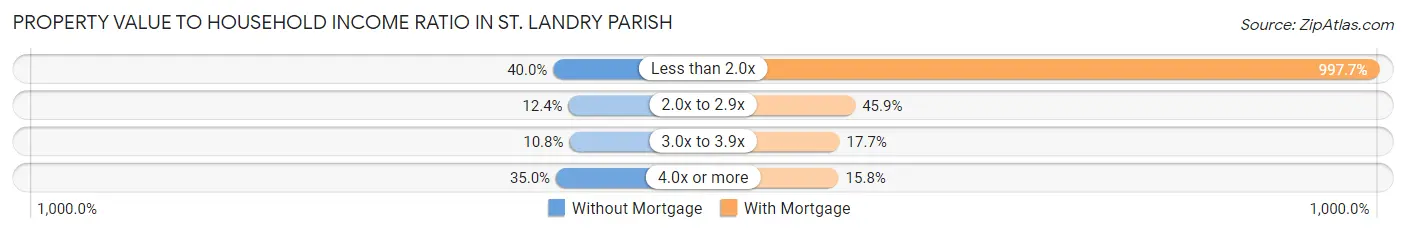
| Value-to-Income Ratio | Without Mortgage | With Mortgage |
| Less than 2.0x | 5,044 (40.0%) | 85,655 (997.7%) |
| 2.0x to 2.9x | 1,558 (12.4%) | 3,944 (45.9%) |
| 3.0x to 3.9x | 1,361 (10.8%) | 1,521 (17.7%) |
| 4.0x or more | 4,415 (35.0%) | 1,359 (15.8%) |
| Total | 12,609 (100.0%) | 8,585 (100.0%) |
Real Estate Taxes by Mortgage Status in St. Landry Parish
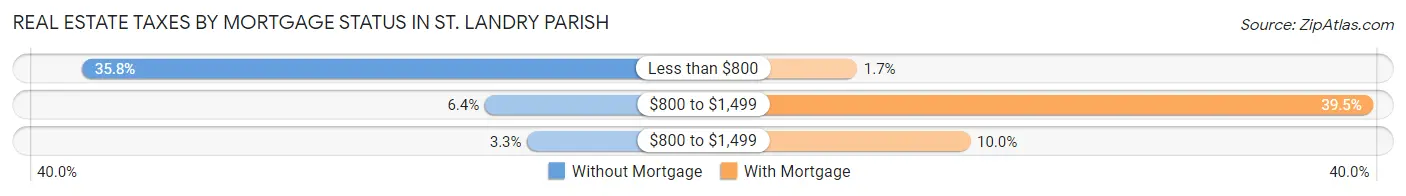
| Property Taxes | Without Mortgage | With Mortgage |
| Less than $800 | 4,515 (35.8%) | 149 (1.7%) |
| $800 to $1,499 | 802 (6.4%) | 3,390 (39.5%) |
| $800 to $1,499 | 412 (3.3%) | 859 (10.0%) |
| Total | 12,609 (100.0%) | 8,585 (100.0%) |
Health & Disability in St. Landry Parish
Health Insurance Coverage by Age in St. Landry Parish
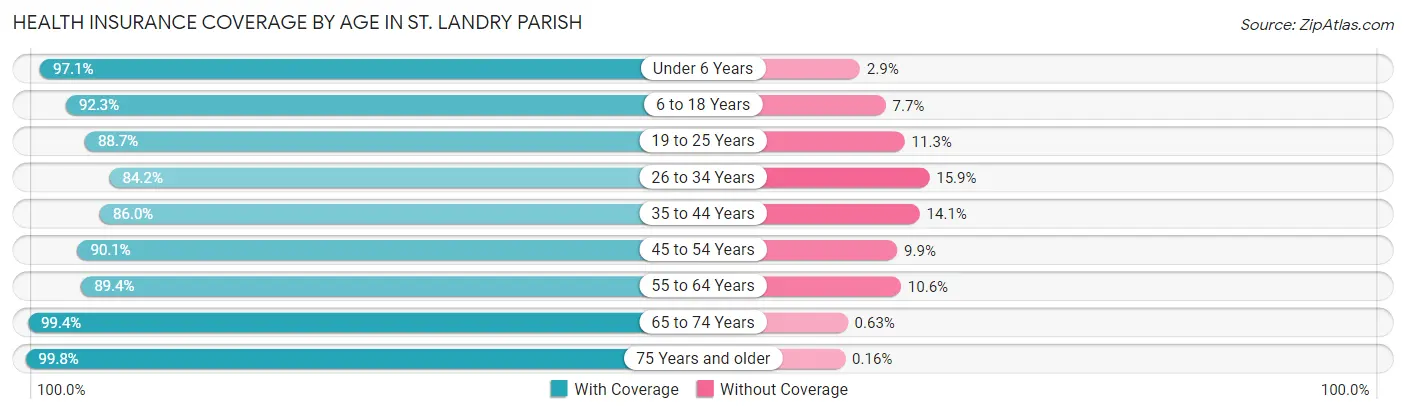
| Age Bracket | With Coverage | Without Coverage |
| Under 6 Years | 6,877 (97.1%) | 206 (2.9%) |
| 6 to 18 Years | 14,471 (92.3%) | 1,207 (7.7%) |
| 19 to 25 Years | 5,905 (88.7%) | 749 (11.3%) |
| 26 to 34 Years | 8,213 (84.2%) | 1,547 (15.9%) |
| 35 to 44 Years | 8,077 (86.0%) | 1,320 (14.1%) |
| 45 to 54 Years | 8,281 (90.1%) | 906 (9.9%) |
| 55 to 64 Years | 9,667 (89.4%) | 1,141 (10.6%) |
| 65 to 74 Years | 7,990 (99.4%) | 51 (0.6%) |
| 75 Years and older | 4,841 (99.8%) | 8 (0.2%) |
| Total | 74,322 (91.2%) | 7,135 (8.8%) |
Health Insurance Coverage by Citizenship Status in St. Landry Parish
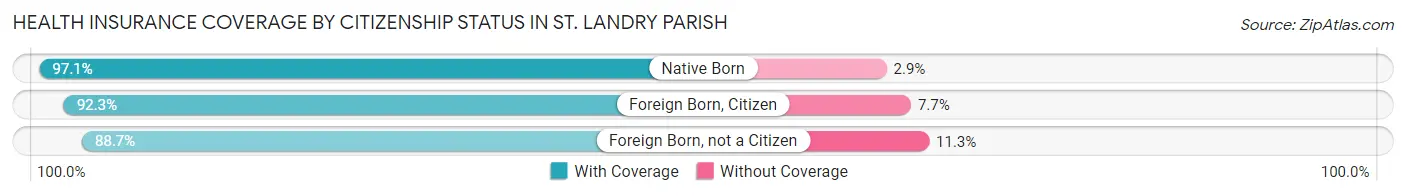
| Citizenship Status | With Coverage | Without Coverage |
| Native Born | 6,877 (97.1%) | 206 (2.9%) |
| Foreign Born, Citizen | 14,471 (92.3%) | 1,207 (7.7%) |
| Foreign Born, not a Citizen | 5,905 (88.7%) | 749 (11.3%) |
Health Insurance Coverage by Household Income in St. Landry Parish
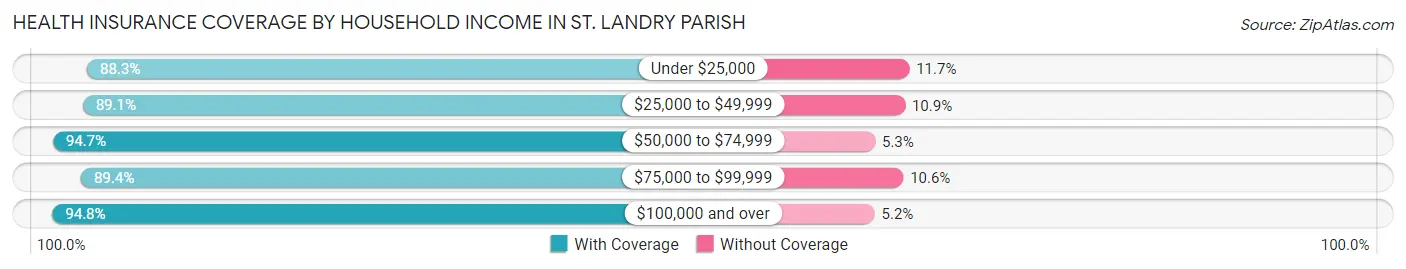
| Household Income | With Coverage | Without Coverage |
| Under $25,000 | 18,535 (88.3%) | 2,457 (11.7%) |
| $25,000 to $49,999 | 15,322 (89.1%) | 1,874 (10.9%) |
| $50,000 to $74,999 | 13,398 (94.7%) | 749 (5.3%) |
| $75,000 to $99,999 | 8,375 (89.4%) | 990 (10.6%) |
| $100,000 and over | 18,508 (94.8%) | 1,018 (5.2%) |
Public vs Private Health Insurance Coverage by Age in St. Landry Parish
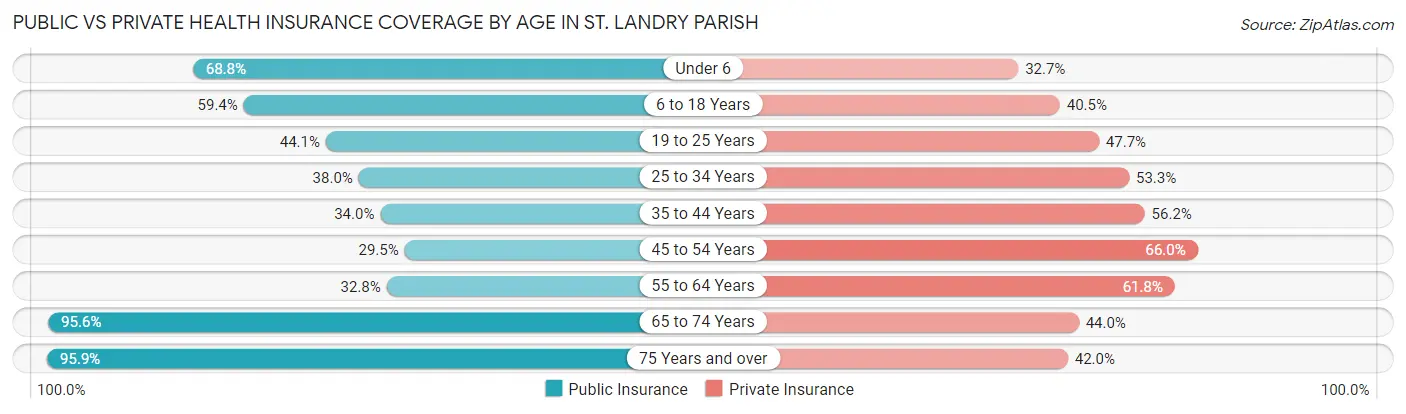
| Age Bracket | Public Insurance | Private Insurance |
| Under 6 | 4,871 (68.8%) | 2,319 (32.7%) |
| 6 to 18 Years | 9,305 (59.4%) | 6,343 (40.5%) |
| 19 to 25 Years | 2,934 (44.1%) | 3,175 (47.7%) |
| 25 to 34 Years | 3,708 (38.0%) | 5,203 (53.3%) |
| 35 to 44 Years | 3,194 (34.0%) | 5,283 (56.2%) |
| 45 to 54 Years | 2,707 (29.5%) | 6,066 (66.0%) |
| 55 to 64 Years | 3,546 (32.8%) | 6,678 (61.8%) |
| 65 to 74 Years | 7,690 (95.6%) | 3,536 (44.0%) |
| 75 Years and over | 4,648 (95.9%) | 2,034 (41.9%) |
| Total | 42,603 (52.3%) | 40,637 (49.9%) |
Disability Status by Sex by Age in St. Landry Parish
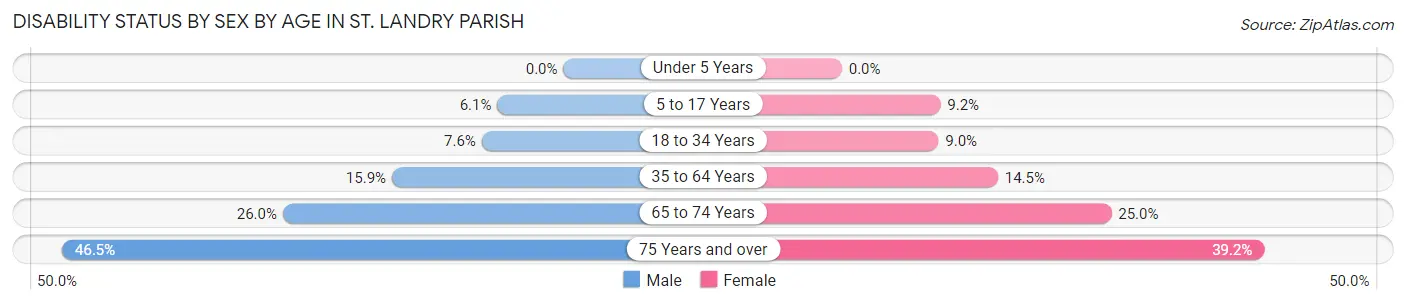
| Age Bracket | Male | Female |
| Under 5 Years | 0 (0.0%) | 0 (0.0%) |
| 5 to 17 Years | 496 (6.1%) | 720 (9.1%) |
| 18 to 34 Years | 643 (7.6%) | 795 (9.0%) |
| 35 to 64 Years | 2,229 (15.9%) | 2,228 (14.5%) |
| 65 to 74 Years | 985 (26.0%) | 1,065 (25.0%) |
| 75 Years and over | 895 (46.5%) | 1,147 (39.2%) |
Disability Class by Sex by Age in St. Landry Parish
Disability Class: Hearing Difficulty
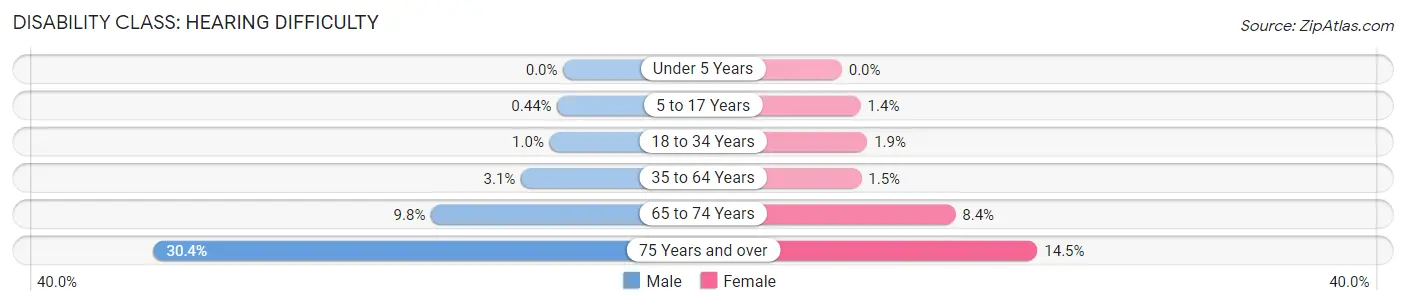
| Age Bracket | Male | Female |
| Under 5 Years | 0 (0.0%) | 0 (0.0%) |
| 5 to 17 Years | 36 (0.4%) | 110 (1.4%) |
| 18 to 34 Years | 86 (1.0%) | 168 (1.9%) |
| 35 to 64 Years | 438 (3.1%) | 223 (1.5%) |
| 65 to 74 Years | 371 (9.8%) | 359 (8.4%) |
| 75 Years and over | 585 (30.4%) | 425 (14.5%) |
Disability Class: Vision Difficulty
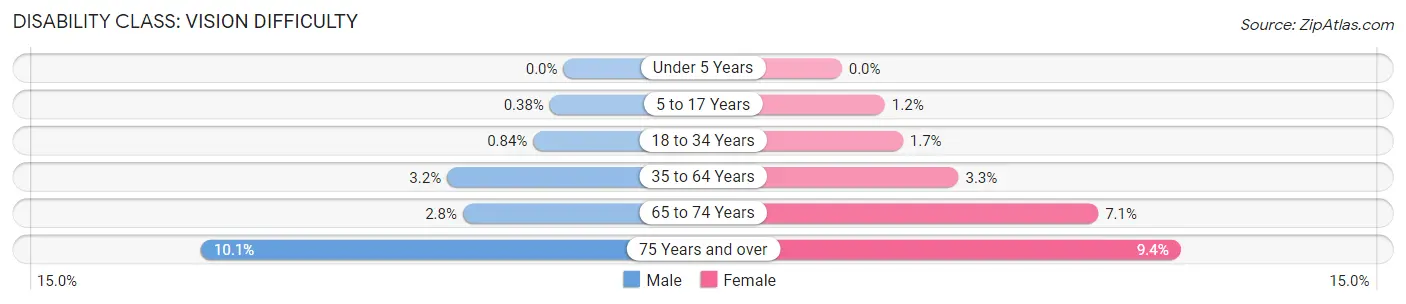
| Age Bracket | Male | Female |
| Under 5 Years | 0 (0.0%) | 0 (0.0%) |
| 5 to 17 Years | 31 (0.4%) | 94 (1.2%) |
| 18 to 34 Years | 71 (0.8%) | 151 (1.7%) |
| 35 to 64 Years | 454 (3.2%) | 500 (3.3%) |
| 65 to 74 Years | 106 (2.8%) | 304 (7.1%) |
| 75 Years and over | 194 (10.1%) | 276 (9.4%) |
Disability Class: Cognitive Difficulty
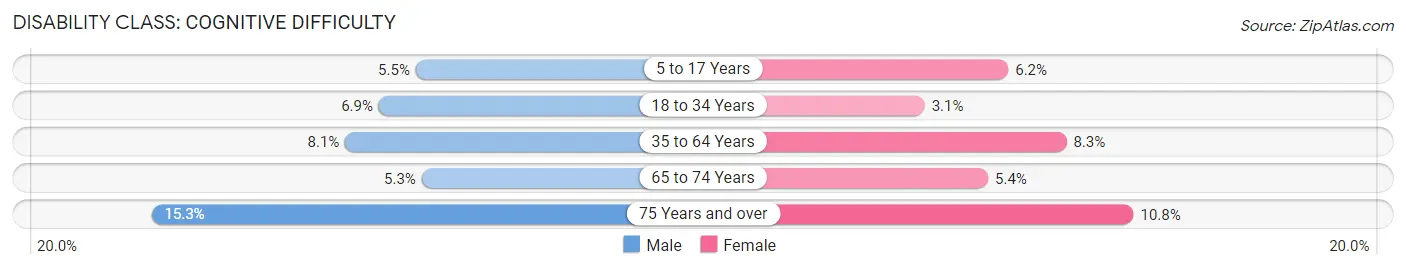
| Age Bracket | Male | Female |
| 5 to 17 Years | 444 (5.5%) | 486 (6.2%) |
| 18 to 34 Years | 581 (6.9%) | 273 (3.1%) |
| 35 to 64 Years | 1,134 (8.1%) | 1,283 (8.3%) |
| 65 to 74 Years | 199 (5.3%) | 231 (5.4%) |
| 75 Years and over | 294 (15.3%) | 317 (10.8%) |
Disability Class: Ambulatory Difficulty
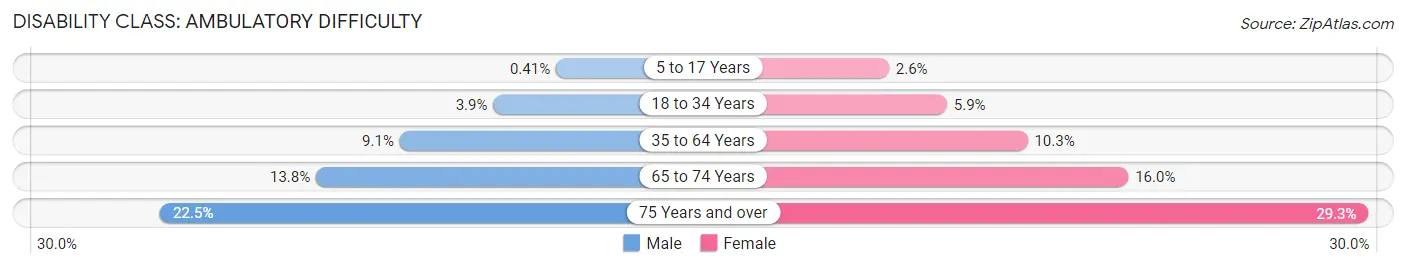
| Age Bracket | Male | Female |
| 5 to 17 Years | 33 (0.4%) | 206 (2.6%) |
| 18 to 34 Years | 331 (3.9%) | 519 (5.9%) |
| 35 to 64 Years | 1,276 (9.1%) | 1,590 (10.3%) |
| 65 to 74 Years | 521 (13.8%) | 679 (16.0%) |
| 75 Years and over | 432 (22.5%) | 858 (29.3%) |
Disability Class: Self-Care Difficulty
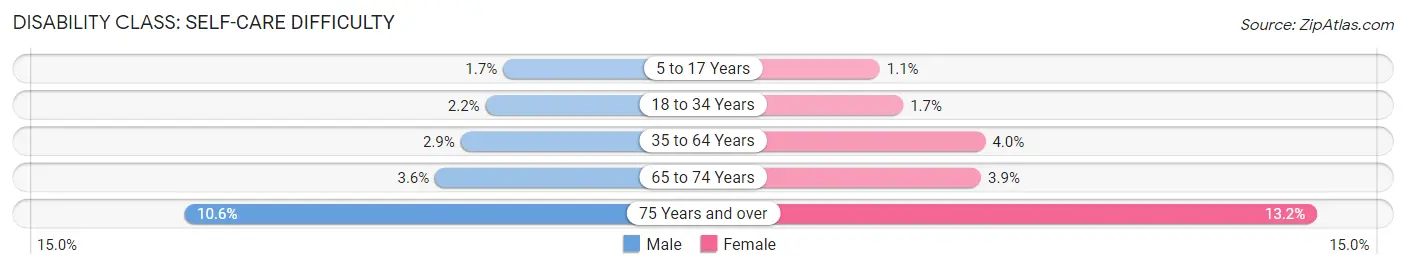
| Age Bracket | Male | Female |
| 5 to 17 Years | 136 (1.7%) | 83 (1.1%) |
| 18 to 34 Years | 184 (2.2%) | 152 (1.7%) |
| 35 to 64 Years | 400 (2.9%) | 615 (4.0%) |
| 65 to 74 Years | 135 (3.6%) | 165 (3.9%) |
| 75 Years and over | 203 (10.6%) | 387 (13.2%) |
Technology Access in St. Landry Parish
Computing Device Access in St. Landry Parish
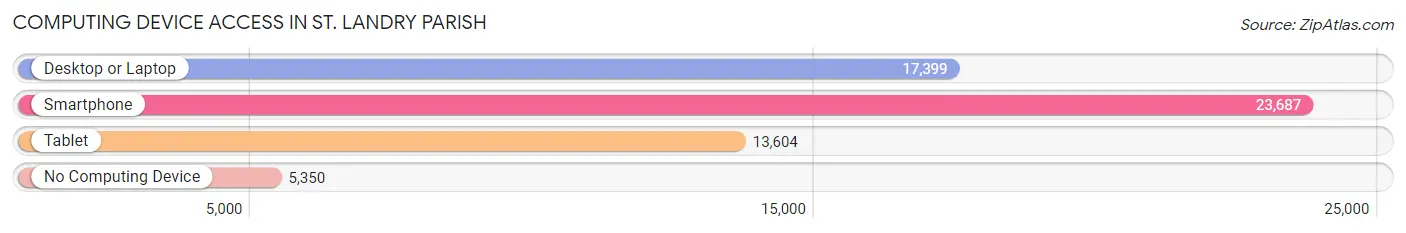
| Device Type | # Households | % Households |
| Desktop or Laptop | 17,399 | 56.3% |
| Smartphone | 23,687 | 76.7% |
| Tablet | 13,604 | 44.0% |
| No Computing Device | 5,350 | 17.3% |
| Total | 30,888 | 100.0% |
Internet Access in St. Landry Parish
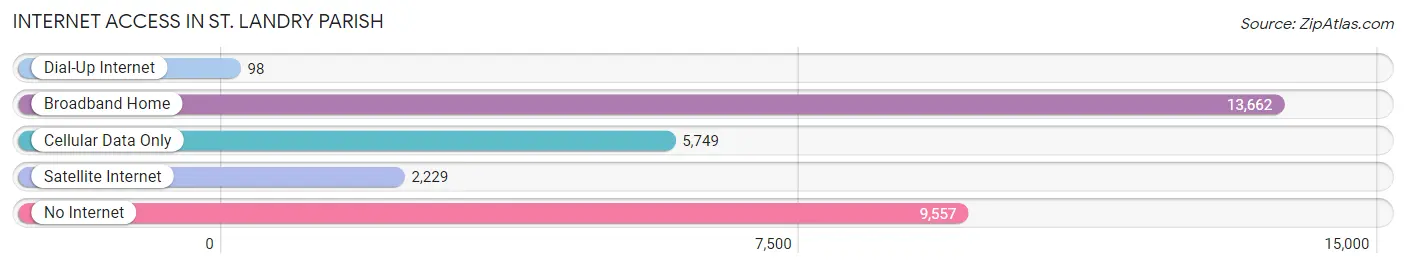
| Internet Type | # Households | % Households |
| Dial-Up Internet | 98 | 0.3% |
| Broadband Home | 13,662 | 44.2% |
| Cellular Data Only | 5,749 | 18.6% |
| Satellite Internet | 2,229 | 7.2% |
| No Internet | 9,557 | 30.9% |
| Total | 30,888 | 100.0% |
St. Landry Parish Summary
St. Landry Parish is located in the south-central region of Louisiana, and is part of the Acadiana region. It is bordered by Evangeline, Acadia, Lafayette, and Avoyelles parishes. The parish seat is Opelousas, and the parish has a total area of 676 square miles. As of the 2010 census, the population was 83,384, making it the fourth most populous parish in Louisiana.
Geography
St. Landry Parish is located in the south-central region of Louisiana, and is part of the Acadiana region. It is bordered by Evangeline, Acadia, Lafayette, and Avoyelles parishes. The parish seat is Opelousas, and the parish has a total area of 676 square miles. The terrain is mostly flat, with some rolling hills in the northern part of the parish. The parish is drained by the Bayou Courtableau, the Mermentau River, and the Calcasieu River. The climate is humid subtropical, with hot, humid summers and mild winters.
History
St. Landry Parish was established in 1807, and was named for St. Landry, a French missionary who served in the area in the 1700s. The parish was originally part of the Opelousas District, which was created in 1805. The parish was divided into two parts in 1868, with the western part becoming Evangeline Parish. The parish has a long history of French and Spanish settlement, and the area was home to many Native American tribes, including the Chitimacha, Attakapas, and Houma.
Economy
St. Landry Parish has a diverse economy, with a mix of agriculture, manufacturing, and services. The largest employers in the parish are the St. Landry Parish School Board, the St. Landry Parish Government, and the Opelousas General Health System. Agriculture is a major part of the economy, with the main crops being sugarcane, soybeans, corn, and rice. Manufacturing is also important, with the main industries being food processing, wood products, and metal fabrication. The service sector is also important, with the main industries being healthcare, retail, and tourism.
Demographics
As of the 2010 census, the population of St. Landry Parish was 83,384, making it the fourth most populous parish in Louisiana. The population is predominantly African American, with a small white minority. The median household income is $37,845, and the median age is 35. The poverty rate is 22.3%, and the unemployment rate is 6.2%.
St. Landry Parish is a diverse and vibrant community, with a rich history and a strong economy. The parish is home to a variety of cultures and industries, and is a great place to live and work.
Common Questions
What is the Total Population of St. Landry Parish?
Total Population of St. Landry Parish is 82,574.
What is the Total Male Population of St. Landry Parish?
Total Male Population of St. Landry Parish is 40,045.
What is the Total Female Population of St. Landry Parish?
Total Female Population of St. Landry Parish is 42,529.
What is the Ratio of Males per 100 Females in St. Landry Parish?
There are 94.16 Males per 100 Females in St. Landry Parish.
What is the Ratio of Females per 100 Males in St. Landry Parish?
There are 106.20 Females per 100 Males in St. Landry Parish.
What is the Median Population Age in St. Landry Parish?
Median Population Age in St. Landry Parish is 37.3 Years.
What is the Average Family Size in St. Landry Parish
Average Family Size in St. Landry Parish is 3.2 People.
What is the Average Household Size in St. Landry Parish
Average Household Size in St. Landry Parish is 2.6 People.
What is Per Capita Income in St. Landry Parish?
Per Capita income in St. Landry Parish is $24,413.
What is the Median Family Income in St. Landry Parish?
Median Family Income in St. Landry Parish is $53,278.
What is the Median Household income in St. Landry Parish?
Median Household Income in St. Landry Parish is $44,478.
What is Income or Wage Gap in St. Landry Parish?
Income or Wage Gap in St. Landry Parish is 37.9%.
Women in St. Landry Parish earn 62.1 cents for every dollar earned by a man.
What is Family Income Deficit in St. Landry Parish?
Family Income Deficit in St. Landry Parish is $11,901.
Families that are below poverty line in St. Landry Parish earn $11,901 less on average than the poverty threshold level.
What is Inequality or Gini Index in St. Landry Parish?
Inequality or Gini Index in St. Landry Parish is 0.50.
How Large is the Labor Force in St. Landry Parish?
There are 33,126 People in the Labor Forcein in St. Landry Parish.
What is the Percentage of People in the Labor Force in St. Landry Parish?
52.4% of People are in the Labor Force in St. Landry Parish.
What is the Unemployment Rate in St. Landry Parish?
Unemployment Rate in St. Landry Parish is 6.9%.