St. John the Baptist Parish, LA
St. John the Baptist Parish Map
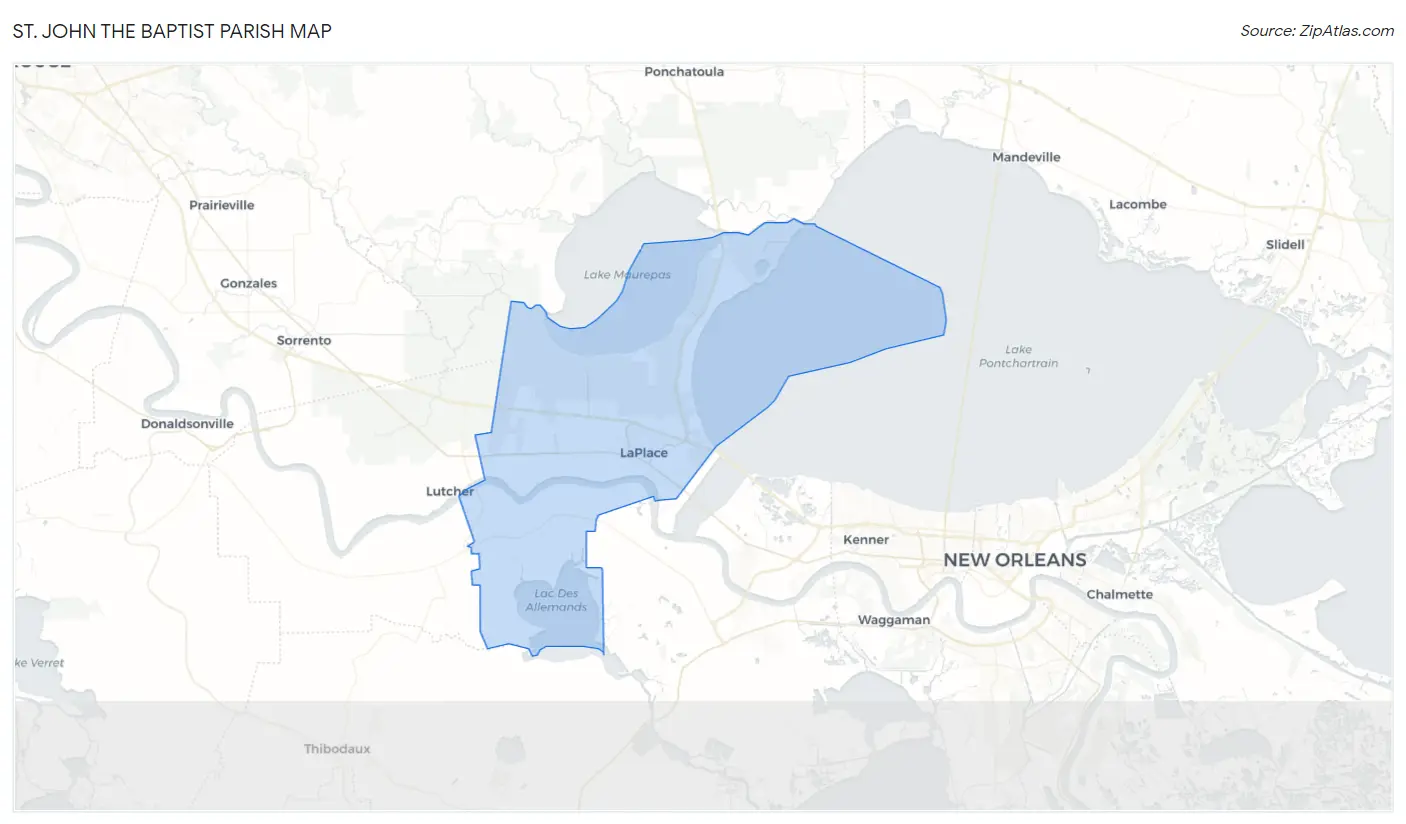
St. John the Baptist Parish Overview
41,986
TOTAL POPULATION
20,563
MALE POPULATION
21,423
FEMALE POPULATION
95.99
MALES / 100 FEMALES
104.18
FEMALES / 100 MALES
37.9
MEDIAN AGE
3.3
AVG FAMILY SIZE
2.7
AVG HOUSEHOLD SIZE
$30,643
PER CAPITA INCOME
$75,517
AVG FAMILY INCOME
$65,114
AVG HOUSEHOLD INCOME
41.2%
WAGE / INCOME GAP [ % ]
58.8¢/ $1
WAGE / INCOME GAP [ $ ]
0.44
INEQUALITY / GINI INDEX
19,969
LABOR FORCE [ PEOPLE ]
60.1%
PERCENT IN LABOR FORCE
9.3%
UNEMPLOYMENT RATE
St. John the Baptist Parish Area Codes
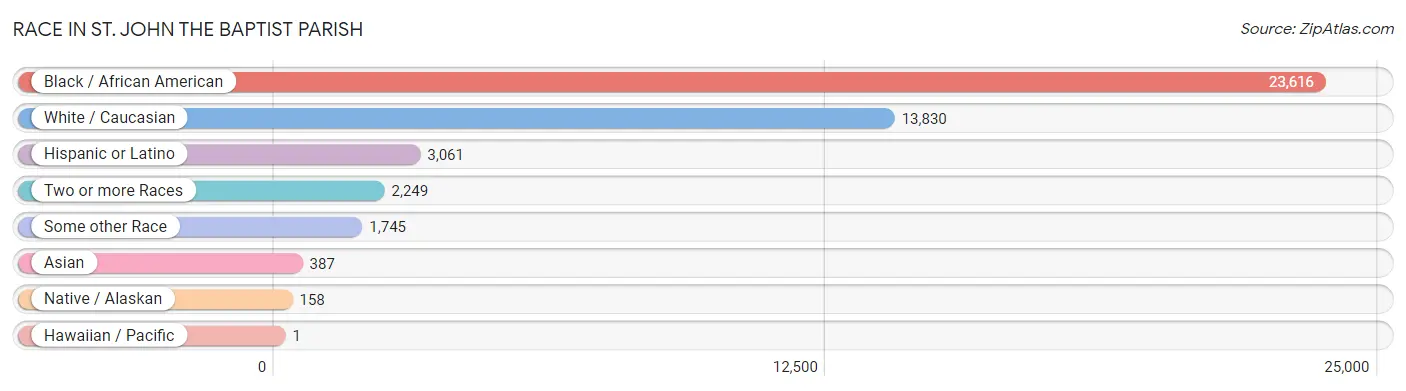
Race in St. John the Baptist Parish
The most populous races in St. John the Baptist Parish are Black / African American (23,616 | 56.2%), White / Caucasian (13,830 | 32.9%), and Hispanic or Latino (3,061 | 7.3%).
| Race | # Population | % Population |
| Asian | 387 | 0.9% |
| Black / African American | 23,616 | 56.2% |
| Hawaiian / Pacific | 1 | 0.0% |
| Hispanic or Latino | 3,061 | 7.3% |
| Native / Alaskan | 158 | 0.4% |
| White / Caucasian | 13,830 | 32.9% |
| Two or more Races | 2,249 | 5.4% |
| Some other Race | 1,745 | 4.2% |
| Total | 41,986 | 100.0% |
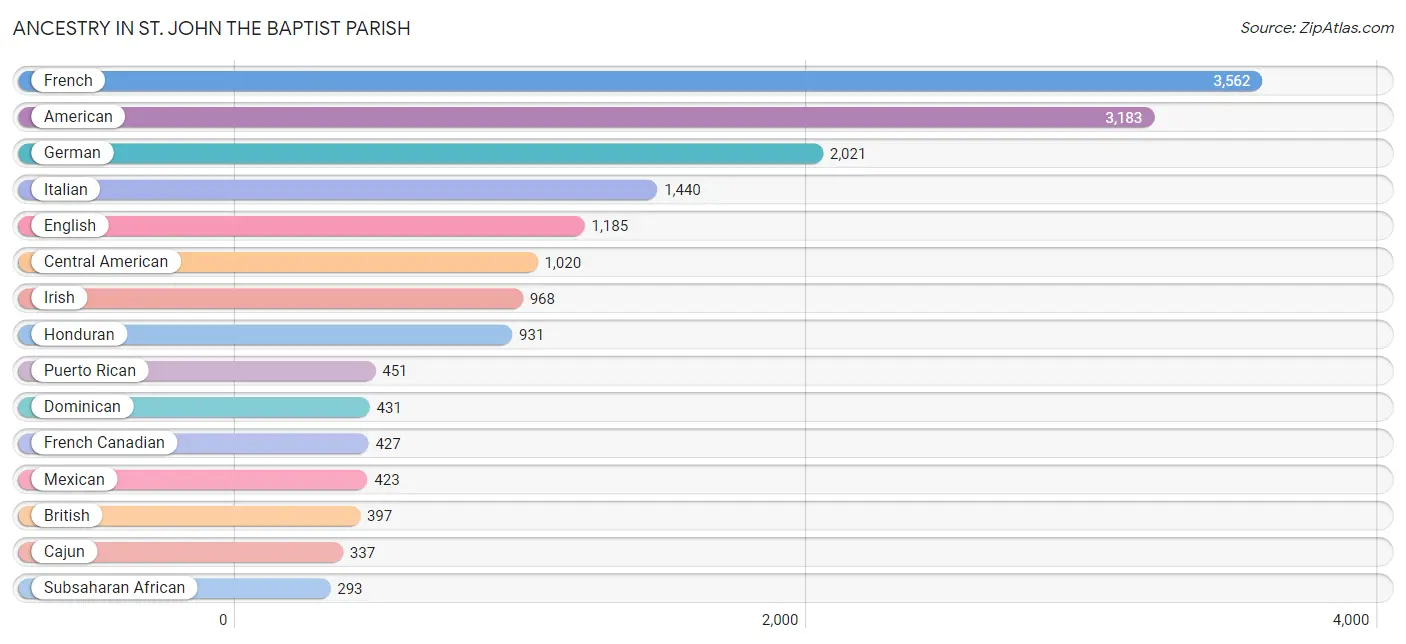
Ancestry in St. John the Baptist Parish
The most populous ancestries reported in St. John the Baptist Parish are French (3,562 | 8.5%), American (3,183 | 7.6%), German (2,021 | 4.8%), Italian (1,440 | 3.4%), and English (1,185 | 2.8%), together accounting for 27.1% of all St. John the Baptist Parish residents.
| Ancestry | # Population | % Population |
| African | 34 | 0.1% |
| American | 3,183 | 7.6% |
| Arab | 52 | 0.1% |
| Belgian | 12 | 0.0% |
| Bhutanese | 77 | 0.2% |
| Brazilian | 44 | 0.1% |
| British | 397 | 0.9% |
| Burmese | 3 | 0.0% |
| Cajun | 337 | 0.8% |
| Canadian | 14 | 0.0% |
| Celtic | 14 | 0.0% |
| Central American | 1,020 | 2.4% |
| Cherokee | 12 | 0.0% |
| Colombian | 21 | 0.1% |
| Cuban | 268 | 0.6% |
| Danish | 32 | 0.1% |
| Dominican | 431 | 1.0% |
| Dutch | 9 | 0.0% |
| Eastern European | 41 | 0.1% |
| Egyptian | 18 | 0.0% |
| English | 1,185 | 2.8% |
| European | 67 | 0.2% |
| Finnish | 10 | 0.0% |
| French | 3,562 | 8.5% |
| French American Indian | 16 | 0.0% |
| French Canadian | 427 | 1.0% |
| German | 2,021 | 4.8% |
| Greek | 17 | 0.0% |
| Guyanese | 61 | 0.2% |
| Honduran | 931 | 2.2% |
| Houma | 14 | 0.0% |
| Indian (Asian) | 160 | 0.4% |
| Irish | 968 | 2.3% |
| Israeli | 28 | 0.1% |
| Italian | 1,440 | 3.4% |
| Jordanian | 32 | 0.1% |
| Korean | 178 | 0.4% |
| Lebanese | 2 | 0.0% |
| Mexican | 423 | 1.0% |
| Mexican American Indian | 90 | 0.2% |
| Native Hawaiian | 14 | 0.0% |
| Navajo | 9 | 0.0% |
| Nigerian | 223 | 0.5% |
| Norwegian | 71 | 0.2% |
| Pakistani | 126 | 0.3% |
| Panamanian | 27 | 0.1% |
| Pennsylvania German | 24 | 0.1% |
| Portuguese | 47 | 0.1% |
| Puerto Rican | 451 | 1.1% |
| Romanian | 30 | 0.1% |
| Salvadoran | 62 | 0.2% |
| Samoan | 7 | 0.0% |
| Scotch-Irish | 91 | 0.2% |
| Scottish | 72 | 0.2% |
| South American | 21 | 0.1% |
| Spaniard | 54 | 0.1% |
| Spanish | 222 | 0.5% |
| Sri Lankan | 150 | 0.4% |
| Subsaharan African | 293 | 0.7% |
| Swedish | 18 | 0.0% |
| Trinidadian and Tobagonian | 41 | 0.1% |
| Welsh | 41 | 0.1% |
| West Indian | 34 | 0.1% | View All 63 Rows |
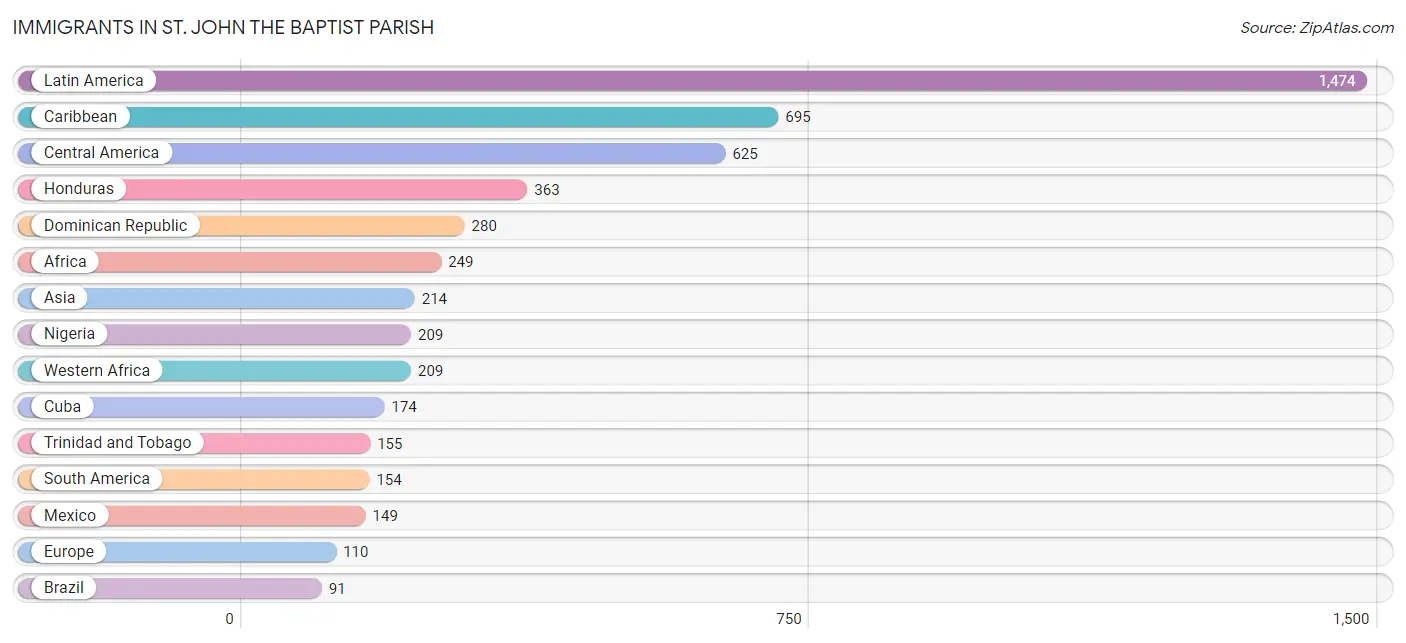
Immigrants in St. John the Baptist Parish
The most numerous immigrant groups reported in St. John the Baptist Parish came from Latin America (1,474 | 3.5%), Caribbean (695 | 1.7%), Central America (625 | 1.5%), Honduras (363 | 0.9%), and Dominican Republic (280 | 0.7%), together accounting for 8.2% of all St. John the Baptist Parish residents.
| Immigration Origin | # Population | % Population |
| Africa | 249 | 0.6% |
| Asia | 214 | 0.5% |
| Brazil | 91 | 0.2% |
| Cameroon | 16 | 0.0% |
| Canada | 36 | 0.1% |
| Caribbean | 695 | 1.7% |
| Central America | 625 | 1.5% |
| China | 78 | 0.2% |
| Colombia | 30 | 0.1% |
| Cuba | 174 | 0.4% |
| Dominican Republic | 280 | 0.7% |
| Eastern Asia | 90 | 0.2% |
| Eastern Europe | 23 | 0.1% |
| El Salvador | 62 | 0.2% |
| England | 17 | 0.0% |
| Europe | 110 | 0.3% |
| Germany | 18 | 0.0% |
| Greece | 17 | 0.0% |
| Guyana | 33 | 0.1% |
| Honduras | 363 | 0.9% |
| Jamaica | 86 | 0.2% |
| Japan | 9 | 0.0% |
| Jordan | 22 | 0.1% |
| Korea | 3 | 0.0% |
| Kuwait | 27 | 0.1% |
| Latin America | 1,474 | 3.5% |
| Mexico | 149 | 0.4% |
| Middle Africa | 16 | 0.0% |
| Nigeria | 209 | 0.5% |
| Northern Europe | 52 | 0.1% |
| Panama | 51 | 0.1% |
| Philippines | 73 | 0.2% |
| Romania | 23 | 0.1% |
| South America | 154 | 0.4% |
| South Eastern Asia | 75 | 0.2% |
| Southern Europe | 17 | 0.0% |
| Trinidad and Tobago | 155 | 0.4% |
| Vietnam | 2 | 0.0% |
| Western Africa | 209 | 0.5% |
| Western Asia | 49 | 0.1% |
| Western Europe | 18 | 0.0% | View All 41 Rows |
Sex and Age in St. John the Baptist Parish
Sex and Age in St. John the Baptist Parish
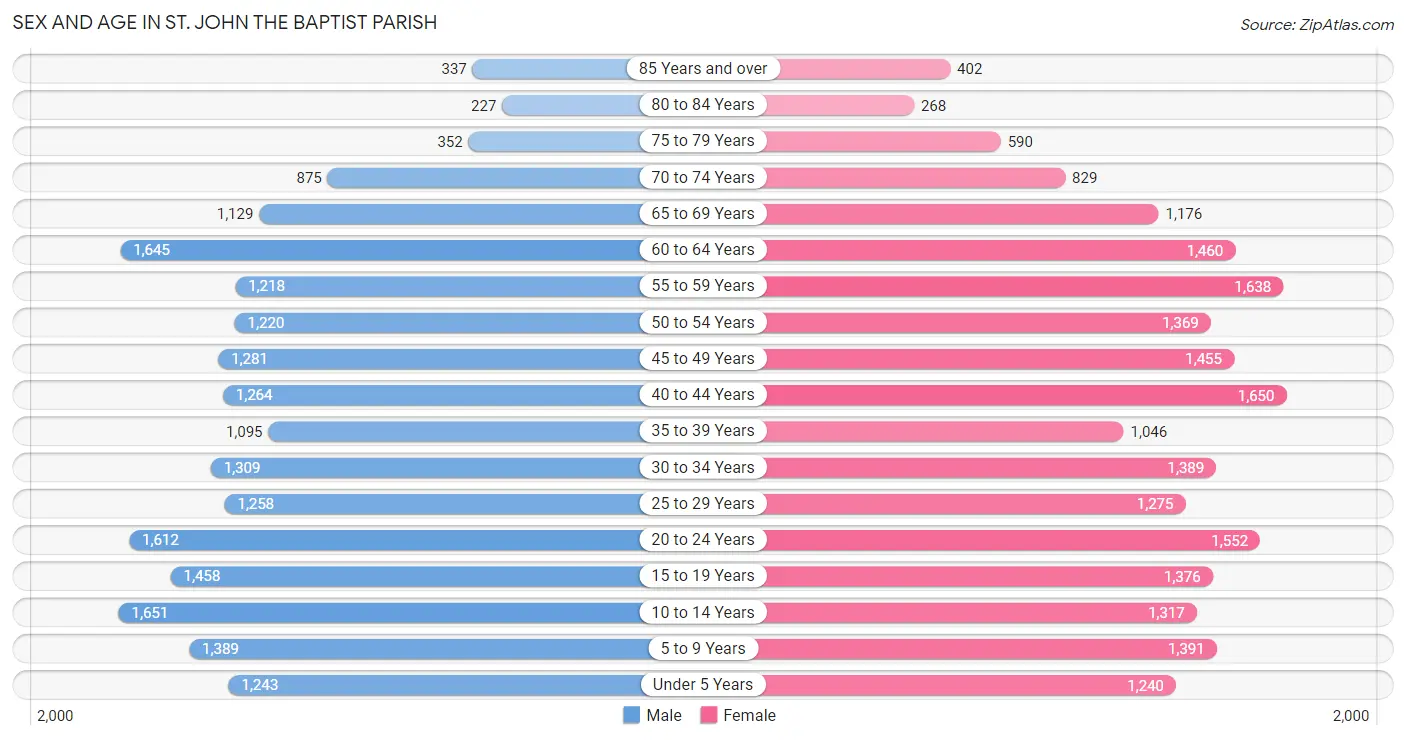
The most populous age groups in St. John the Baptist Parish are 10 to 14 Years (1,651 | 8.0%) for men and 40 to 44 Years (1,650 | 7.7%) for women.
| Age Bracket | Male | Female |
| Under 5 Years | 1,243 (6.0%) | 1,240 (5.8%) |
| 5 to 9 Years | 1,389 (6.8%) | 1,391 (6.5%) |
| 10 to 14 Years | 1,651 (8.0%) | 1,317 (6.1%) |
| 15 to 19 Years | 1,458 (7.1%) | 1,376 (6.4%) |
| 20 to 24 Years | 1,612 (7.8%) | 1,552 (7.2%) |
| 25 to 29 Years | 1,258 (6.1%) | 1,275 (5.9%) |
| 30 to 34 Years | 1,309 (6.4%) | 1,389 (6.5%) |
| 35 to 39 Years | 1,095 (5.3%) | 1,046 (4.9%) |
| 40 to 44 Years | 1,264 (6.1%) | 1,650 (7.7%) |
| 45 to 49 Years | 1,281 (6.2%) | 1,455 (6.8%) |
| 50 to 54 Years | 1,220 (5.9%) | 1,369 (6.4%) |
| 55 to 59 Years | 1,218 (5.9%) | 1,638 (7.6%) |
| 60 to 64 Years | 1,645 (8.0%) | 1,460 (6.8%) |
| 65 to 69 Years | 1,129 (5.5%) | 1,176 (5.5%) |
| 70 to 74 Years | 875 (4.3%) | 829 (3.9%) |
| 75 to 79 Years | 352 (1.7%) | 590 (2.8%) |
| 80 to 84 Years | 227 (1.1%) | 268 (1.3%) |
| 85 Years and over | 337 (1.6%) | 402 (1.9%) |
| Total | 20,563 (100.0%) | 21,423 (100.0%) |
Families and Households in St. John the Baptist Parish
Median Family Size in St. John the Baptist Parish
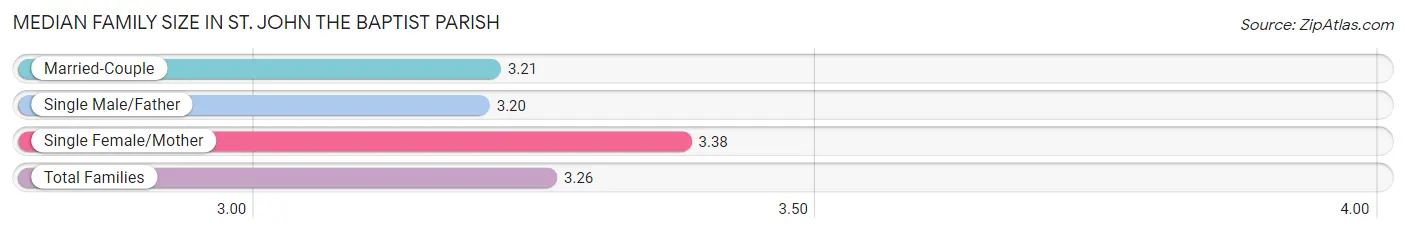
The median family size in St. John the Baptist Parish is 3.26 persons per family, with single female/mother families (2,951 | 27.4%) accounting for the largest median family size of 3.38 persons per family. On the other hand, single male/father families (1,114 | 10.3%) represent the smallest median family size with 3.20 persons per family.
| Family Type | # Families | Family Size |
| Married-Couple | 6,710 (62.3%) | 3.21 |
| Single Male/Father | 1,114 (10.3%) | 3.20 |
| Single Female/Mother | 2,951 (27.4%) | 3.38 |
| Total Families | 10,775 (100.0%) | 3.26 |
Median Household Size in St. John the Baptist Parish
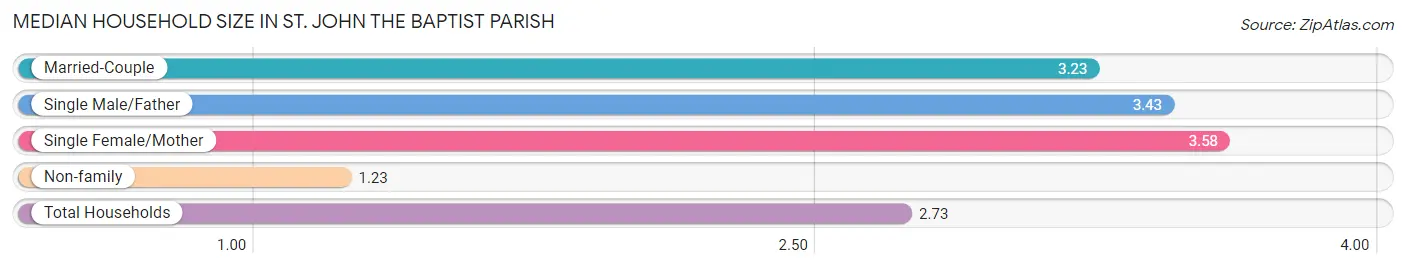
The median household size in St. John the Baptist Parish is 2.73 persons per household, with single female/mother households (2,951 | 19.4%) accounting for the largest median household size of 3.58 persons per household. non-family households (4,457 | 29.3%) represent the smallest median household size with 1.23 persons per household.
| Household Type | # Households | Household Size |
| Married-Couple | 6,710 (44.1%) | 3.23 |
| Single Male/Father | 1,114 (7.3%) | 3.43 |
| Single Female/Mother | 2,951 (19.4%) | 3.58 |
| Non-family | 4,457 (29.3%) | 1.23 |
| Total Households | 15,232 (100.0%) | 2.73 |
Household Size by Marriage Status in St. John the Baptist Parish
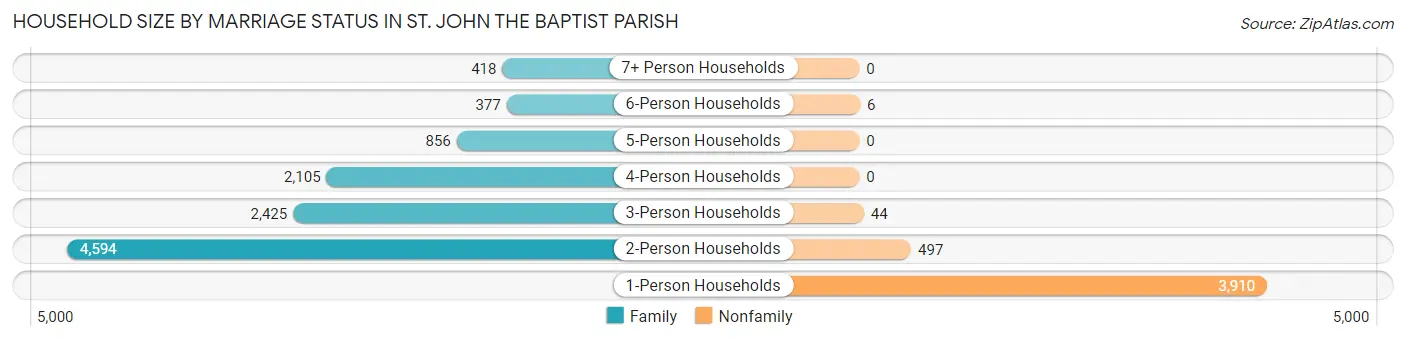
Out of a total of 15,232 households in St. John the Baptist Parish, 10,775 (70.7%) are family households, while 4,457 (29.3%) are nonfamily households. The most numerous type of family households are 2-person households, comprising 4,594, and the most common type of nonfamily households are 1-person households, comprising 3,910.
| Household Size | Family Households | Nonfamily Households |
| 1-Person Households | - | 3,910 (25.7%) |
| 2-Person Households | 4,594 (30.2%) | 497 (3.3%) |
| 3-Person Households | 2,425 (15.9%) | 44 (0.3%) |
| 4-Person Households | 2,105 (13.8%) | 0 (0.0%) |
| 5-Person Households | 856 (5.6%) | 0 (0.0%) |
| 6-Person Households | 377 (2.5%) | 6 (0.0%) |
| 7+ Person Households | 418 (2.7%) | 0 (0.0%) |
| Total | 10,775 (70.7%) | 4,457 (29.3%) |
Female Fertility in St. John the Baptist Parish
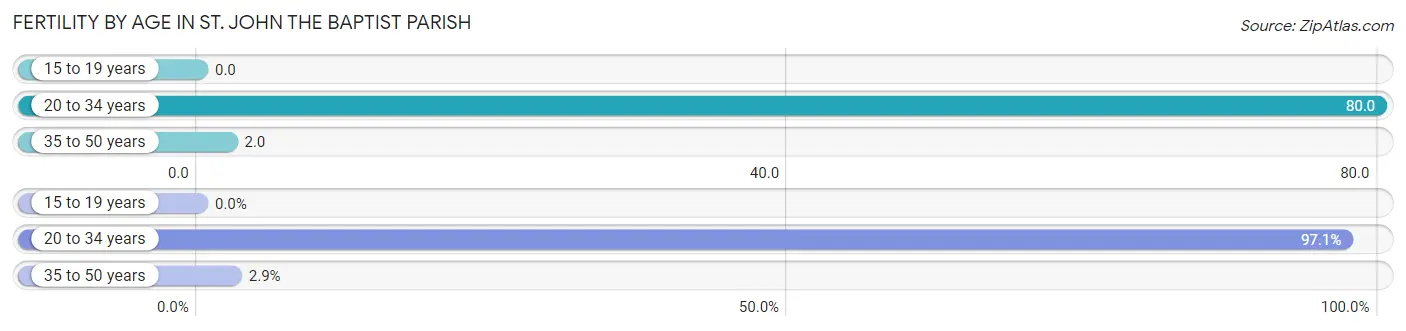
Fertility by Age in St. John the Baptist Parish
Average fertility rate in St. John the Baptist Parish is 35.0 births per 1,000 women. Women in the age bracket of 20 to 34 years have the highest fertility rate with 80.0 births per 1,000 women. Women in the age bracket of 20 to 34 years acount for 97.1% of all women with births.
| Age Bracket | Women with Births | Births / 1,000 Women |
| 15 to 19 years | 0 (0.0%) | 0.0 |
| 20 to 34 years | 339 (97.1%) | 80.0 |
| 35 to 50 years | 10 (2.9%) | 2.0 |
| Total | 349 (100.0%) | 35.0 |
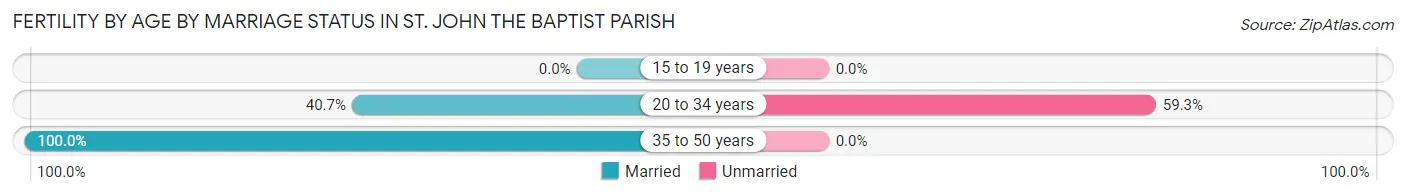
Fertility by Age by Marriage Status in St. John the Baptist Parish
42.4% of women with births (349) in St. John the Baptist Parish are married. The highest percentage of unmarried women with births falls into 20 to 34 years age bracket with 59.3% of them unmarried at the time of birth, while the lowest percentage of unmarried women with births belong to 35 to 50 years age bracket with 0.0% of them unmarried.
| Age Bracket | Married | Unmarried |
| 15 to 19 years | 0 (0.0%) | 0 (0.0%) |
| 20 to 34 years | 138 (40.7%) | 201 (59.3%) |
| 35 to 50 years | 10 (100.0%) | 0 (0.0%) |
| Total | 148 (42.4%) | 201 (57.6%) |
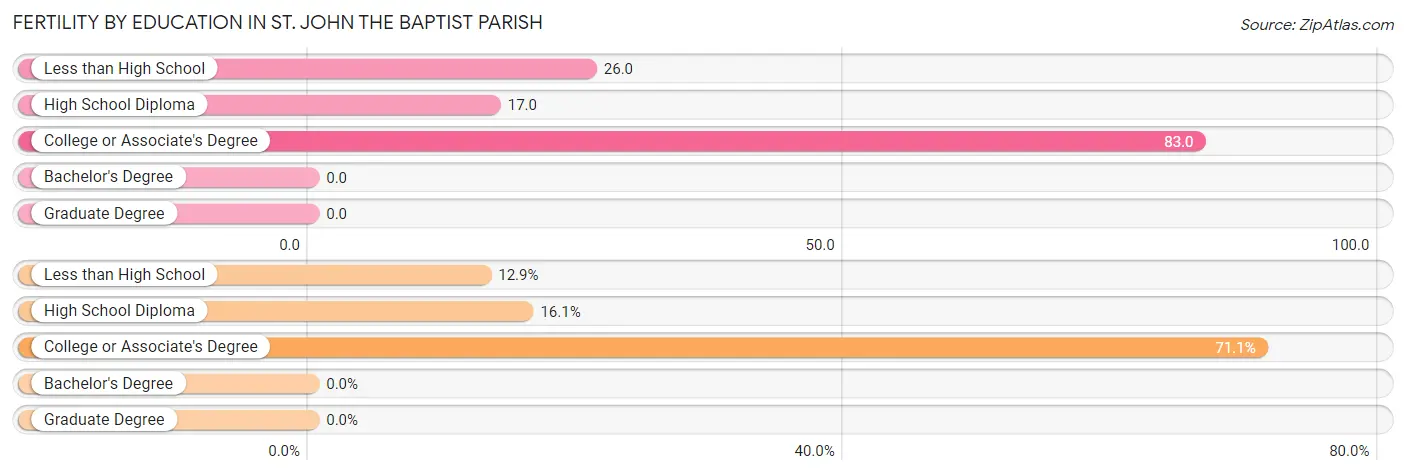
Fertility by Education in St. John the Baptist Parish
| Educational Attainment | Women with Births | Births / 1,000 Women |
| Less than High School | 45 (12.9%) | 26.0 |
| High School Diploma | 56 (16.1%) | 17.0 |
| College or Associate's Degree | 248 (71.1%) | 83.0 |
| Bachelor's Degree | 0 (0.0%) | 0.0 |
| Graduate Degree | 0 (0.0%) | 0.0 |
| Total | 349 (100.0%) | 35.0 |
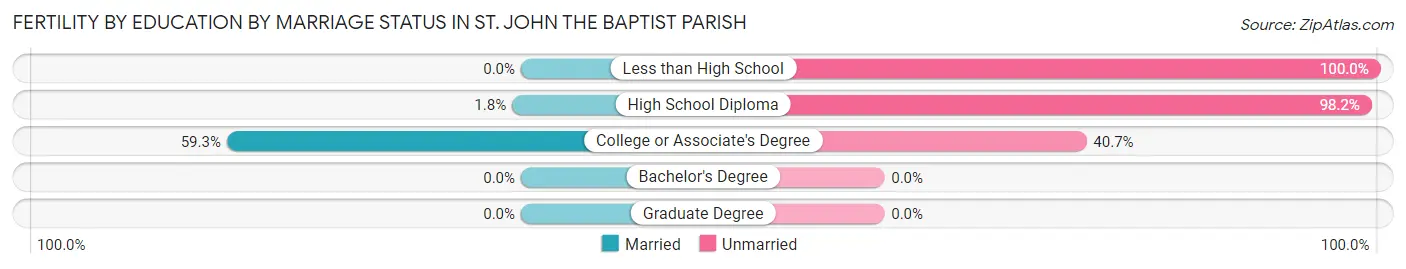
Fertility by Education by Marriage Status in St. John the Baptist Parish
57.6% of women with births in St. John the Baptist Parish are unmarried. Women with the educational attainment of college or associate's degree are most likely to be married with 59.3% of them married at childbirth, while women with the educational attainment of less than high school are least likely to be married with 100.0% of them unmarried at childbirth.
| Educational Attainment | Married | Unmarried |
| Less than High School | 0 (0.0%) | 45 (100.0%) |
| High School Diploma | 1 (1.8%) | 55 (98.2%) |
| College or Associate's Degree | 147 (59.3%) | 101 (40.7%) |
| Bachelor's Degree | 0 (0.0%) | 0 (0.0%) |
| Graduate Degree | 0 (0.0%) | 0 (0.0%) |
| Total | 148 (42.4%) | 201 (57.6%) |
Income in St. John the Baptist Parish
Income Overview in St. John the Baptist Parish
Per Capita Income in St. John the Baptist Parish is $30,643, while median incomes of families and households are $75,517 and $65,114 respectively.
| Characteristic | Number | Measure |
| Per Capita Income | 41,986 | $30,643 |
| Median Family Income | 10,775 | $75,517 |
| Mean Family Income | 10,775 | $94,740 |
| Median Household Income | 15,232 | $65,114 |
| Mean Household Income | 15,232 | $82,424 |
| Income Deficit | 10,775 | $0 |
| Wage / Income Gap (%) | 41,986 | 41.17% |
| Wage / Income Gap ($) | 41,986 | 58.83¢ per $1 |
| Gini / Inequality Index | 41,986 | 0.44 |
Earnings by Sex in St. John the Baptist Parish
Average Earnings in St. John the Baptist Parish are $35,963, $50,056 for men and $29,446 for women, a difference of 41.2%.
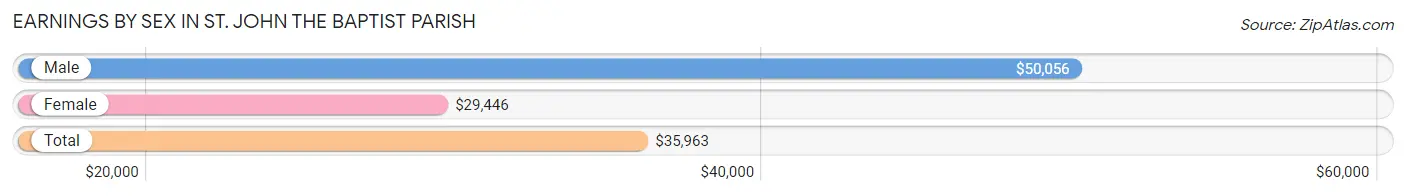
| Sex | Number | Average Earnings |
| Male | 9,791 (48.9%) | $50,056 |
| Female | 10,228 (51.1%) | $29,446 |
| Total | 20,019 (100.0%) | $35,963 |
Earnings by Sex by Income Bracket in St. John the Baptist Parish
The most common earnings brackets in St. John the Baptist Parish are $75,000 to $99,999 for men (1,382 | 14.1%) and $25,000 to $29,999 for women (1,121 | 11.0%).
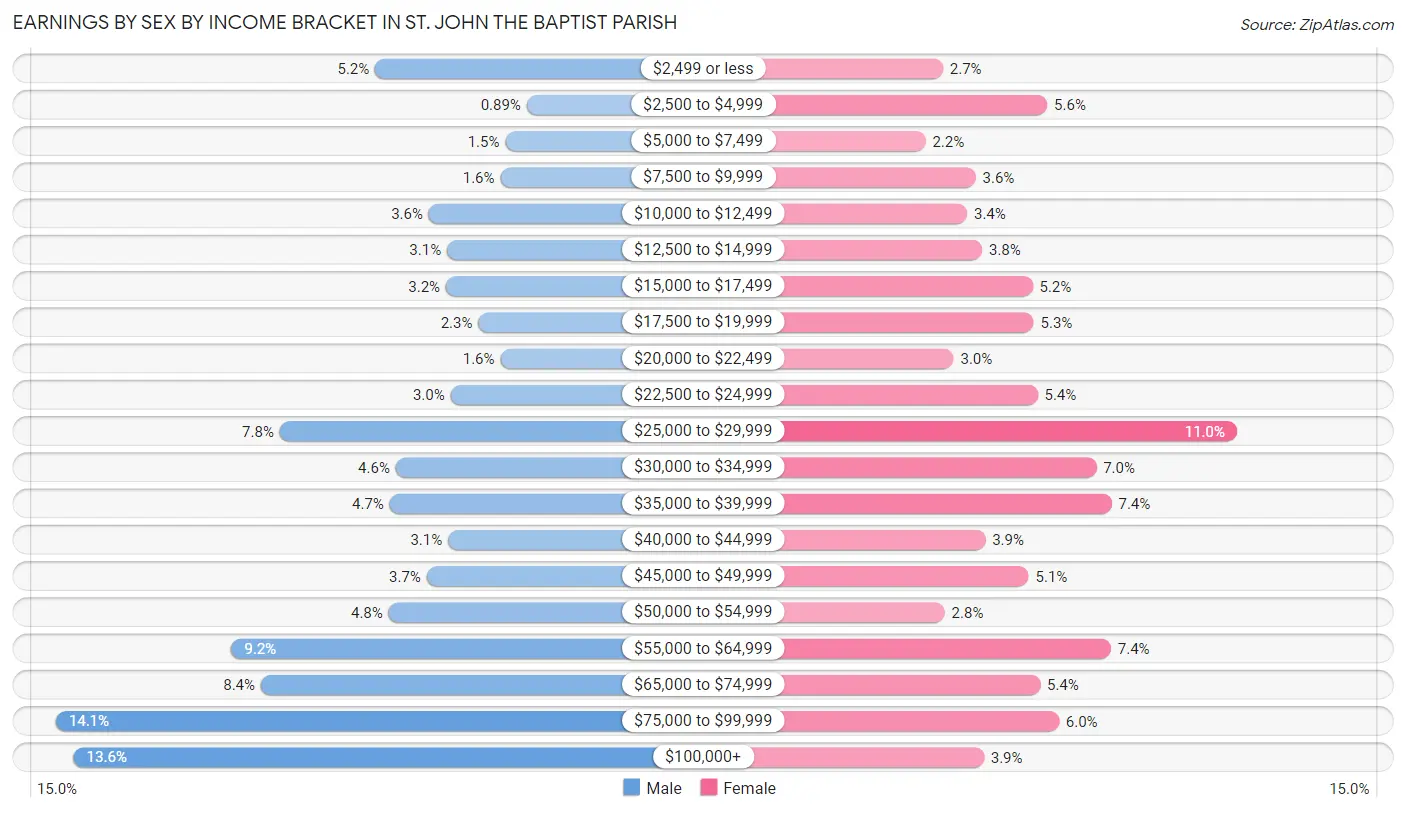
| Income | Male | Female |
| $2,499 or less | 504 (5.1%) | 276 (2.7%) |
| $2,500 to $4,999 | 87 (0.9%) | 576 (5.6%) |
| $5,000 to $7,499 | 146 (1.5%) | 226 (2.2%) |
| $7,500 to $9,999 | 160 (1.6%) | 370 (3.6%) |
| $10,000 to $12,499 | 356 (3.6%) | 346 (3.4%) |
| $12,500 to $14,999 | 306 (3.1%) | 389 (3.8%) |
| $15,000 to $17,499 | 309 (3.2%) | 534 (5.2%) |
| $17,500 to $19,999 | 220 (2.2%) | 537 (5.2%) |
| $20,000 to $22,499 | 160 (1.6%) | 307 (3.0%) |
| $22,500 to $24,999 | 297 (3.0%) | 548 (5.4%) |
| $25,000 to $29,999 | 767 (7.8%) | 1,121 (11.0%) |
| $30,000 to $34,999 | 447 (4.6%) | 717 (7.0%) |
| $35,000 to $39,999 | 464 (4.7%) | 761 (7.4%) |
| $40,000 to $44,999 | 304 (3.1%) | 398 (3.9%) |
| $45,000 to $49,999 | 362 (3.7%) | 523 (5.1%) |
| $50,000 to $54,999 | 467 (4.8%) | 281 (2.8%) |
| $55,000 to $64,999 | 900 (9.2%) | 759 (7.4%) |
| $65,000 to $74,999 | 819 (8.4%) | 555 (5.4%) |
| $75,000 to $99,999 | 1,382 (14.1%) | 610 (6.0%) |
| $100,000+ | 1,334 (13.6%) | 394 (3.8%) |
| Total | 9,791 (100.0%) | 10,228 (100.0%) |
Earnings by Sex by Educational Attainment in St. John the Baptist Parish
Average earnings in St. John the Baptist Parish are $57,807 for men and $32,402 for women, a difference of 44.0%. Men with an educational attainment of graduate degree enjoy the highest average annual earnings of $103,024, while those with less than high school education earn the least with $47,975. Women with an educational attainment of graduate degree earn the most with the average annual earnings of $67,879, while those with less than high school education have the smallest earnings of $19,609.
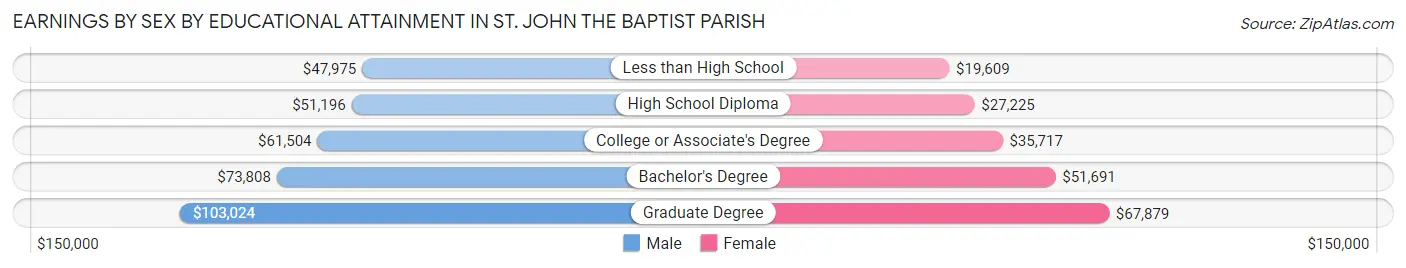
| Educational Attainment | Male Income | Female Income |
| Less than High School | $47,975 | $19,609 |
| High School Diploma | $51,196 | $27,225 |
| College or Associate's Degree | $61,504 | $35,717 |
| Bachelor's Degree | $73,808 | $51,691 |
| Graduate Degree | $103,024 | $67,879 |
| Total | $57,807 | $32,402 |
Family Income in St. John the Baptist Parish
Family Income Brackets in St. John the Baptist Parish
According to the St. John the Baptist Parish family income data, there are 2,166 families falling into the $100,000 to $149,999 income range, which is the most common income bracket and makes up 20.1% of all families. Conversely, the $10,000 to $14,999 income bracket is the least frequent group with only 312 families (2.9%) belonging to this category.
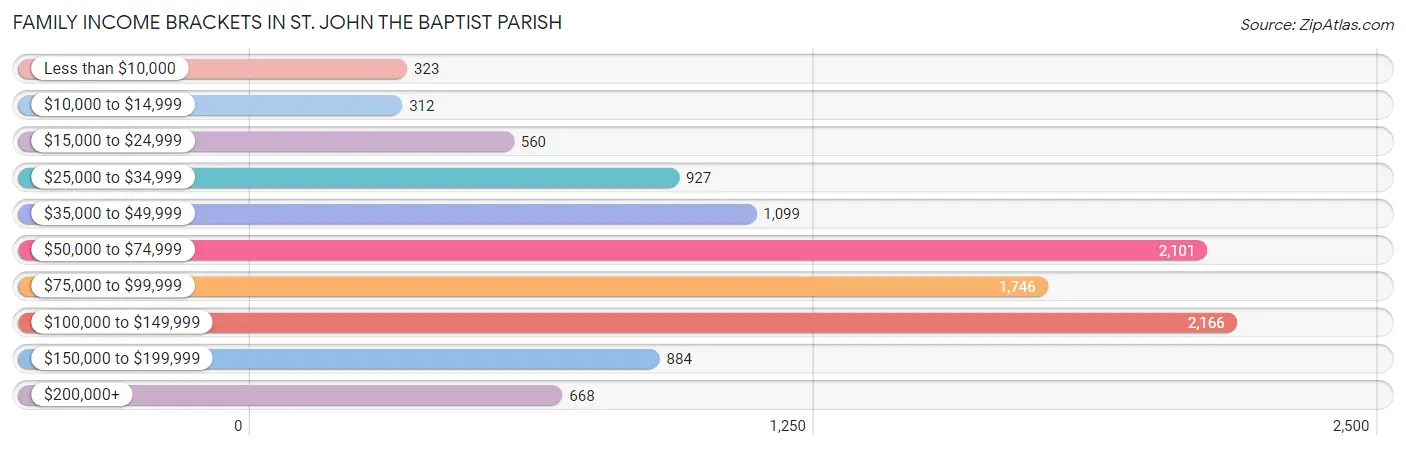
| Income Bracket | # Families | % Families |
| Less than $10,000 | 323 | 3.0% |
| $10,000 to $14,999 | 312 | 2.9% |
| $15,000 to $24,999 | 560 | 5.2% |
| $25,000 to $34,999 | 927 | 8.6% |
| $35,000 to $49,999 | 1,099 | 10.2% |
| $50,000 to $74,999 | 2,101 | 19.5% |
| $75,000 to $99,999 | 1,746 | 16.2% |
| $100,000 to $149,999 | 2,166 | 20.1% |
| $150,000 to $199,999 | 884 | 8.2% |
| $200,000+ | 668 | 6.2% |
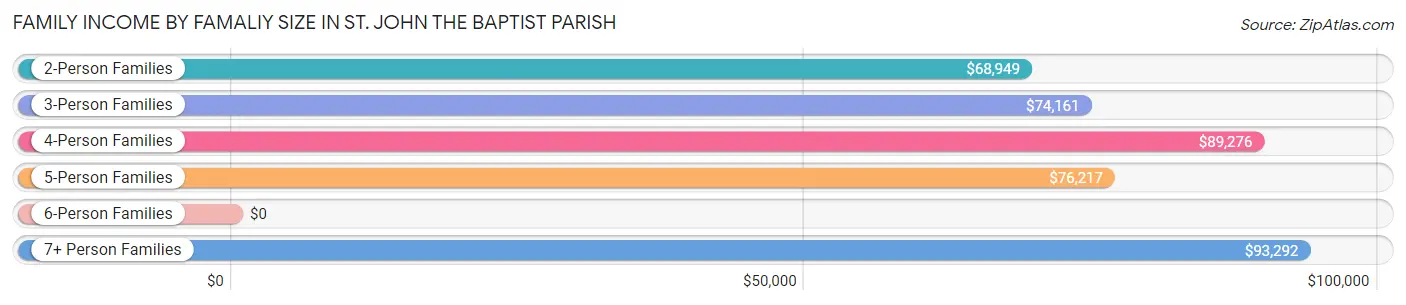
Family Income by Famaliy Size in St. John the Baptist Parish
7+ person families (401 | 3.7%) account for the highest median family income in St. John the Baptist Parish with $93,292 per family, while 2-person families (5,030 | 46.7%) have the highest median income of $34,474 per family member.
| Income Bracket | # Families | Median Income |
| 2-Person Families | 5,030 (46.7%) | $68,949 |
| 3-Person Families | 2,405 (22.3%) | $74,161 |
| 4-Person Families | 1,785 (16.6%) | $89,276 |
| 5-Person Families | 818 (7.6%) | $76,217 |
| 6-Person Families | 336 (3.1%) | $0 |
| 7+ Person Families | 401 (3.7%) | $93,292 |
| Total | 10,775 (100.0%) | $75,517 |
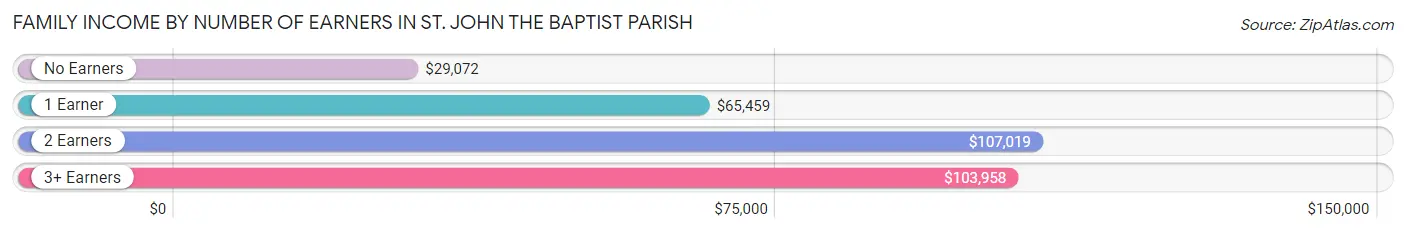
Family Income by Number of Earners in St. John the Baptist Parish
The median family income in St. John the Baptist Parish is $75,517, with families comprising 2 earners (3,862) having the highest median family income of $107,019, while families with no earners (1,809) have the lowest median family income of $29,072, accounting for 35.8% and 16.8% of families, respectively.
| Number of Earners | # Families | Median Income |
| No Earners | 1,809 (16.8%) | $29,072 |
| 1 Earner | 3,868 (35.9%) | $65,459 |
| 2 Earners | 3,862 (35.8%) | $107,019 |
| 3+ Earners | 1,236 (11.5%) | $103,958 |
| Total | 10,775 (100.0%) | $75,517 |
Household Income in St. John the Baptist Parish
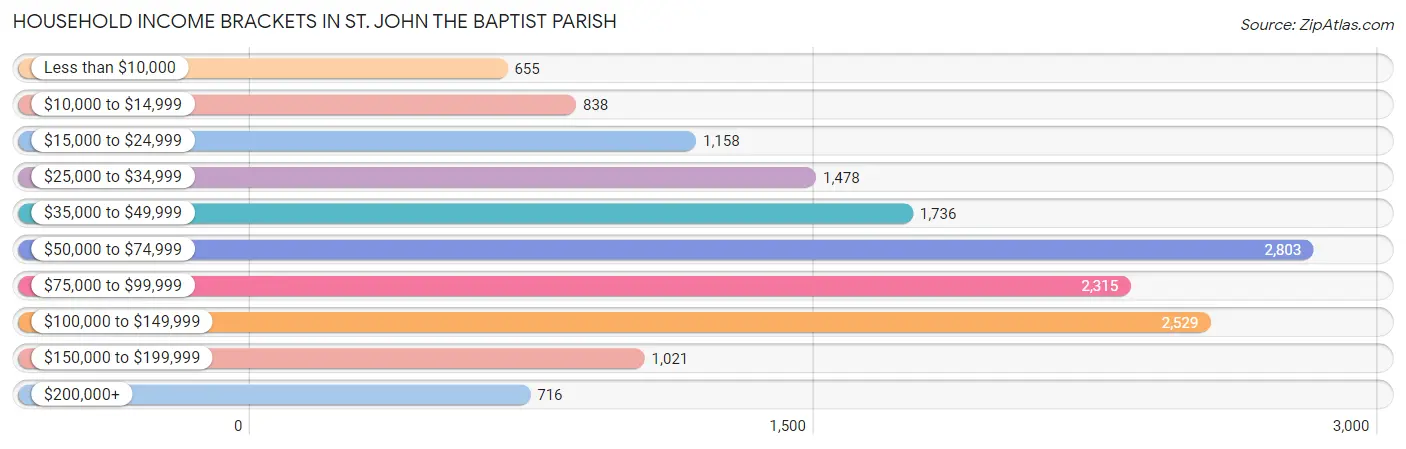
Household Income Brackets in St. John the Baptist Parish
With 2,803 households falling in the category, the $50,000 to $74,999 income range is the most frequent in St. John the Baptist Parish, accounting for 18.4% of all households. In contrast, only 655 households (4.3%) fall into the less than $10,000 income bracket, making it the least populous group.
| Income Bracket | # Households | % Households |
| Less than $10,000 | 655 | 4.3% |
| $10,000 to $14,999 | 838 | 5.5% |
| $15,000 to $24,999 | 1,158 | 7.6% |
| $25,000 to $34,999 | 1,478 | 9.7% |
| $35,000 to $49,999 | 1,736 | 11.4% |
| $50,000 to $74,999 | 2,803 | 18.4% |
| $75,000 to $99,999 | 2,315 | 15.2% |
| $100,000 to $149,999 | 2,529 | 16.6% |
| $150,000 to $199,999 | 1,021 | 6.7% |
| $200,000+ | 716 | 4.7% |
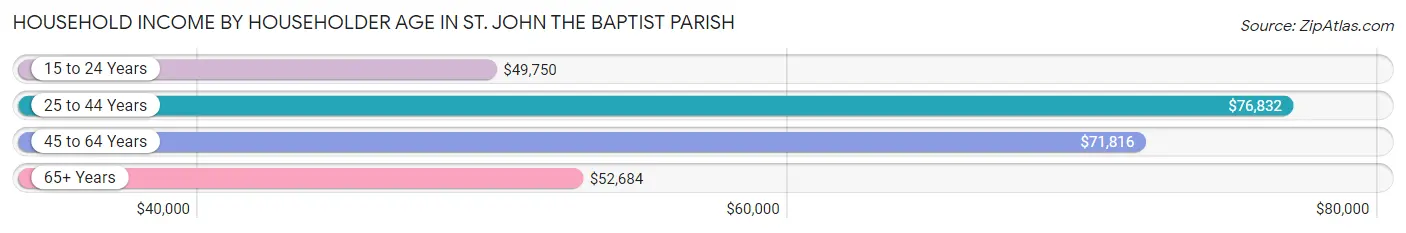
Household Income by Householder Age in St. John the Baptist Parish
The median household income in St. John the Baptist Parish is $65,114, with the highest median household income of $76,832 found in the 25 to 44 years age bracket for the primary householder. A total of 4,084 households (26.8%) fall into this category. Meanwhile, the 15 to 24 years age bracket for the primary householder has the lowest median household income of $49,750, with 516 households (3.4%) in this group.
| Income Bracket | # Households | Median Income |
| 15 to 24 Years | 516 (3.4%) | $49,750 |
| 25 to 44 Years | 4,084 (26.8%) | $76,832 |
| 45 to 64 Years | 6,430 (42.2%) | $71,816 |
| 65+ Years | 4,202 (27.6%) | $52,684 |
| Total | 15,232 (100.0%) | $65,114 |
Poverty in St. John the Baptist Parish
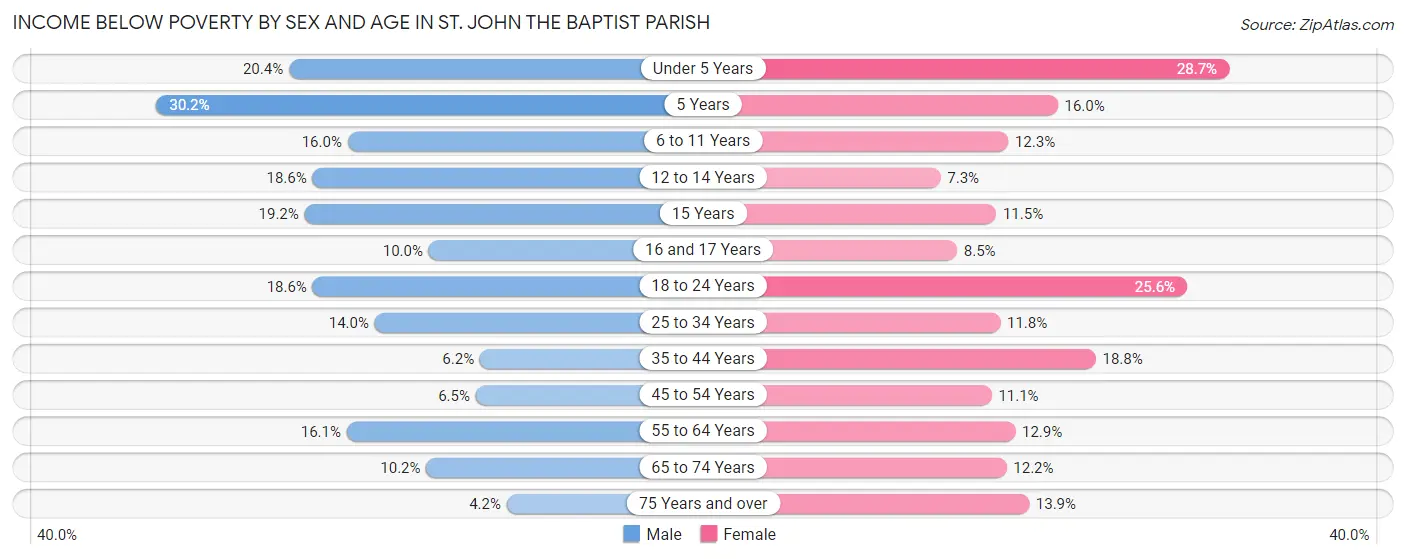
Income Below Poverty by Sex and Age in St. John the Baptist Parish
With 13.1% poverty level for males and 15.0% for females among the residents of St. John the Baptist Parish, 5 year old males and under 5 year old females are the most vulnerable to poverty, with 68 males (30.2%) and 340 females (28.7%) in their respective age groups living below the poverty level.
| Age Bracket | Male | Female |
| Under 5 Years | 253 (20.4%) | 340 (28.7%) |
| 5 Years | 68 (30.2%) | 58 (16.0%) |
| 6 to 11 Years | 253 (16.0%) | 185 (12.3%) |
| 12 to 14 Years | 230 (18.6%) | 62 (7.3%) |
| 15 Years | 58 (19.2%) | 26 (11.5%) |
| 16 and 17 Years | 79 (10.0%) | 61 (8.5%) |
| 18 to 24 Years | 362 (18.6%) | 509 (25.6%) |
| 25 to 34 Years | 354 (14.0%) | 313 (11.7%) |
| 35 to 44 Years | 140 (6.2%) | 508 (18.8%) |
| 45 to 54 Years | 157 (6.5%) | 313 (11.1%) |
| 55 to 64 Years | 453 (16.1%) | 396 (12.9%) |
| 65 to 74 Years | 202 (10.2%) | 243 (12.2%) |
| 75 Years and over | 36 (4.2%) | 171 (13.9%) |
| Total | 2,645 (13.1%) | 3,185 (15.0%) |
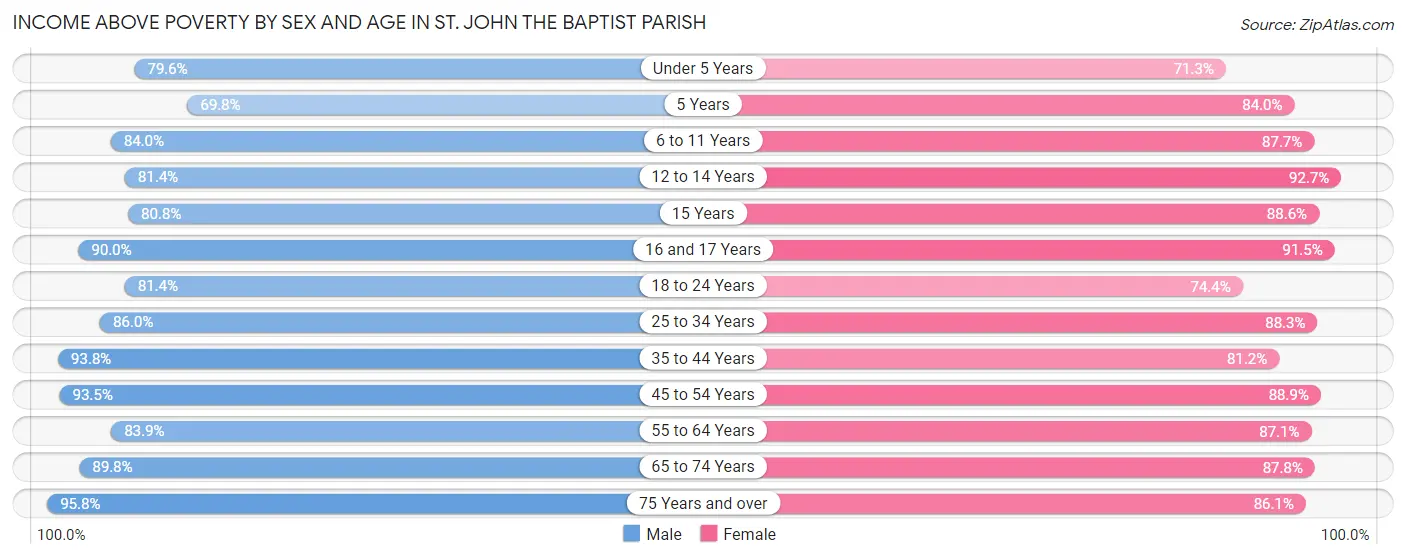
Income Above Poverty by Sex and Age in St. John the Baptist Parish
According to the poverty statistics in St. John the Baptist Parish, males aged 75 years and over and females aged 12 to 14 years are the age groups that are most secure financially, with 95.8% of males and 92.7% of females in these age groups living above the poverty line.
| Age Bracket | Male | Female |
| Under 5 Years | 989 (79.6%) | 843 (71.3%) |
| 5 Years | 157 (69.8%) | 304 (84.0%) |
| 6 to 11 Years | 1,327 (84.0%) | 1,314 (87.7%) |
| 12 to 14 Years | 1,005 (81.4%) | 785 (92.7%) |
| 15 Years | 244 (80.8%) | 201 (88.5%) |
| 16 and 17 Years | 712 (90.0%) | 653 (91.5%) |
| 18 to 24 Years | 1,583 (81.4%) | 1,478 (74.4%) |
| 25 to 34 Years | 2,174 (86.0%) | 2,351 (88.2%) |
| 35 to 44 Years | 2,121 (93.8%) | 2,188 (81.2%) |
| 45 to 54 Years | 2,258 (93.5%) | 2,504 (88.9%) |
| 55 to 64 Years | 2,364 (83.9%) | 2,684 (87.1%) |
| 65 to 74 Years | 1,785 (89.8%) | 1,745 (87.8%) |
| 75 Years and over | 822 (95.8%) | 1,060 (86.1%) |
| Total | 17,541 (86.9%) | 18,110 (85.0%) |
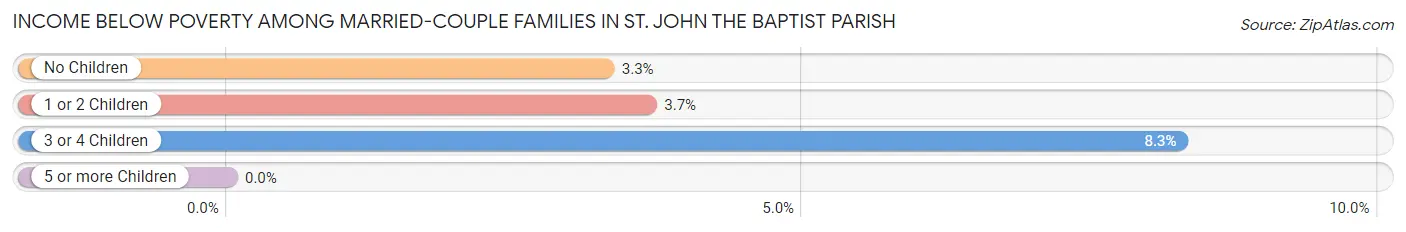
Income Below Poverty Among Married-Couple Families in St. John the Baptist Parish
The poverty statistics for married-couple families in St. John the Baptist Parish show that 3.8% or 253 of the total 6,710 families live below the poverty line. Families with 3 or 4 children have the highest poverty rate of 8.3%, comprising of 43 families. On the other hand, families with no children have the lowest poverty rate of 3.3%, which includes 141 families.
| Children | Above Poverty | Below Poverty |
| No Children | 4,160 (96.7%) | 141 (3.3%) |
| 1 or 2 Children | 1,820 (96.4%) | 69 (3.6%) |
| 3 or 4 Children | 477 (91.7%) | 43 (8.3%) |
| 5 or more Children | 0 (0.0%) | 0 (0.0%) |
| Total | 6,457 (96.2%) | 253 (3.8%) |
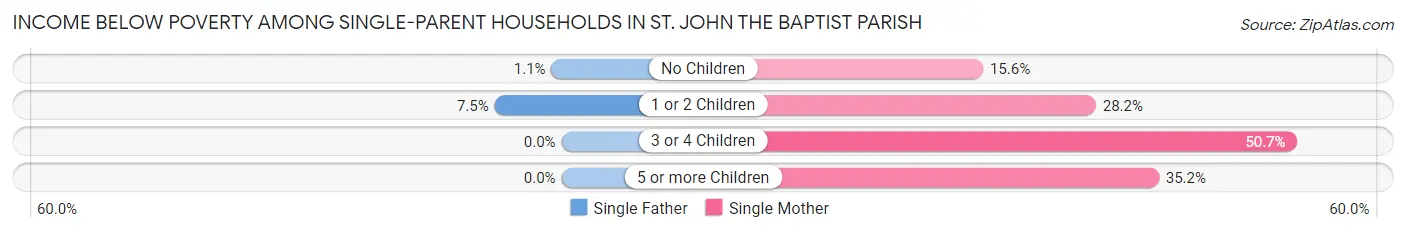
Income Below Poverty Among Single-Parent Households in St. John the Baptist Parish
According to the poverty data in St. John the Baptist Parish, 3.4% or 38 single-father households and 25.6% or 755 single-mother households are living below the poverty line. Among single-father households, those with 1 or 2 children have the highest poverty rate, with 32 households (7.5%) experiencing poverty. Likewise, among single-mother households, those with 3 or 4 children have the highest poverty rate, with 142 households (50.7%) falling below the poverty line.
| Children | Single Father | Single Mother |
| No Children | 6 (1.1%) | 194 (15.6%) |
| 1 or 2 Children | 32 (7.5%) | 332 (28.2%) |
| 3 or 4 Children | 0 (0.0%) | 142 (50.7%) |
| 5 or more Children | 0 (0.0%) | 87 (35.2%) |
| Total | 38 (3.4%) | 755 (25.6%) |
Income Below Poverty Among Married-Couple vs Single-Parent Households in St. John the Baptist Parish
The poverty data for St. John the Baptist Parish shows that 253 of the married-couple family households (3.8%) and 793 of the single-parent households (19.5%) are living below the poverty level. Within the married-couple family households, those with 3 or 4 children have the highest poverty rate, with 43 households (8.3%) falling below the poverty line. Among the single-parent households, those with 5 or more children have the highest poverty rate, with 87 household (35.2%) living below poverty.
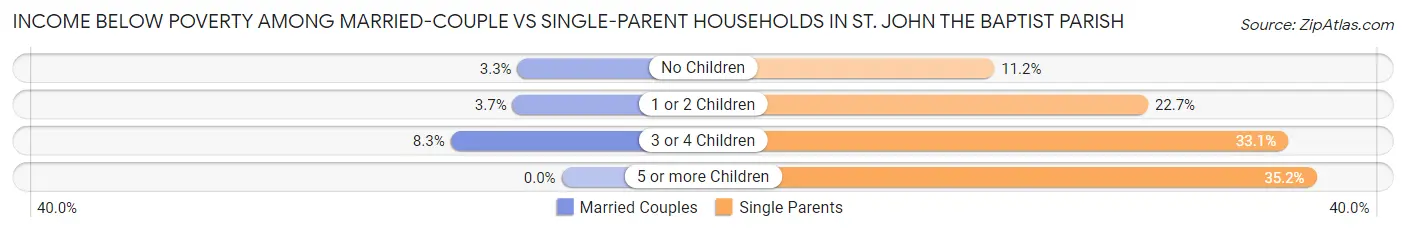
| Children | Married-Couple Families | Single-Parent Households |
| No Children | 141 (3.3%) | 200 (11.2%) |
| 1 or 2 Children | 69 (3.6%) | 364 (22.7%) |
| 3 or 4 Children | 43 (8.3%) | 142 (33.1%) |
| 5 or more Children | 0 (0.0%) | 87 (35.2%) |
| Total | 253 (3.8%) | 793 (19.5%) |
Employment Characteristics in St. John the Baptist Parish
Employment by Class of Employer in St. John the Baptist Parish
Among the 17,519 employed individuals in St. John the Baptist Parish, private company employees (12,279 | 70.1%), not-for-profit organizations (1,212 | 6.9%), and state government employees (1,088 | 6.2%) make up the most common classes of employment.
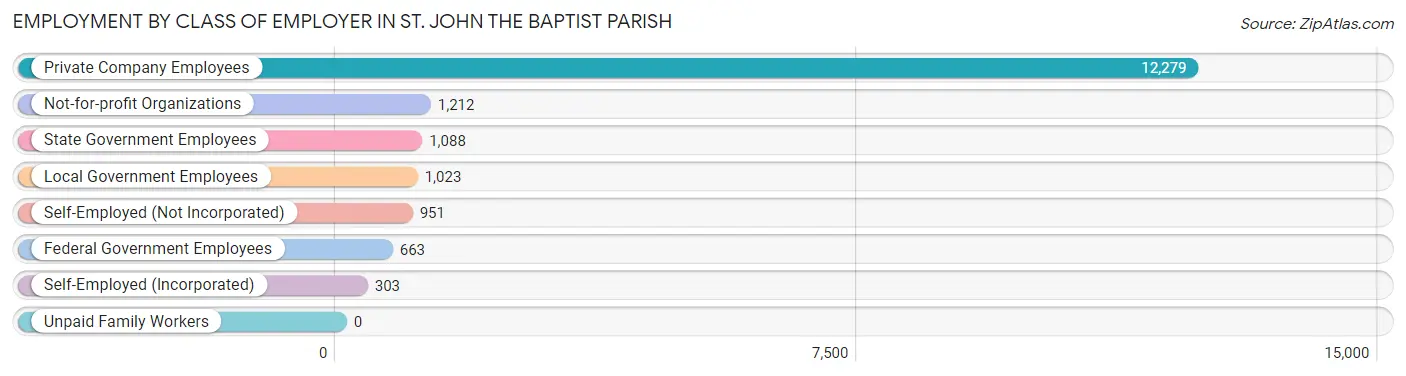
| Employer Class | # Employees | % Employees |
| Private Company Employees | 12,279 | 70.1% |
| Self-Employed (Incorporated) | 303 | 1.7% |
| Self-Employed (Not Incorporated) | 951 | 5.4% |
| Not-for-profit Organizations | 1,212 | 6.9% |
| Local Government Employees | 1,023 | 5.8% |
| State Government Employees | 1,088 | 6.2% |
| Federal Government Employees | 663 | 3.8% |
| Unpaid Family Workers | 0 | 0.0% |
| Total | 17,519 | 100.0% |
Employment Status by Age in St. John the Baptist Parish
According to the labor force statistics for St. John the Baptist Parish, out of the total population over 16 years of age (33,226), 60.1% or 19,969 individuals are in the labor force, with 9.3% or 1,857 of them unemployed. The age group with the highest labor force participation rate is 20 to 24 years, with 86.7% or 2,743 individuals in the labor force. Within the labor force, the 16 to 19 years age range has the highest percentage of unemployed individuals, with 33.0% or 189 of them being unemployed.
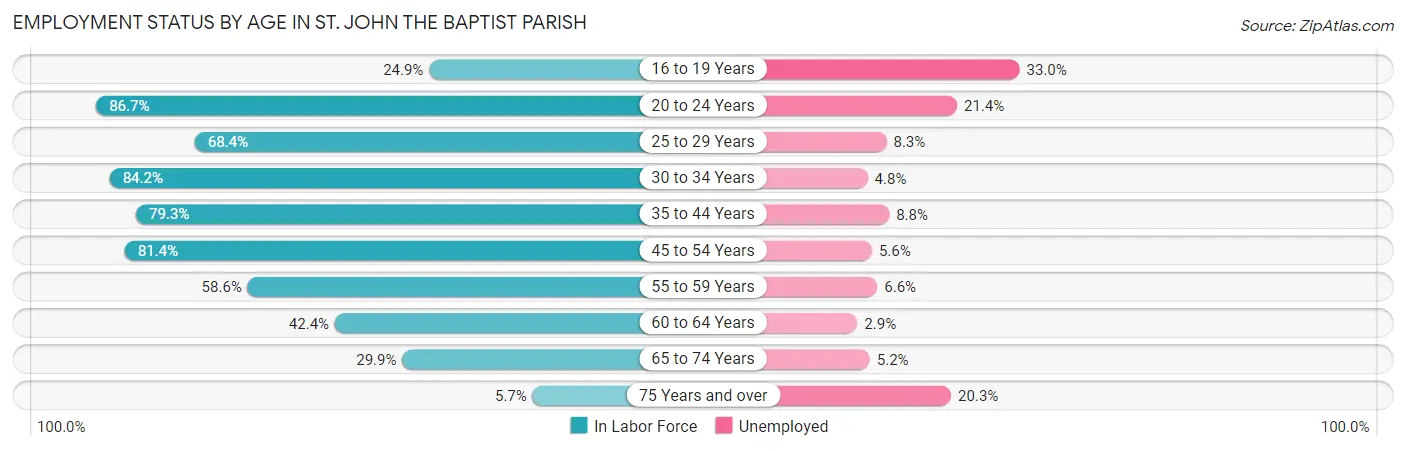
| Age Bracket | In Labor Force | Unemployed |
| 16 to 19 Years | 574 (24.9%) | 189 (33.0%) |
| 20 to 24 Years | 2,743 (86.7%) | 587 (21.4%) |
| 25 to 29 Years | 1,733 (68.4%) | 144 (8.3%) |
| 30 to 34 Years | 2,272 (84.2%) | 109 (4.8%) |
| 35 to 44 Years | 4,009 (79.3%) | 353 (8.8%) |
| 45 to 54 Years | 4,335 (81.4%) | 243 (5.6%) |
| 55 to 59 Years | 1,674 (58.6%) | 110 (6.6%) |
| 60 to 64 Years | 1,317 (42.4%) | 38 (2.9%) |
| 65 to 74 Years | 1,199 (29.9%) | 62 (5.2%) |
| 75 Years and over | 124 (5.7%) | 25 (20.3%) |
| Total | 19,969 (60.1%) | 1,857 (9.3%) |
Employment Status by Educational Attainment in St. John the Baptist Parish
According to labor force statistics for St. John the Baptist Parish, 71.1% of individuals (15,338) out of the total population between 25 and 64 years of age (21,572) are in the labor force, with 6.5% or 997 of them being unemployed. The group with the highest labor force participation rate are those with the educational attainment of bachelor's degree or higher, with 82.9% or 2,921 individuals in the labor force. Within the labor force, individuals with less than high school education have the highest percentage of unemployment, with 25.1% or 341 of them being unemployed.
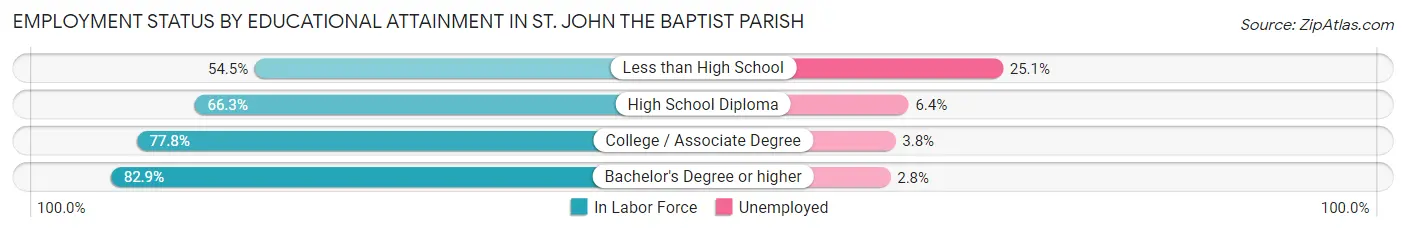
| Educational Attainment | In Labor Force | Unemployed |
| Less than High School | 1,358 (54.5%) | 625 (25.1%) |
| High School Diploma | 5,980 (66.3%) | 577 (6.4%) |
| College / Associate Degree | 5,085 (77.8%) | 248 (3.8%) |
| Bachelor's Degree or higher | 2,921 (82.9%) | 99 (2.8%) |
| Total | 15,338 (71.1%) | 1,402 (6.5%) |
Employment Occupations by Sex in St. John the Baptist Parish
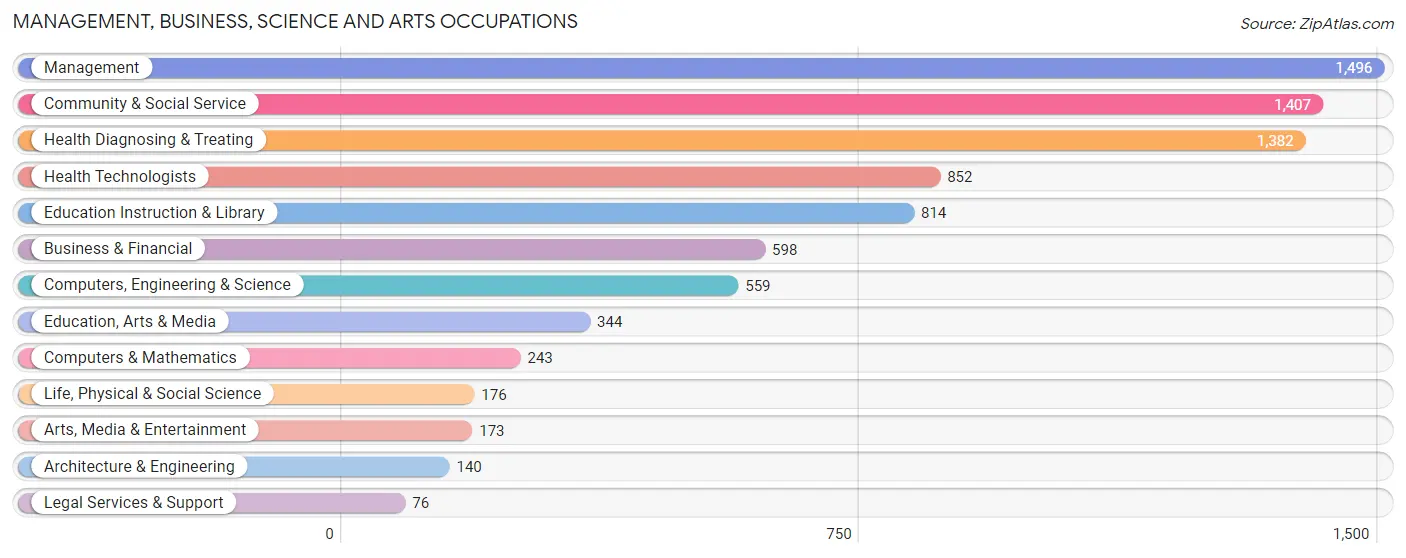
Management, Business, Science and Arts Occupations
The most common Management, Business, Science and Arts occupations in St. John the Baptist Parish are Management (1,496 | 8.3%), Community & Social Service (1,407 | 7.8%), Health Diagnosing & Treating (1,382 | 7.6%), Health Technologists (852 | 4.7%), and Education Instruction & Library (814 | 4.5%).
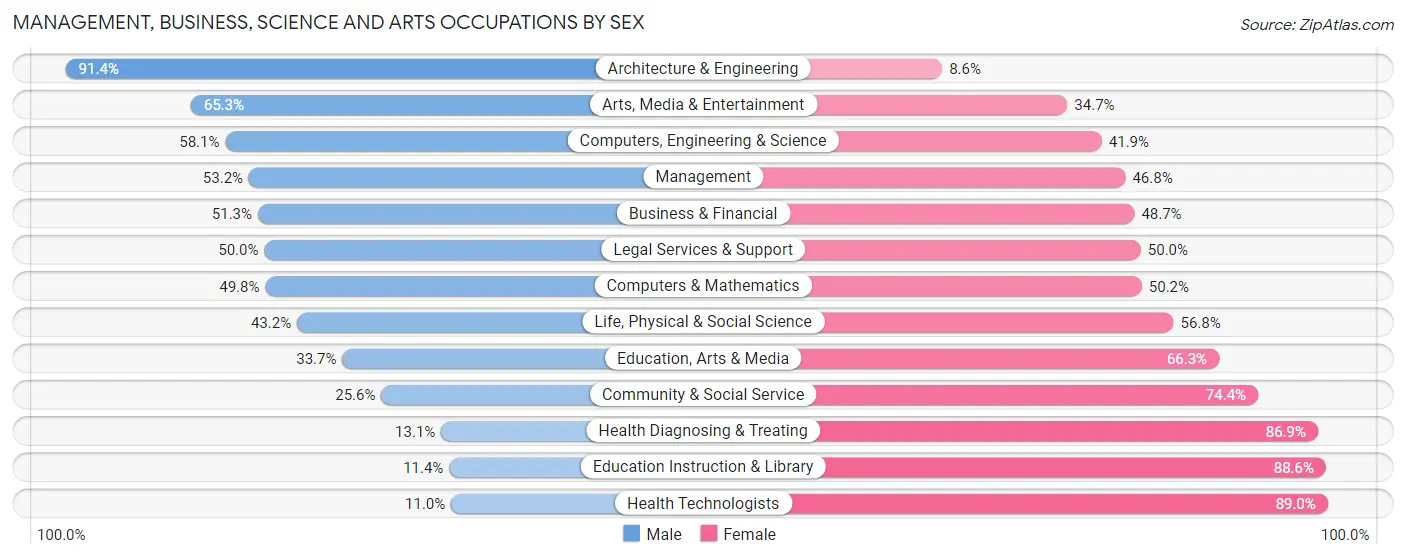
Management, Business, Science and Arts Occupations by Sex
Within the Management, Business, Science and Arts occupations in St. John the Baptist Parish, the most male-oriented occupations are Architecture & Engineering (91.4%), Arts, Media & Entertainment (65.3%), and Computers, Engineering & Science (58.1%), while the most female-oriented occupations are Health Technologists (89.0%), Education Instruction & Library (88.6%), and Health Diagnosing & Treating (86.9%).
| Occupation | Male | Female |
| Management | 796 (53.2%) | 700 (46.8%) |
| Business & Financial | 307 (51.3%) | 291 (48.7%) |
| Computers, Engineering & Science | 325 (58.1%) | 234 (41.9%) |
| Computers & Mathematics | 121 (49.8%) | 122 (50.2%) |
| Architecture & Engineering | 128 (91.4%) | 12 (8.6%) |
| Life, Physical & Social Science | 76 (43.2%) | 100 (56.8%) |
| Community & Social Service | 360 (25.6%) | 1,047 (74.4%) |
| Education, Arts & Media | 116 (33.7%) | 228 (66.3%) |
| Legal Services & Support | 38 (50.0%) | 38 (50.0%) |
| Education Instruction & Library | 93 (11.4%) | 721 (88.6%) |
| Arts, Media & Entertainment | 113 (65.3%) | 60 (34.7%) |
| Health Diagnosing & Treating | 181 (13.1%) | 1,201 (86.9%) |
| Health Technologists | 94 (11.0%) | 758 (89.0%) |
| Total (Category) | 1,969 (36.2%) | 3,473 (63.8%) |
| Total (Overall) | 8,826 (48.8%) | 9,264 (51.2%) |
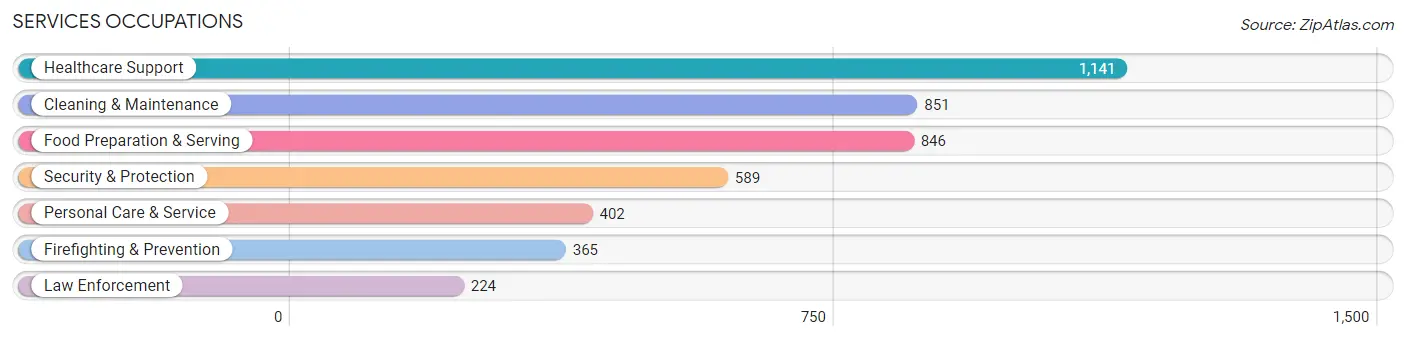
Services Occupations
The most common Services occupations in St. John the Baptist Parish are Healthcare Support (1,141 | 6.3%), Cleaning & Maintenance (851 | 4.7%), Food Preparation & Serving (846 | 4.7%), Security & Protection (589 | 3.3%), and Personal Care & Service (402 | 2.2%).
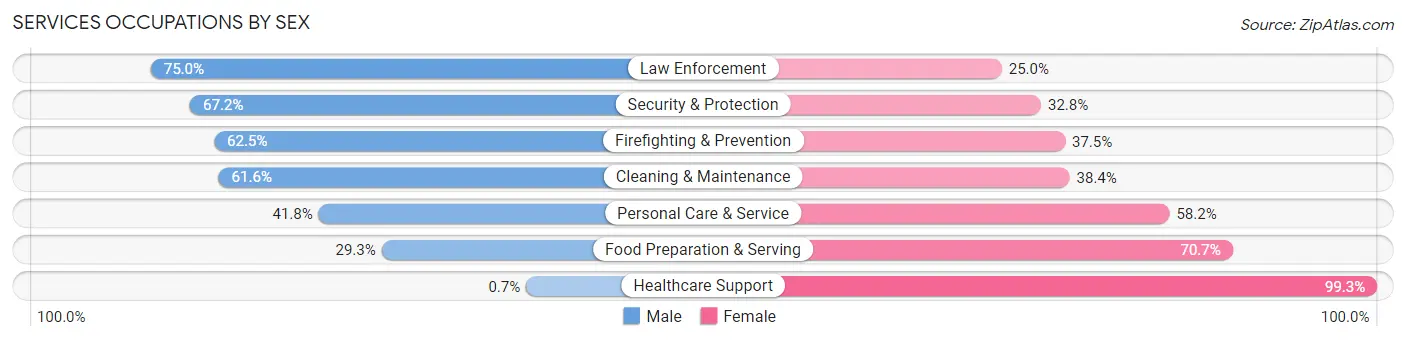
Services Occupations by Sex
Within the Services occupations in St. John the Baptist Parish, the most male-oriented occupations are Law Enforcement (75.0%), Security & Protection (67.2%), and Firefighting & Prevention (62.5%), while the most female-oriented occupations are Healthcare Support (99.3%), Food Preparation & Serving (70.7%), and Personal Care & Service (58.2%).
| Occupation | Male | Female |
| Healthcare Support | 8 (0.7%) | 1,133 (99.3%) |
| Security & Protection | 396 (67.2%) | 193 (32.8%) |
| Firefighting & Prevention | 228 (62.5%) | 137 (37.5%) |
| Law Enforcement | 168 (75.0%) | 56 (25.0%) |
| Food Preparation & Serving | 248 (29.3%) | 598 (70.7%) |
| Cleaning & Maintenance | 524 (61.6%) | 327 (38.4%) |
| Personal Care & Service | 168 (41.8%) | 234 (58.2%) |
| Total (Category) | 1,344 (35.1%) | 2,485 (64.9%) |
| Total (Overall) | 8,826 (48.8%) | 9,264 (51.2%) |
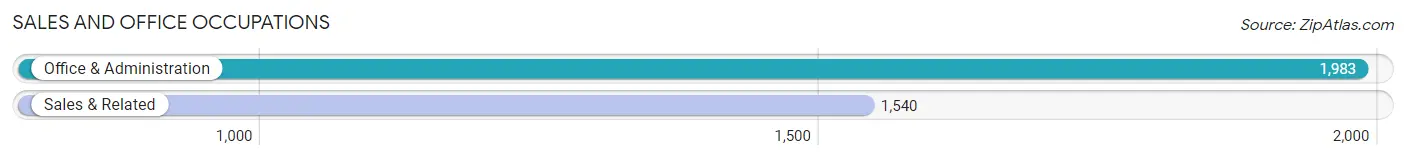
Sales and Office Occupations
The most common Sales and Office occupations in St. John the Baptist Parish are Office & Administration (1,983 | 11.0%), and Sales & Related (1,540 | 8.5%).
Sales and Office Occupations by Sex
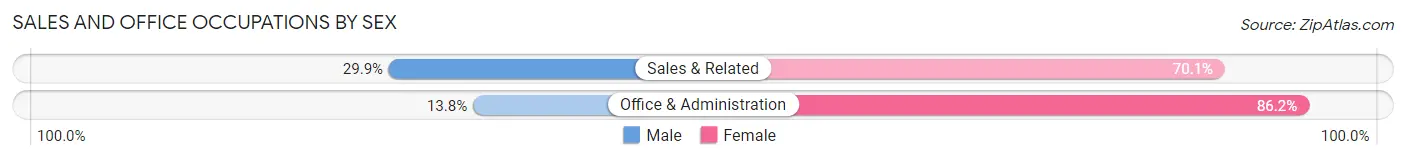
| Occupation | Male | Female |
| Sales & Related | 461 (29.9%) | 1,079 (70.1%) |
| Office & Administration | 273 (13.8%) | 1,710 (86.2%) |
| Total (Category) | 734 (20.8%) | 2,789 (79.2%) |
| Total (Overall) | 8,826 (48.8%) | 9,264 (51.2%) |
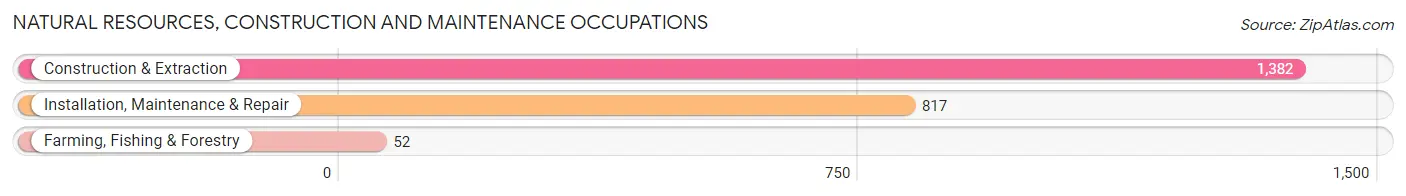
Natural Resources, Construction and Maintenance Occupations
The most common Natural Resources, Construction and Maintenance occupations in St. John the Baptist Parish are Construction & Extraction (1,382 | 7.6%), Installation, Maintenance & Repair (817 | 4.5%), and Farming, Fishing & Forestry (52 | 0.3%).
Natural Resources, Construction and Maintenance Occupations by Sex
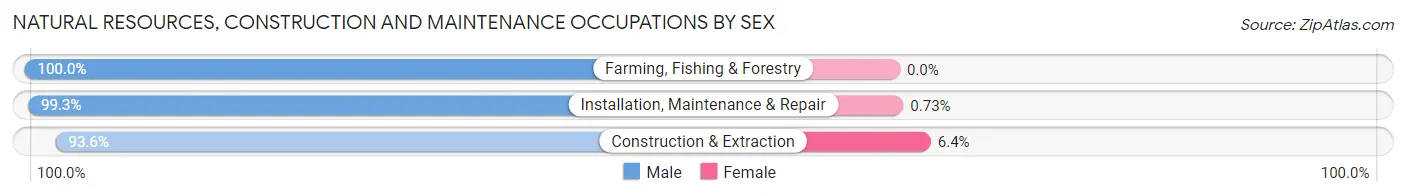
| Occupation | Male | Female |
| Farming, Fishing & Forestry | 52 (100.0%) | 0 (0.0%) |
| Construction & Extraction | 1,293 (93.6%) | 89 (6.4%) |
| Installation, Maintenance & Repair | 811 (99.3%) | 6 (0.7%) |
| Total (Category) | 2,156 (95.8%) | 95 (4.2%) |
| Total (Overall) | 8,826 (48.8%) | 9,264 (51.2%) |
Production, Transportation and Moving Occupations
The most common Production, Transportation and Moving occupations in St. John the Baptist Parish are Production (1,094 | 6.0%), Material Moving (1,000 | 5.5%), and Transportation (951 | 5.3%).
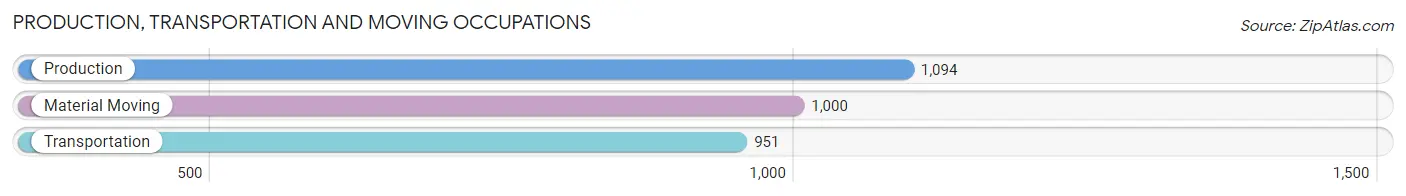
Production, Transportation and Moving Occupations by Sex
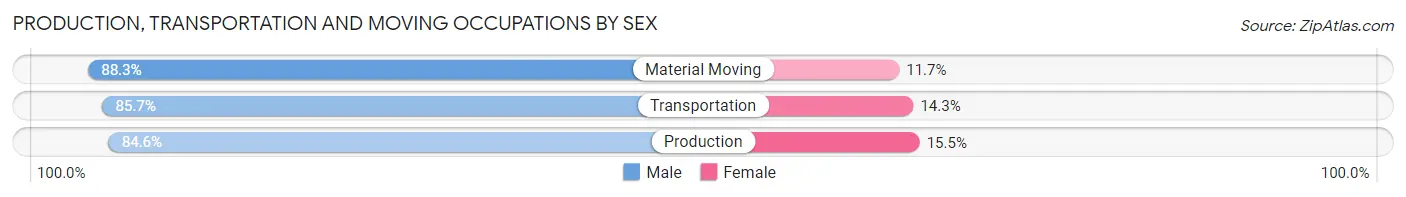
| Occupation | Male | Female |
| Production | 925 (84.6%) | 169 (15.4%) |
| Transportation | 815 (85.7%) | 136 (14.3%) |
| Material Moving | 883 (88.3%) | 117 (11.7%) |
| Total (Category) | 2,623 (86.1%) | 422 (13.9%) |
| Total (Overall) | 8,826 (48.8%) | 9,264 (51.2%) |
Employment Industries by Sex in St. John the Baptist Parish
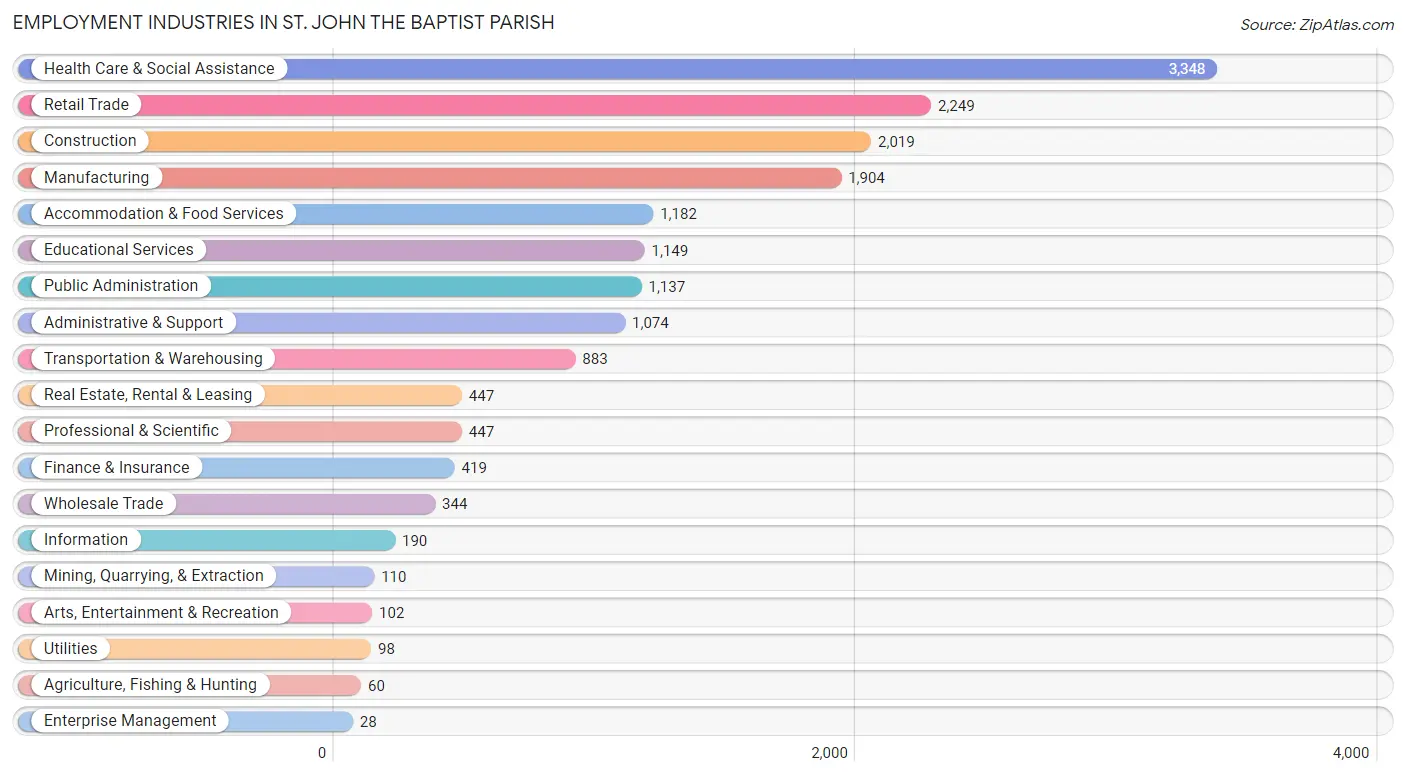
Employment Industries in St. John the Baptist Parish
The major employment industries in St. John the Baptist Parish include Health Care & Social Assistance (3,348 | 18.5%), Retail Trade (2,249 | 12.4%), Construction (2,019 | 11.2%), Manufacturing (1,904 | 10.5%), and Accommodation & Food Services (1,182 | 6.5%).
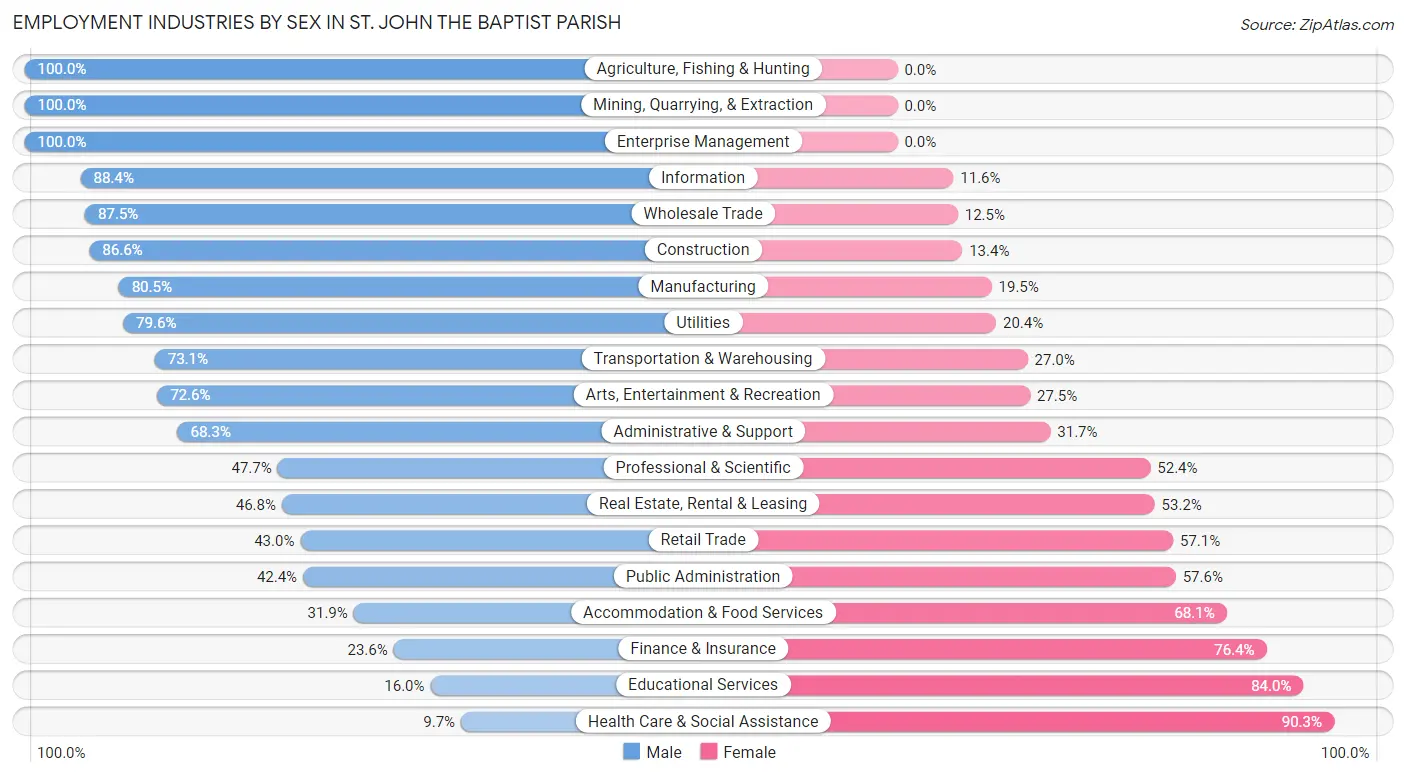
Employment Industries by Sex in St. John the Baptist Parish
The St. John the Baptist Parish industries that see more men than women are Agriculture, Fishing & Hunting (100.0%), Mining, Quarrying, & Extraction (100.0%), and Enterprise Management (100.0%), whereas the industries that tend to have a higher number of women are Health Care & Social Assistance (90.3%), Educational Services (84.0%), and Finance & Insurance (76.4%).
| Industry | Male | Female |
| Agriculture, Fishing & Hunting | 60 (100.0%) | 0 (0.0%) |
| Mining, Quarrying, & Extraction | 110 (100.0%) | 0 (0.0%) |
| Construction | 1,748 (86.6%) | 271 (13.4%) |
| Manufacturing | 1,533 (80.5%) | 371 (19.5%) |
| Wholesale Trade | 301 (87.5%) | 43 (12.5%) |
| Retail Trade | 966 (42.9%) | 1,283 (57.1%) |
| Transportation & Warehousing | 645 (73.1%) | 238 (27.0%) |
| Utilities | 78 (79.6%) | 20 (20.4%) |
| Information | 168 (88.4%) | 22 (11.6%) |
| Finance & Insurance | 99 (23.6%) | 320 (76.4%) |
| Real Estate, Rental & Leasing | 209 (46.8%) | 238 (53.2%) |
| Professional & Scientific | 213 (47.6%) | 234 (52.3%) |
| Enterprise Management | 28 (100.0%) | 0 (0.0%) |
| Administrative & Support | 734 (68.3%) | 340 (31.7%) |
| Educational Services | 184 (16.0%) | 965 (84.0%) |
| Health Care & Social Assistance | 324 (9.7%) | 3,024 (90.3%) |
| Arts, Entertainment & Recreation | 74 (72.6%) | 28 (27.5%) |
| Accommodation & Food Services | 377 (31.9%) | 805 (68.1%) |
| Public Administration | 482 (42.4%) | 655 (57.6%) |
| Total | 8,826 (48.8%) | 9,264 (51.2%) |
Education in St. John the Baptist Parish
School Enrollment in St. John the Baptist Parish
The most common levels of schooling among the 11,226 students in St. John the Baptist Parish are high school (2,787 | 24.8%), middle school (2,640 | 23.5%), and elementary school (2,107 | 18.8%).

| School Level | # Students | % Students |
| Nursery / Preschool | 777 | 6.9% |
| Kindergarten | 710 | 6.3% |
| Elementary School | 2,107 | 18.8% |
| Middle School | 2,640 | 23.5% |
| High School | 2,787 | 24.8% |
| College / Undergraduate | 1,765 | 15.7% |
| Graduate / Professional | 440 | 3.9% |
| Total | 11,226 | 100.0% |
School Enrollment by Age by Funding Source in St. John the Baptist Parish
Out of a total of 11,226 students who are enrolled in schools in St. John the Baptist Parish, 2,032 (18.1%) attend a private institution, while the remaining 9,194 (81.9%) are enrolled in public schools. The age group of 3 to 4 year olds has the highest likelihood of being enrolled in private schools, with 196 (27.7% in the age bracket) enrolled. Conversely, the age group of 25 to 34 year olds has the lowest likelihood of being enrolled in a private school, with 516 (90.5% in the age bracket) attending a public institution.
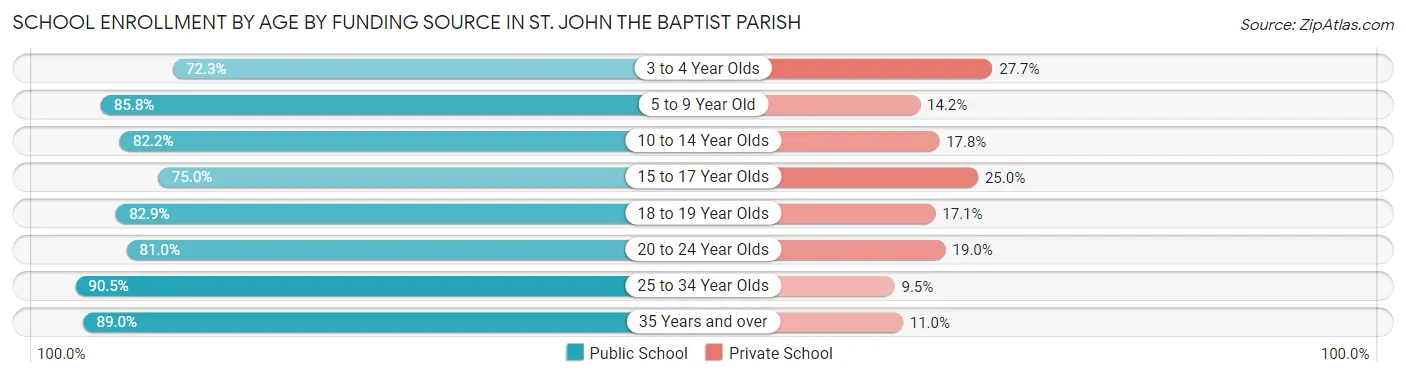
| Age Bracket | Public School | Private School |
| 3 to 4 Year Olds | 512 (72.3%) | 196 (27.7%) |
| 5 to 9 Year Old | 2,364 (85.8%) | 392 (14.2%) |
| 10 to 14 Year Olds | 2,440 (82.2%) | 528 (17.8%) |
| 15 to 17 Year Olds | 1,516 (75.0%) | 506 (25.0%) |
| 18 to 19 Year Olds | 471 (82.9%) | 97 (17.1%) |
| 20 to 24 Year Olds | 772 (81.0%) | 181 (19.0%) |
| 25 to 34 Year Olds | 516 (90.5%) | 54 (9.5%) |
| 35 Years and over | 606 (89.0%) | 75 (11.0%) |
| Total | 9,194 (81.9%) | 2,032 (18.1%) |
Educational Attainment by Field of Study in St. John the Baptist Parish
Business (1,038 | 21.8%), education (1,026 | 21.6%), science & technology (766 | 16.1%), bio, nature & agricultural (326 | 6.9%), and computers & mathematics (236 | 5.0%) are the most common fields of study among 4,758 individuals in St. John the Baptist Parish who have obtained a bachelor's degree or higher.
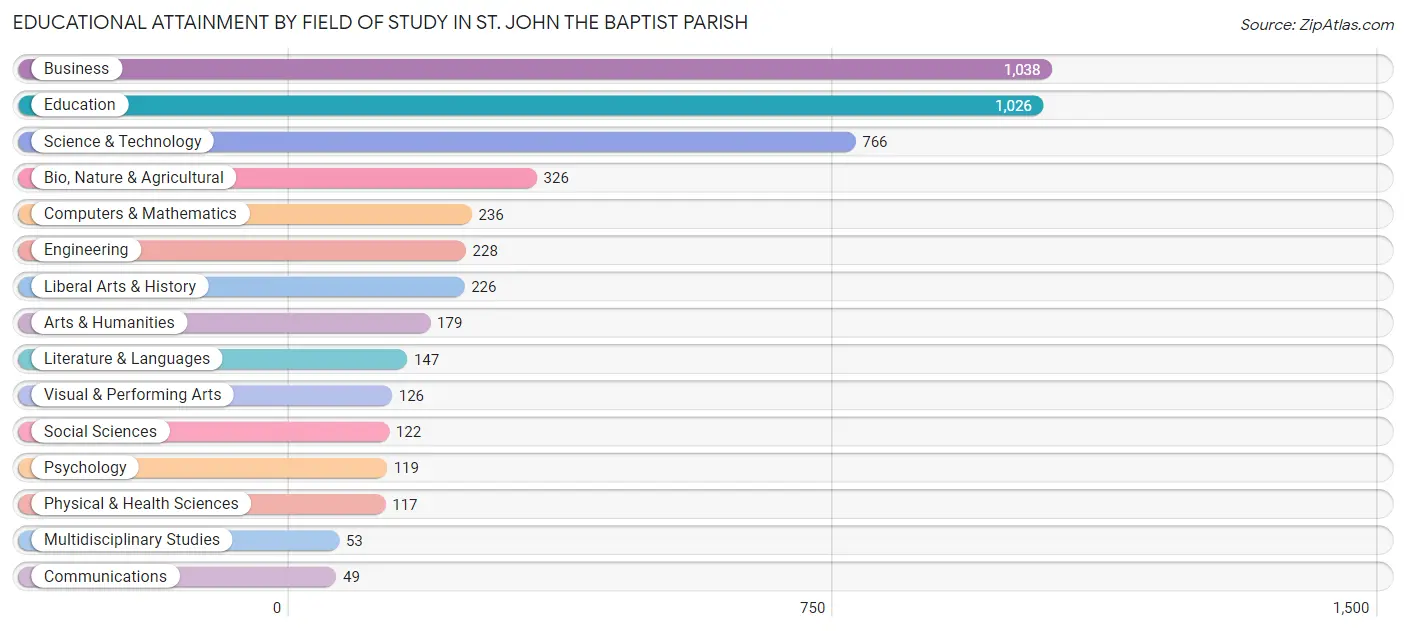
| Field of Study | # Graduates | % Graduates |
| Computers & Mathematics | 236 | 5.0% |
| Bio, Nature & Agricultural | 326 | 6.9% |
| Physical & Health Sciences | 117 | 2.5% |
| Psychology | 119 | 2.5% |
| Social Sciences | 122 | 2.6% |
| Engineering | 228 | 4.8% |
| Multidisciplinary Studies | 53 | 1.1% |
| Science & Technology | 766 | 16.1% |
| Business | 1,038 | 21.8% |
| Education | 1,026 | 21.6% |
| Literature & Languages | 147 | 3.1% |
| Liberal Arts & History | 226 | 4.8% |
| Visual & Performing Arts | 126 | 2.6% |
| Communications | 49 | 1.0% |
| Arts & Humanities | 179 | 3.8% |
| Total | 4,758 | 100.0% |
Transportation & Commute in St. John the Baptist Parish
Vehicle Availability by Sex in St. John the Baptist Parish
The most prevalent vehicle ownership categories in St. John the Baptist Parish are males with 2 vehicles (3,893, accounting for 45.0%) and females with 2 vehicles (3,015, making up 44.0%).
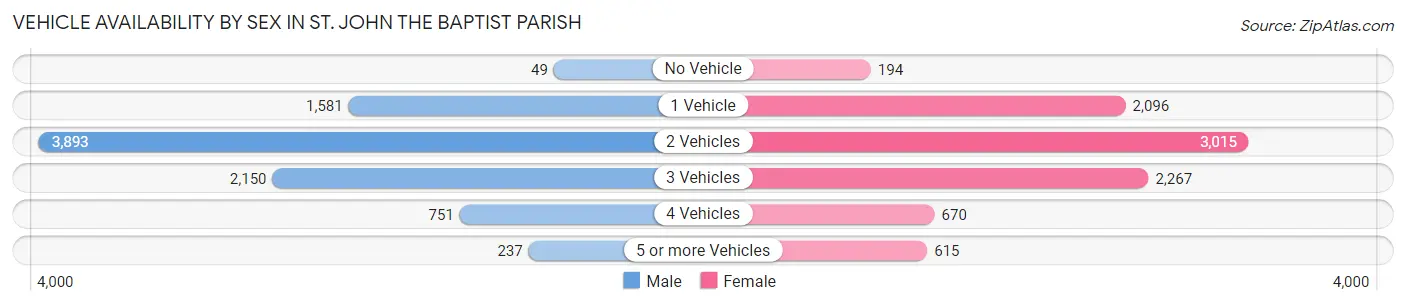
| Vehicles Available | Male | Female |
| No Vehicle | 49 (0.6%) | 194 (2.2%) |
| 1 Vehicle | 1,581 (18.2%) | 2,096 (23.7%) |
| 2 Vehicles | 3,893 (45.0%) | 3,015 (34.0%) |
| 3 Vehicles | 2,150 (24.8%) | 2,267 (25.6%) |
| 4 Vehicles | 751 (8.7%) | 670 (7.6%) |
| 5 or more Vehicles | 237 (2.7%) | 615 (6.9%) |
| Total | 8,661 (100.0%) | 8,857 (100.0%) |
Commute Time in St. John the Baptist Parish
The most frequently occuring commute durations in St. John the Baptist Parish are 30 to 34 minutes (3,015 commuters, 18.1%), 10 to 14 minutes (2,127 commuters, 12.8%), and 45 to 59 minutes (2,088 commuters, 12.5%).
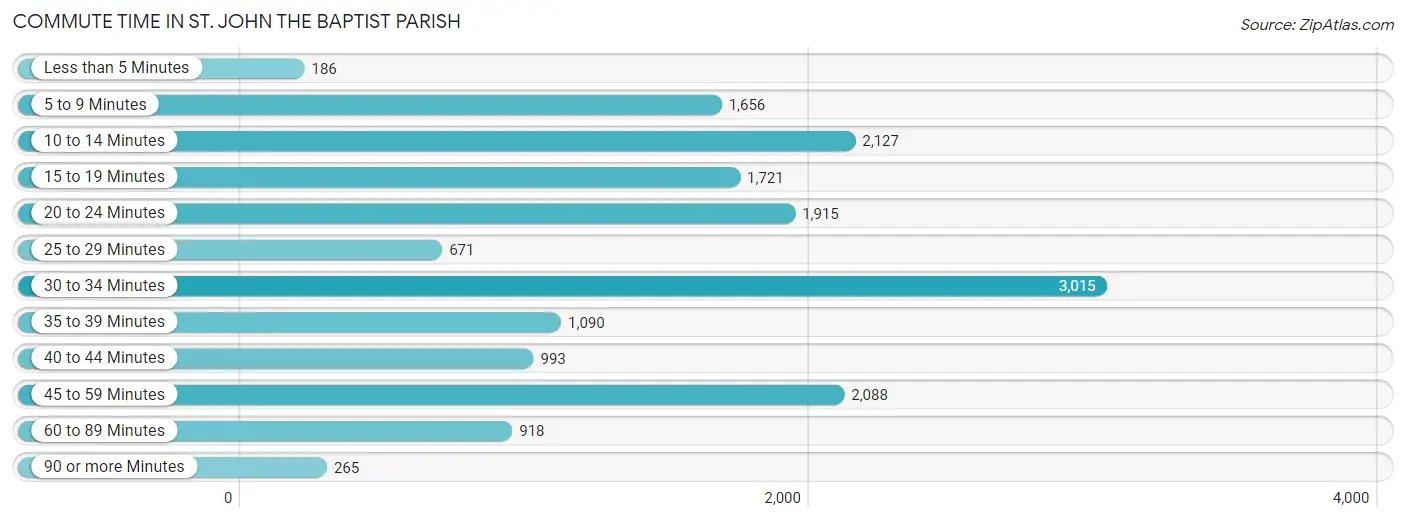
| Commute Time | # Commuters | % Commuters |
| Less than 5 Minutes | 186 | 1.1% |
| 5 to 9 Minutes | 1,656 | 10.0% |
| 10 to 14 Minutes | 2,127 | 12.8% |
| 15 to 19 Minutes | 1,721 | 10.3% |
| 20 to 24 Minutes | 1,915 | 11.5% |
| 25 to 29 Minutes | 671 | 4.0% |
| 30 to 34 Minutes | 3,015 | 18.1% |
| 35 to 39 Minutes | 1,090 | 6.6% |
| 40 to 44 Minutes | 993 | 6.0% |
| 45 to 59 Minutes | 2,088 | 12.5% |
| 60 to 89 Minutes | 918 | 5.5% |
| 90 or more Minutes | 265 | 1.6% |
Commute Time by Sex in St. John the Baptist Parish
The most common commute times in St. John the Baptist Parish are 30 to 34 minutes (1,514 commuters, 18.0%) for males and 30 to 34 minutes (1,501 commuters, 18.2%) for females.
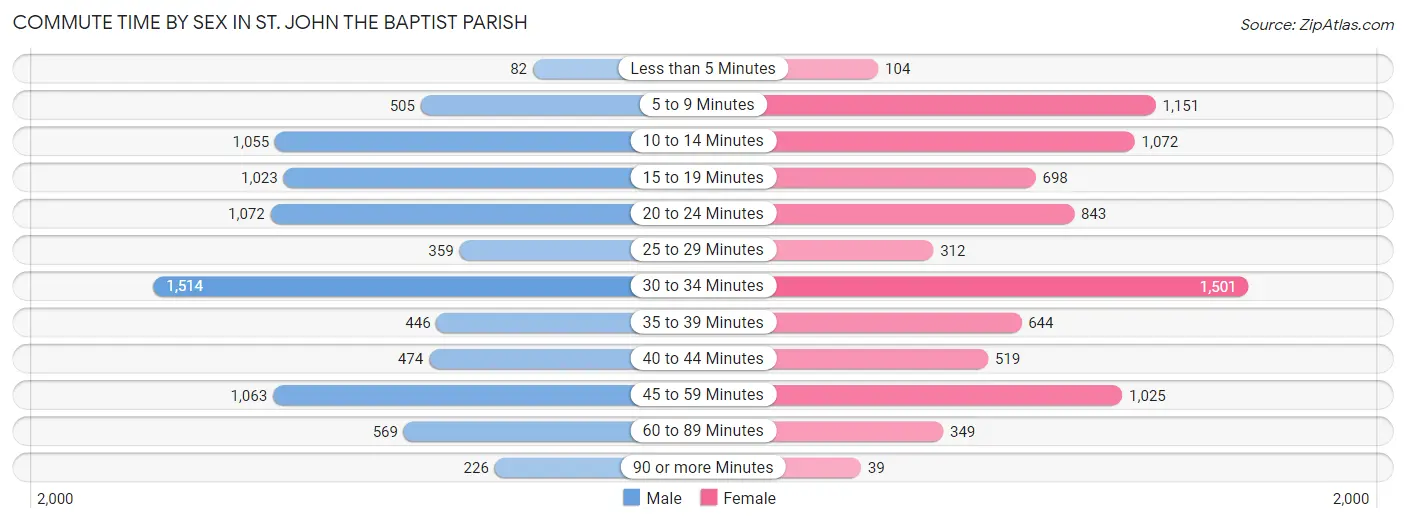
| Commute Time | Male | Female |
| Less than 5 Minutes | 82 (1.0%) | 104 (1.3%) |
| 5 to 9 Minutes | 505 (6.0%) | 1,151 (13.9%) |
| 10 to 14 Minutes | 1,055 (12.6%) | 1,072 (13.0%) |
| 15 to 19 Minutes | 1,023 (12.2%) | 698 (8.5%) |
| 20 to 24 Minutes | 1,072 (12.8%) | 843 (10.2%) |
| 25 to 29 Minutes | 359 (4.3%) | 312 (3.8%) |
| 30 to 34 Minutes | 1,514 (18.0%) | 1,501 (18.2%) |
| 35 to 39 Minutes | 446 (5.3%) | 644 (7.8%) |
| 40 to 44 Minutes | 474 (5.7%) | 519 (6.3%) |
| 45 to 59 Minutes | 1,063 (12.7%) | 1,025 (12.4%) |
| 60 to 89 Minutes | 569 (6.8%) | 349 (4.2%) |
| 90 or more Minutes | 226 (2.7%) | 39 (0.5%) |
Time of Departure to Work by Sex in St. John the Baptist Parish
The most frequent times of departure to work in St. John the Baptist Parish are 12:00 AM to 4:59 AM (1,400, 16.7%) for males and 6:00 AM to 6:29 AM (1,031, 12.5%) for females.
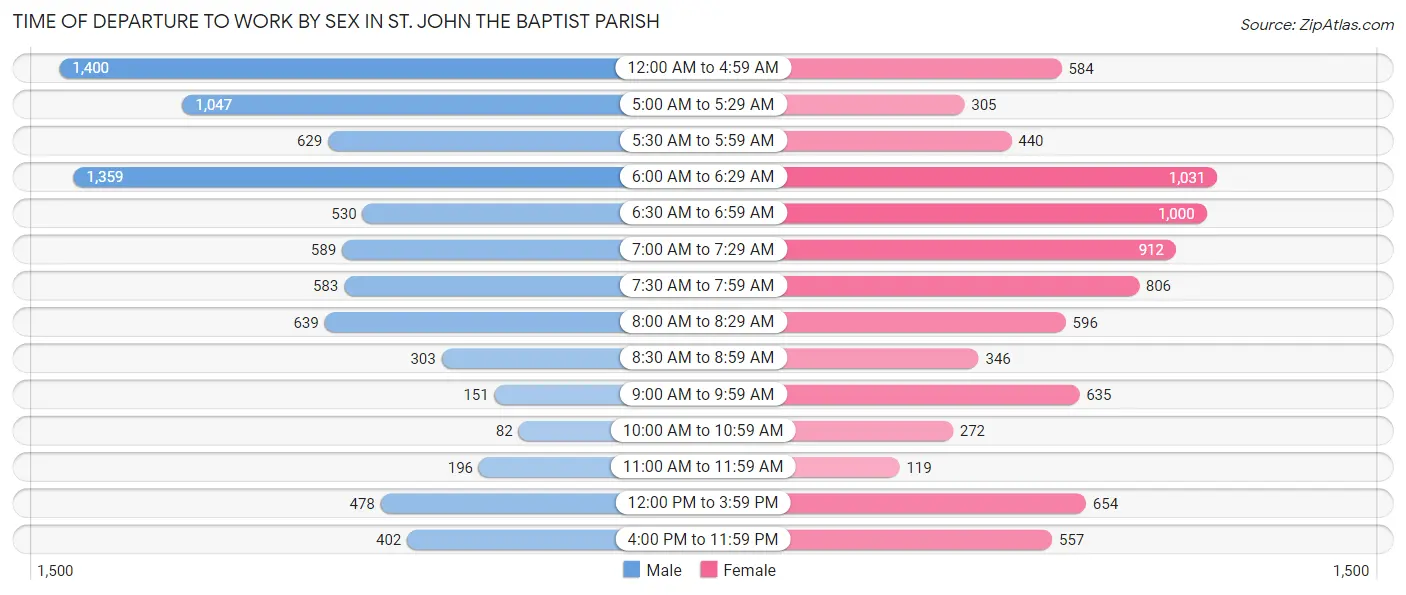
| Time of Departure | Male | Female |
| 12:00 AM to 4:59 AM | 1,400 (16.7%) | 584 (7.1%) |
| 5:00 AM to 5:29 AM | 1,047 (12.5%) | 305 (3.7%) |
| 5:30 AM to 5:59 AM | 629 (7.5%) | 440 (5.3%) |
| 6:00 AM to 6:29 AM | 1,359 (16.2%) | 1,031 (12.5%) |
| 6:30 AM to 6:59 AM | 530 (6.3%) | 1,000 (12.1%) |
| 7:00 AM to 7:29 AM | 589 (7.0%) | 912 (11.1%) |
| 7:30 AM to 7:59 AM | 583 (7.0%) | 806 (9.8%) |
| 8:00 AM to 8:29 AM | 639 (7.6%) | 596 (7.2%) |
| 8:30 AM to 8:59 AM | 303 (3.6%) | 346 (4.2%) |
| 9:00 AM to 9:59 AM | 151 (1.8%) | 635 (7.7%) |
| 10:00 AM to 10:59 AM | 82 (1.0%) | 272 (3.3%) |
| 11:00 AM to 11:59 AM | 196 (2.3%) | 119 (1.4%) |
| 12:00 PM to 3:59 PM | 478 (5.7%) | 654 (7.9%) |
| 4:00 PM to 11:59 PM | 402 (4.8%) | 557 (6.8%) |
| Total | 8,388 (100.0%) | 8,257 (100.0%) |
Housing Occupancy in St. John the Baptist Parish
Occupancy by Ownership in St. John the Baptist Parish
Of the total 15,232 dwellings in St. John the Baptist Parish, owner-occupied units account for 11,808 (77.5%), while renter-occupied units make up 3,424 (22.5%).
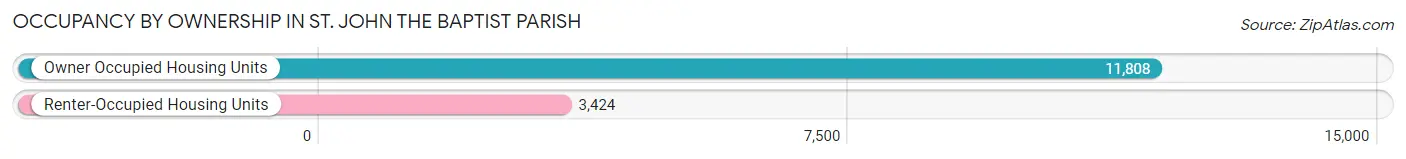
| Occupancy | # Housing Units | % Housing Units |
| Owner Occupied Housing Units | 11,808 | 77.5% |
| Renter-Occupied Housing Units | 3,424 | 22.5% |
| Total Occupied Housing Units | 15,232 | 100.0% |
Occupancy by Household Size in St. John the Baptist Parish
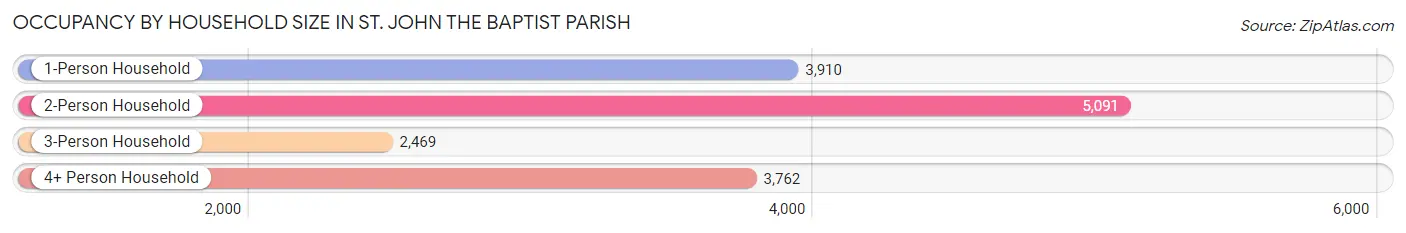
| Household Size | # Housing Units | % Housing Units |
| 1-Person Household | 3,910 | 25.7% |
| 2-Person Household | 5,091 | 33.4% |
| 3-Person Household | 2,469 | 16.2% |
| 4+ Person Household | 3,762 | 24.7% |
| Total Housing Units | 15,232 | 100.0% |
Occupancy by Ownership by Household Size in St. John the Baptist Parish
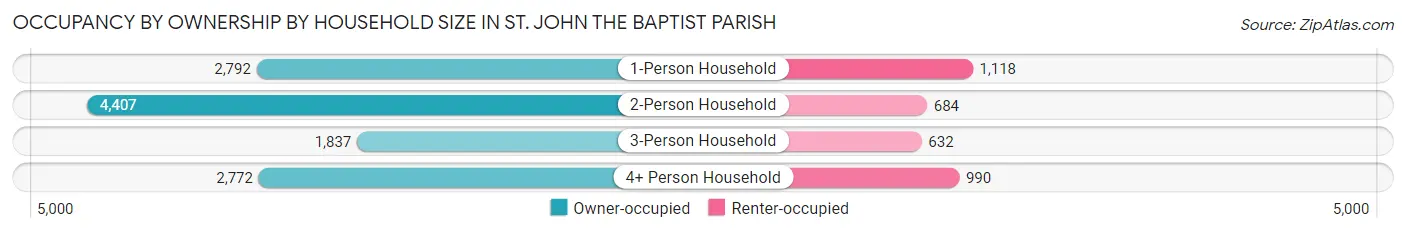
| Household Size | Owner-occupied | Renter-occupied |
| 1-Person Household | 2,792 (71.4%) | 1,118 (28.6%) |
| 2-Person Household | 4,407 (86.6%) | 684 (13.4%) |
| 3-Person Household | 1,837 (74.4%) | 632 (25.6%) |
| 4+ Person Household | 2,772 (73.7%) | 990 (26.3%) |
| Total Housing Units | 11,808 (77.5%) | 3,424 (22.5%) |
Occupancy by Educational Attainment in St. John the Baptist Parish
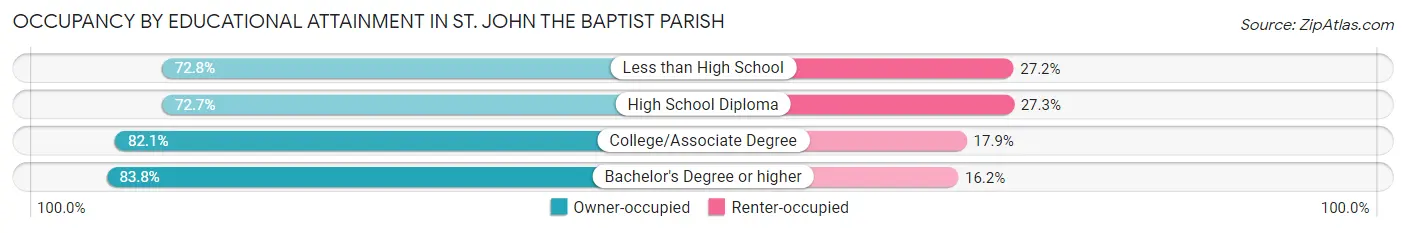
| Household Size | Owner-occupied | Renter-occupied |
| Less than High School | 1,512 (72.8%) | 565 (27.2%) |
| High School Diploma | 4,248 (72.7%) | 1,593 (27.3%) |
| College/Associate Degree | 3,782 (82.1%) | 827 (17.9%) |
| Bachelor's Degree or higher | 2,266 (83.8%) | 439 (16.2%) |
Occupancy by Age of Householder in St. John the Baptist Parish
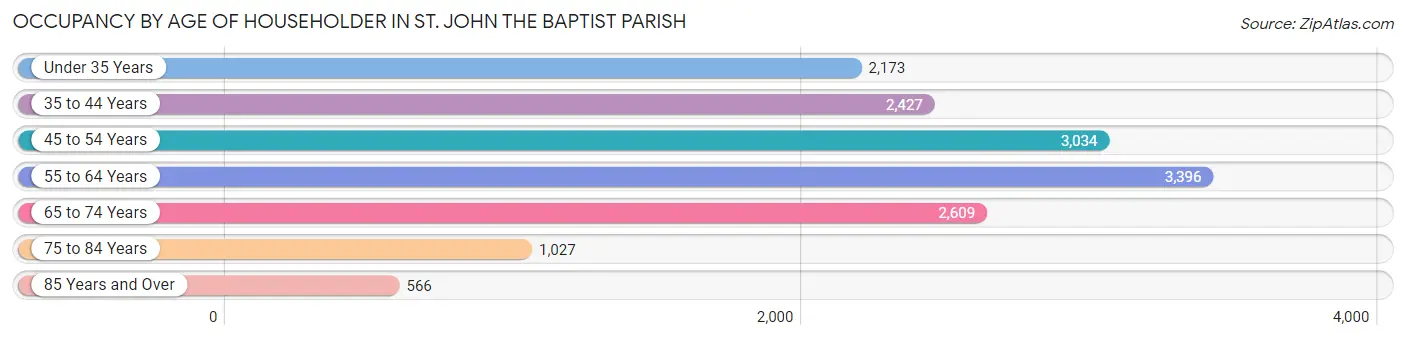
| Age Bracket | # Households | % Households |
| Under 35 Years | 2,173 | 14.3% |
| 35 to 44 Years | 2,427 | 15.9% |
| 45 to 54 Years | 3,034 | 19.9% |
| 55 to 64 Years | 3,396 | 22.3% |
| 65 to 74 Years | 2,609 | 17.1% |
| 75 to 84 Years | 1,027 | 6.7% |
| 85 Years and Over | 566 | 3.7% |
| Total | 15,232 | 100.0% |
Housing Finances in St. John the Baptist Parish
Median Income by Occupancy in St. John the Baptist Parish
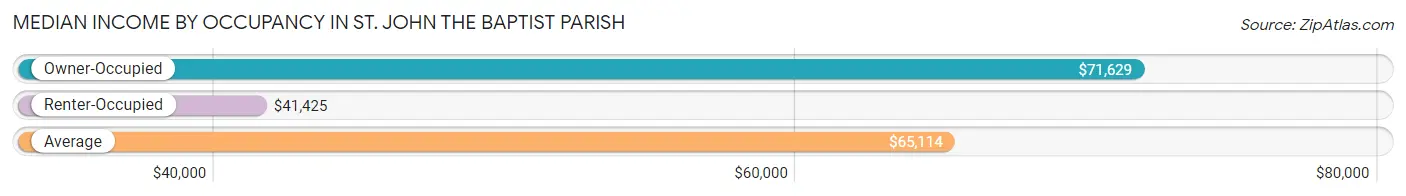
| Occupancy Type | # Households | Median Income |
| Owner-Occupied | 11,808 (77.5%) | $71,629 |
| Renter-Occupied | 3,424 (22.5%) | $41,425 |
| Average | 15,232 (100.0%) | $65,114 |
Occupancy by Householder Income Bracket in St. John the Baptist Parish
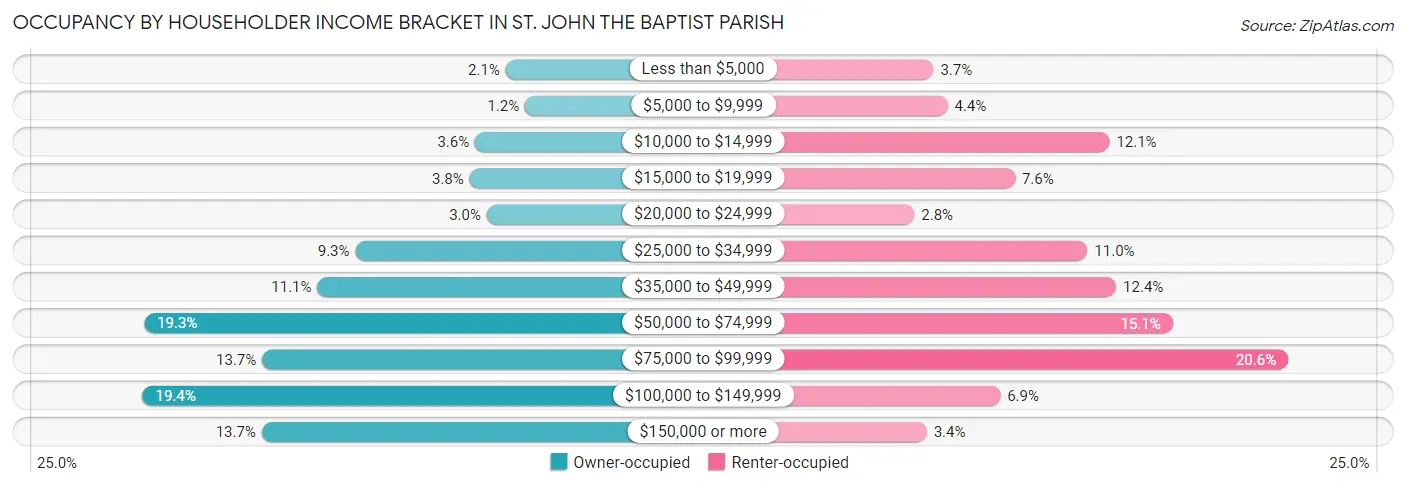
| Income Bracket | Owner-occupied | Renter-occupied |
| Less than $5,000 | 247 (2.1%) | 127 (3.7%) |
| $5,000 to $9,999 | 138 (1.2%) | 150 (4.4%) |
| $10,000 to $14,999 | 419 (3.5%) | 414 (12.1%) |
| $15,000 to $19,999 | 450 (3.8%) | 260 (7.6%) |
| $20,000 to $24,999 | 353 (3.0%) | 96 (2.8%) |
| $25,000 to $34,999 | 1,092 (9.2%) | 378 (11.0%) |
| $35,000 to $49,999 | 1,306 (11.1%) | 425 (12.4%) |
| $50,000 to $74,999 | 2,280 (19.3%) | 517 (15.1%) |
| $75,000 to $99,999 | 1,616 (13.7%) | 705 (20.6%) |
| $100,000 to $149,999 | 2,288 (19.4%) | 236 (6.9%) |
| $150,000 or more | 1,619 (13.7%) | 116 (3.4%) |
| Total | 11,808 (100.0%) | 3,424 (100.0%) |
Monthly Housing Cost Tiers in St. John the Baptist Parish
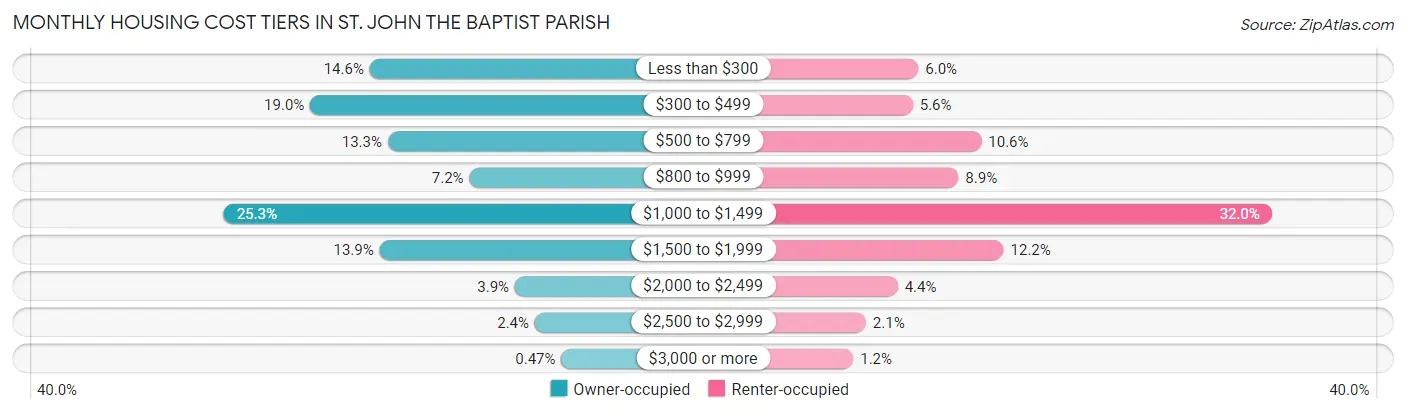
| Monthly Cost | Owner-occupied | Renter-occupied |
| Less than $300 | 1,722 (14.6%) | 204 (6.0%) |
| $300 to $499 | 2,240 (19.0%) | 190 (5.6%) |
| $500 to $799 | 1,564 (13.3%) | 363 (10.6%) |
| $800 to $999 | 855 (7.2%) | 305 (8.9%) |
| $1,000 to $1,499 | 2,991 (25.3%) | 1,095 (32.0%) |
| $1,500 to $1,999 | 1,636 (13.9%) | 419 (12.2%) |
| $2,000 to $2,499 | 459 (3.9%) | 152 (4.4%) |
| $2,500 to $2,999 | 286 (2.4%) | 72 (2.1%) |
| $3,000 or more | 55 (0.5%) | 40 (1.2%) |
| Total | 11,808 (100.0%) | 3,424 (100.0%) |
Physical Housing Characteristics in St. John the Baptist Parish
Housing Structures in St. John the Baptist Parish
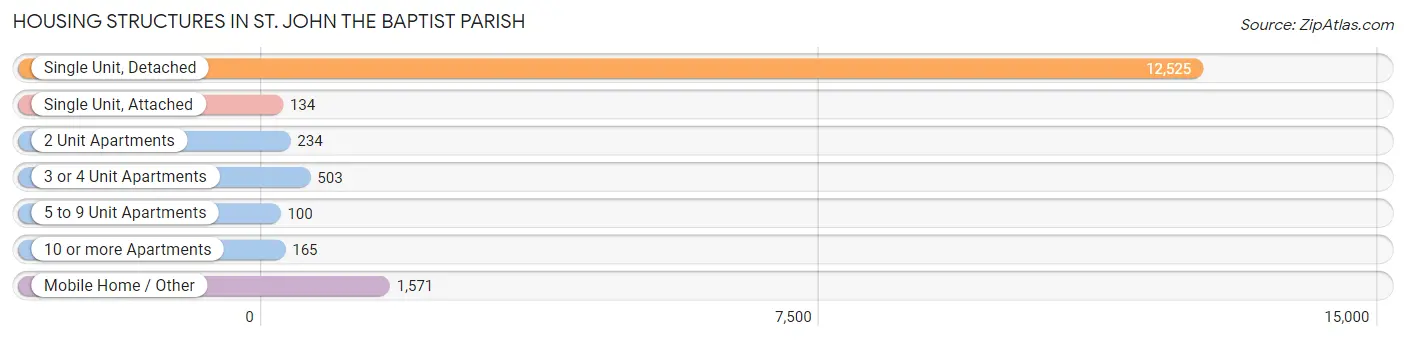
| Structure Type | # Housing Units | % Housing Units |
| Single Unit, Detached | 12,525 | 82.2% |
| Single Unit, Attached | 134 | 0.9% |
| 2 Unit Apartments | 234 | 1.5% |
| 3 or 4 Unit Apartments | 503 | 3.3% |
| 5 to 9 Unit Apartments | 100 | 0.7% |
| 10 or more Apartments | 165 | 1.1% |
| Mobile Home / Other | 1,571 | 10.3% |
| Total | 15,232 | 100.0% |
Housing Structures by Occupancy in St. John the Baptist Parish
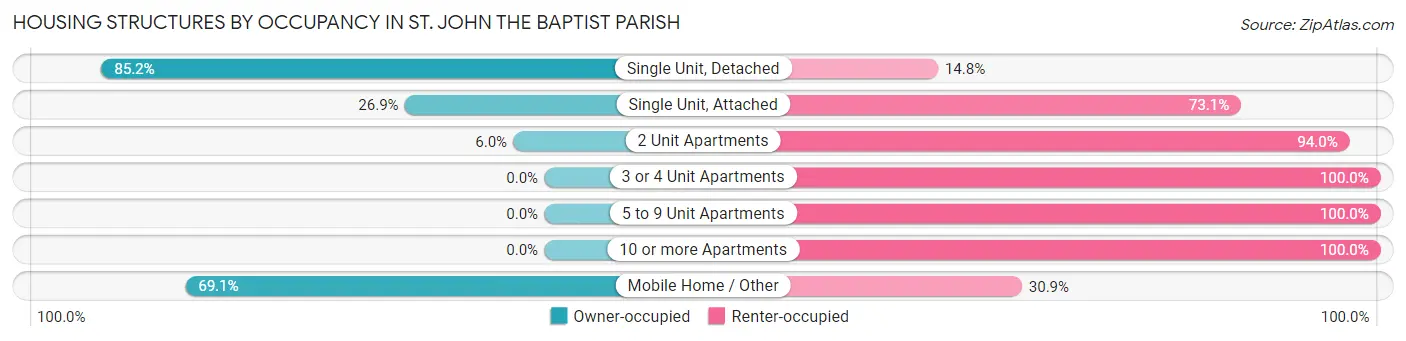
| Structure Type | Owner-occupied | Renter-occupied |
| Single Unit, Detached | 10,673 (85.2%) | 1,852 (14.8%) |
| Single Unit, Attached | 36 (26.9%) | 98 (73.1%) |
| 2 Unit Apartments | 14 (6.0%) | 220 (94.0%) |
| 3 or 4 Unit Apartments | 0 (0.0%) | 503 (100.0%) |
| 5 to 9 Unit Apartments | 0 (0.0%) | 100 (100.0%) |
| 10 or more Apartments | 0 (0.0%) | 165 (100.0%) |
| Mobile Home / Other | 1,085 (69.1%) | 486 (30.9%) |
| Total | 11,808 (77.5%) | 3,424 (22.5%) |
Housing Structures by Number of Rooms in St. John the Baptist Parish
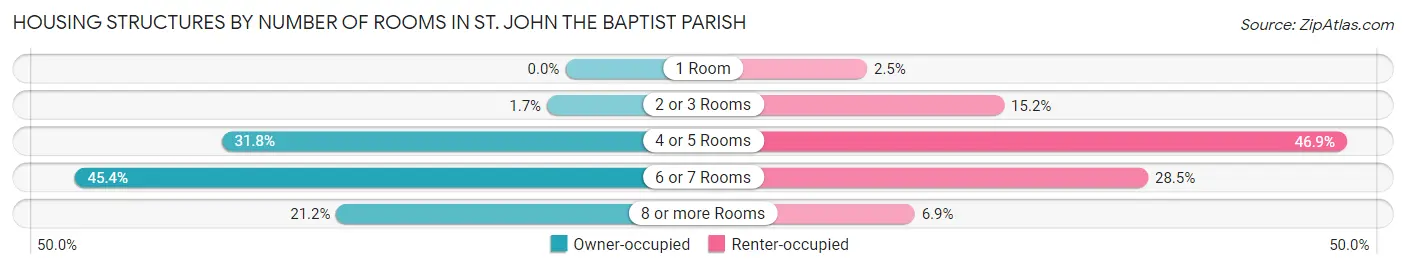
| Number of Rooms | Owner-occupied | Renter-occupied |
| 1 Room | 0 (0.0%) | 86 (2.5%) |
| 2 or 3 Rooms | 199 (1.7%) | 520 (15.2%) |
| 4 or 5 Rooms | 3,752 (31.8%) | 1,605 (46.9%) |
| 6 or 7 Rooms | 5,357 (45.4%) | 976 (28.5%) |
| 8 or more Rooms | 2,500 (21.2%) | 237 (6.9%) |
| Total | 11,808 (100.0%) | 3,424 (100.0%) |
Housing Structure by Heating Type in St. John the Baptist Parish
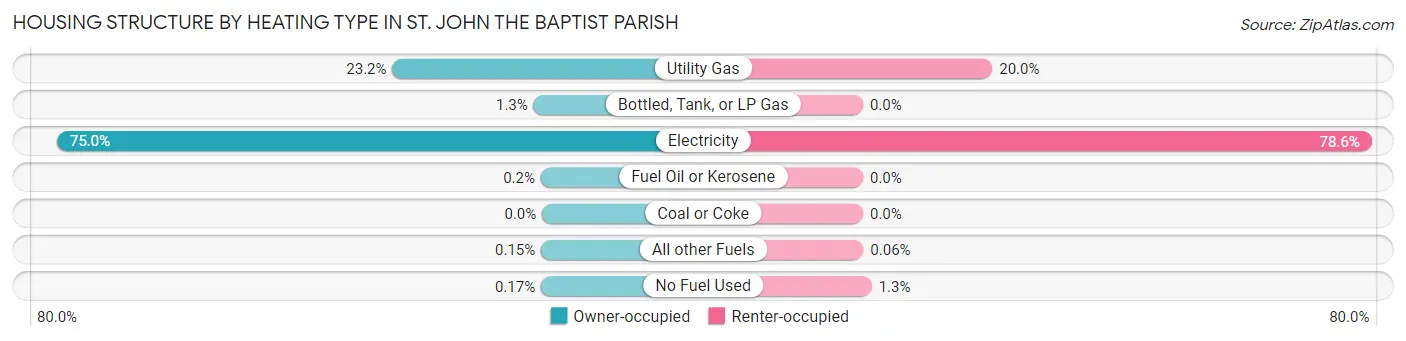
| Heating Type | Owner-occupied | Renter-occupied |
| Utility Gas | 2,733 (23.2%) | 684 (20.0%) |
| Bottled, Tank, or LP Gas | 155 (1.3%) | 0 (0.0%) |
| Electricity | 8,858 (75.0%) | 2,692 (78.6%) |
| Fuel Oil or Kerosene | 24 (0.2%) | 0 (0.0%) |
| Coal or Coke | 0 (0.0%) | 0 (0.0%) |
| All other Fuels | 18 (0.2%) | 2 (0.1%) |
| No Fuel Used | 20 (0.2%) | 46 (1.3%) |
| Total | 11,808 (100.0%) | 3,424 (100.0%) |
Household Vehicle Usage in St. John the Baptist Parish
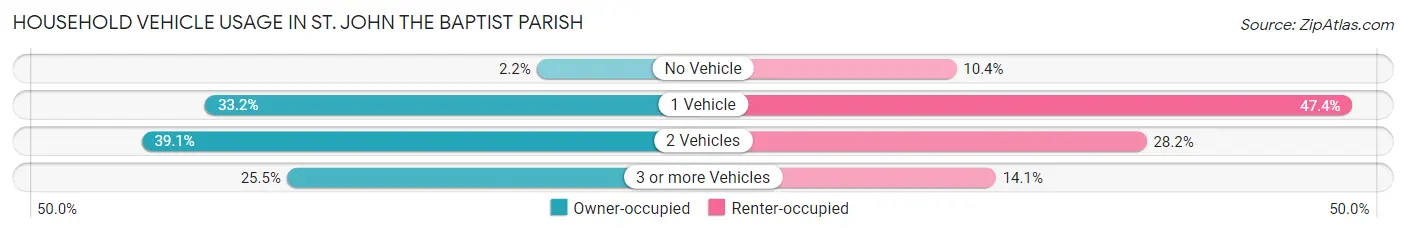
| Vehicles per Household | Owner-occupied | Renter-occupied |
| No Vehicle | 261 (2.2%) | 356 (10.4%) |
| 1 Vehicle | 3,916 (33.2%) | 1,622 (47.4%) |
| 2 Vehicles | 4,616 (39.1%) | 964 (28.1%) |
| 3 or more Vehicles | 3,015 (25.5%) | 482 (14.1%) |
| Total | 11,808 (100.0%) | 3,424 (100.0%) |
Real Estate & Mortgages in St. John the Baptist Parish
Real Estate and Mortgage Overview in St. John the Baptist Parish
| Characteristic | Without Mortgage | With Mortgage |
| Housing Units | 5,508 | 6,300 |
| Median Property Value | $155,700 | $183,500 |
| Median Household Income | $54,596 | $1,023 |
| Monthly Housing Costs | $392 | $55 |
| Real Estate Taxes | $604 | $916 |
Property Value by Mortgage Status in St. John the Baptist Parish
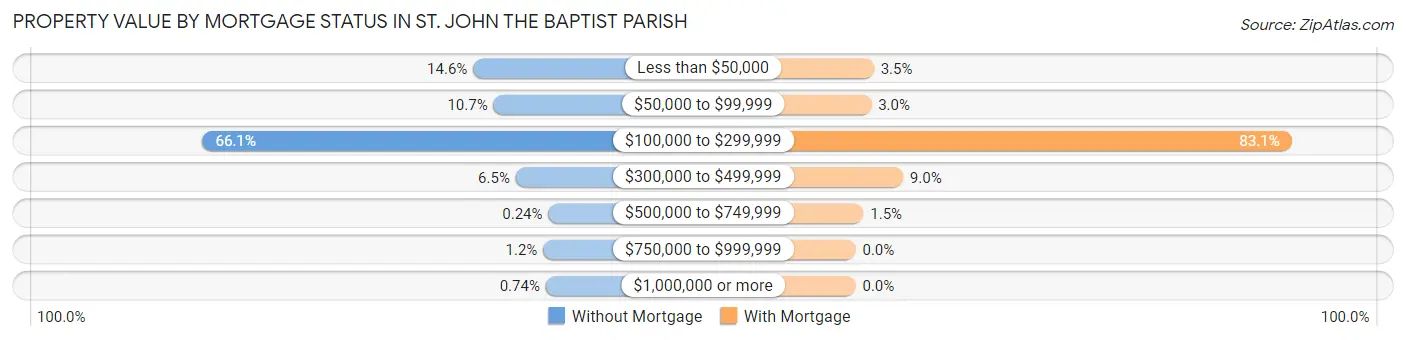
| Property Value | Without Mortgage | With Mortgage |
| Less than $50,000 | 802 (14.6%) | 218 (3.5%) |
| $50,000 to $99,999 | 589 (10.7%) | 188 (3.0%) |
| $100,000 to $299,999 | 3,641 (66.1%) | 5,232 (83.1%) |
| $300,000 to $499,999 | 355 (6.5%) | 568 (9.0%) |
| $500,000 to $749,999 | 13 (0.2%) | 94 (1.5%) |
| $750,000 to $999,999 | 67 (1.2%) | 0 (0.0%) |
| $1,000,000 or more | 41 (0.7%) | 0 (0.0%) |
| Total | 5,508 (100.0%) | 6,300 (100.0%) |
Household Income by Mortgage Status in St. John the Baptist Parish
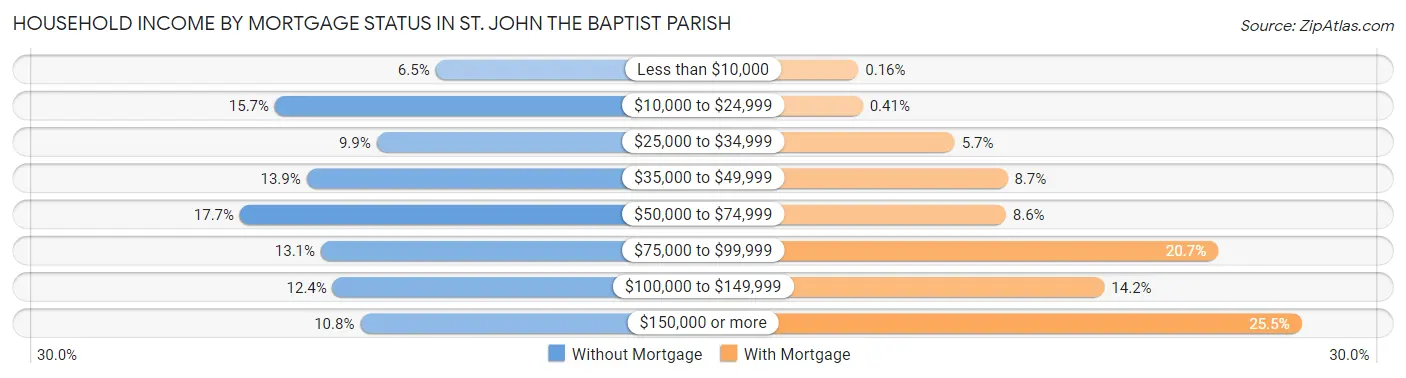
| Household Income | Without Mortgage | With Mortgage |
| Less than $10,000 | 359 (6.5%) | 10 (0.2%) |
| $10,000 to $24,999 | 865 (15.7%) | 26 (0.4%) |
| $25,000 to $34,999 | 545 (9.9%) | 357 (5.7%) |
| $35,000 to $49,999 | 765 (13.9%) | 547 (8.7%) |
| $50,000 to $74,999 | 975 (17.7%) | 541 (8.6%) |
| $75,000 to $99,999 | 720 (13.1%) | 1,305 (20.7%) |
| $100,000 to $149,999 | 683 (12.4%) | 896 (14.2%) |
| $150,000 or more | 596 (10.8%) | 1,605 (25.5%) |
| Total | 5,508 (100.0%) | 6,300 (100.0%) |
Property Value to Household Income Ratio in St. John the Baptist Parish
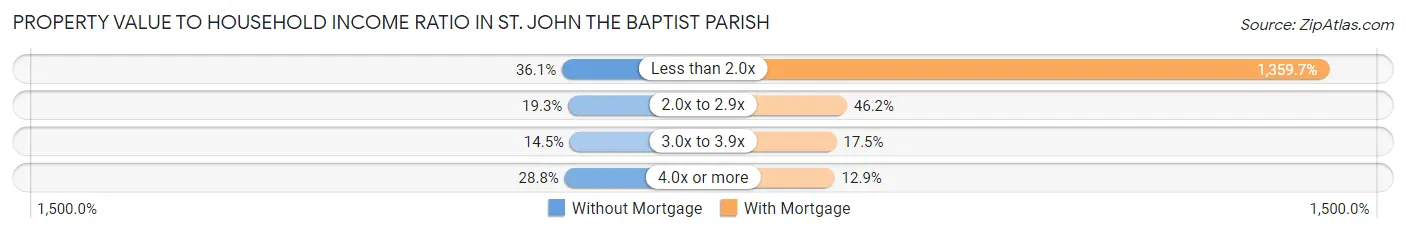
| Value-to-Income Ratio | Without Mortgage | With Mortgage |
| Less than 2.0x | 1,989 (36.1%) | 85,662 (1,359.7%) |
| 2.0x to 2.9x | 1,062 (19.3%) | 2,911 (46.2%) |
| 3.0x to 3.9x | 797 (14.5%) | 1,104 (17.5%) |
| 4.0x or more | 1,586 (28.8%) | 811 (12.9%) |
| Total | 5,508 (100.0%) | 6,300 (100.0%) |
Real Estate Taxes by Mortgage Status in St. John the Baptist Parish
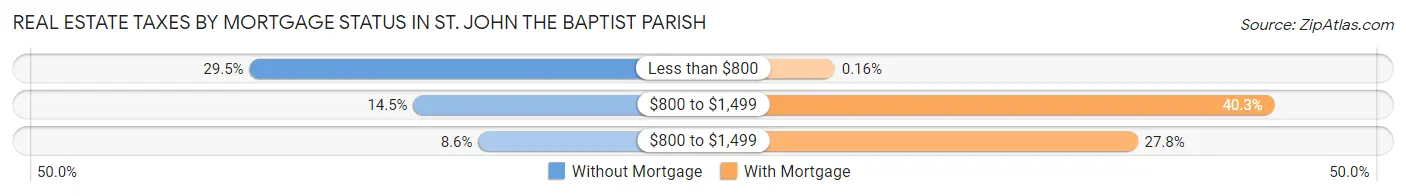
| Property Taxes | Without Mortgage | With Mortgage |
| Less than $800 | 1,623 (29.5%) | 10 (0.2%) |
| $800 to $1,499 | 798 (14.5%) | 2,541 (40.3%) |
| $800 to $1,499 | 472 (8.6%) | 1,752 (27.8%) |
| Total | 5,508 (100.0%) | 6,300 (100.0%) |
Health & Disability in St. John the Baptist Parish
Health Insurance Coverage by Age in St. John the Baptist Parish
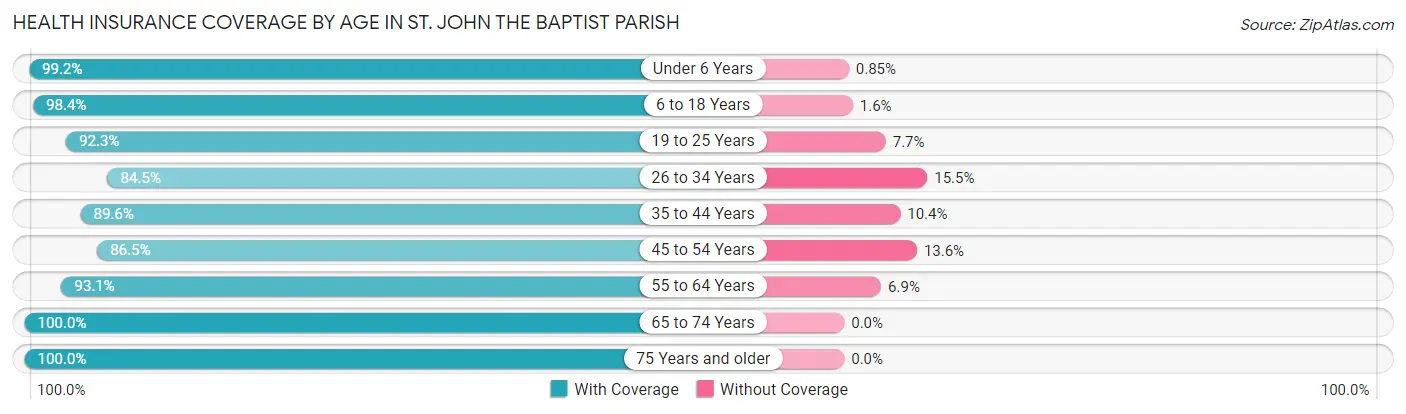
| Age Bracket | With Coverage | Without Coverage |
| Under 6 Years | 3,044 (99.2%) | 26 (0.9%) |
| 6 to 18 Years | 7,508 (98.4%) | 122 (1.6%) |
| 19 to 25 Years | 3,587 (92.3%) | 301 (7.7%) |
| 26 to 34 Years | 4,050 (84.5%) | 742 (15.5%) |
| 35 to 44 Years | 4,434 (89.6%) | 517 (10.4%) |
| 45 to 54 Years | 4,509 (86.5%) | 707 (13.6%) |
| 55 to 64 Years | 5,492 (93.1%) | 405 (6.9%) |
| 65 to 74 Years | 3,975 (100.0%) | 0 (0.0%) |
| 75 Years and older | 2,089 (100.0%) | 0 (0.0%) |
| Total | 38,688 (93.2%) | 2,820 (6.8%) |
Health Insurance Coverage by Citizenship Status in St. John the Baptist Parish
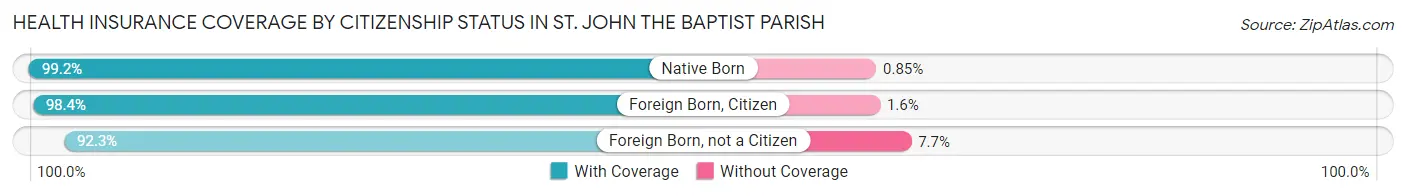
| Citizenship Status | With Coverage | Without Coverage |
| Native Born | 3,044 (99.2%) | 26 (0.9%) |
| Foreign Born, Citizen | 7,508 (98.4%) | 122 (1.6%) |
| Foreign Born, not a Citizen | 3,587 (92.3%) | 301 (7.7%) |
Health Insurance Coverage by Household Income in St. John the Baptist Parish
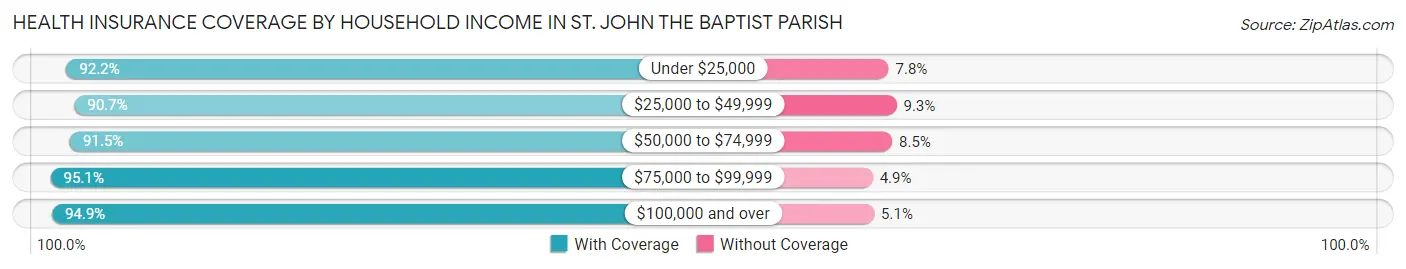
| Household Income | With Coverage | Without Coverage |
| Under $25,000 | 4,882 (92.2%) | 415 (7.8%) |
| $25,000 to $49,999 | 6,419 (90.7%) | 660 (9.3%) |
| $50,000 to $74,999 | 7,349 (91.5%) | 682 (8.5%) |
| $75,000 to $99,999 | 6,913 (95.1%) | 353 (4.9%) |
| $100,000 and over | 13,119 (94.9%) | 709 (5.1%) |
Public vs Private Health Insurance Coverage by Age in St. John the Baptist Parish
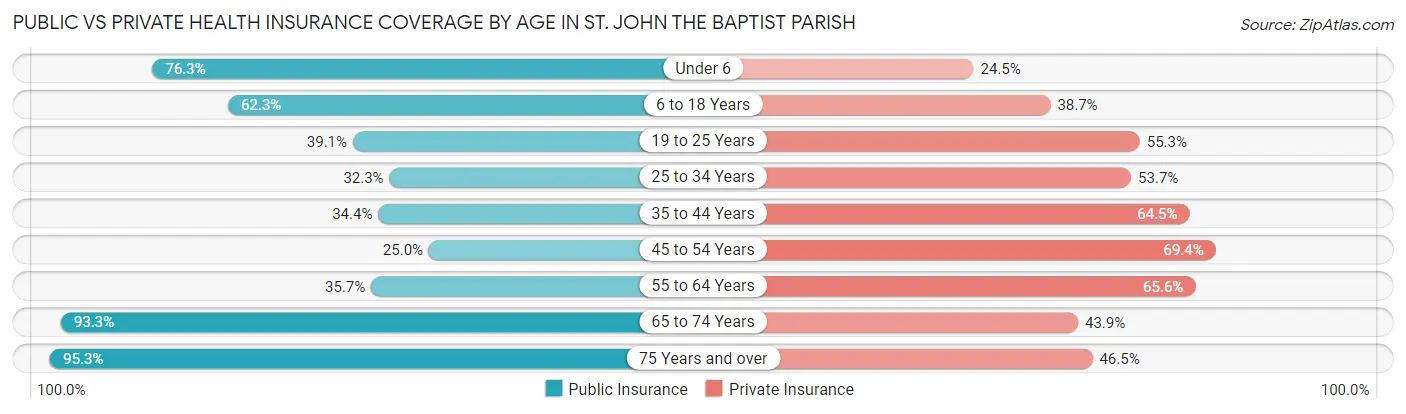
| Age Bracket | Public Insurance | Private Insurance |
| Under 6 | 2,342 (76.3%) | 751 (24.5%) |
| 6 to 18 Years | 4,750 (62.3%) | 2,955 (38.7%) |
| 19 to 25 Years | 1,519 (39.1%) | 2,151 (55.3%) |
| 25 to 34 Years | 1,547 (32.3%) | 2,574 (53.7%) |
| 35 to 44 Years | 1,701 (34.4%) | 3,194 (64.5%) |
| 45 to 54 Years | 1,302 (25.0%) | 3,619 (69.4%) |
| 55 to 64 Years | 2,105 (35.7%) | 3,867 (65.6%) |
| 65 to 74 Years | 3,707 (93.3%) | 1,743 (43.9%) |
| 75 Years and over | 1,990 (95.3%) | 972 (46.5%) |
| Total | 20,963 (50.5%) | 21,826 (52.6%) |
Disability Status by Sex by Age in St. John the Baptist Parish
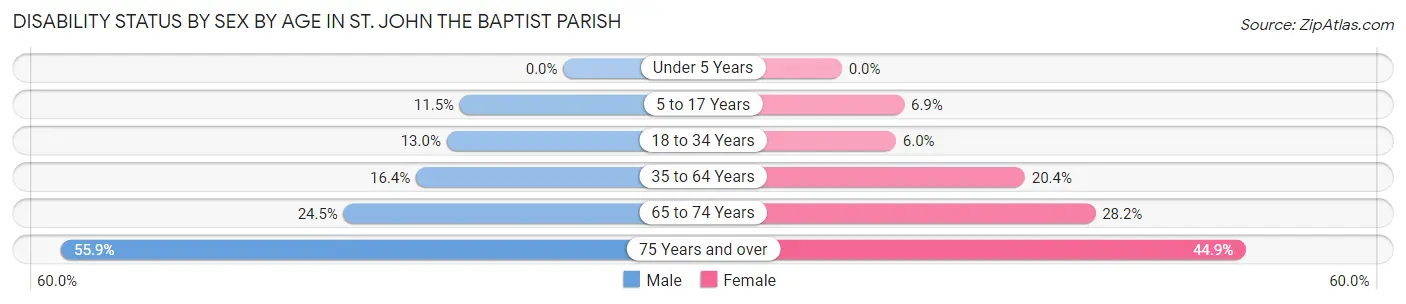
| Age Bracket | Male | Female |
| Under 5 Years | 0 (0.0%) | 0 (0.0%) |
| 5 to 17 Years | 476 (11.5%) | 253 (6.9%) |
| 18 to 34 Years | 580 (13.0%) | 280 (6.0%) |
| 35 to 64 Years | 1,225 (16.4%) | 1,751 (20.4%) |
| 65 to 74 Years | 486 (24.5%) | 561 (28.2%) |
| 75 Years and over | 480 (55.9%) | 553 (44.9%) |
Disability Class by Sex by Age in St. John the Baptist Parish
Disability Class: Hearing Difficulty
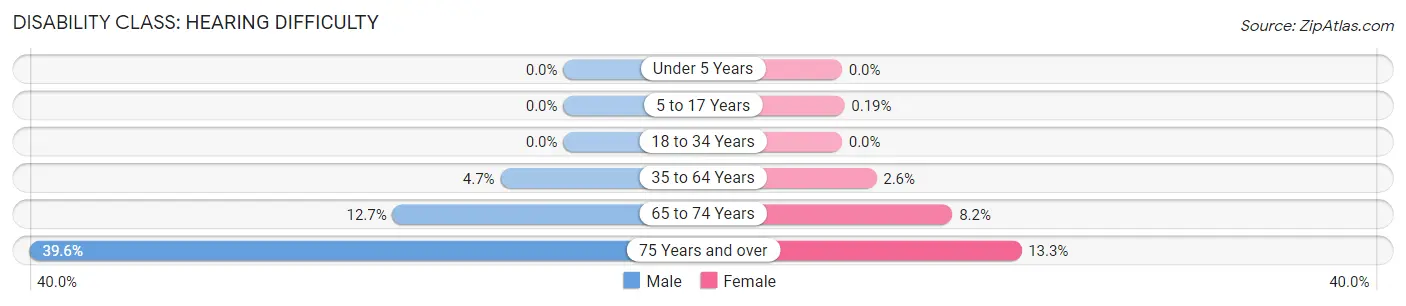
| Age Bracket | Male | Female |
| Under 5 Years | 0 (0.0%) | 0 (0.0%) |
| 5 to 17 Years | 0 (0.0%) | 7 (0.2%) |
| 18 to 34 Years | 0 (0.0%) | 0 (0.0%) |
| 35 to 64 Years | 349 (4.7%) | 220 (2.6%) |
| 65 to 74 Years | 252 (12.7%) | 163 (8.2%) |
| 75 Years and over | 340 (39.6%) | 164 (13.3%) |
Disability Class: Vision Difficulty
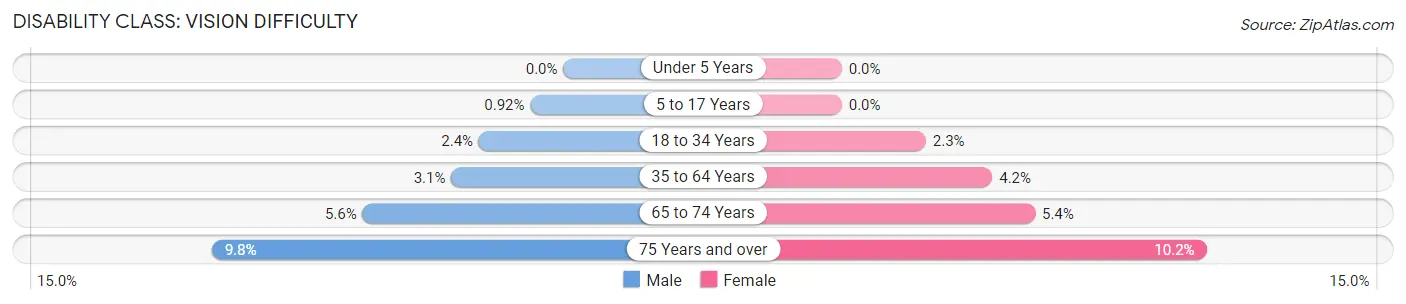
| Age Bracket | Male | Female |
| Under 5 Years | 0 (0.0%) | 0 (0.0%) |
| 5 to 17 Years | 38 (0.9%) | 0 (0.0%) |
| 18 to 34 Years | 105 (2.4%) | 109 (2.3%) |
| 35 to 64 Years | 233 (3.1%) | 360 (4.2%) |
| 65 to 74 Years | 111 (5.6%) | 107 (5.4%) |
| 75 Years and over | 84 (9.8%) | 125 (10.2%) |
Disability Class: Cognitive Difficulty
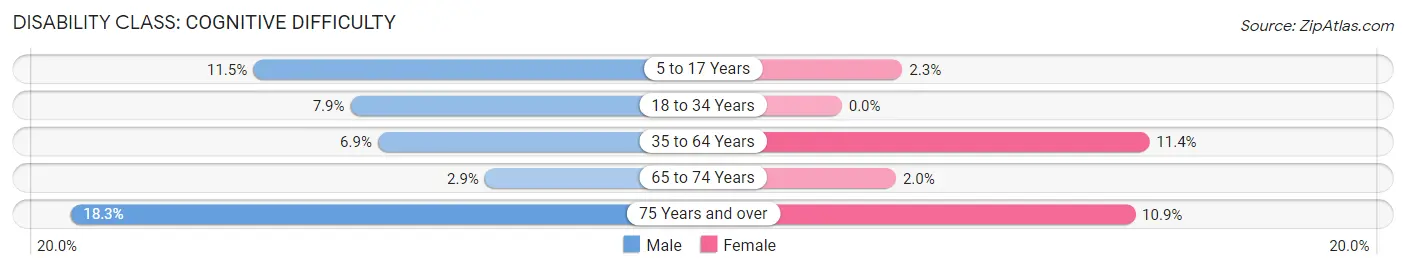
| Age Bracket | Male | Female |
| 5 to 17 Years | 476 (11.5%) | 82 (2.2%) |
| 18 to 34 Years | 353 (7.9%) | 0 (0.0%) |
| 35 to 64 Years | 515 (6.9%) | 981 (11.4%) |
| 65 to 74 Years | 58 (2.9%) | 40 (2.0%) |
| 75 Years and over | 157 (18.3%) | 134 (10.9%) |
Disability Class: Ambulatory Difficulty
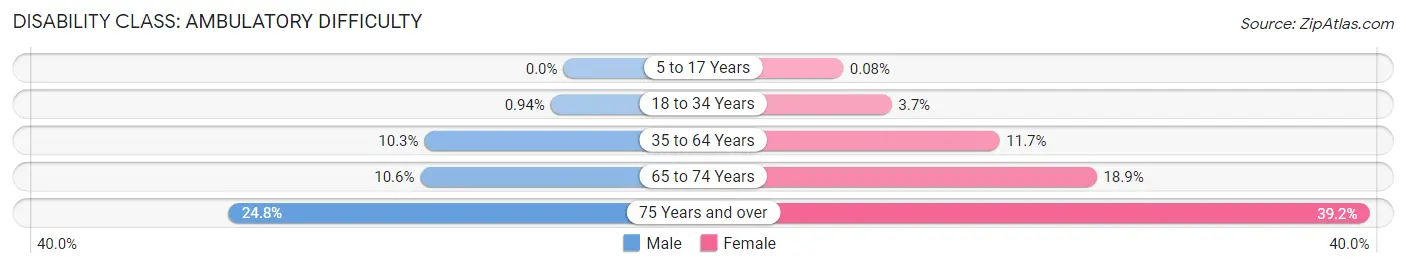
| Age Bracket | Male | Female |
| 5 to 17 Years | 0 (0.0%) | 3 (0.1%) |
| 18 to 34 Years | 42 (0.9%) | 171 (3.7%) |
| 35 to 64 Years | 771 (10.3%) | 1,005 (11.7%) |
| 65 to 74 Years | 211 (10.6%) | 376 (18.9%) |
| 75 Years and over | 213 (24.8%) | 482 (39.2%) |
Disability Class: Self-Care Difficulty
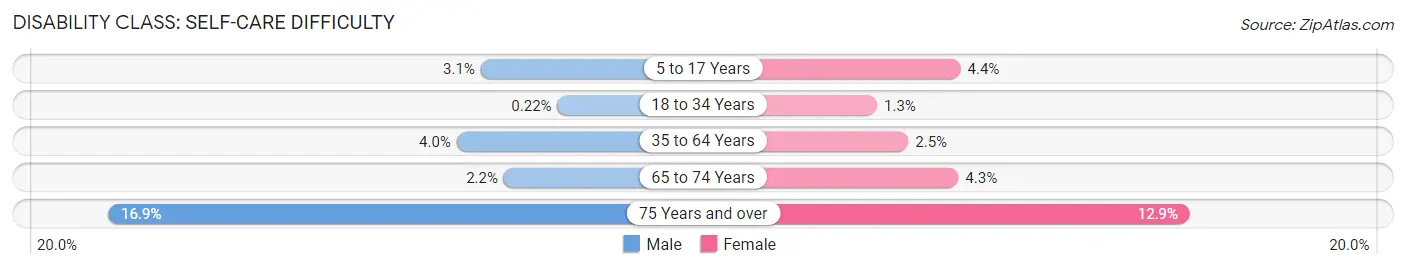
| Age Bracket | Male | Female |
| 5 to 17 Years | 127 (3.1%) | 161 (4.4%) |
| 18 to 34 Years | 10 (0.2%) | 61 (1.3%) |
| 35 to 64 Years | 296 (4.0%) | 212 (2.5%) |
| 65 to 74 Years | 44 (2.2%) | 86 (4.3%) |
| 75 Years and over | 145 (16.9%) | 159 (12.9%) |
Technology Access in St. John the Baptist Parish
Computing Device Access in St. John the Baptist Parish
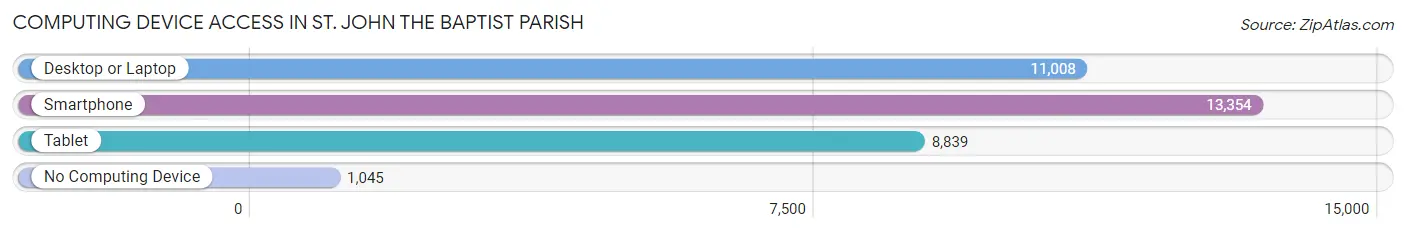
| Device Type | # Households | % Households |
| Desktop or Laptop | 11,008 | 72.3% |
| Smartphone | 13,354 | 87.7% |
| Tablet | 8,839 | 58.0% |
| No Computing Device | 1,045 | 6.9% |
| Total | 15,232 | 100.0% |
Internet Access in St. John the Baptist Parish
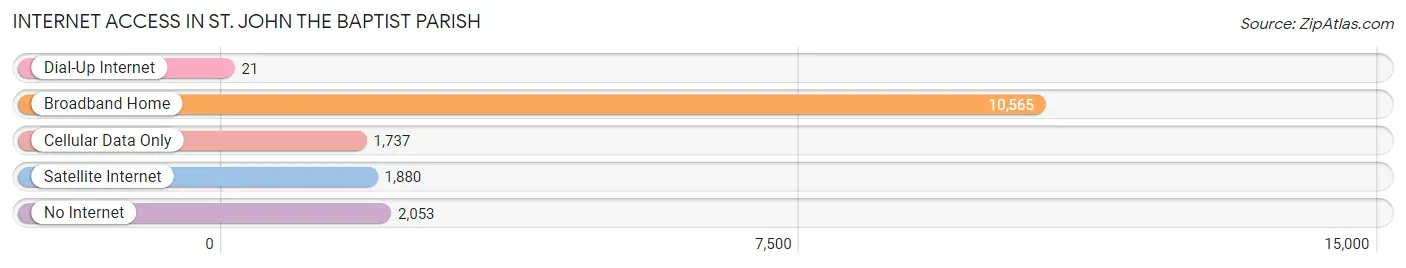
| Internet Type | # Households | % Households |
| Dial-Up Internet | 21 | 0.1% |
| Broadband Home | 10,565 | 69.4% |
| Cellular Data Only | 1,737 | 11.4% |
| Satellite Internet | 1,880 | 12.3% |
| No Internet | 2,053 | 13.5% |
| Total | 15,232 | 100.0% |
St. John the Baptist Parish Summary
St. John the Baptist Parish is a parish located in the state of Louisiana. It is located in the southeastern part of the state, and is bordered by the Mississippi River to the east, the Gulf of Mexico to the south, and the parishes of St. Charles, St. James, and St. Tammany to the north and west. The parish seat is Edgard, and the largest city is LaPlace. As of the 2010 census, the population of St. John the Baptist Parish was 45,924.
History
St. John the Baptist Parish was established in 1807, and is named for the patron saint of the French colony of Louisiana. The parish was originally part of the German Coast, an area of Louisiana that was settled by German immigrants in the early 1700s. The parish was also home to a large number of Acadian refugees who had been expelled from Nova Scotia in the mid-1700s.
The parish was an important center of the sugar cane industry in the 19th century, and the area was heavily developed for sugar plantations. The parish was also home to a large number of African-American slaves who worked on the plantations.
Geography
St. John the Baptist Parish is located in the southeastern part of Louisiana, and is bordered by the Mississippi River to the east, the Gulf of Mexico to the south, and the parishes of St. Charles, St. James, and St. Tammany to the north and west. The parish has a total area of 541 square miles, of which 537 square miles is land and 4 square miles is water.
The parish is located in the Mississippi River Delta region, and is mostly flat and low-lying. The terrain is mostly marshland, with some areas of higher ground. The parish is home to several large lakes, including Lake Pontchartrain, Lake Maurepas, and Lake Salvador.
Economy
St. John the Baptist Parish has a diversified economy, with a mix of manufacturing, retail, and service industries. The parish is home to several large industrial plants, including a chemical plant, a paper mill, and a steel mill. The parish is also home to several large retail stores, including Walmart, Target, and Home Depot.
The parish is also home to several large tourist attractions, including the Jean Lafitte National Historical Park and Preserve, the Louisiana State Museum, and the Audubon Zoo. The parish is also home to several large casinos, including the Boomtown Casino and the Treasure Chest Casino.
Demographics
As of the 2010 census, the population of St. John the Baptist Parish was 45,924, with a population density of 85 people per square mile. The racial makeup of the parish was 68.3% White, 28.2% African American, 0.5% Native American, 0.7% Asian, 0.1% Pacific Islander, 0.7% from other races, and 1.5% from two or more races. Hispanic or Latino of any race were 3.2% of the population.
The median income for a household in the parish was $45,924, and the median income for a family was $54,924. The per capita income for the parish was $20,924. About 15.3% of families and 18.7% of the population were below the poverty line, including 25.3% of those under age 18 and 11.7% of those age 65 or over.
Common Questions
What is the Total Population of St. John the Baptist Parish?
Total Population of St. John the Baptist Parish is 41,986.
What is the Total Male Population of St. John the Baptist Parish?
Total Male Population of St. John the Baptist Parish is 20,563.
What is the Total Female Population of St. John the Baptist Parish?
Total Female Population of St. John the Baptist Parish is 21,423.
What is the Ratio of Males per 100 Females in St. John the Baptist Parish?
There are 95.99 Males per 100 Females in St. John the Baptist Parish.
What is the Ratio of Females per 100 Males in St. John the Baptist Parish?
There are 104.18 Females per 100 Males in St. John the Baptist Parish.
What is the Median Population Age in St. John the Baptist Parish?
Median Population Age in St. John the Baptist Parish is 37.9 Years.
What is the Average Family Size in St. John the Baptist Parish
Average Family Size in St. John the Baptist Parish is 3.3 People.
What is the Average Household Size in St. John the Baptist Parish
Average Household Size in St. John the Baptist Parish is 2.7 People.
What is Per Capita Income in St. John the Baptist Parish?
Per Capita income in St. John the Baptist Parish is $30,643.
What is the Median Family Income in St. John the Baptist Parish?
Median Family Income in St. John the Baptist Parish is $75,517.
What is the Median Household income in St. John the Baptist Parish?
Median Household Income in St. John the Baptist Parish is $65,114.
What is Income or Wage Gap in St. John the Baptist Parish?
Income or Wage Gap in St. John the Baptist Parish is 41.2%.
Women in St. John the Baptist Parish earn 58.8 cents for every dollar earned by a man.
What is Inequality or Gini Index in St. John the Baptist Parish?
Inequality or Gini Index in St. John the Baptist Parish is 0.44.
How Large is the Labor Force in St. John the Baptist Parish?
There are 19,969 People in the Labor Forcein in St. John the Baptist Parish.
What is the Percentage of People in the Labor Force in St. John the Baptist Parish?
60.1% of People are in the Labor Force in St. John the Baptist Parish.
What is the Unemployment Rate in St. John the Baptist Parish?
Unemployment Rate in St. John the Baptist Parish is 9.3%.