St. Helena Parish, LA
St. Helena Parish Map
St. Helena Parish Overview
10,872
TOTAL POPULATION
5,400
MALE POPULATION
5,472
FEMALE POPULATION
98.68
MALES / 100 FEMALES
101.33
FEMALES / 100 MALES
42.2
MEDIAN AGE
3.7
AVG FAMILY SIZE
2.7
AVG HOUSEHOLD SIZE
$24,660
PER CAPITA INCOME
$56,836
AVG FAMILY INCOME
$46,402
AVG HOUSEHOLD INCOME
18.6%
WAGE / INCOME GAP [ % ]
81.4¢/ $1
WAGE / INCOME GAP [ $ ]
0.50
INEQUALITY / GINI INDEX
4,949
LABOR FORCE [ PEOPLE ]
55.8%
PERCENT IN LABOR FORCE
21.5%
UNEMPLOYMENT RATE
St. Helena Parish Area Codes
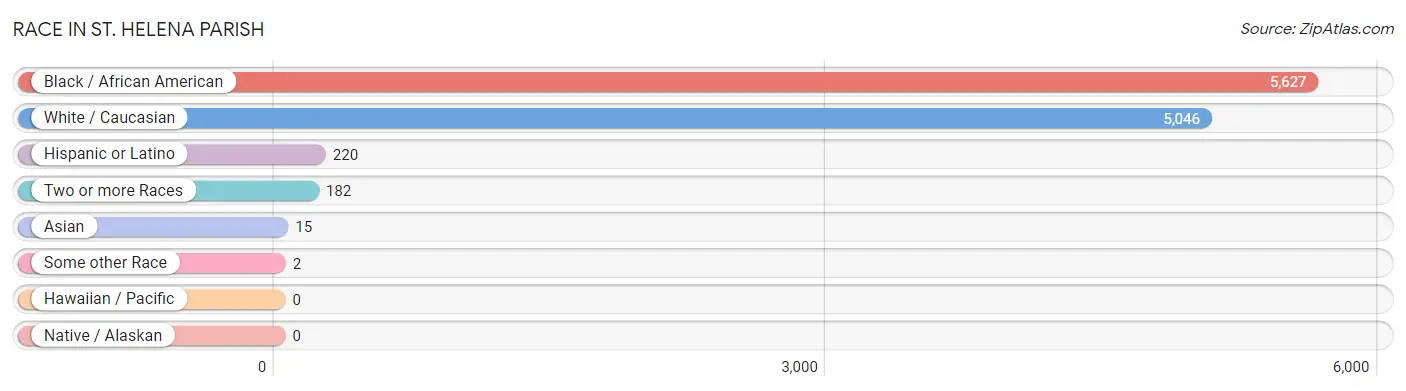
Race in St. Helena Parish
The most populous races in St. Helena Parish are Black / African American (5,627 | 51.8%), White / Caucasian (5,046 | 46.4%), and Hispanic or Latino (220 | 2.0%).
| Race | # Population | % Population |
| Asian | 15 | 0.1% |
| Black / African American | 5,627 | 51.8% |
| Hawaiian / Pacific | 0 | 0.0% |
| Hispanic or Latino | 220 | 2.0% |
| Native / Alaskan | 0 | 0.0% |
| White / Caucasian | 5,046 | 46.4% |
| Two or more Races | 182 | 1.7% |
| Some other Race | 2 | 0.0% |
| Total | 10,872 | 100.0% |
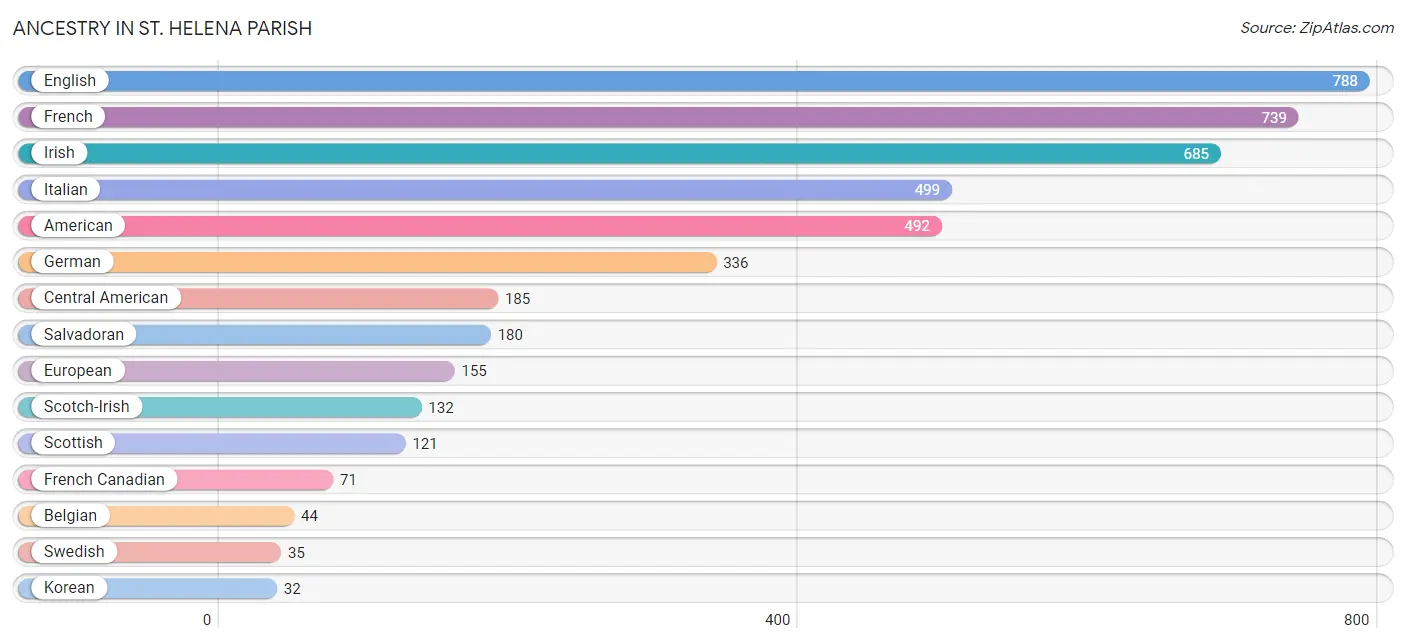
Ancestry in St. Helena Parish
The most populous ancestries reported in St. Helena Parish are English (788 | 7.2%), French (739 | 6.8%), Irish (685 | 6.3%), Italian (499 | 4.6%), and American (492 | 4.5%), together accounting for 29.5% of all St. Helena Parish residents.
| Ancestry | # Population | % Population |
| American | 492 | 4.5% |
| Belgian | 44 | 0.4% |
| British | 8 | 0.1% |
| Central American | 185 | 1.7% |
| Cherokee | 1 | 0.0% |
| Choctaw | 5 | 0.1% |
| Colombian | 4 | 0.0% |
| Costa Rican | 5 | 0.1% |
| English | 788 | 7.2% |
| European | 155 | 1.4% |
| French | 739 | 6.8% |
| French Canadian | 71 | 0.6% |
| German | 336 | 3.1% |
| Indian (Asian) | 15 | 0.1% |
| Irish | 685 | 6.3% |
| Italian | 499 | 4.6% |
| Korean | 32 | 0.3% |
| Mexican | 25 | 0.2% |
| Norwegian | 19 | 0.2% |
| Polish | 10 | 0.1% |
| Salvadoran | 180 | 1.7% |
| Scotch-Irish | 132 | 1.2% |
| Scottish | 121 | 1.1% |
| Serbian | 21 | 0.2% |
| South American | 4 | 0.0% |
| Swedish | 35 | 0.3% | View All 26 Rows |
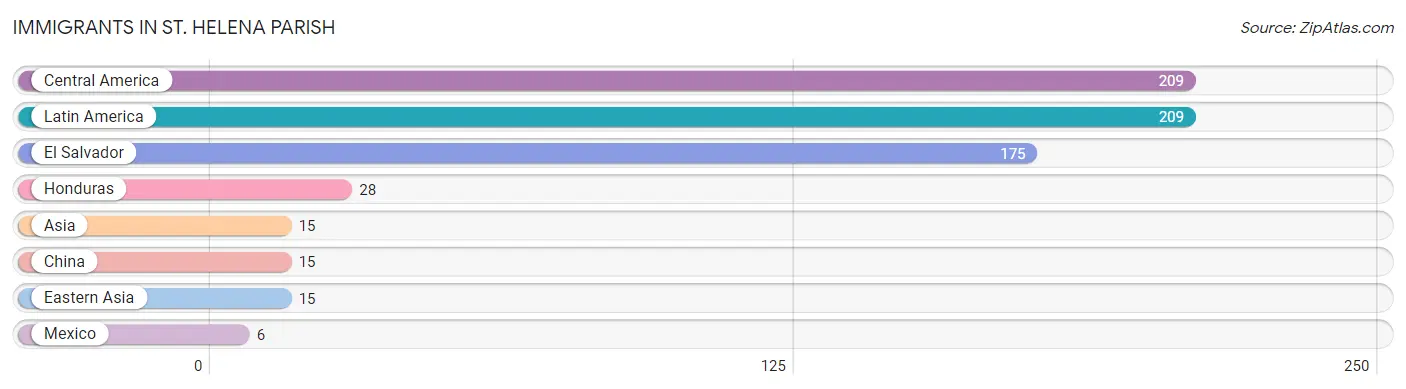
Immigrants in St. Helena Parish
The most numerous immigrant groups reported in St. Helena Parish came from Central America (209 | 1.9%), Latin America (209 | 1.9%), El Salvador (175 | 1.6%), Honduras (28 | 0.3%), and Asia (15 | 0.1%), together accounting for 5.8% of all St. Helena Parish residents.
| Immigration Origin | # Population | % Population |
| Asia | 15 | 0.1% |
| Central America | 209 | 1.9% |
| China | 15 | 0.1% |
| Eastern Asia | 15 | 0.1% |
| El Salvador | 175 | 1.6% |
| Honduras | 28 | 0.3% |
| Latin America | 209 | 1.9% |
| Mexico | 6 | 0.1% | View All 8 Rows |
Sex and Age in St. Helena Parish
Sex and Age in St. Helena Parish
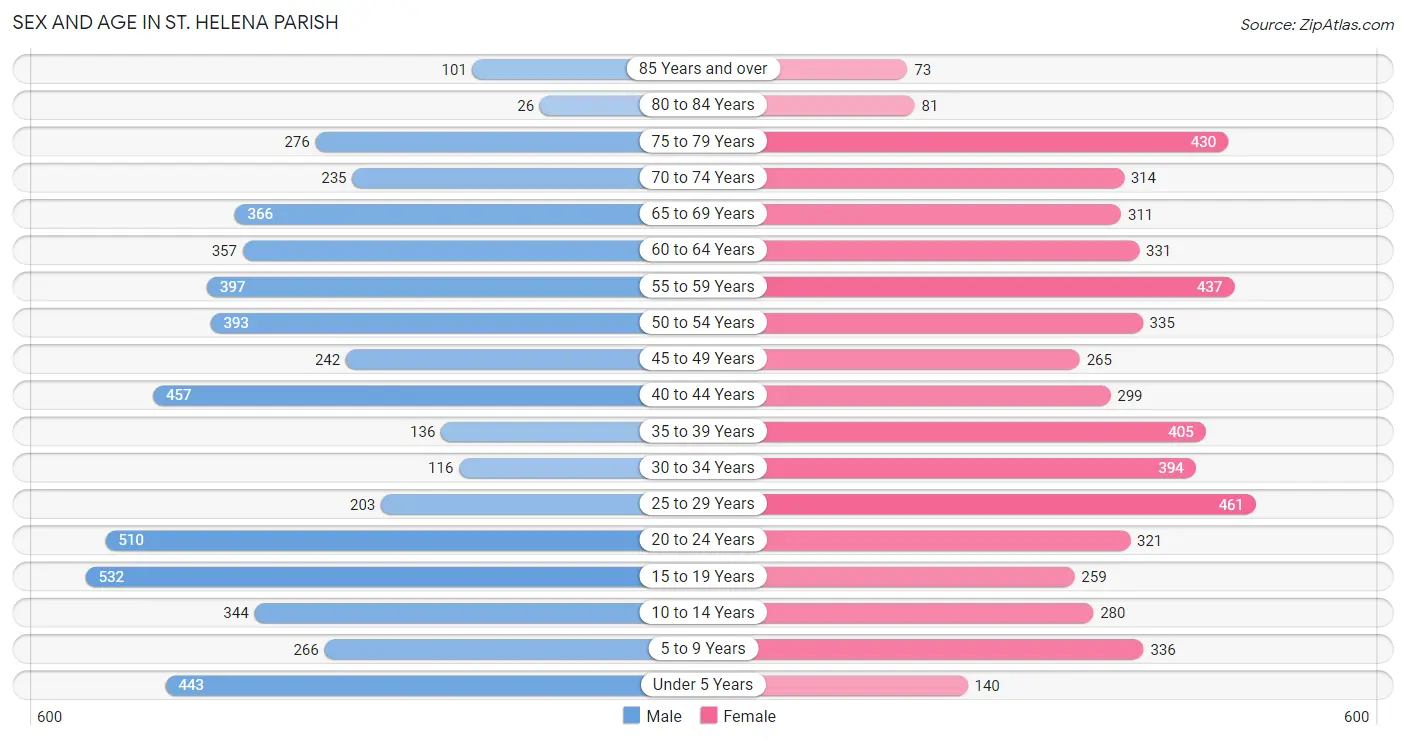
The most populous age groups in St. Helena Parish are 15 to 19 Years (532 | 9.9%) for men and 25 to 29 Years (461 | 8.4%) for women.
| Age Bracket | Male | Female |
| Under 5 Years | 443 (8.2%) | 140 (2.6%) |
| 5 to 9 Years | 266 (4.9%) | 336 (6.1%) |
| 10 to 14 Years | 344 (6.4%) | 280 (5.1%) |
| 15 to 19 Years | 532 (9.9%) | 259 (4.7%) |
| 20 to 24 Years | 510 (9.4%) | 321 (5.9%) |
| 25 to 29 Years | 203 (3.8%) | 461 (8.4%) |
| 30 to 34 Years | 116 (2.1%) | 394 (7.2%) |
| 35 to 39 Years | 136 (2.5%) | 405 (7.4%) |
| 40 to 44 Years | 457 (8.5%) | 299 (5.5%) |
| 45 to 49 Years | 242 (4.5%) | 265 (4.8%) |
| 50 to 54 Years | 393 (7.3%) | 335 (6.1%) |
| 55 to 59 Years | 397 (7.3%) | 437 (8.0%) |
| 60 to 64 Years | 357 (6.6%) | 331 (6.0%) |
| 65 to 69 Years | 366 (6.8%) | 311 (5.7%) |
| 70 to 74 Years | 235 (4.3%) | 314 (5.7%) |
| 75 to 79 Years | 276 (5.1%) | 430 (7.9%) |
| 80 to 84 Years | 26 (0.5%) | 81 (1.5%) |
| 85 Years and over | 101 (1.9%) | 73 (1.3%) |
| Total | 5,400 (100.0%) | 5,472 (100.0%) |
Families and Households in St. Helena Parish
Median Family Size in St. Helena Parish
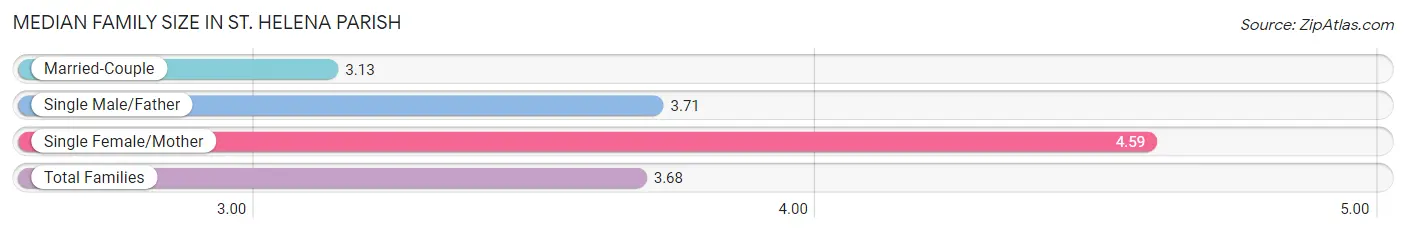
The median family size in St. Helena Parish is 3.68 persons per family, with single female/mother families (861 | 35.7%) accounting for the largest median family size of 4.59 persons per family. On the other hand, married-couple families (1,440 | 59.7%) represent the smallest median family size with 3.13 persons per family.
| Family Type | # Families | Family Size |
| Married-Couple | 1,440 (59.7%) | 3.13 |
| Single Male/Father | 111 (4.6%) | 3.71 |
| Single Female/Mother | 861 (35.7%) | 4.59 |
| Total Families | 2,412 (100.0%) | 3.68 |
Median Household Size in St. Helena Parish
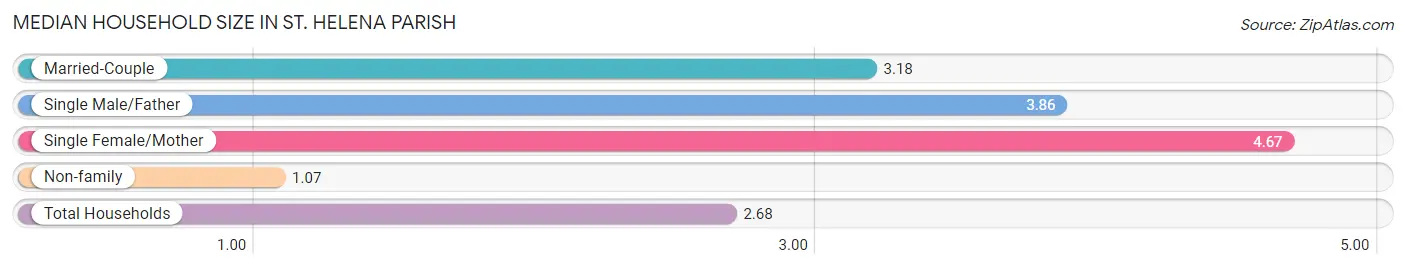
The median household size in St. Helena Parish is 2.68 persons per household, with single female/mother households (861 | 21.5%) accounting for the largest median household size of 4.67 persons per household. non-family households (1,592 | 39.8%) represent the smallest median household size with 1.07 persons per household.
| Household Type | # Households | Household Size |
| Married-Couple | 1,440 (36.0%) | 3.18 |
| Single Male/Father | 111 (2.8%) | 3.86 |
| Single Female/Mother | 861 (21.5%) | 4.67 |
| Non-family | 1,592 (39.8%) | 1.07 |
| Total Households | 4,004 (100.0%) | 2.68 |
Household Size by Marriage Status in St. Helena Parish
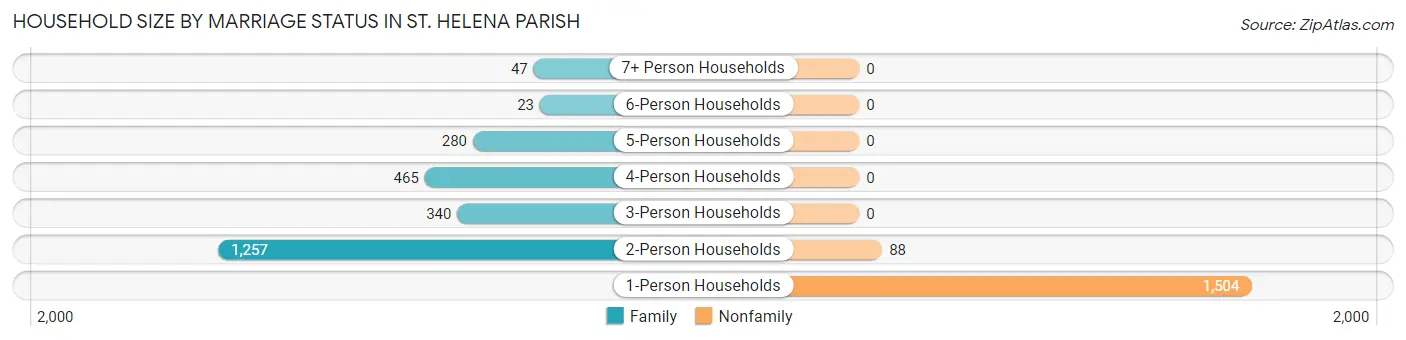
Out of a total of 4,004 households in St. Helena Parish, 2,412 (60.2%) are family households, while 1,592 (39.8%) are nonfamily households. The most numerous type of family households are 2-person households, comprising 1,257, and the most common type of nonfamily households are 1-person households, comprising 1,504.
| Household Size | Family Households | Nonfamily Households |
| 1-Person Households | - | 1,504 (37.6%) |
| 2-Person Households | 1,257 (31.4%) | 88 (2.2%) |
| 3-Person Households | 340 (8.5%) | 0 (0.0%) |
| 4-Person Households | 465 (11.6%) | 0 (0.0%) |
| 5-Person Households | 280 (7.0%) | 0 (0.0%) |
| 6-Person Households | 23 (0.6%) | 0 (0.0%) |
| 7+ Person Households | 47 (1.2%) | 0 (0.0%) |
| Total | 2,412 (60.2%) | 1,592 (39.8%) |
Female Fertility in St. Helena Parish
Fertility by Age in St. Helena Parish
Average fertility rate in St. Helena Parish is 49.0 births per 1,000 women. Women in the age bracket of 20 to 34 years have the highest fertility rate with 81.0 births per 1,000 women. Women in the age bracket of 20 to 34 years acount for 77.2% of all women with births.
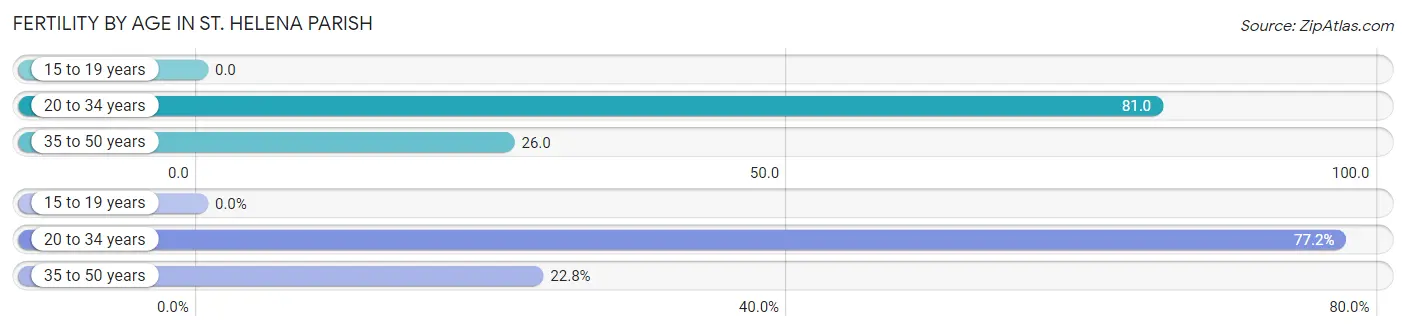
| Age Bracket | Women with Births | Births / 1,000 Women |
| 15 to 19 years | 0 (0.0%) | 0.0 |
| 20 to 34 years | 95 (77.2%) | 81.0 |
| 35 to 50 years | 28 (22.8%) | 26.0 |
| Total | 123 (100.0%) | 49.0 |
Fertility by Age by Marriage Status in St. Helena Parish
43.9% of women with births (123) in St. Helena Parish are married. The highest percentage of unmarried women with births falls into 20 to 34 years age bracket with 72.6% of them unmarried at the time of birth, while the lowest percentage of unmarried women with births belong to 35 to 50 years age bracket with 0.0% of them unmarried.
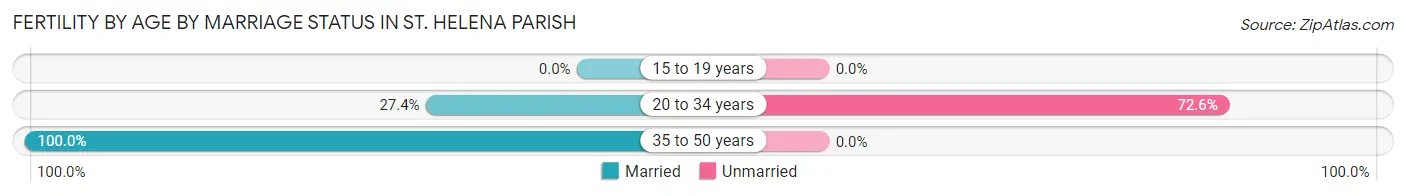
| Age Bracket | Married | Unmarried |
| 15 to 19 years | 0 (0.0%) | 0 (0.0%) |
| 20 to 34 years | 26 (27.4%) | 69 (72.6%) |
| 35 to 50 years | 28 (100.0%) | 0 (0.0%) |
| Total | 54 (43.9%) | 69 (56.1%) |
Fertility by Education in St. Helena Parish
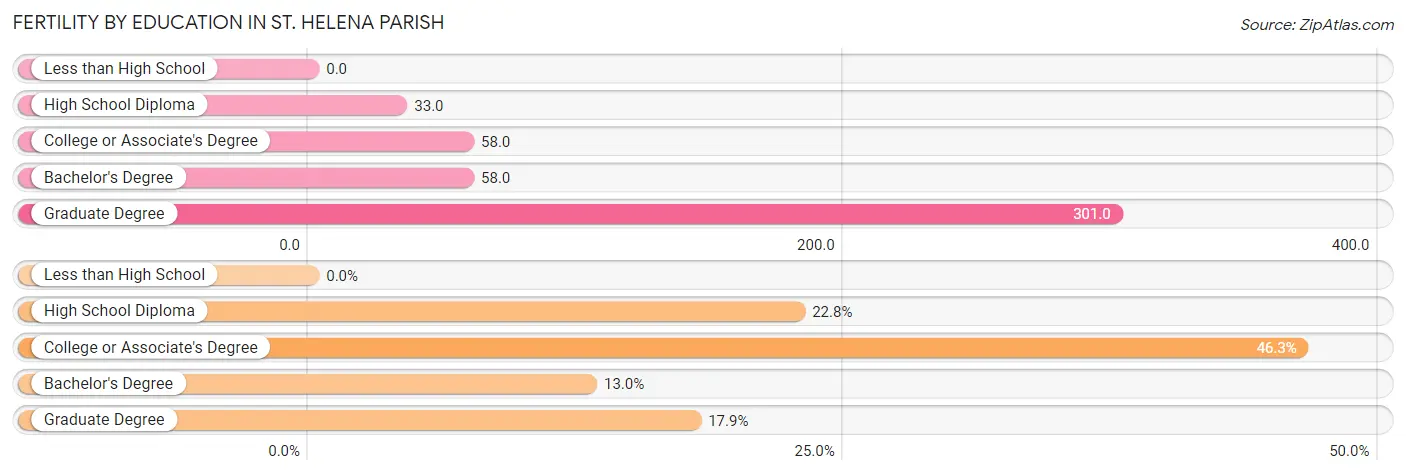
| Educational Attainment | Women with Births | Births / 1,000 Women |
| Less than High School | 0 (0.0%) | 0.0 |
| High School Diploma | 28 (22.8%) | 33.0 |
| College or Associate's Degree | 57 (46.3%) | 58.0 |
| Bachelor's Degree | 16 (13.0%) | 58.0 |
| Graduate Degree | 22 (17.9%) | 301.0 |
| Total | 123 (100.0%) | 49.0 |
Fertility by Education by Marriage Status in St. Helena Parish
56.1% of women with births in St. Helena Parish are unmarried. Women with the educational attainment of high school diploma are most likely to be married with 100.0% of them married at childbirth, while women with the educational attainment of college or associate's degree are least likely to be married with 100.0% of them unmarried at childbirth.
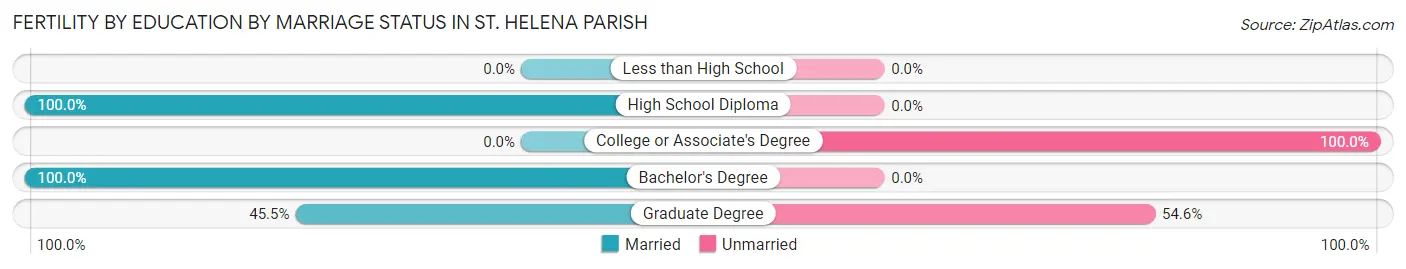
| Educational Attainment | Married | Unmarried |
| Less than High School | 0 (0.0%) | 0 (0.0%) |
| High School Diploma | 28 (100.0%) | 0 (0.0%) |
| College or Associate's Degree | 0 (0.0%) | 57 (100.0%) |
| Bachelor's Degree | 16 (100.0%) | 0 (0.0%) |
| Graduate Degree | 10 (45.5%) | 12 (54.5%) |
| Total | 54 (43.9%) | 69 (56.1%) |
Income in St. Helena Parish
Income Overview in St. Helena Parish
Per Capita Income in St. Helena Parish is $24,660, while median incomes of families and households are $56,836 and $46,402 respectively.
| Characteristic | Number | Measure |
| Per Capita Income | 10,872 | $24,660 |
| Median Family Income | 2,412 | $56,836 |
| Mean Family Income | 2,412 | $76,469 |
| Median Household Income | 4,004 | $46,402 |
| Mean Household Income | 4,004 | $59,719 |
| Income Deficit | 2,412 | $0 |
| Wage / Income Gap (%) | 10,872 | 18.62% |
| Wage / Income Gap ($) | 10,872 | 81.38¢ per $1 |
| Gini / Inequality Index | 10,872 | 0.50 |
Earnings by Sex in St. Helena Parish
Average Earnings in St. Helena Parish are $30,303, $33,872 for men and $27,565 for women, a difference of 18.6%.
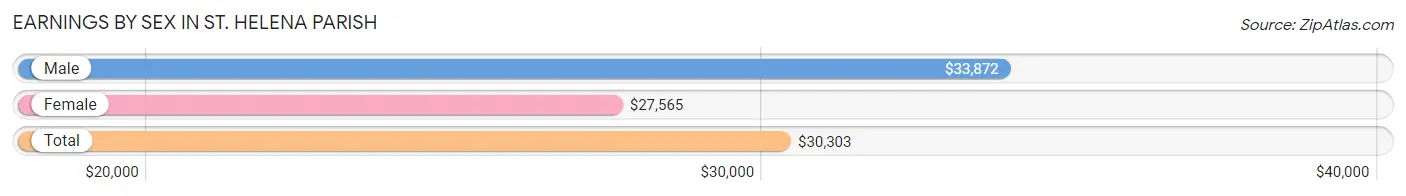
| Sex | Number | Average Earnings |
| Male | 2,392 (49.2%) | $33,872 |
| Female | 2,470 (50.8%) | $27,565 |
| Total | 4,862 (100.0%) | $30,303 |
Earnings by Sex by Income Bracket in St. Helena Parish
The most common earnings brackets in St. Helena Parish are $30,000 to $34,999 for men (319 | 13.3%) and $25,000 to $29,999 for women (328 | 13.3%).
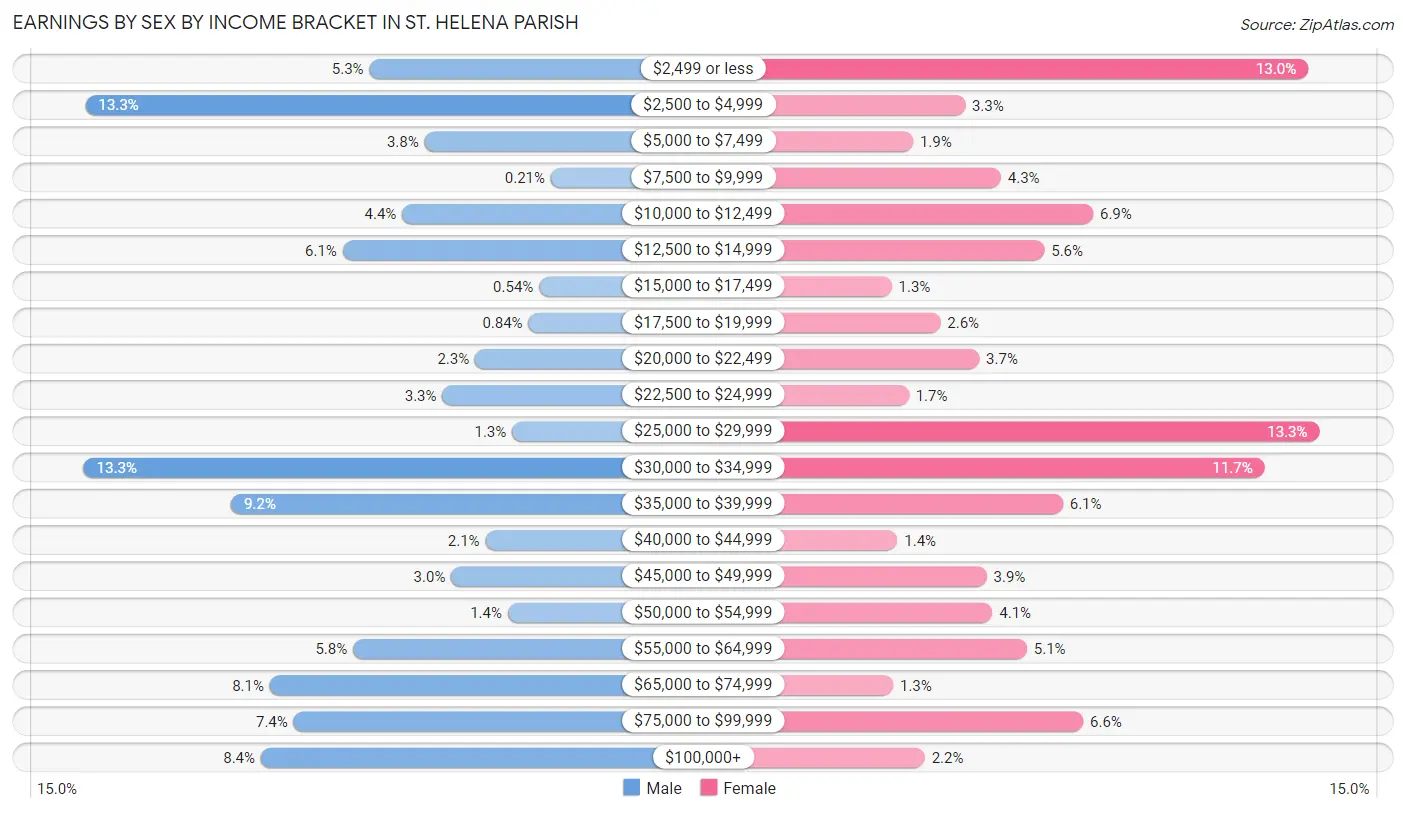
| Income | Male | Female |
| $2,499 or less | 127 (5.3%) | 320 (13.0%) |
| $2,500 to $4,999 | 318 (13.3%) | 82 (3.3%) |
| $5,000 to $7,499 | 90 (3.8%) | 46 (1.9%) |
| $7,500 to $9,999 | 5 (0.2%) | 107 (4.3%) |
| $10,000 to $12,499 | 105 (4.4%) | 171 (6.9%) |
| $12,500 to $14,999 | 145 (6.1%) | 137 (5.6%) |
| $15,000 to $17,499 | 13 (0.5%) | 31 (1.3%) |
| $17,500 to $19,999 | 20 (0.8%) | 65 (2.6%) |
| $20,000 to $22,499 | 56 (2.3%) | 92 (3.7%) |
| $22,500 to $24,999 | 78 (3.3%) | 43 (1.7%) |
| $25,000 to $29,999 | 31 (1.3%) | 328 (13.3%) |
| $30,000 to $34,999 | 319 (13.3%) | 290 (11.7%) |
| $35,000 to $39,999 | 220 (9.2%) | 150 (6.1%) |
| $40,000 to $44,999 | 49 (2.1%) | 35 (1.4%) |
| $45,000 to $49,999 | 72 (3.0%) | 97 (3.9%) |
| $50,000 to $54,999 | 34 (1.4%) | 101 (4.1%) |
| $55,000 to $64,999 | 138 (5.8%) | 125 (5.1%) |
| $65,000 to $74,999 | 194 (8.1%) | 32 (1.3%) |
| $75,000 to $99,999 | 178 (7.4%) | 164 (6.6%) |
| $100,000+ | 200 (8.4%) | 54 (2.2%) |
| Total | 2,392 (100.0%) | 2,470 (100.0%) |
Earnings by Sex by Educational Attainment in St. Helena Parish
Average earnings in St. Helena Parish are $35,511 for men and $28,672 for women, a difference of 19.3%. Men with an educational attainment of college or associate's degree enjoy the highest average annual earnings of $60,855, while those with less than high school education earn the least with $33,457. Women with an educational attainment of bachelor's degree earn the most with the average annual earnings of $79,118, while those with college or associate's degree education have the smallest earnings of $22,759.
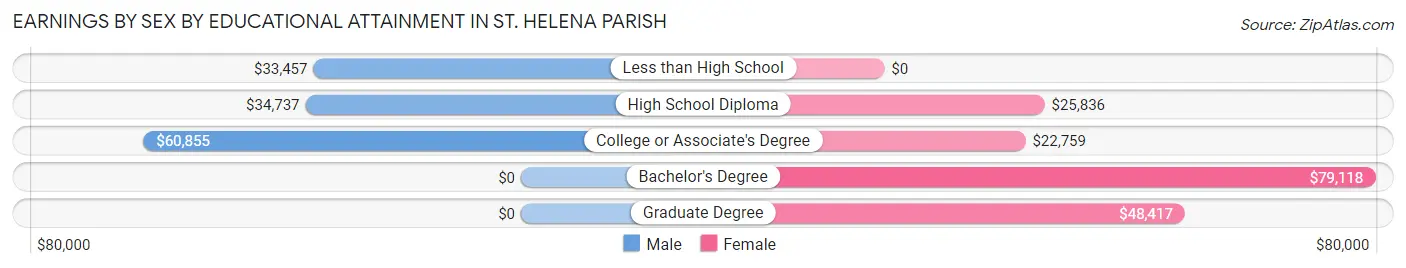
| Educational Attainment | Male Income | Female Income |
| Less than High School | $33,457 | $0 |
| High School Diploma | $34,737 | $25,836 |
| College or Associate's Degree | $60,855 | $22,759 |
| Bachelor's Degree | - | - |
| Graduate Degree | - | - |
| Total | $35,511 | $28,672 |
Family Income in St. Helena Parish
Family Income Brackets in St. Helena Parish
According to the St. Helena Parish family income data, there are 596 families falling into the $50,000 to $74,999 income range, which is the most common income bracket and makes up 24.7% of all families. Conversely, the $25,000 to $34,999 income bracket is the least frequent group with only 41 families (1.7%) belonging to this category.
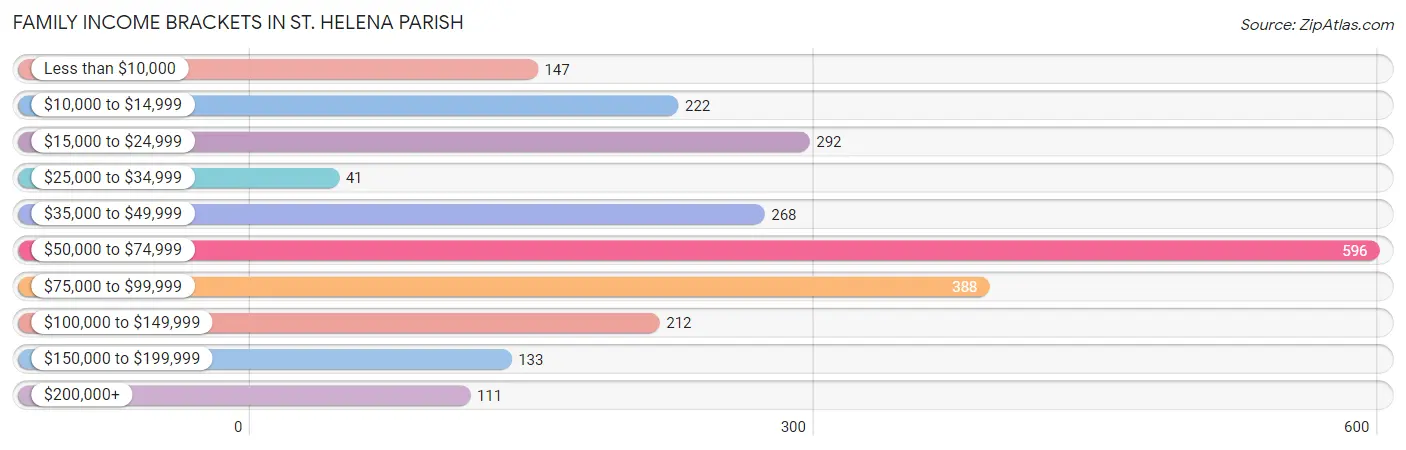
| Income Bracket | # Families | % Families |
| Less than $10,000 | 147 | 6.1% |
| $10,000 to $14,999 | 222 | 9.2% |
| $15,000 to $24,999 | 292 | 12.1% |
| $25,000 to $34,999 | 41 | 1.7% |
| $35,000 to $49,999 | 268 | 11.1% |
| $50,000 to $74,999 | 596 | 24.7% |
| $75,000 to $99,999 | 388 | 16.1% |
| $100,000 to $149,999 | 212 | 8.8% |
| $150,000 to $199,999 | 133 | 5.5% |
| $200,000+ | 111 | 4.6% |
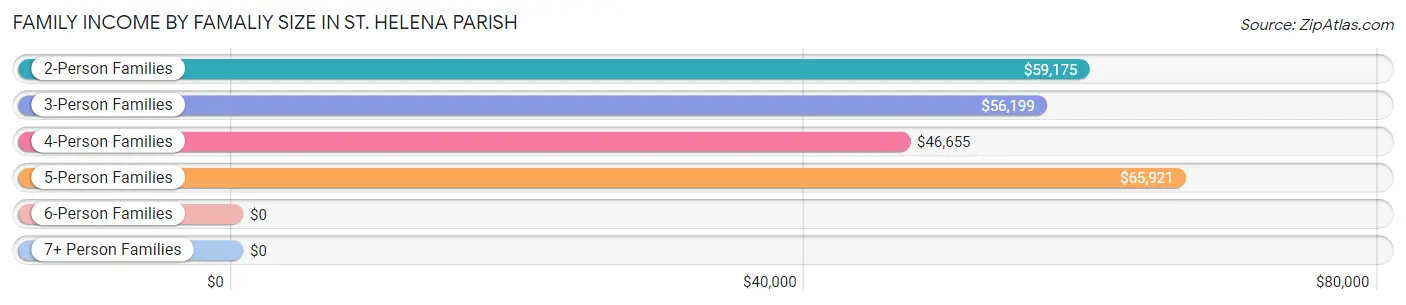
Family Income by Famaliy Size in St. Helena Parish
5-person families (212 | 8.8%) account for the highest median family income in St. Helena Parish with $65,921 per family, while 2-person families (1,271 | 52.7%) have the highest median income of $29,588 per family member.
| Income Bracket | # Families | Median Income |
| 2-Person Families | 1,271 (52.7%) | $59,175 |
| 3-Person Families | 358 (14.8%) | $56,199 |
| 4-Person Families | 501 (20.8%) | $46,655 |
| 5-Person Families | 212 (8.8%) | $65,921 |
| 6-Person Families | 23 (0.9%) | $0 |
| 7+ Person Families | 47 (1.9%) | $0 |
| Total | 2,412 (100.0%) | $56,836 |
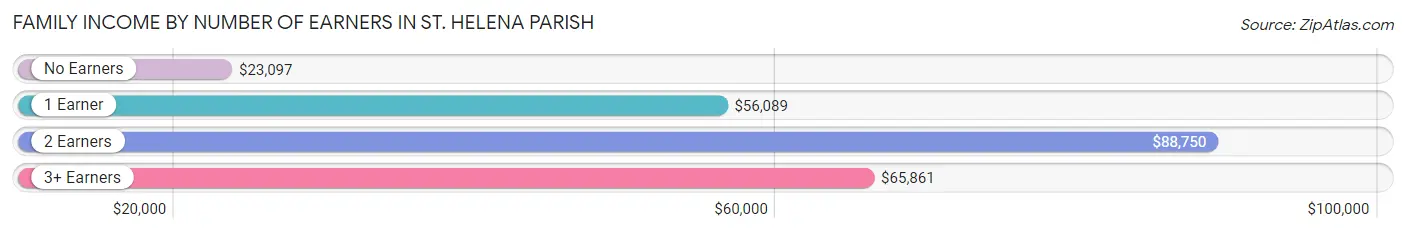
Family Income by Number of Earners in St. Helena Parish
The median family income in St. Helena Parish is $56,836, with families comprising 2 earners (782) having the highest median family income of $88,750, while families with no earners (592) have the lowest median family income of $23,097, accounting for 32.4% and 24.5% of families, respectively.
| Number of Earners | # Families | Median Income |
| No Earners | 592 (24.5%) | $23,097 |
| 1 Earner | 890 (36.9%) | $56,089 |
| 2 Earners | 782 (32.4%) | $88,750 |
| 3+ Earners | 148 (6.1%) | $65,861 |
| Total | 2,412 (100.0%) | $56,836 |
Household Income in St. Helena Parish
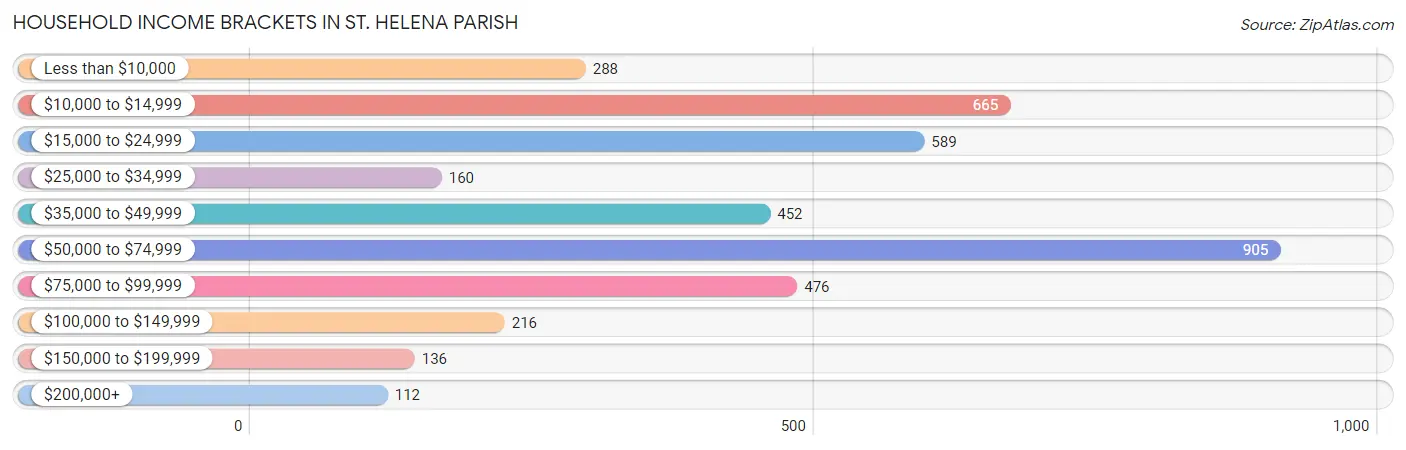
Household Income Brackets in St. Helena Parish
With 905 households falling in the category, the $50,000 to $74,999 income range is the most frequent in St. Helena Parish, accounting for 22.6% of all households. In contrast, only 112 households (2.8%) fall into the $200,000+ income bracket, making it the least populous group.
| Income Bracket | # Households | % Households |
| Less than $10,000 | 288 | 7.2% |
| $10,000 to $14,999 | 665 | 16.6% |
| $15,000 to $24,999 | 589 | 14.7% |
| $25,000 to $34,999 | 160 | 4.0% |
| $35,000 to $49,999 | 452 | 11.3% |
| $50,000 to $74,999 | 905 | 22.6% |
| $75,000 to $99,999 | 476 | 11.9% |
| $100,000 to $149,999 | 216 | 5.4% |
| $150,000 to $199,999 | 136 | 3.4% |
| $200,000+ | 112 | 2.8% |
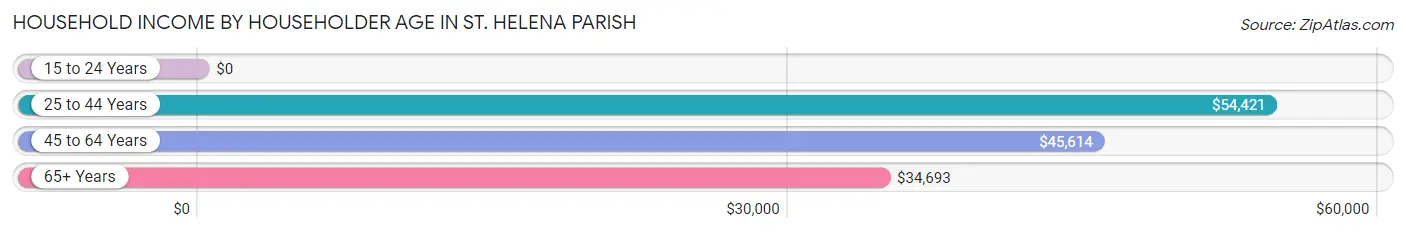
Household Income by Householder Age in St. Helena Parish
The median household income in St. Helena Parish is $46,402, with the highest median household income of $54,421 found in the 25 to 44 years age bracket for the primary householder. A total of 1,115 households (27.9%) fall into this category. Meanwhile, the 15 to 24 years age bracket for the primary householder has the lowest median household income of $0, with 2 households (0.1%) in this group.
| Income Bracket | # Households | Median Income |
| 15 to 24 Years | 2 (0.1%) | $0 |
| 25 to 44 Years | 1,115 (27.9%) | $54,421 |
| 45 to 64 Years | 1,445 (36.1%) | $45,614 |
| 65+ Years | 1,442 (36.0%) | $34,693 |
| Total | 4,004 (100.0%) | $46,402 |
Poverty in St. Helena Parish
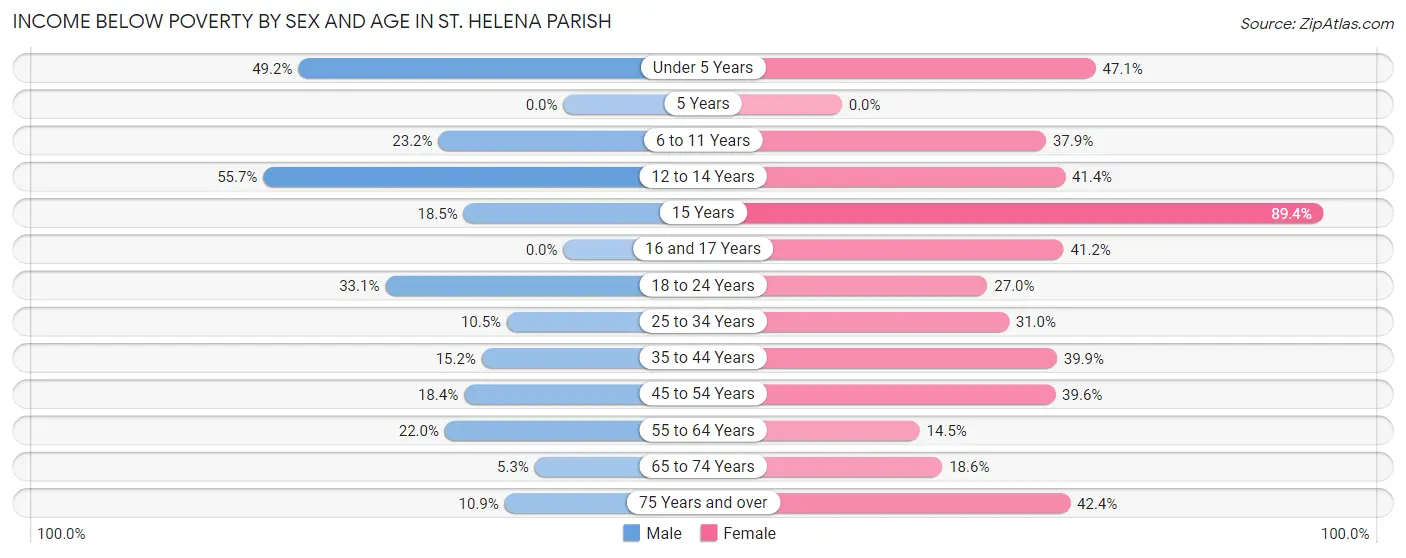
Income Below Poverty by Sex and Age in St. Helena Parish
With 22.3% poverty level for males and 32.5% for females among the residents of St. Helena Parish, 12 to 14 year old males and 15 year old females are the most vulnerable to poverty, with 122 males (55.7%) and 76 females (89.4%) in their respective age groups living below the poverty level.
| Age Bracket | Male | Female |
| Under 5 Years | 218 (49.2%) | 57 (47.1%) |
| 5 Years | 0 (0.0%) | 0 (0.0%) |
| 6 to 11 Years | 71 (23.2%) | 130 (37.9%) |
| 12 to 14 Years | 122 (55.7%) | 99 (41.4%) |
| 15 Years | 20 (18.5%) | 76 (89.4%) |
| 16 and 17 Years | 0 (0.0%) | 56 (41.2%) |
| 18 to 24 Years | 278 (33.1%) | 97 (27.0%) |
| 25 to 34 Years | 31 (10.5%) | 265 (31.0%) |
| 35 to 44 Years | 89 (15.2%) | 281 (39.9%) |
| 45 to 54 Years | 111 (18.4%) | 236 (39.6%) |
| 55 to 64 Years | 163 (22.0%) | 111 (14.4%) |
| 65 to 74 Years | 31 (5.3%) | 115 (18.6%) |
| 75 Years and over | 43 (10.9%) | 242 (42.4%) |
| Total | 1,177 (22.3%) | 1,765 (32.5%) |
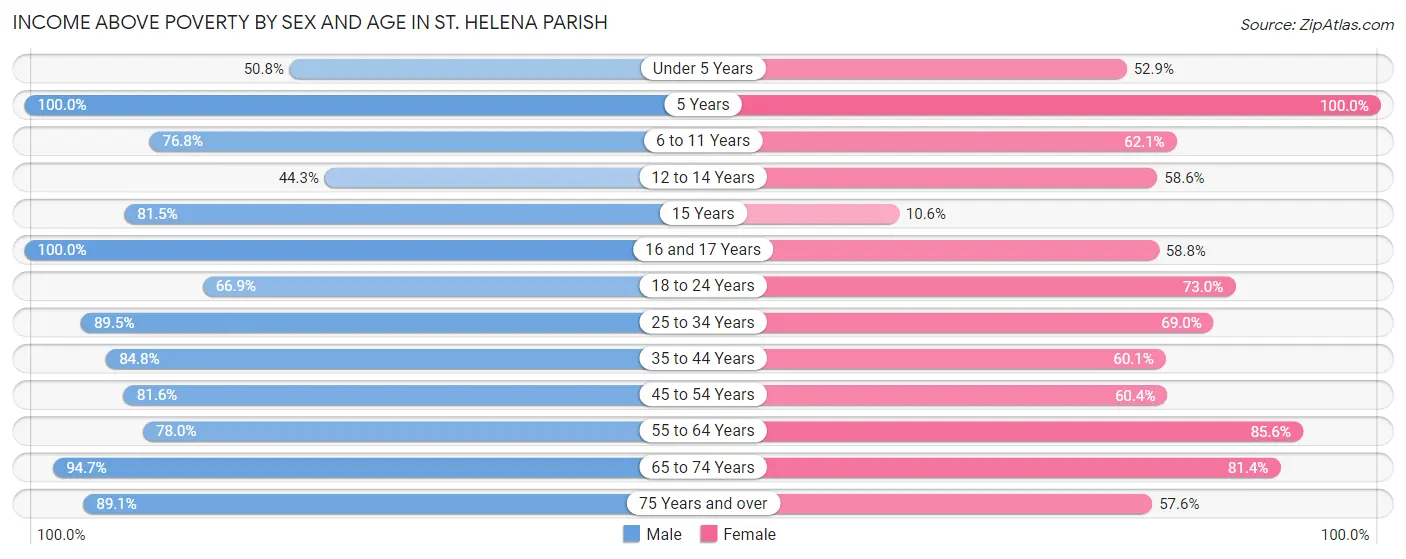
Income Above Poverty by Sex and Age in St. Helena Parish
According to the poverty statistics in St. Helena Parish, males aged 5 years and females aged 5 years are the age groups that are most secure financially, with 100.0% of males and 100.0% of females in these age groups living above the poverty line.
| Age Bracket | Male | Female |
| Under 5 Years | 225 (50.8%) | 64 (52.9%) |
| 5 Years | 85 (100.0%) | 34 (100.0%) |
| 6 to 11 Years | 235 (76.8%) | 213 (62.1%) |
| 12 to 14 Years | 97 (44.3%) | 140 (58.6%) |
| 15 Years | 88 (81.5%) | 9 (10.6%) |
| 16 and 17 Years | 82 (100.0%) | 80 (58.8%) |
| 18 to 24 Years | 563 (66.9%) | 262 (73.0%) |
| 25 to 34 Years | 265 (89.5%) | 590 (69.0%) |
| 35 to 44 Years | 498 (84.8%) | 423 (60.1%) |
| 45 to 54 Years | 491 (81.6%) | 360 (60.4%) |
| 55 to 64 Years | 578 (78.0%) | 657 (85.6%) |
| 65 to 74 Years | 552 (94.7%) | 502 (81.4%) |
| 75 Years and over | 351 (89.1%) | 329 (57.6%) |
| Total | 4,110 (77.7%) | 3,663 (67.5%) |
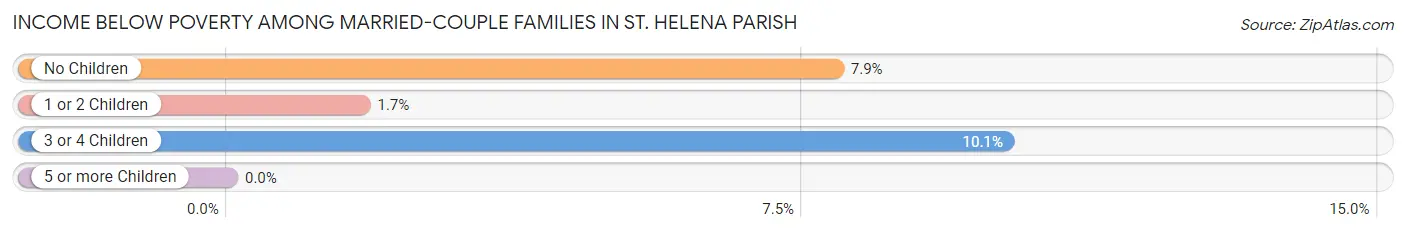
Income Below Poverty Among Married-Couple Families in St. Helena Parish
The poverty statistics for married-couple families in St. Helena Parish show that 6.5% or 93 of the total 1,440 families live below the poverty line. Families with 3 or 4 children have the highest poverty rate of 10.1%, comprising of 7 families. On the other hand, families with 5 or more children have the lowest poverty rate of 0.0%, which includes 0 families.
| Children | Above Poverty | Below Poverty |
| No Children | 931 (92.1%) | 80 (7.9%) |
| 1 or 2 Children | 340 (98.3%) | 6 (1.7%) |
| 3 or 4 Children | 62 (89.9%) | 7 (10.1%) |
| 5 or more Children | 14 (100.0%) | 0 (0.0%) |
| Total | 1,347 (93.5%) | 93 (6.5%) |
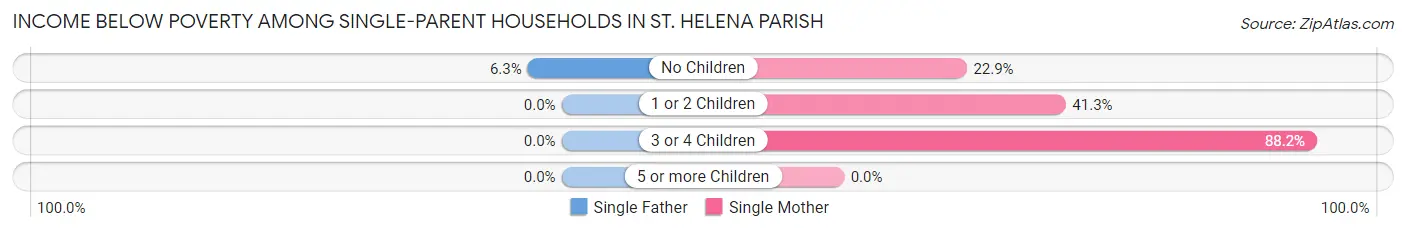
Income Below Poverty Among Single-Parent Households in St. Helena Parish
According to the poverty data in St. Helena Parish, 5.4% or 6 single-father households and 51.2% or 441 single-mother households are living below the poverty line. Among single-father households, those with no children have the highest poverty rate, with 6 households (6.3%) experiencing poverty. Likewise, among single-mother households, those with 3 or 4 children have the highest poverty rate, with 238 households (88.1%) falling below the poverty line.
| Children | Single Father | Single Mother |
| No Children | 6 (6.3%) | 51 (22.9%) |
| 1 or 2 Children | 0 (0.0%) | 152 (41.3%) |
| 3 or 4 Children | 0 (0.0%) | 238 (88.1%) |
| 5 or more Children | 0 (0.0%) | 0 (0.0%) |
| Total | 6 (5.4%) | 441 (51.2%) |
Income Below Poverty Among Married-Couple vs Single-Parent Households in St. Helena Parish
The poverty data for St. Helena Parish shows that 93 of the married-couple family households (6.5%) and 447 of the single-parent households (46.0%) are living below the poverty level. Within the married-couple family households, those with 3 or 4 children have the highest poverty rate, with 7 households (10.1%) falling below the poverty line. Among the single-parent households, those with 3 or 4 children have the highest poverty rate, with 238 household (83.2%) living below poverty.
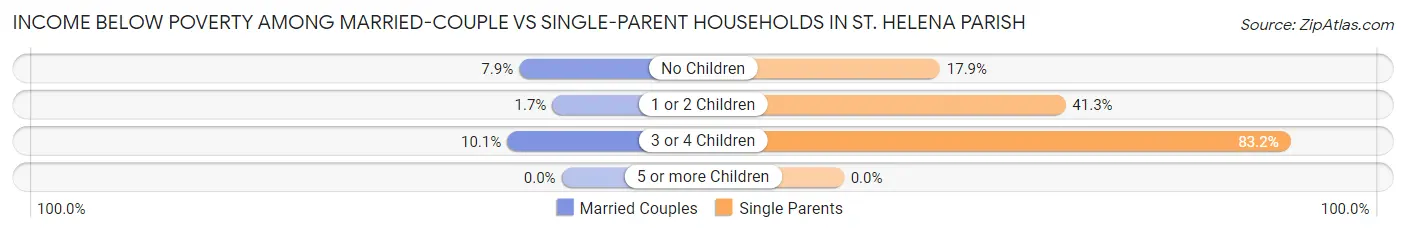
| Children | Married-Couple Families | Single-Parent Households |
| No Children | 80 (7.9%) | 57 (17.9%) |
| 1 or 2 Children | 6 (1.7%) | 152 (41.3%) |
| 3 or 4 Children | 7 (10.1%) | 238 (83.2%) |
| 5 or more Children | 0 (0.0%) | 0 (0.0%) |
| Total | 93 (6.5%) | 447 (46.0%) |
Employment Characteristics in St. Helena Parish
Employment by Class of Employer in St. Helena Parish
Among the 3,668 employed individuals in St. Helena Parish, private company employees (2,301 | 62.7%), state government employees (461 | 12.6%), and not-for-profit organizations (315 | 8.6%) make up the most common classes of employment.
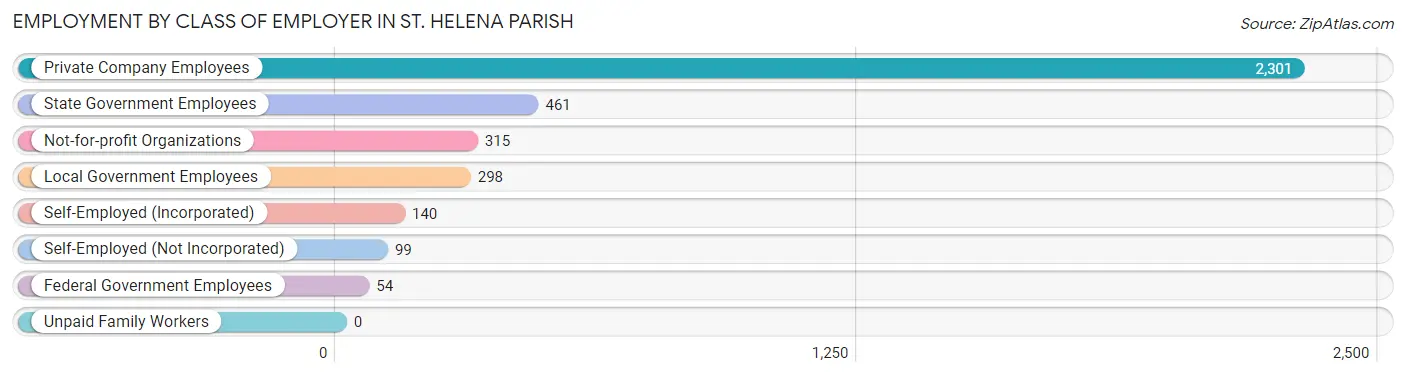
| Employer Class | # Employees | % Employees |
| Private Company Employees | 2,301 | 62.7% |
| Self-Employed (Incorporated) | 140 | 3.8% |
| Self-Employed (Not Incorporated) | 99 | 2.7% |
| Not-for-profit Organizations | 315 | 8.6% |
| Local Government Employees | 298 | 8.1% |
| State Government Employees | 461 | 12.6% |
| Federal Government Employees | 54 | 1.5% |
| Unpaid Family Workers | 0 | 0.0% |
| Total | 3,668 | 100.0% |
Employment Status by Age in St. Helena Parish
According to the labor force statistics for St. Helena Parish, out of the total population over 16 years of age (8,870), 55.8% or 4,949 individuals are in the labor force, with 21.5% or 1,064 of them unemployed. The age group with the highest labor force participation rate is 35 to 44 years, with 90.2% or 1,170 individuals in the labor force. Within the labor force, the 65 to 74 years age range has the highest percentage of unemployed individuals, with 68.1% or 173 of them being unemployed.
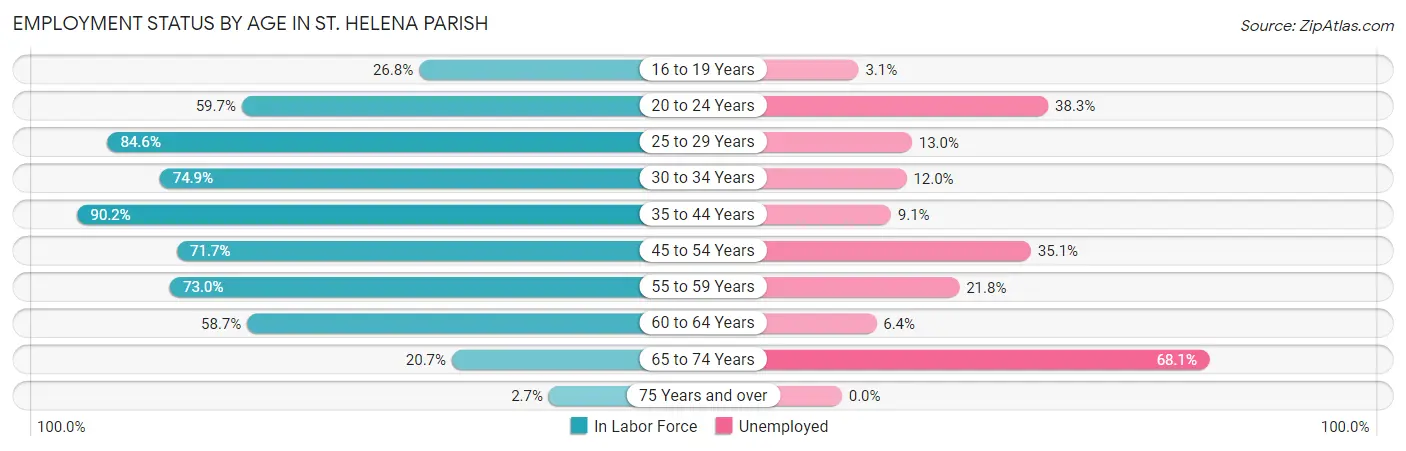
| Age Bracket | In Labor Force | Unemployed |
| 16 to 19 Years | 160 (26.8%) | 5 (3.1%) |
| 20 to 24 Years | 496 (59.7%) | 190 (38.3%) |
| 25 to 29 Years | 562 (84.6%) | 73 (13.0%) |
| 30 to 34 Years | 382 (74.9%) | 46 (12.0%) |
| 35 to 44 Years | 1,170 (90.2%) | 106 (9.1%) |
| 45 to 54 Years | 885 (71.7%) | 311 (35.1%) |
| 55 to 59 Years | 609 (73.0%) | 133 (21.8%) |
| 60 to 64 Years | 404 (58.7%) | 26 (6.4%) |
| 65 to 74 Years | 254 (20.7%) | 173 (68.1%) |
| 75 Years and over | 27 (2.7%) | 0 (0.0%) |
| Total | 4,949 (55.8%) | 1,064 (21.5%) |
Employment Status by Educational Attainment in St. Helena Parish
According to labor force statistics for St. Helena Parish, 76.8% of individuals (4,015) out of the total population between 25 and 64 years of age (5,228) are in the labor force, with 17.3% or 695 of them being unemployed. The group with the highest labor force participation rate are those with the educational attainment of college / associate degree, with 82.1% or 989 individuals in the labor force. Within the labor force, individuals with less than high school education have the highest percentage of unemployment, with 44.6% or 274 of them being unemployed.
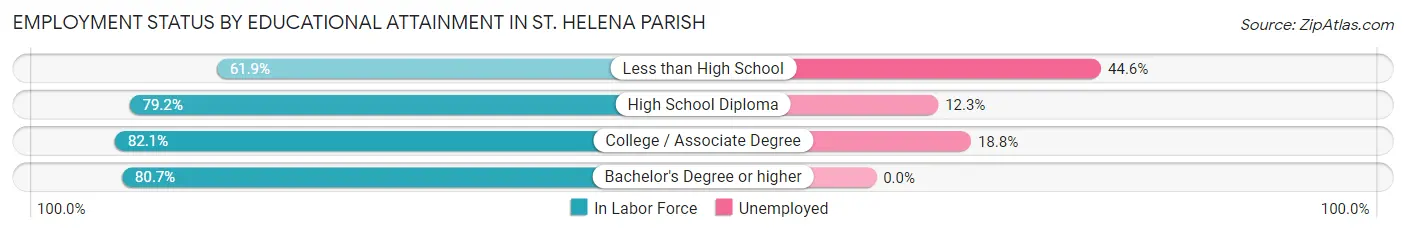
| Educational Attainment | In Labor Force | Unemployed |
| Less than High School | 615 (61.9%) | 443 (44.6%) |
| High School Diploma | 1,910 (79.2%) | 297 (12.3%) |
| College / Associate Degree | 989 (82.1%) | 227 (18.8%) |
| Bachelor's Degree or higher | 498 (80.7%) | 0 (0.0%) |
| Total | 4,015 (76.8%) | 904 (17.3%) |
Employment Occupations by Sex in St. Helena Parish
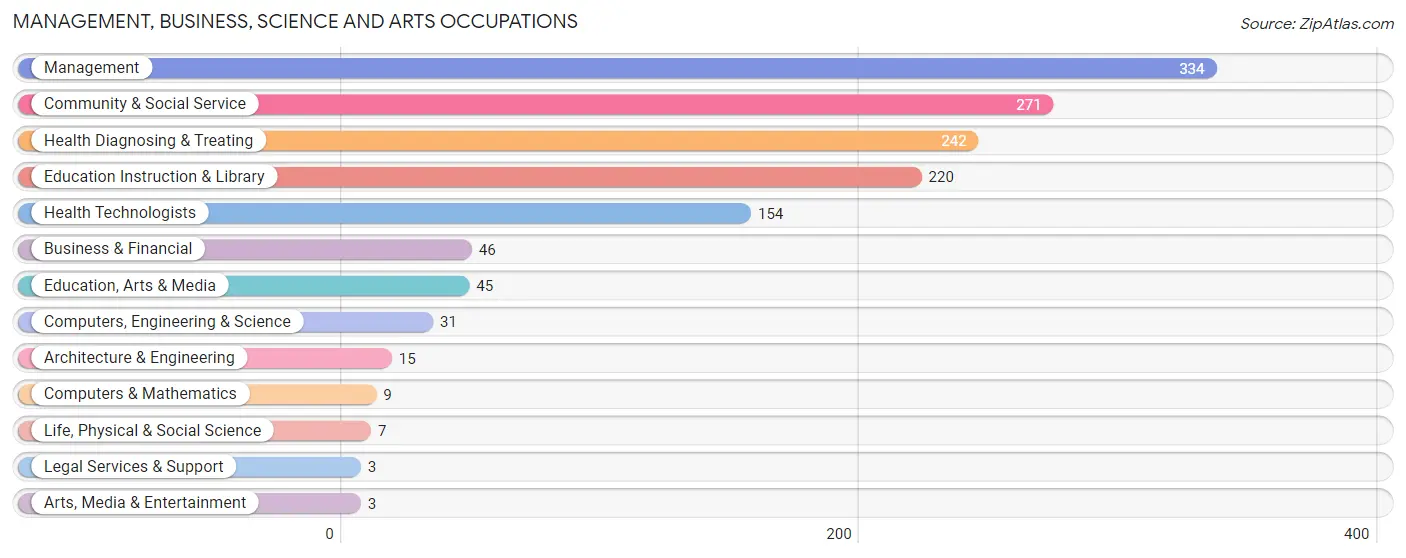
Management, Business, Science and Arts Occupations
The most common Management, Business, Science and Arts occupations in St. Helena Parish are Management (334 | 8.6%), Community & Social Service (271 | 7.0%), Health Diagnosing & Treating (242 | 6.2%), Education Instruction & Library (220 | 5.7%), and Health Technologists (154 | 4.0%).
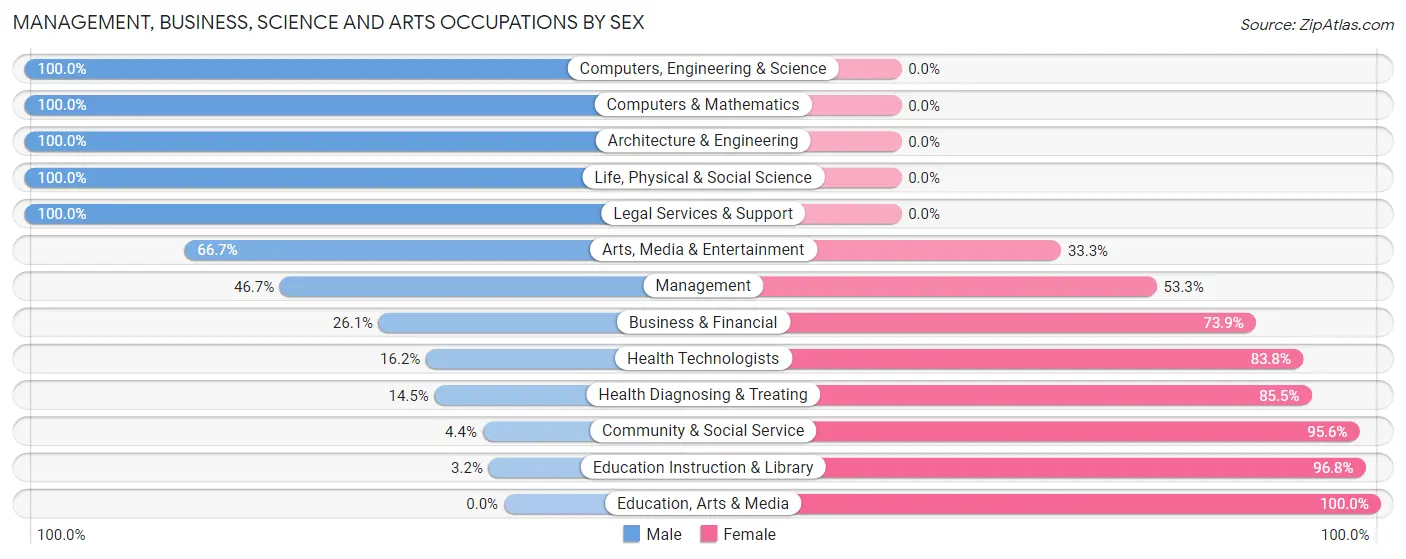
Management, Business, Science and Arts Occupations by Sex
Within the Management, Business, Science and Arts occupations in St. Helena Parish, the most male-oriented occupations are Computers, Engineering & Science (100.0%), Computers & Mathematics (100.0%), and Architecture & Engineering (100.0%), while the most female-oriented occupations are Education, Arts & Media (100.0%), Education Instruction & Library (96.8%), and Community & Social Service (95.6%).
| Occupation | Male | Female |
| Management | 156 (46.7%) | 178 (53.3%) |
| Business & Financial | 12 (26.1%) | 34 (73.9%) |
| Computers, Engineering & Science | 31 (100.0%) | 0 (0.0%) |
| Computers & Mathematics | 9 (100.0%) | 0 (0.0%) |
| Architecture & Engineering | 15 (100.0%) | 0 (0.0%) |
| Life, Physical & Social Science | 7 (100.0%) | 0 (0.0%) |
| Community & Social Service | 12 (4.4%) | 259 (95.6%) |
| Education, Arts & Media | 0 (0.0%) | 45 (100.0%) |
| Legal Services & Support | 3 (100.0%) | 0 (0.0%) |
| Education Instruction & Library | 7 (3.2%) | 213 (96.8%) |
| Arts, Media & Entertainment | 2 (66.7%) | 1 (33.3%) |
| Health Diagnosing & Treating | 35 (14.5%) | 207 (85.5%) |
| Health Technologists | 25 (16.2%) | 129 (83.8%) |
| Total (Category) | 246 (26.6%) | 678 (73.4%) |
| Total (Overall) | 1,805 (46.5%) | 2,081 (53.5%) |
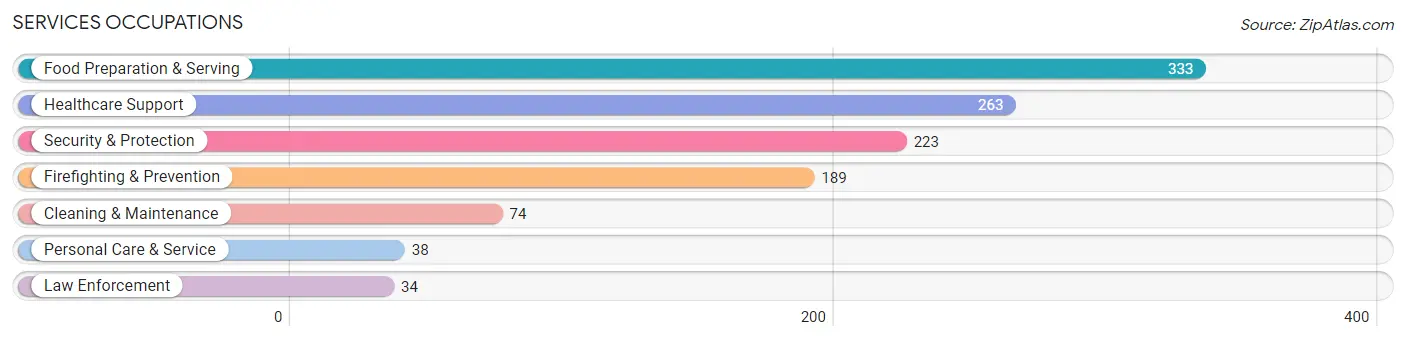
Services Occupations
The most common Services occupations in St. Helena Parish are Food Preparation & Serving (333 | 8.6%), Healthcare Support (263 | 6.8%), Security & Protection (223 | 5.7%), Firefighting & Prevention (189 | 4.9%), and Cleaning & Maintenance (74 | 1.9%).
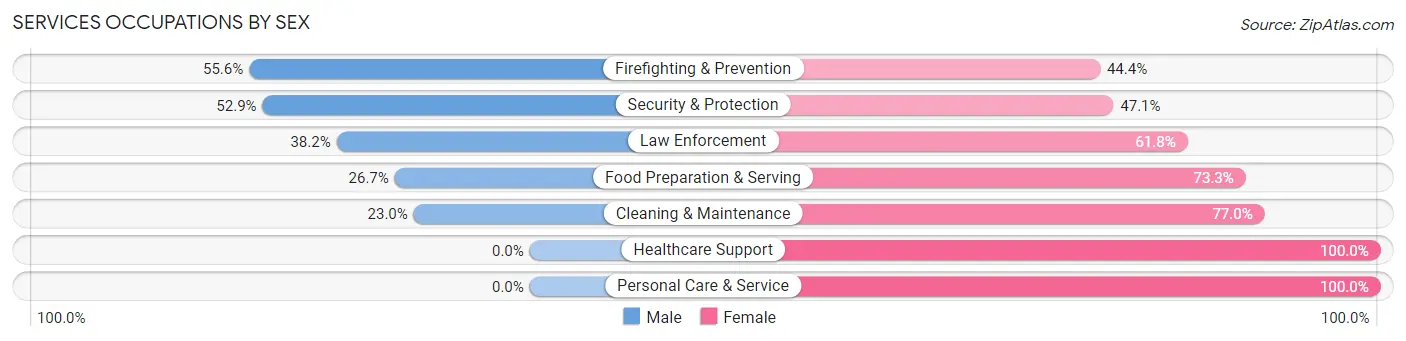
Services Occupations by Sex
Within the Services occupations in St. Helena Parish, the most male-oriented occupations are Firefighting & Prevention (55.6%), Security & Protection (52.9%), and Law Enforcement (38.2%), while the most female-oriented occupations are Healthcare Support (100.0%), Personal Care & Service (100.0%), and Cleaning & Maintenance (77.0%).
| Occupation | Male | Female |
| Healthcare Support | 0 (0.0%) | 263 (100.0%) |
| Security & Protection | 118 (52.9%) | 105 (47.1%) |
| Firefighting & Prevention | 105 (55.6%) | 84 (44.4%) |
| Law Enforcement | 13 (38.2%) | 21 (61.8%) |
| Food Preparation & Serving | 89 (26.7%) | 244 (73.3%) |
| Cleaning & Maintenance | 17 (23.0%) | 57 (77.0%) |
| Personal Care & Service | 0 (0.0%) | 38 (100.0%) |
| Total (Category) | 224 (24.1%) | 707 (75.9%) |
| Total (Overall) | 1,805 (46.5%) | 2,081 (53.5%) |
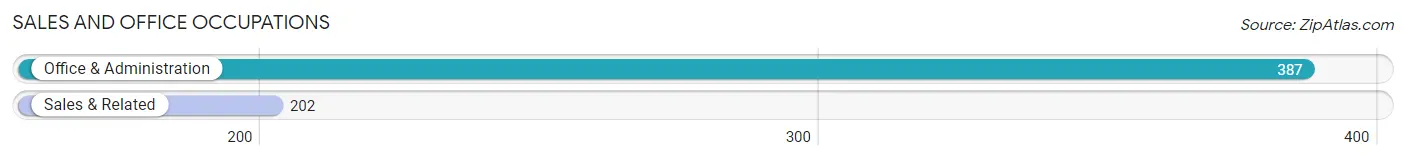
Sales and Office Occupations
The most common Sales and Office occupations in St. Helena Parish are Office & Administration (387 | 10.0%), and Sales & Related (202 | 5.2%).
Sales and Office Occupations by Sex
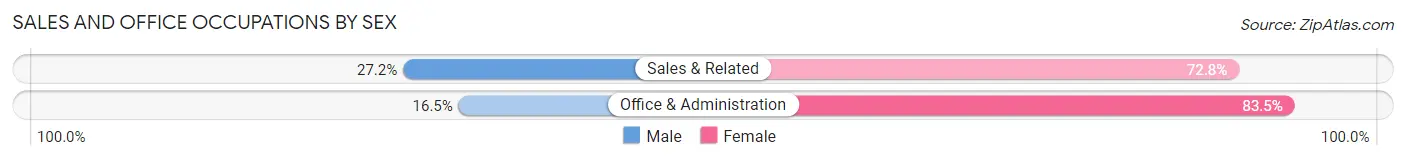
| Occupation | Male | Female |
| Sales & Related | 55 (27.2%) | 147 (72.8%) |
| Office & Administration | 64 (16.5%) | 323 (83.5%) |
| Total (Category) | 119 (20.2%) | 470 (79.8%) |
| Total (Overall) | 1,805 (46.5%) | 2,081 (53.5%) |
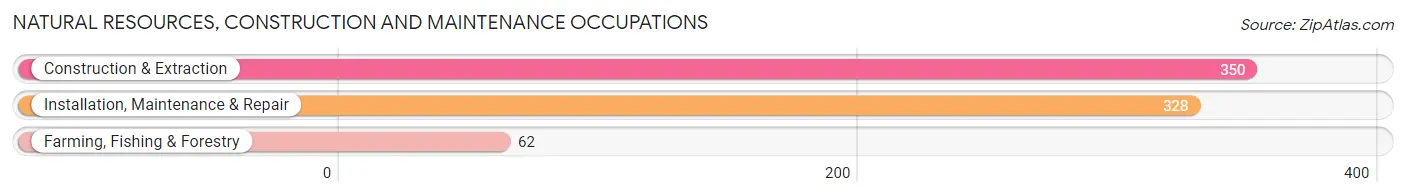
Natural Resources, Construction and Maintenance Occupations
The most common Natural Resources, Construction and Maintenance occupations in St. Helena Parish are Construction & Extraction (350 | 9.0%), Installation, Maintenance & Repair (328 | 8.4%), and Farming, Fishing & Forestry (62 | 1.6%).
Natural Resources, Construction and Maintenance Occupations by Sex
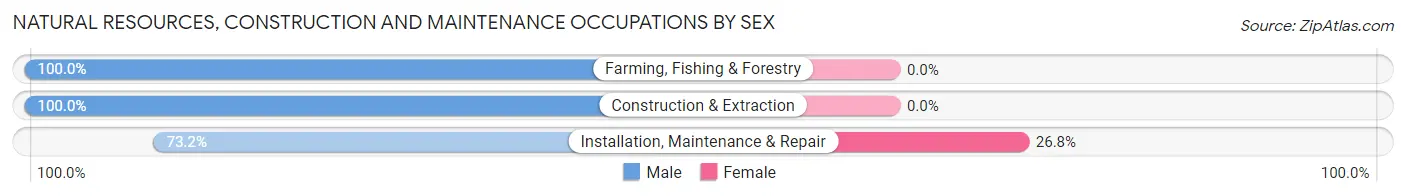
| Occupation | Male | Female |
| Farming, Fishing & Forestry | 62 (100.0%) | 0 (0.0%) |
| Construction & Extraction | 350 (100.0%) | 0 (0.0%) |
| Installation, Maintenance & Repair | 240 (73.2%) | 88 (26.8%) |
| Total (Category) | 652 (88.1%) | 88 (11.9%) |
| Total (Overall) | 1,805 (46.5%) | 2,081 (53.5%) |
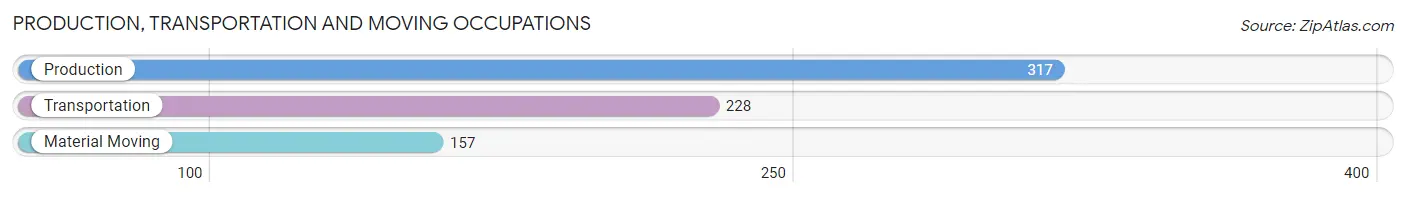
Production, Transportation and Moving Occupations
The most common Production, Transportation and Moving occupations in St. Helena Parish are Production (317 | 8.2%), Transportation (228 | 5.9%), and Material Moving (157 | 4.0%).
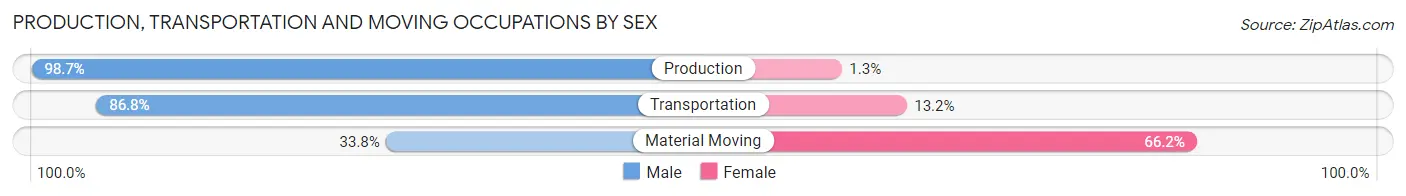
Production, Transportation and Moving Occupations by Sex
| Occupation | Male | Female |
| Production | 313 (98.7%) | 4 (1.3%) |
| Transportation | 198 (86.8%) | 30 (13.2%) |
| Material Moving | 53 (33.8%) | 104 (66.2%) |
| Total (Category) | 564 (80.3%) | 138 (19.7%) |
| Total (Overall) | 1,805 (46.5%) | 2,081 (53.5%) |
Employment Industries by Sex in St. Helena Parish
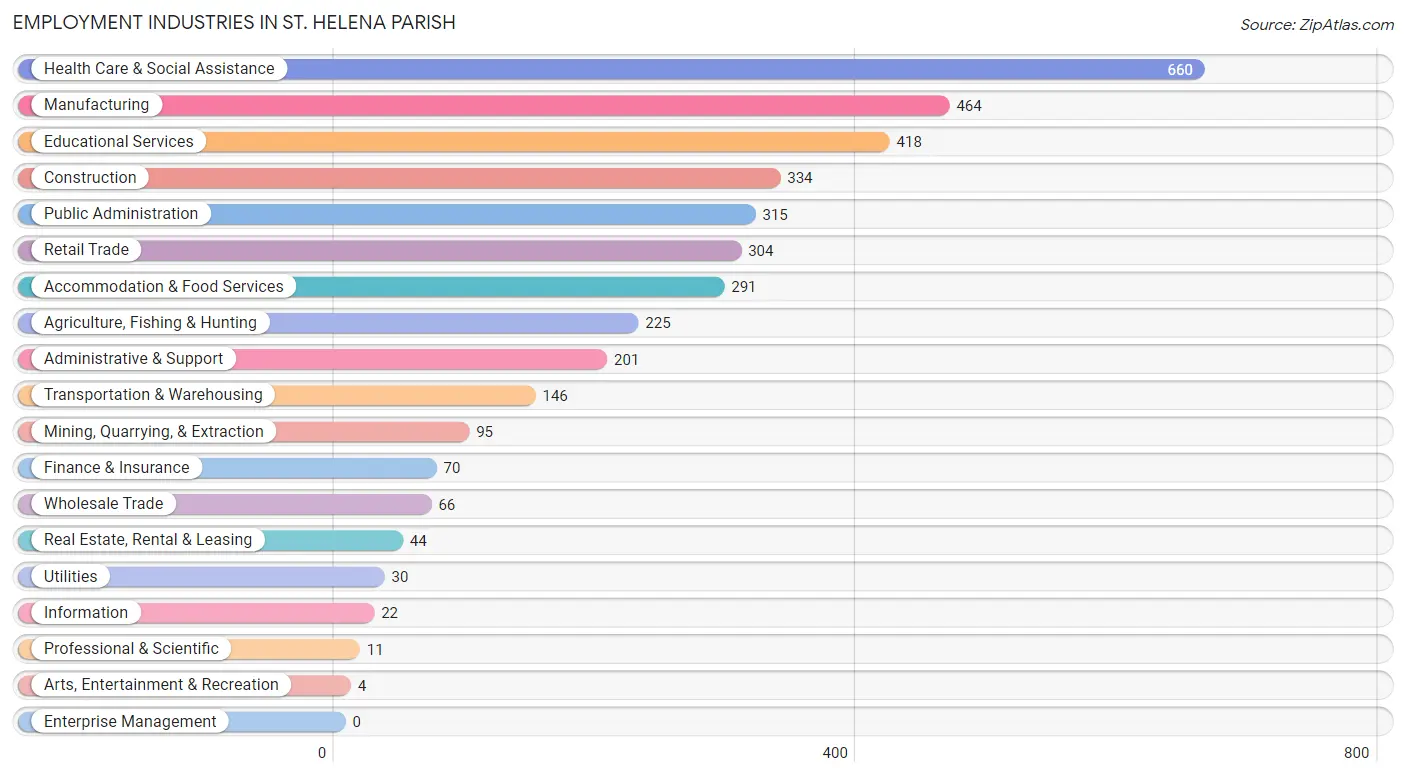
Employment Industries in St. Helena Parish
The major employment industries in St. Helena Parish include Health Care & Social Assistance (660 | 17.0%), Manufacturing (464 | 11.9%), Educational Services (418 | 10.8%), Construction (334 | 8.6%), and Public Administration (315 | 8.1%).
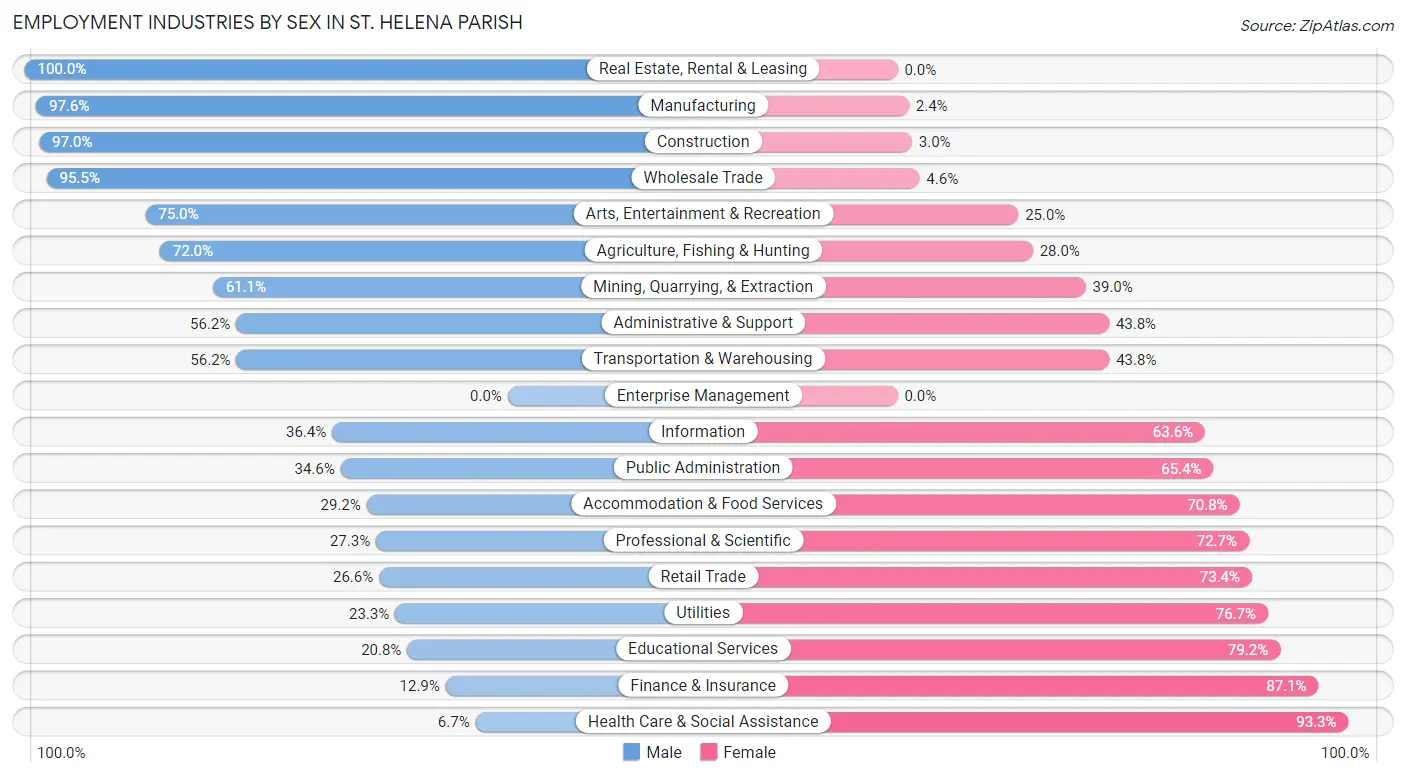
Employment Industries by Sex in St. Helena Parish
The St. Helena Parish industries that see more men than women are Real Estate, Rental & Leasing (100.0%), Manufacturing (97.6%), and Construction (97.0%), whereas the industries that tend to have a higher number of women are Health Care & Social Assistance (93.3%), Finance & Insurance (87.1%), and Educational Services (79.2%).
| Industry | Male | Female |
| Agriculture, Fishing & Hunting | 162 (72.0%) | 63 (28.0%) |
| Mining, Quarrying, & Extraction | 58 (61.1%) | 37 (39.0%) |
| Construction | 324 (97.0%) | 10 (3.0%) |
| Manufacturing | 453 (97.6%) | 11 (2.4%) |
| Wholesale Trade | 63 (95.5%) | 3 (4.5%) |
| Retail Trade | 81 (26.6%) | 223 (73.4%) |
| Transportation & Warehousing | 82 (56.2%) | 64 (43.8%) |
| Utilities | 7 (23.3%) | 23 (76.7%) |
| Information | 8 (36.4%) | 14 (63.6%) |
| Finance & Insurance | 9 (12.9%) | 61 (87.1%) |
| Real Estate, Rental & Leasing | 44 (100.0%) | 0 (0.0%) |
| Professional & Scientific | 3 (27.3%) | 8 (72.7%) |
| Enterprise Management | 0 (0.0%) | 0 (0.0%) |
| Administrative & Support | 113 (56.2%) | 88 (43.8%) |
| Educational Services | 87 (20.8%) | 331 (79.2%) |
| Health Care & Social Assistance | 44 (6.7%) | 616 (93.3%) |
| Arts, Entertainment & Recreation | 3 (75.0%) | 1 (25.0%) |
| Accommodation & Food Services | 85 (29.2%) | 206 (70.8%) |
| Public Administration | 109 (34.6%) | 206 (65.4%) |
| Total | 1,805 (46.5%) | 2,081 (53.5%) |
Education in St. Helena Parish
School Enrollment in St. Helena Parish
The most common levels of schooling among the 2,365 students in St. Helena Parish are college / undergraduate (632 | 26.7%), elementary school (494 | 20.9%), and middle school (489 | 20.7%).
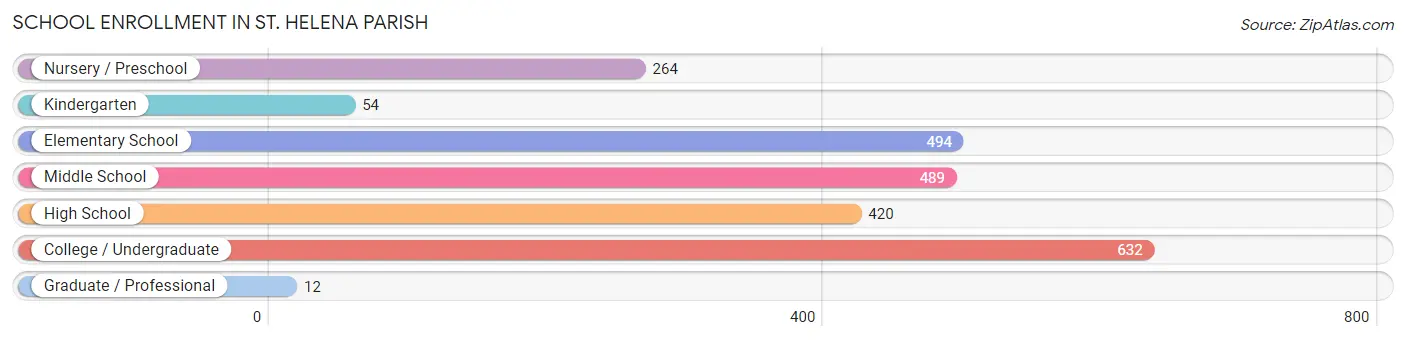
| School Level | # Students | % Students |
| Nursery / Preschool | 264 | 11.2% |
| Kindergarten | 54 | 2.3% |
| Elementary School | 494 | 20.9% |
| Middle School | 489 | 20.7% |
| High School | 420 | 17.8% |
| College / Undergraduate | 632 | 26.7% |
| Graduate / Professional | 12 | 0.5% |
| Total | 2,365 | 100.0% |
School Enrollment by Age by Funding Source in St. Helena Parish
Out of a total of 2,365 students who are enrolled in schools in St. Helena Parish, 239 (10.1%) attend a private institution, while the remaining 2,126 (89.9%) are enrolled in public schools. The age group of 15 to 17 year olds has the highest likelihood of being enrolled in private schools, with 62 (22.1% in the age bracket) enrolled. Conversely, the age group of 20 to 24 year olds has the lowest likelihood of being enrolled in a private school, with 209 (100.0% in the age bracket) attending a public institution.
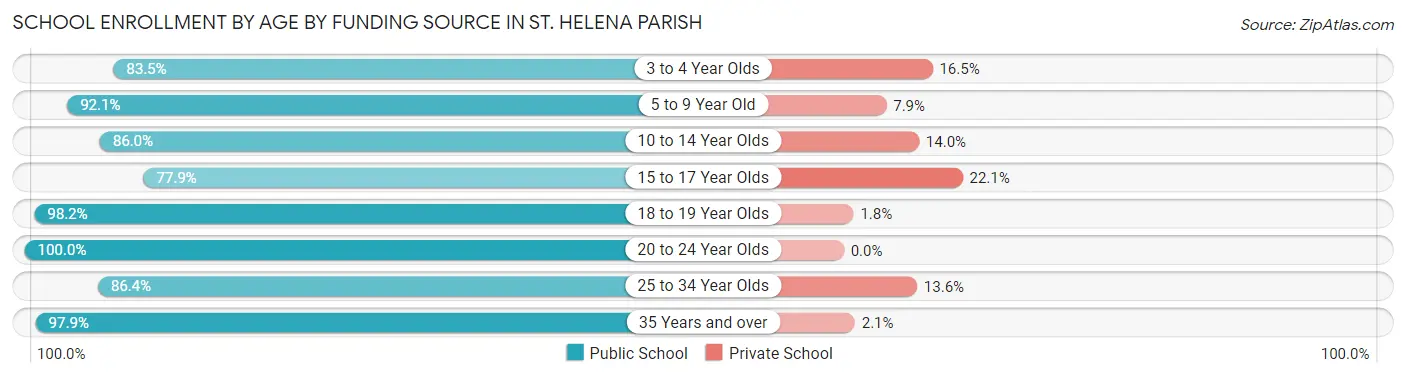
| Age Bracket | Public School | Private School |
| 3 to 4 Year Olds | 217 (83.5%) | 43 (16.5%) |
| 5 to 9 Year Old | 452 (92.1%) | 39 (7.9%) |
| 10 to 14 Year Olds | 442 (86.0%) | 72 (14.0%) |
| 15 to 17 Year Olds | 218 (77.9%) | 62 (22.1%) |
| 18 to 19 Year Olds | 324 (98.2%) | 6 (1.8%) |
| 20 to 24 Year Olds | 209 (100.0%) | 0 (0.0%) |
| 25 to 34 Year Olds | 76 (86.4%) | 12 (13.6%) |
| 35 Years and over | 189 (97.9%) | 4 (2.1%) |
| Total | 2,126 (89.9%) | 239 (10.1%) |
Educational Attainment by Field of Study in St. Helena Parish
Bio, nature & agricultural (231 | 24.3%), science & technology (136 | 14.3%), education (99 | 10.4%), business (91 | 9.6%), and arts & humanities (88 | 9.2%) are the most common fields of study among 951 individuals in St. Helena Parish who have obtained a bachelor's degree or higher.
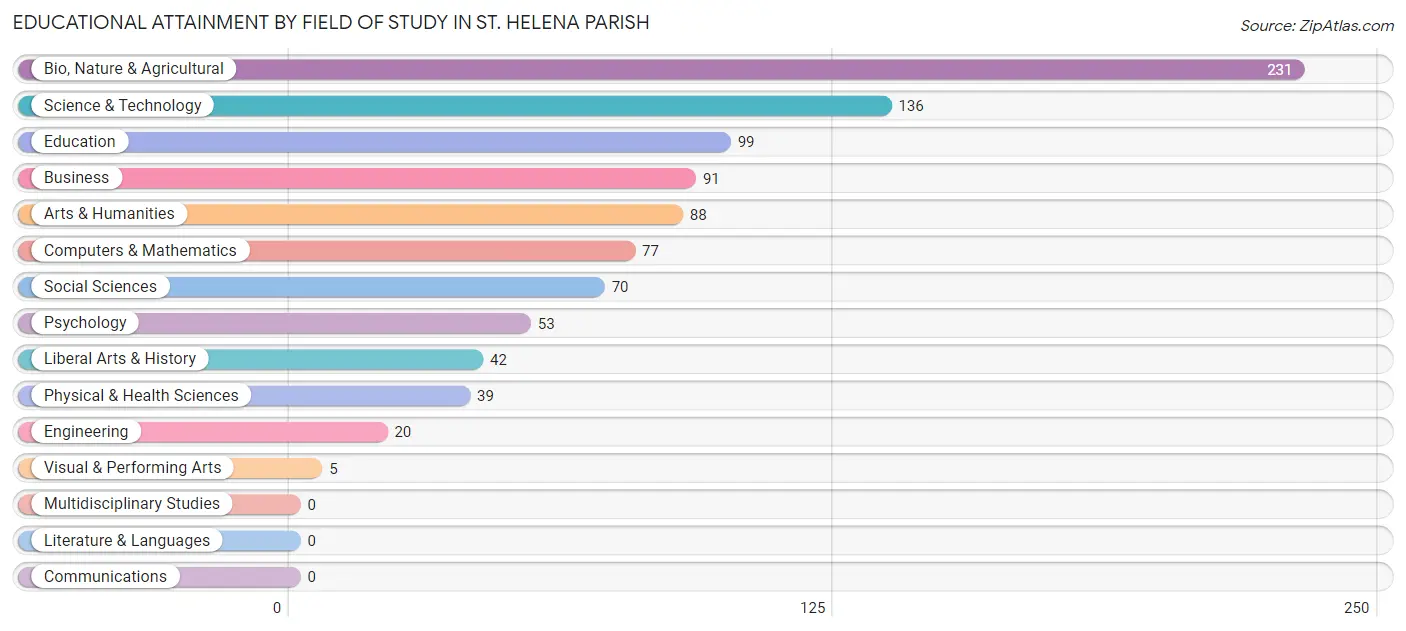
| Field of Study | # Graduates | % Graduates |
| Computers & Mathematics | 77 | 8.1% |
| Bio, Nature & Agricultural | 231 | 24.3% |
| Physical & Health Sciences | 39 | 4.1% |
| Psychology | 53 | 5.6% |
| Social Sciences | 70 | 7.4% |
| Engineering | 20 | 2.1% |
| Multidisciplinary Studies | 0 | 0.0% |
| Science & Technology | 136 | 14.3% |
| Business | 91 | 9.6% |
| Education | 99 | 10.4% |
| Literature & Languages | 0 | 0.0% |
| Liberal Arts & History | 42 | 4.4% |
| Visual & Performing Arts | 5 | 0.5% |
| Communications | 0 | 0.0% |
| Arts & Humanities | 88 | 9.2% |
| Total | 951 | 100.0% |
Transportation & Commute in St. Helena Parish
Vehicle Availability by Sex in St. Helena Parish
The most prevalent vehicle ownership categories in St. Helena Parish are males with 2 vehicles (662, accounting for 39.5%) and females with 2 vehicles (720, making up 33.2%).
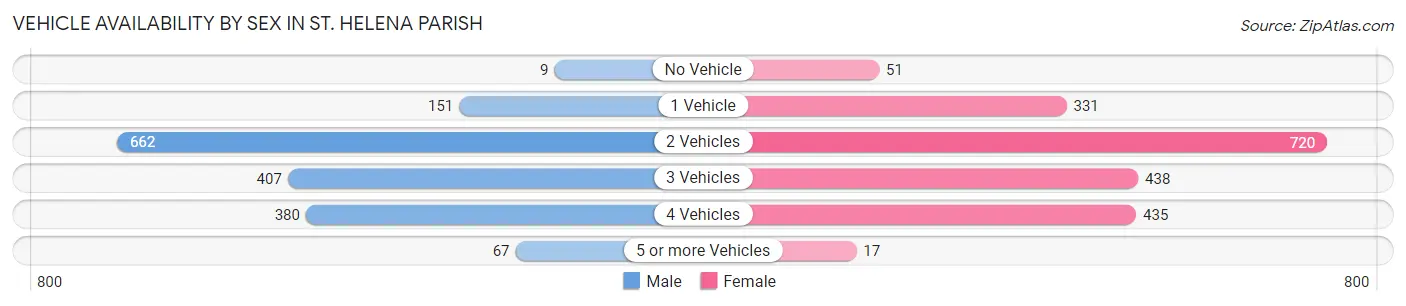
| Vehicles Available | Male | Female |
| No Vehicle | 9 (0.5%) | 51 (2.6%) |
| 1 Vehicle | 151 (9.0%) | 331 (16.6%) |
| 2 Vehicles | 662 (39.5%) | 720 (36.1%) |
| 3 Vehicles | 407 (24.3%) | 438 (22.0%) |
| 4 Vehicles | 380 (22.7%) | 435 (21.8%) |
| 5 or more Vehicles | 67 (4.0%) | 17 (0.9%) |
| Total | 1,676 (100.0%) | 1,992 (100.0%) |
Commute Time in St. Helena Parish
The most frequently occuring commute durations in St. Helena Parish are 60 to 89 minutes (702 commuters, 19.6%), 20 to 24 minutes (554 commuters, 15.4%), and 15 to 19 minutes (435 commuters, 12.1%).
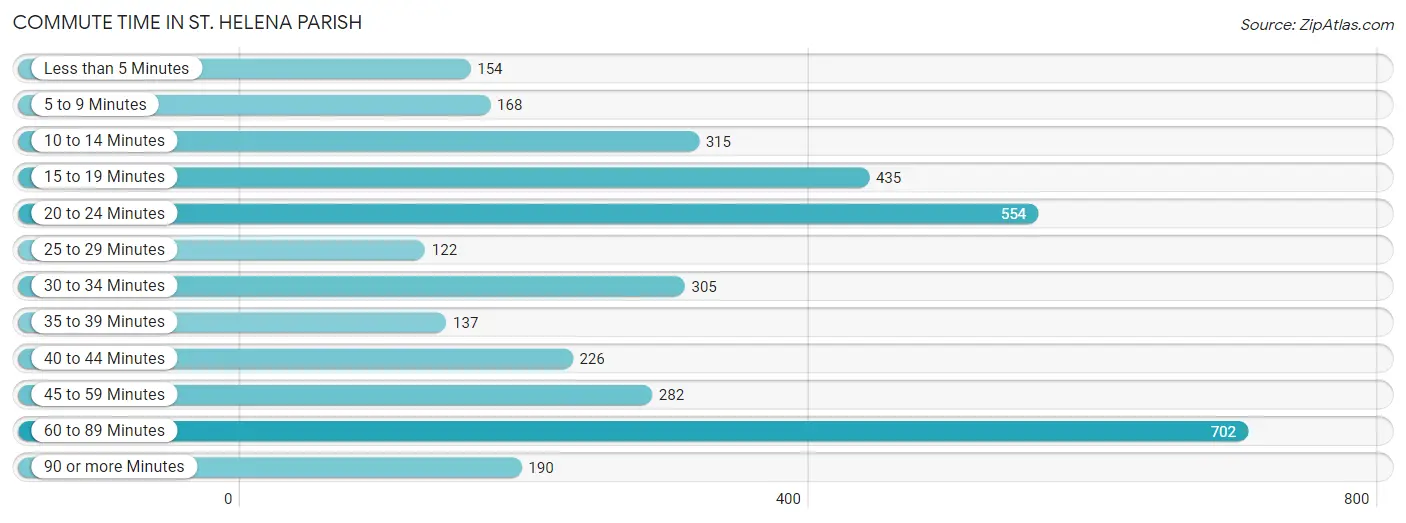
| Commute Time | # Commuters | % Commuters |
| Less than 5 Minutes | 154 | 4.3% |
| 5 to 9 Minutes | 168 | 4.7% |
| 10 to 14 Minutes | 315 | 8.8% |
| 15 to 19 Minutes | 435 | 12.1% |
| 20 to 24 Minutes | 554 | 15.4% |
| 25 to 29 Minutes | 122 | 3.4% |
| 30 to 34 Minutes | 305 | 8.5% |
| 35 to 39 Minutes | 137 | 3.8% |
| 40 to 44 Minutes | 226 | 6.3% |
| 45 to 59 Minutes | 282 | 7.9% |
| 60 to 89 Minutes | 702 | 19.6% |
| 90 or more Minutes | 190 | 5.3% |
Commute Time by Sex in St. Helena Parish
The most common commute times in St. Helena Parish are 60 to 89 minutes (349 commuters, 21.4%) for males and 60 to 89 minutes (353 commuters, 18.0%) for females.
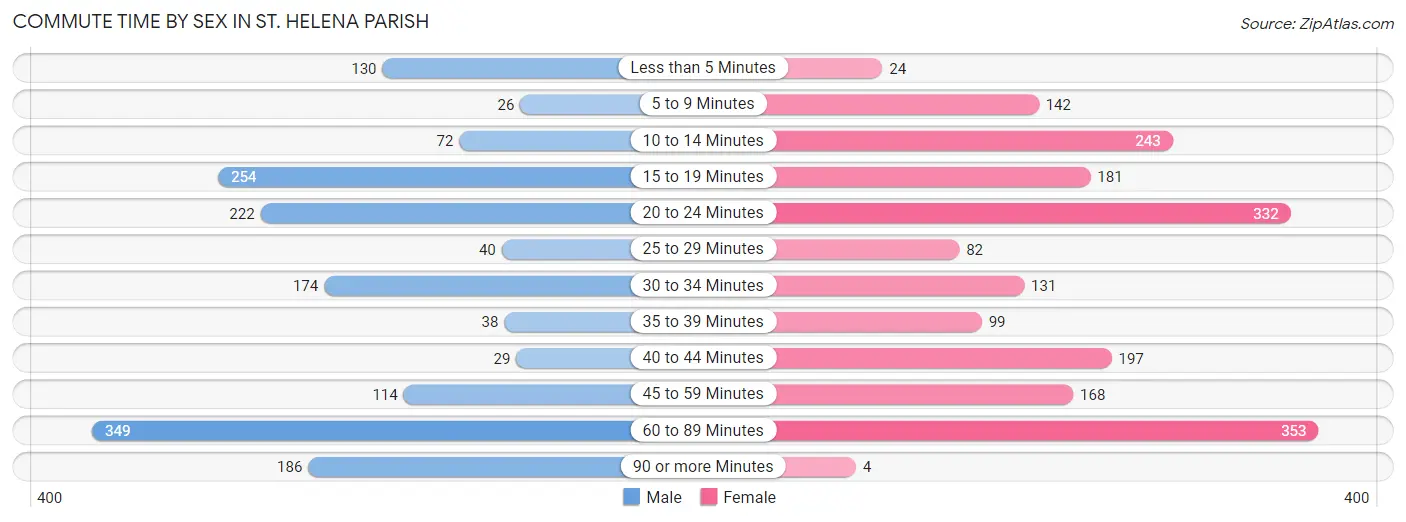
| Commute Time | Male | Female |
| Less than 5 Minutes | 130 (8.0%) | 24 (1.2%) |
| 5 to 9 Minutes | 26 (1.6%) | 142 (7.3%) |
| 10 to 14 Minutes | 72 (4.4%) | 243 (12.4%) |
| 15 to 19 Minutes | 254 (15.5%) | 181 (9.2%) |
| 20 to 24 Minutes | 222 (13.6%) | 332 (17.0%) |
| 25 to 29 Minutes | 40 (2.5%) | 82 (4.2%) |
| 30 to 34 Minutes | 174 (10.6%) | 131 (6.7%) |
| 35 to 39 Minutes | 38 (2.3%) | 99 (5.1%) |
| 40 to 44 Minutes | 29 (1.8%) | 197 (10.1%) |
| 45 to 59 Minutes | 114 (7.0%) | 168 (8.6%) |
| 60 to 89 Minutes | 349 (21.4%) | 353 (18.0%) |
| 90 or more Minutes | 186 (11.4%) | 4 (0.2%) |
Time of Departure to Work by Sex in St. Helena Parish
The most frequent times of departure to work in St. Helena Parish are 12:00 AM to 4:59 AM (410, 25.1%) for males and 6:30 AM to 6:59 AM (371, 19.0%) for females.
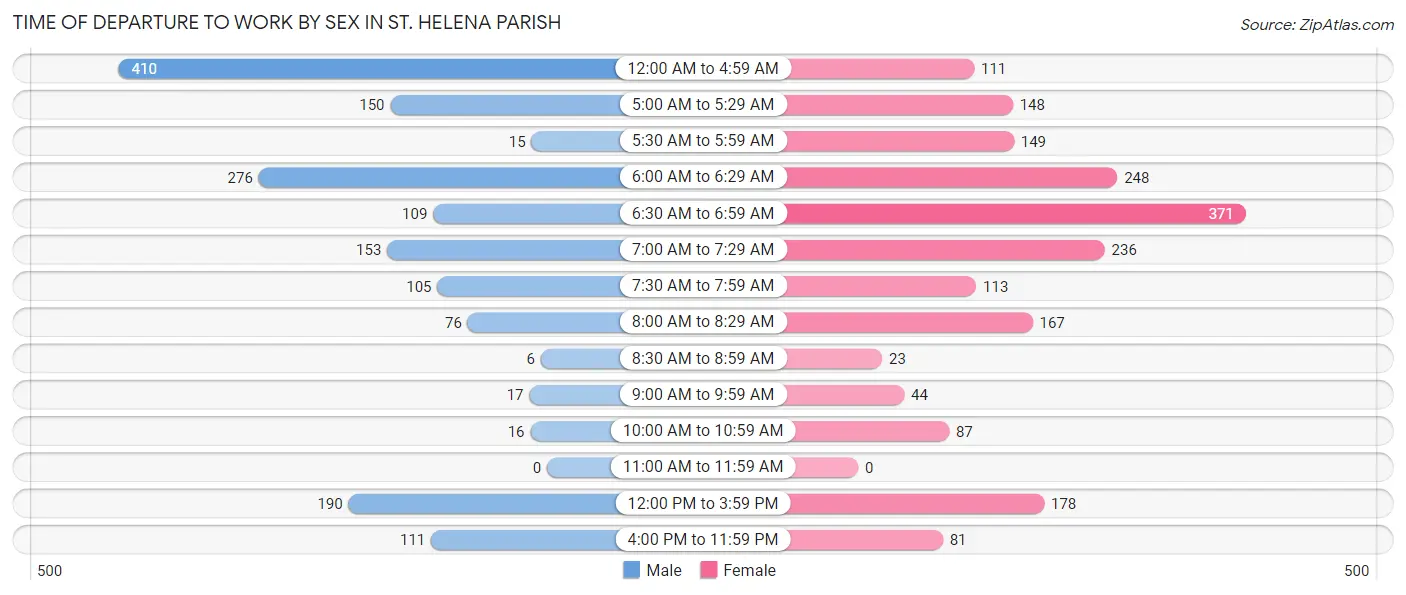
| Time of Departure | Male | Female |
| 12:00 AM to 4:59 AM | 410 (25.1%) | 111 (5.7%) |
| 5:00 AM to 5:29 AM | 150 (9.2%) | 148 (7.6%) |
| 5:30 AM to 5:59 AM | 15 (0.9%) | 149 (7.6%) |
| 6:00 AM to 6:29 AM | 276 (16.9%) | 248 (12.7%) |
| 6:30 AM to 6:59 AM | 109 (6.7%) | 371 (19.0%) |
| 7:00 AM to 7:29 AM | 153 (9.4%) | 236 (12.1%) |
| 7:30 AM to 7:59 AM | 105 (6.4%) | 113 (5.8%) |
| 8:00 AM to 8:29 AM | 76 (4.6%) | 167 (8.5%) |
| 8:30 AM to 8:59 AM | 6 (0.4%) | 23 (1.2%) |
| 9:00 AM to 9:59 AM | 17 (1.0%) | 44 (2.2%) |
| 10:00 AM to 10:59 AM | 16 (1.0%) | 87 (4.4%) |
| 11:00 AM to 11:59 AM | 0 (0.0%) | 0 (0.0%) |
| 12:00 PM to 3:59 PM | 190 (11.6%) | 178 (9.1%) |
| 4:00 PM to 11:59 PM | 111 (6.8%) | 81 (4.1%) |
| Total | 1,634 (100.0%) | 1,956 (100.0%) |
Housing Occupancy in St. Helena Parish
Occupancy by Ownership in St. Helena Parish
Of the total 4,004 dwellings in St. Helena Parish, owner-occupied units account for 3,064 (76.5%), while renter-occupied units make up 940 (23.5%).
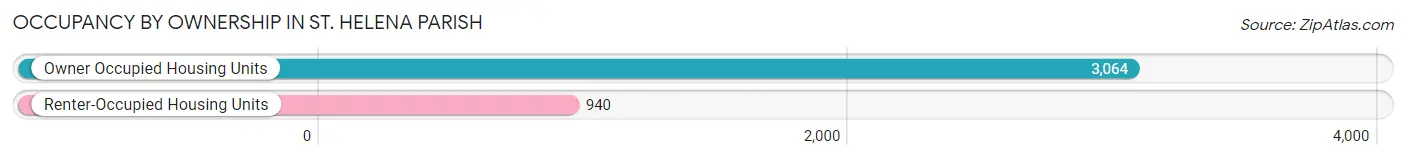
| Occupancy | # Housing Units | % Housing Units |
| Owner Occupied Housing Units | 3,064 | 76.5% |
| Renter-Occupied Housing Units | 940 | 23.5% |
| Total Occupied Housing Units | 4,004 | 100.0% |
Occupancy by Household Size in St. Helena Parish
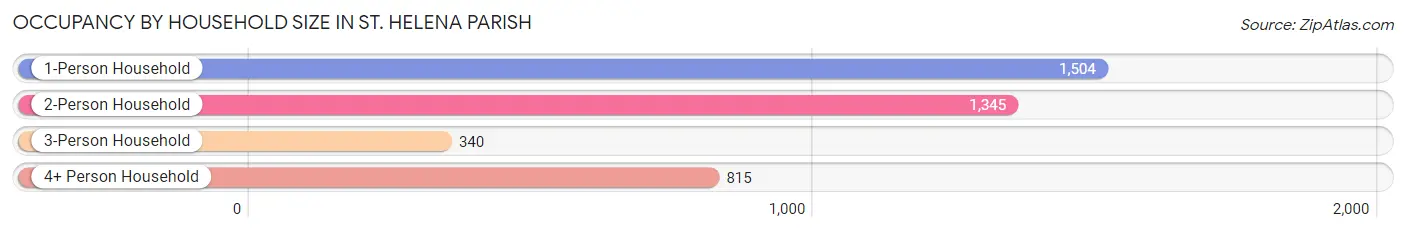
| Household Size | # Housing Units | % Housing Units |
| 1-Person Household | 1,504 | 37.6% |
| 2-Person Household | 1,345 | 33.6% |
| 3-Person Household | 340 | 8.5% |
| 4+ Person Household | 815 | 20.3% |
| Total Housing Units | 4,004 | 100.0% |
Occupancy by Ownership by Household Size in St. Helena Parish
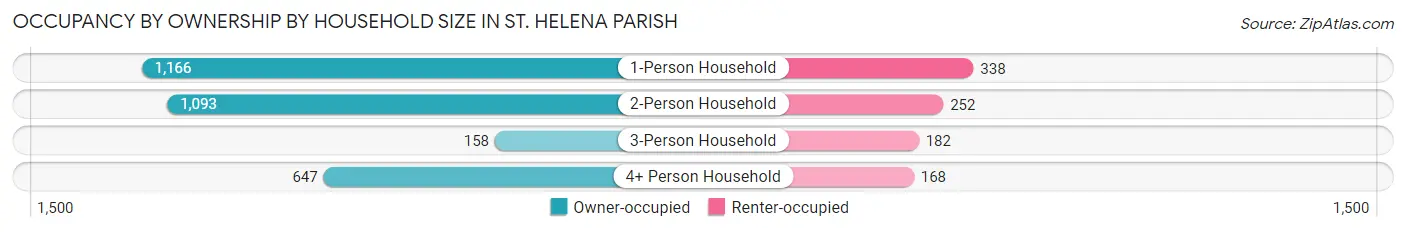
| Household Size | Owner-occupied | Renter-occupied |
| 1-Person Household | 1,166 (77.5%) | 338 (22.5%) |
| 2-Person Household | 1,093 (81.3%) | 252 (18.7%) |
| 3-Person Household | 158 (46.5%) | 182 (53.5%) |
| 4+ Person Household | 647 (79.4%) | 168 (20.6%) |
| Total Housing Units | 3,064 (76.5%) | 940 (23.5%) |
Occupancy by Educational Attainment in St. Helena Parish
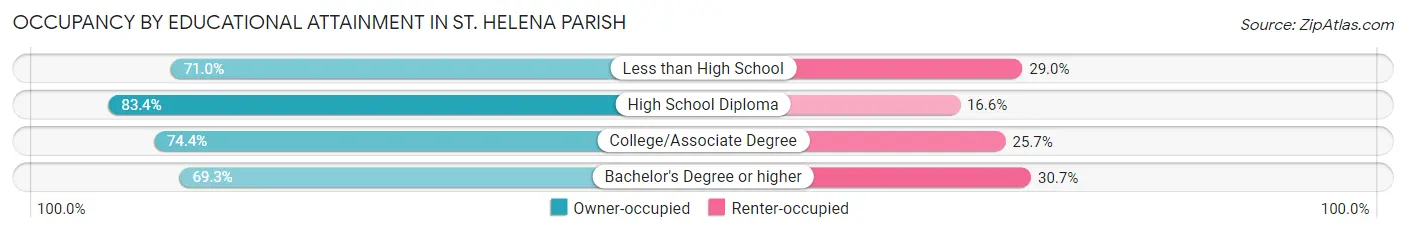
| Household Size | Owner-occupied | Renter-occupied |
| Less than High School | 647 (71.0%) | 264 (29.0%) |
| High School Diploma | 1,309 (83.4%) | 261 (16.6%) |
| College/Associate Degree | 774 (74.4%) | 267 (25.7%) |
| Bachelor's Degree or higher | 334 (69.3%) | 148 (30.7%) |
Occupancy by Age of Householder in St. Helena Parish
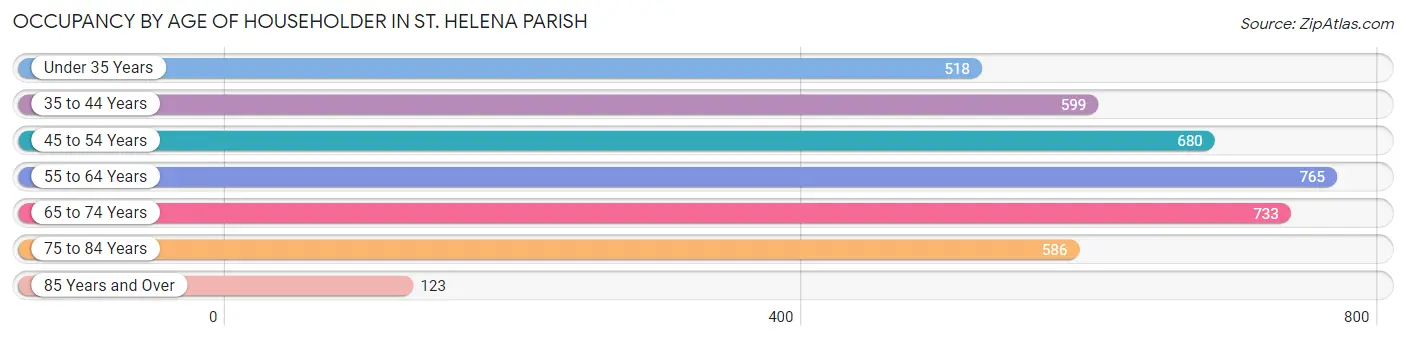
| Age Bracket | # Households | % Households |
| Under 35 Years | 518 | 12.9% |
| 35 to 44 Years | 599 | 15.0% |
| 45 to 54 Years | 680 | 17.0% |
| 55 to 64 Years | 765 | 19.1% |
| 65 to 74 Years | 733 | 18.3% |
| 75 to 84 Years | 586 | 14.6% |
| 85 Years and Over | 123 | 3.1% |
| Total | 4,004 | 100.0% |
Housing Finances in St. Helena Parish
Median Income by Occupancy in St. Helena Parish
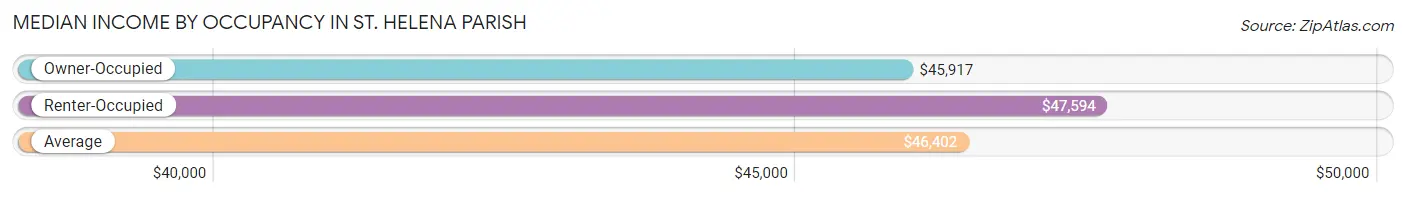
| Occupancy Type | # Households | Median Income |
| Owner-Occupied | 3,064 (76.5%) | $45,917 |
| Renter-Occupied | 940 (23.5%) | $47,594 |
| Average | 4,004 (100.0%) | $46,402 |
Occupancy by Householder Income Bracket in St. Helena Parish
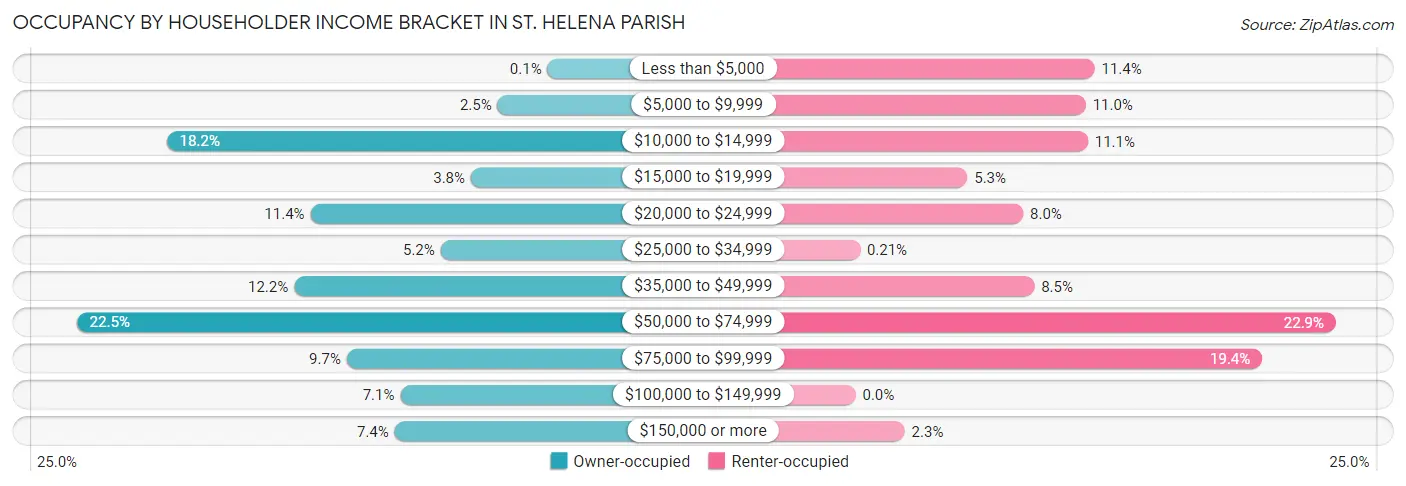
| Income Bracket | Owner-occupied | Renter-occupied |
| Less than $5,000 | 3 (0.1%) | 107 (11.4%) |
| $5,000 to $9,999 | 76 (2.5%) | 103 (11.0%) |
| $10,000 to $14,999 | 559 (18.2%) | 104 (11.1%) |
| $15,000 to $19,999 | 115 (3.7%) | 50 (5.3%) |
| $20,000 to $24,999 | 349 (11.4%) | 75 (8.0%) |
| $25,000 to $34,999 | 159 (5.2%) | 2 (0.2%) |
| $35,000 to $49,999 | 373 (12.2%) | 80 (8.5%) |
| $50,000 to $74,999 | 690 (22.5%) | 215 (22.9%) |
| $75,000 to $99,999 | 296 (9.7%) | 182 (19.4%) |
| $100,000 to $149,999 | 218 (7.1%) | 0 (0.0%) |
| $150,000 or more | 226 (7.4%) | 22 (2.3%) |
| Total | 3,064 (100.0%) | 940 (100.0%) |
Monthly Housing Cost Tiers in St. Helena Parish
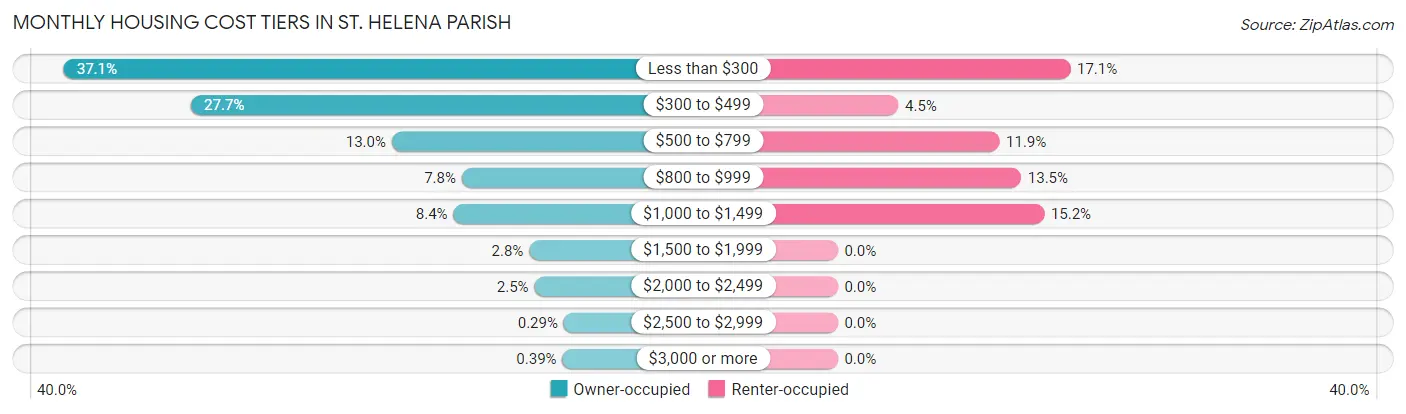
| Monthly Cost | Owner-occupied | Renter-occupied |
| Less than $300 | 1,137 (37.1%) | 161 (17.1%) |
| $300 to $499 | 850 (27.7%) | 42 (4.5%) |
| $500 to $799 | 397 (13.0%) | 112 (11.9%) |
| $800 to $999 | 239 (7.8%) | 127 (13.5%) |
| $1,000 to $1,499 | 258 (8.4%) | 143 (15.2%) |
| $1,500 to $1,999 | 87 (2.8%) | 0 (0.0%) |
| $2,000 to $2,499 | 75 (2.5%) | 0 (0.0%) |
| $2,500 to $2,999 | 9 (0.3%) | 0 (0.0%) |
| $3,000 or more | 12 (0.4%) | 0 (0.0%) |
| Total | 3,064 (100.0%) | 940 (100.0%) |
Physical Housing Characteristics in St. Helena Parish
Housing Structures in St. Helena Parish
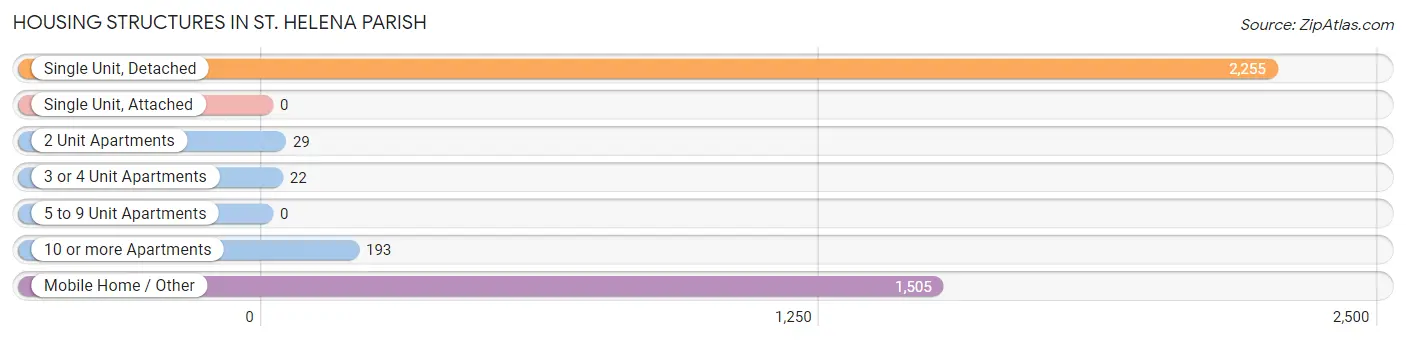
| Structure Type | # Housing Units | % Housing Units |
| Single Unit, Detached | 2,255 | 56.3% |
| Single Unit, Attached | 0 | 0.0% |
| 2 Unit Apartments | 29 | 0.7% |
| 3 or 4 Unit Apartments | 22 | 0.5% |
| 5 to 9 Unit Apartments | 0 | 0.0% |
| 10 or more Apartments | 193 | 4.8% |
| Mobile Home / Other | 1,505 | 37.6% |
| Total | 4,004 | 100.0% |
Housing Structures by Occupancy in St. Helena Parish
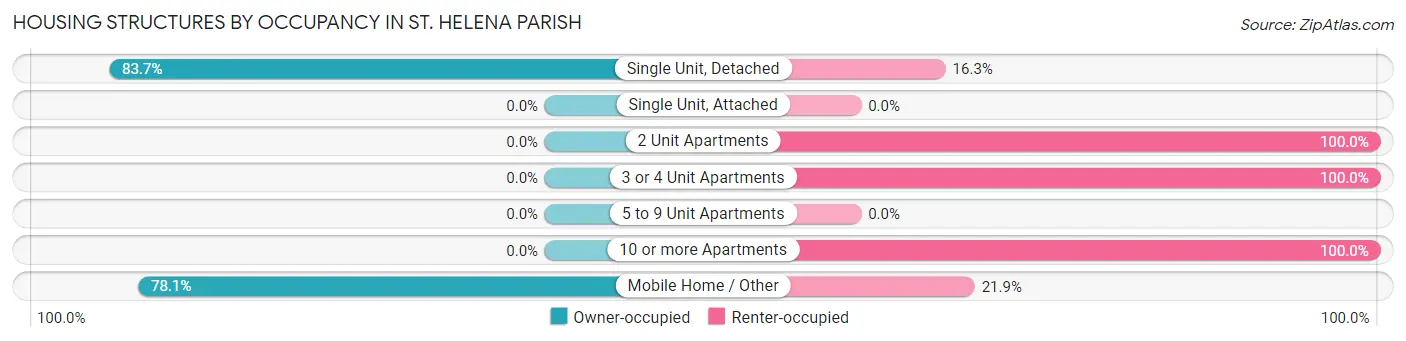
| Structure Type | Owner-occupied | Renter-occupied |
| Single Unit, Detached | 1,888 (83.7%) | 367 (16.3%) |
| Single Unit, Attached | 0 (0.0%) | 0 (0.0%) |
| 2 Unit Apartments | 0 (0.0%) | 29 (100.0%) |
| 3 or 4 Unit Apartments | 0 (0.0%) | 22 (100.0%) |
| 5 to 9 Unit Apartments | 0 (0.0%) | 0 (0.0%) |
| 10 or more Apartments | 0 (0.0%) | 193 (100.0%) |
| Mobile Home / Other | 1,176 (78.1%) | 329 (21.9%) |
| Total | 3,064 (76.5%) | 940 (23.5%) |
Housing Structures by Number of Rooms in St. Helena Parish
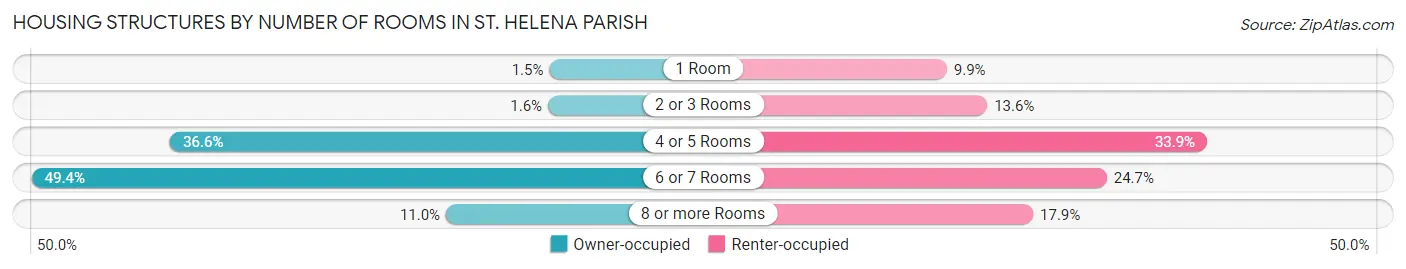
| Number of Rooms | Owner-occupied | Renter-occupied |
| 1 Room | 45 (1.5%) | 93 (9.9%) |
| 2 or 3 Rooms | 49 (1.6%) | 128 (13.6%) |
| 4 or 5 Rooms | 1,120 (36.5%) | 319 (33.9%) |
| 6 or 7 Rooms | 1,512 (49.3%) | 232 (24.7%) |
| 8 or more Rooms | 338 (11.0%) | 168 (17.9%) |
| Total | 3,064 (100.0%) | 940 (100.0%) |
Housing Structure by Heating Type in St. Helena Parish
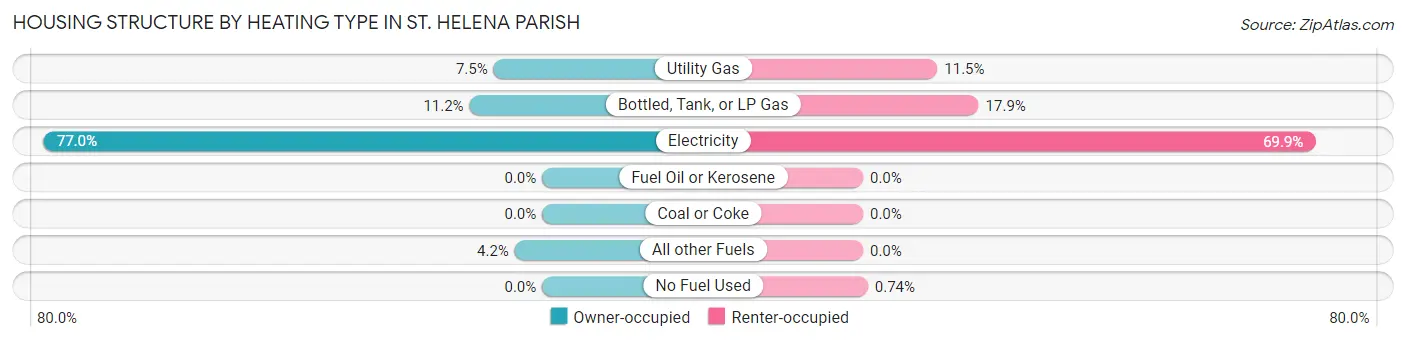
| Heating Type | Owner-occupied | Renter-occupied |
| Utility Gas | 230 (7.5%) | 108 (11.5%) |
| Bottled, Tank, or LP Gas | 344 (11.2%) | 168 (17.9%) |
| Electricity | 2,360 (77.0%) | 657 (69.9%) |
| Fuel Oil or Kerosene | 0 (0.0%) | 0 (0.0%) |
| Coal or Coke | 0 (0.0%) | 0 (0.0%) |
| All other Fuels | 130 (4.2%) | 0 (0.0%) |
| No Fuel Used | 0 (0.0%) | 7 (0.7%) |
| Total | 3,064 (100.0%) | 940 (100.0%) |
Household Vehicle Usage in St. Helena Parish
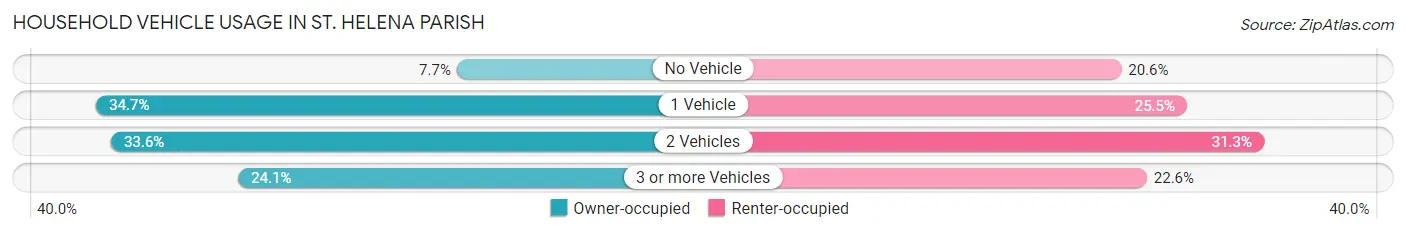
| Vehicles per Household | Owner-occupied | Renter-occupied |
| No Vehicle | 237 (7.7%) | 194 (20.6%) |
| 1 Vehicle | 1,062 (34.7%) | 240 (25.5%) |
| 2 Vehicles | 1,028 (33.6%) | 294 (31.3%) |
| 3 or more Vehicles | 737 (24.0%) | 212 (22.6%) |
| Total | 3,064 (100.0%) | 940 (100.0%) |
Real Estate & Mortgages in St. Helena Parish
Real Estate and Mortgage Overview in St. Helena Parish
| Characteristic | Without Mortgage | With Mortgage |
| Housing Units | 2,244 | 820 |
| Median Property Value | $85,300 | $156,800 |
| Median Household Income | $35,804 | $141 |
| Monthly Housing Costs | $300 | $12 |
| Real Estate Taxes | $406 | $546 |
Property Value by Mortgage Status in St. Helena Parish
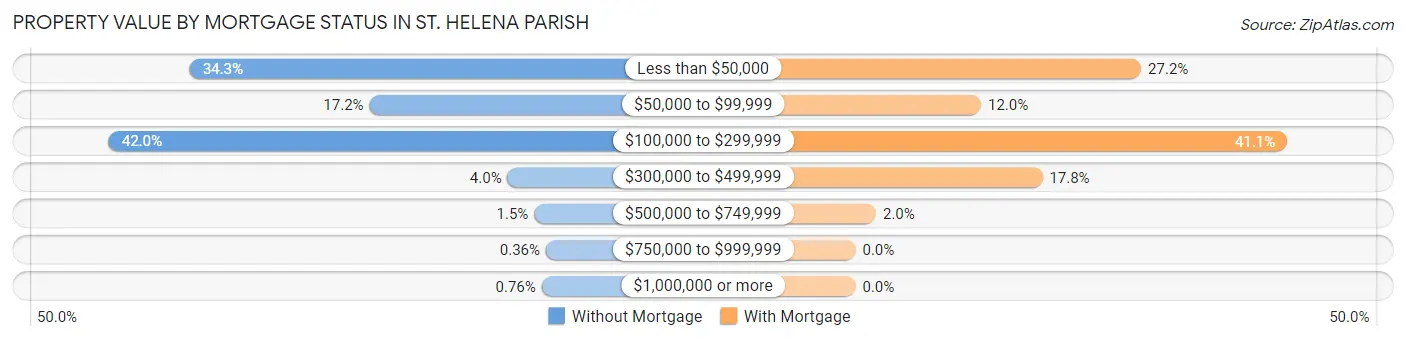
| Property Value | Without Mortgage | With Mortgage |
| Less than $50,000 | 769 (34.3%) | 223 (27.2%) |
| $50,000 to $99,999 | 385 (17.2%) | 98 (11.9%) |
| $100,000 to $299,999 | 942 (42.0%) | 337 (41.1%) |
| $300,000 to $499,999 | 90 (4.0%) | 146 (17.8%) |
| $500,000 to $749,999 | 33 (1.5%) | 16 (1.9%) |
| $750,000 to $999,999 | 8 (0.4%) | 0 (0.0%) |
| $1,000,000 or more | 17 (0.8%) | 0 (0.0%) |
| Total | 2,244 (100.0%) | 820 (100.0%) |
Household Income by Mortgage Status in St. Helena Parish
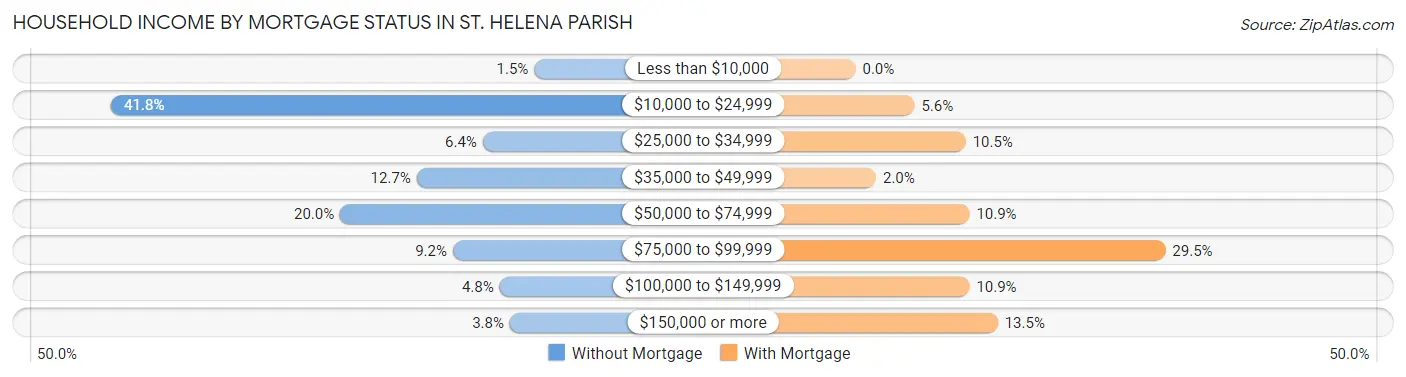
| Household Income | Without Mortgage | With Mortgage |
| Less than $10,000 | 33 (1.5%) | 0 (0.0%) |
| $10,000 to $24,999 | 937 (41.8%) | 46 (5.6%) |
| $25,000 to $34,999 | 143 (6.4%) | 86 (10.5%) |
| $35,000 to $49,999 | 284 (12.7%) | 16 (1.9%) |
| $50,000 to $74,999 | 448 (20.0%) | 89 (10.8%) |
| $75,000 to $99,999 | 207 (9.2%) | 242 (29.5%) |
| $100,000 to $149,999 | 107 (4.8%) | 89 (10.8%) |
| $150,000 or more | 85 (3.8%) | 111 (13.5%) |
| Total | 2,244 (100.0%) | 820 (100.0%) |
Property Value to Household Income Ratio in St. Helena Parish
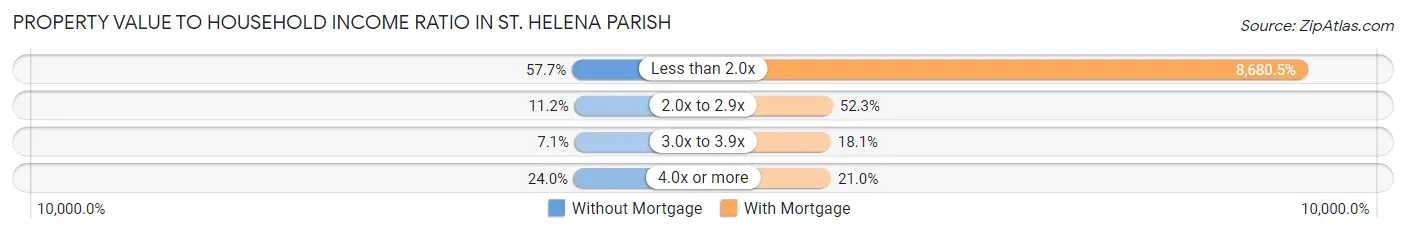
| Value-to-Income Ratio | Without Mortgage | With Mortgage |
| Less than 2.0x | 1,295 (57.7%) | 71,180 (8,680.5%) |
| 2.0x to 2.9x | 252 (11.2%) | 429 (52.3%) |
| 3.0x to 3.9x | 159 (7.1%) | 148 (18.0%) |
| 4.0x or more | 538 (24.0%) | 172 (21.0%) |
| Total | 2,244 (100.0%) | 820 (100.0%) |
Real Estate Taxes by Mortgage Status in St. Helena Parish
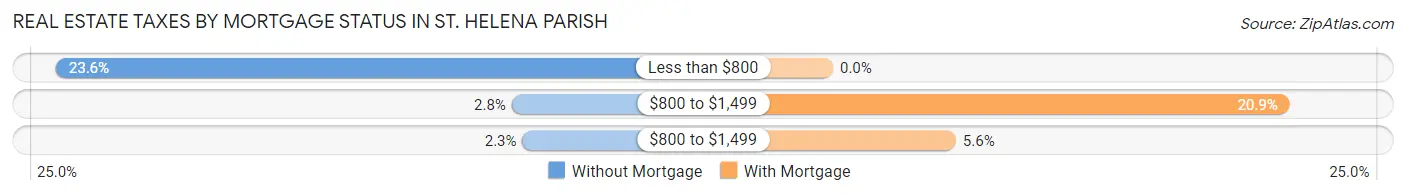
| Property Taxes | Without Mortgage | With Mortgage |
| Less than $800 | 529 (23.6%) | 0 (0.0%) |
| $800 to $1,499 | 62 (2.8%) | 171 (20.8%) |
| $800 to $1,499 | 51 (2.3%) | 46 (5.6%) |
| Total | 2,244 (100.0%) | 820 (100.0%) |
Health & Disability in St. Helena Parish
Health Insurance Coverage by Age in St. Helena Parish
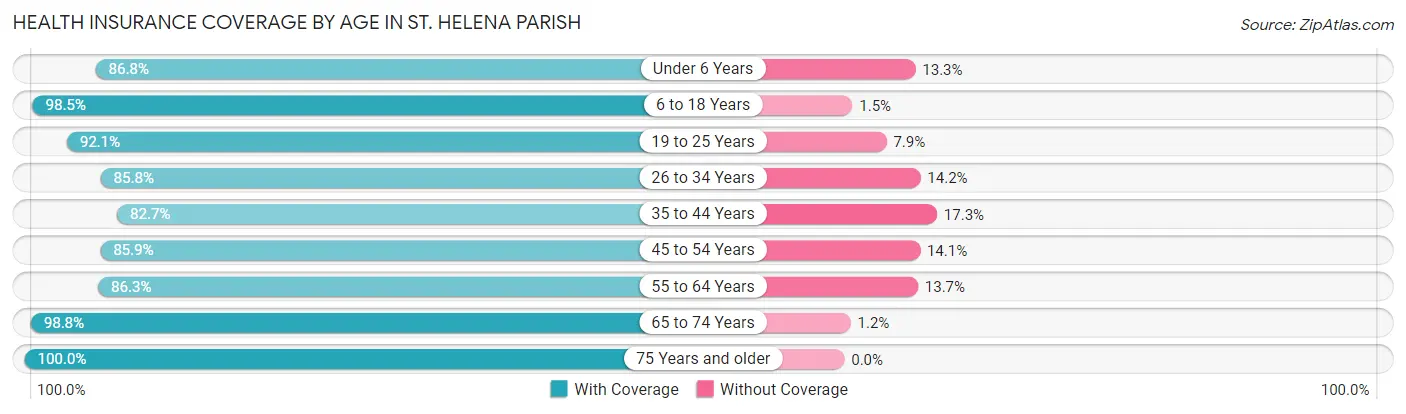
| Age Bracket | With Coverage | Without Coverage |
| Under 6 Years | 609 (86.8%) | 93 (13.3%) |
| 6 to 18 Years | 1,510 (98.5%) | 23 (1.5%) |
| 19 to 25 Years | 1,159 (92.1%) | 99 (7.9%) |
| 26 to 34 Years | 925 (85.8%) | 153 (14.2%) |
| 35 to 44 Years | 1,068 (82.7%) | 223 (17.3%) |
| 45 to 54 Years | 1,029 (85.9%) | 169 (14.1%) |
| 55 to 64 Years | 1,302 (86.3%) | 207 (13.7%) |
| 65 to 74 Years | 1,186 (98.8%) | 14 (1.2%) |
| 75 Years and older | 965 (100.0%) | 0 (0.0%) |
| Total | 9,753 (90.9%) | 981 (9.1%) |
Health Insurance Coverage by Citizenship Status in St. Helena Parish
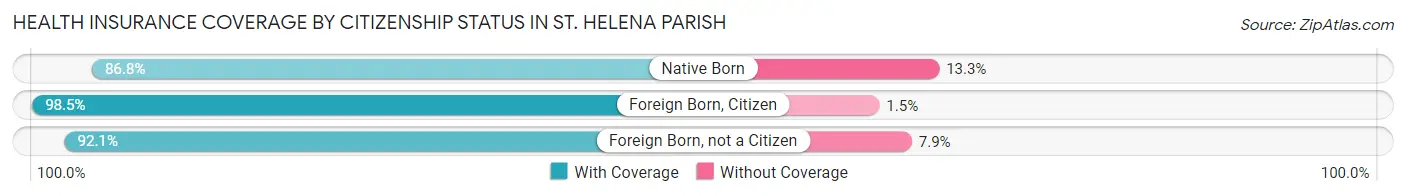
| Citizenship Status | With Coverage | Without Coverage |
| Native Born | 609 (86.8%) | 93 (13.3%) |
| Foreign Born, Citizen | 1,510 (98.5%) | 23 (1.5%) |
| Foreign Born, not a Citizen | 1,159 (92.1%) | 99 (7.9%) |
Health Insurance Coverage by Household Income in St. Helena Parish
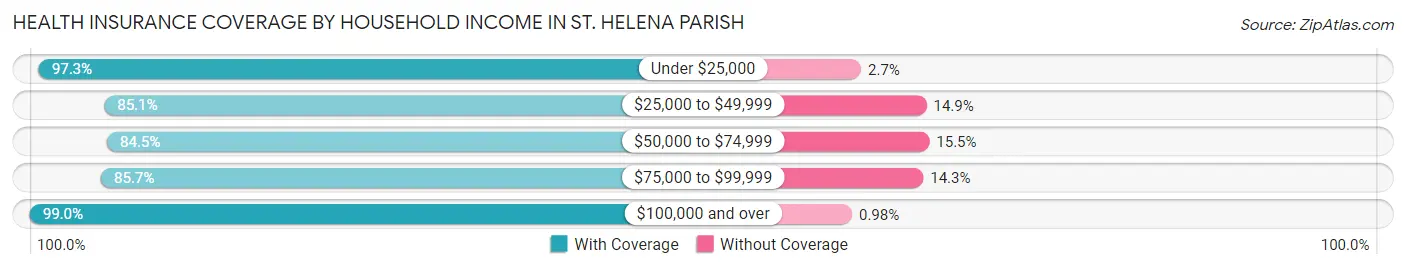
| Household Income | With Coverage | Without Coverage |
| Under $25,000 | 3,055 (97.3%) | 84 (2.7%) |
| $25,000 to $49,999 | 1,469 (85.1%) | 258 (14.9%) |
| $50,000 to $74,999 | 2,328 (84.5%) | 426 (15.5%) |
| $75,000 to $99,999 | 1,171 (85.7%) | 196 (14.3%) |
| $100,000 and over | 1,723 (99.0%) | 17 (1.0%) |
Public vs Private Health Insurance Coverage by Age in St. Helena Parish
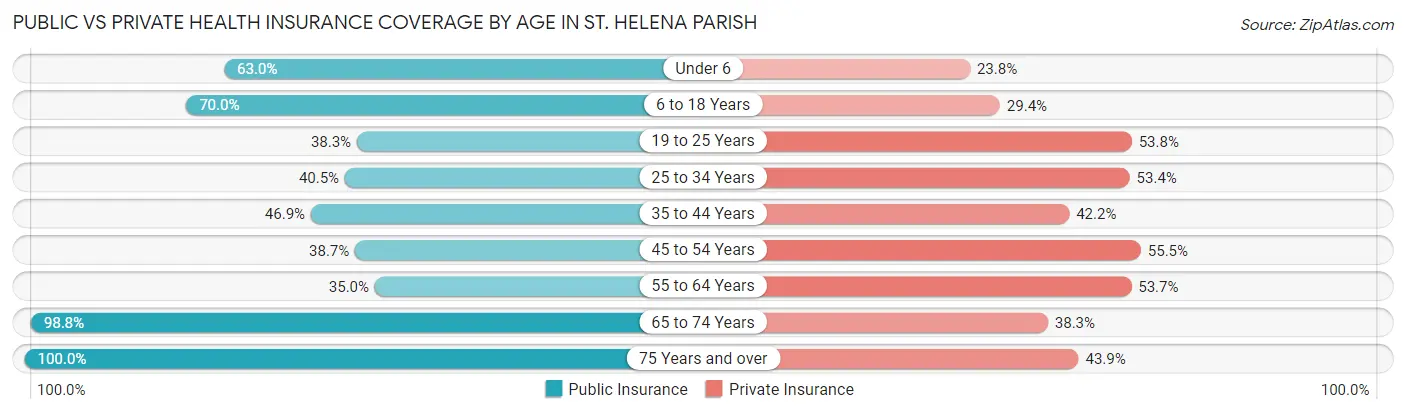
| Age Bracket | Public Insurance | Private Insurance |
| Under 6 | 442 (63.0%) | 167 (23.8%) |
| 6 to 18 Years | 1,073 (70.0%) | 450 (29.3%) |
| 19 to 25 Years | 482 (38.3%) | 677 (53.8%) |
| 25 to 34 Years | 437 (40.5%) | 576 (53.4%) |
| 35 to 44 Years | 605 (46.9%) | 545 (42.2%) |
| 45 to 54 Years | 463 (38.7%) | 665 (55.5%) |
| 55 to 64 Years | 528 (35.0%) | 811 (53.7%) |
| 65 to 74 Years | 1,186 (98.8%) | 459 (38.3%) |
| 75 Years and over | 965 (100.0%) | 424 (43.9%) |
| Total | 6,181 (57.6%) | 4,774 (44.5%) |
Disability Status by Sex by Age in St. Helena Parish
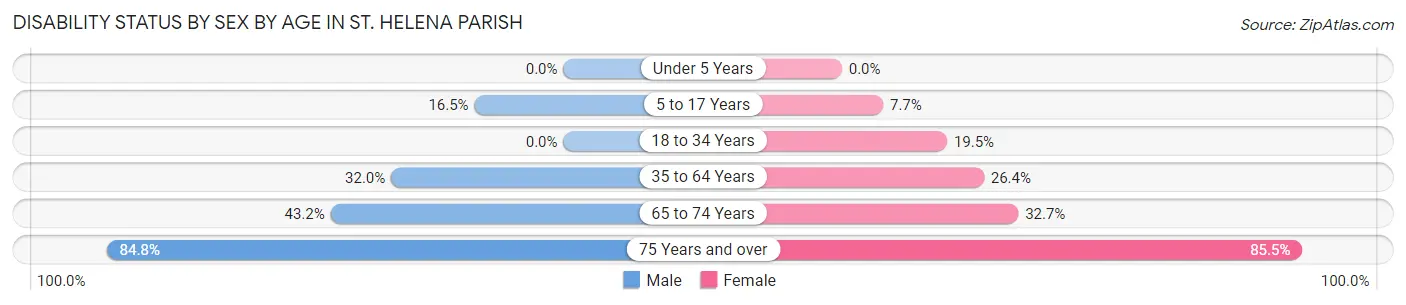
| Age Bracket | Male | Female |
| Under 5 Years | 0 (0.0%) | 0 (0.0%) |
| 5 to 17 Years | 132 (16.5%) | 64 (7.6%) |
| 18 to 34 Years | 0 (0.0%) | 237 (19.5%) |
| 35 to 64 Years | 617 (32.0%) | 545 (26.4%) |
| 65 to 74 Years | 252 (43.2%) | 202 (32.7%) |
| 75 Years and over | 334 (84.8%) | 488 (85.5%) |
Disability Class by Sex by Age in St. Helena Parish
Disability Class: Hearing Difficulty
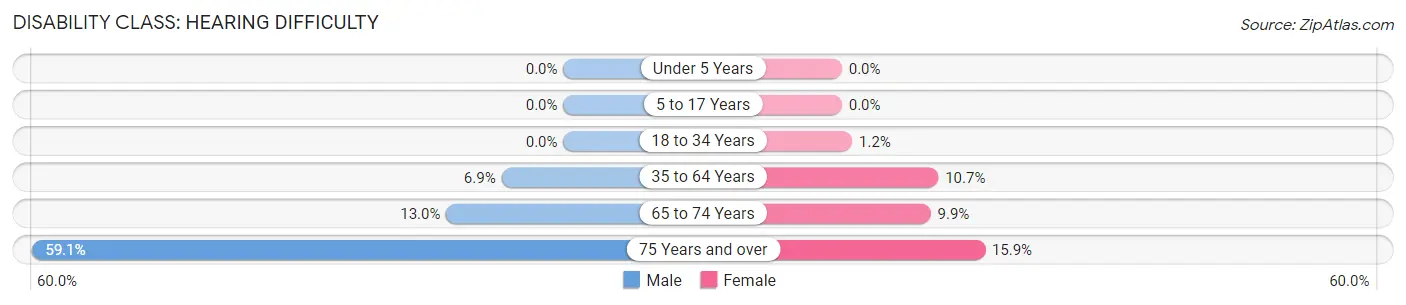
| Age Bracket | Male | Female |
| Under 5 Years | 0 (0.0%) | 0 (0.0%) |
| 5 to 17 Years | 0 (0.0%) | 0 (0.0%) |
| 18 to 34 Years | 0 (0.0%) | 14 (1.1%) |
| 35 to 64 Years | 133 (6.9%) | 222 (10.7%) |
| 65 to 74 Years | 76 (13.0%) | 61 (9.9%) |
| 75 Years and over | 233 (59.1%) | 91 (15.9%) |
Disability Class: Vision Difficulty
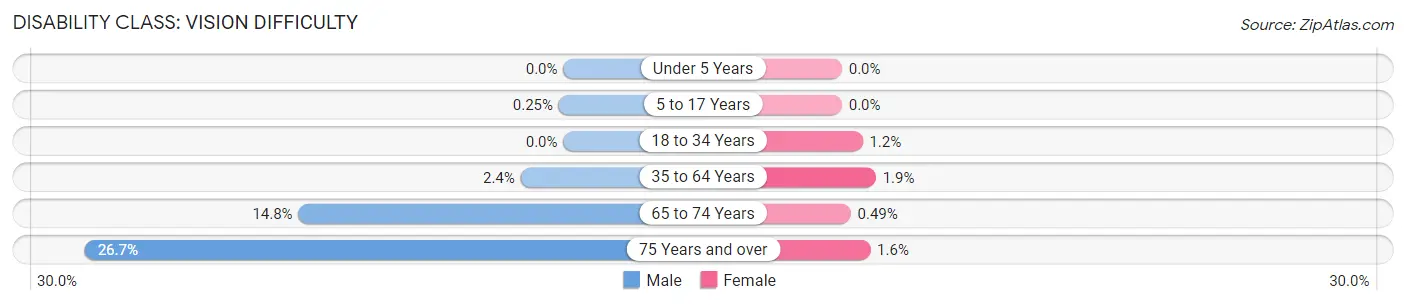
| Age Bracket | Male | Female |
| Under 5 Years | 0 (0.0%) | 0 (0.0%) |
| 5 to 17 Years | 2 (0.3%) | 0 (0.0%) |
| 18 to 34 Years | 0 (0.0%) | 14 (1.1%) |
| 35 to 64 Years | 46 (2.4%) | 39 (1.9%) |
| 65 to 74 Years | 86 (14.7%) | 3 (0.5%) |
| 75 Years and over | 105 (26.7%) | 9 (1.6%) |
Disability Class: Cognitive Difficulty
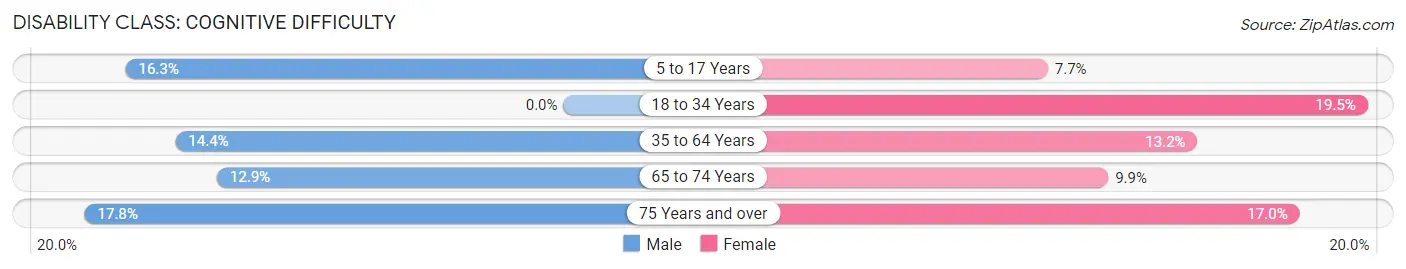
| Age Bracket | Male | Female |
| 5 to 17 Years | 130 (16.3%) | 64 (7.6%) |
| 18 to 34 Years | 0 (0.0%) | 237 (19.5%) |
| 35 to 64 Years | 278 (14.4%) | 273 (13.2%) |
| 65 to 74 Years | 75 (12.9%) | 61 (9.9%) |
| 75 Years and over | 70 (17.8%) | 97 (17.0%) |
Disability Class: Ambulatory Difficulty
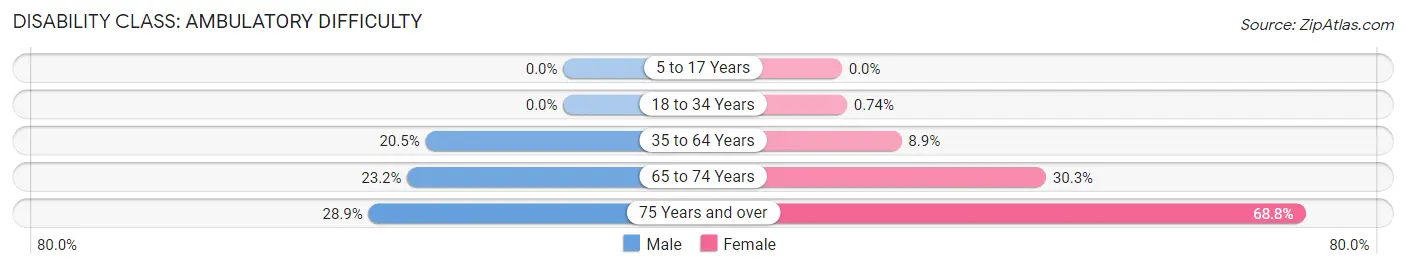
| Age Bracket | Male | Female |
| 5 to 17 Years | 0 (0.0%) | 0 (0.0%) |
| 18 to 34 Years | 0 (0.0%) | 9 (0.7%) |
| 35 to 64 Years | 395 (20.5%) | 183 (8.8%) |
| 65 to 74 Years | 135 (23.2%) | 187 (30.3%) |
| 75 Years and over | 114 (28.9%) | 393 (68.8%) |
Disability Class: Self-Care Difficulty
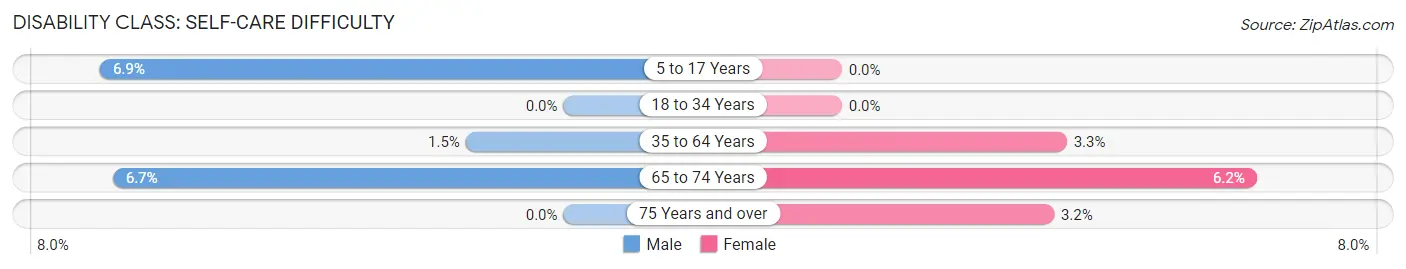
| Age Bracket | Male | Female |
| 5 to 17 Years | 55 (6.9%) | 0 (0.0%) |
| 18 to 34 Years | 0 (0.0%) | 0 (0.0%) |
| 35 to 64 Years | 28 (1.5%) | 69 (3.3%) |
| 65 to 74 Years | 39 (6.7%) | 38 (6.2%) |
| 75 Years and over | 0 (0.0%) | 18 (3.2%) |
Technology Access in St. Helena Parish
Computing Device Access in St. Helena Parish
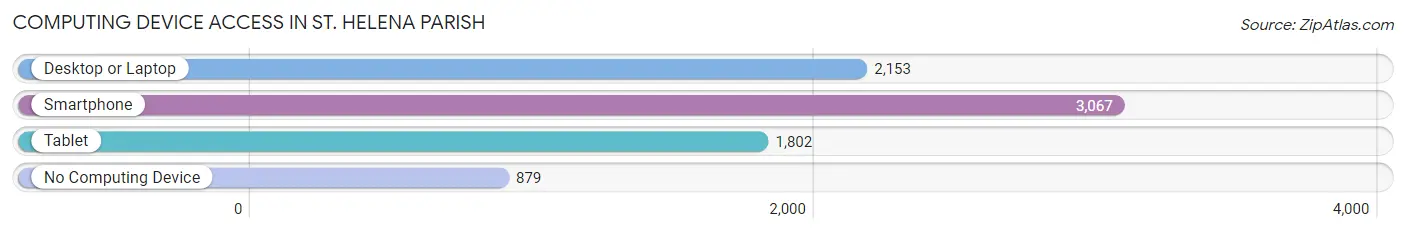
| Device Type | # Households | % Households |
| Desktop or Laptop | 2,153 | 53.8% |
| Smartphone | 3,067 | 76.6% |
| Tablet | 1,802 | 45.0% |
| No Computing Device | 879 | 22.0% |
| Total | 4,004 | 100.0% |
Internet Access in St. Helena Parish
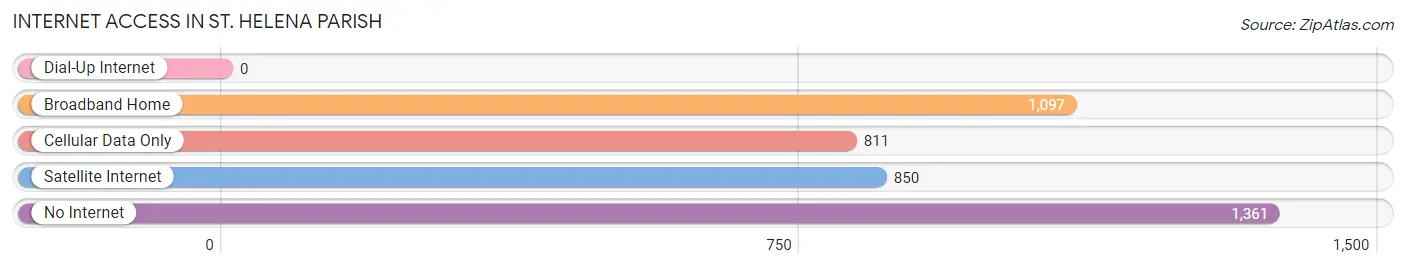
| Internet Type | # Households | % Households |
| Dial-Up Internet | 0 | 0.0% |
| Broadband Home | 1,097 | 27.4% |
| Cellular Data Only | 811 | 20.3% |
| Satellite Internet | 850 | 21.2% |
| No Internet | 1,361 | 34.0% |
| Total | 4,004 | 100.0% |
St. Helena Parish Summary
St. Helena Parish is a parish located in the southeastern part of the state of Louisiana. It is bordered by East Feliciana Parish to the north, Tangipahoa Parish to the east, Washington Parish to the south, and Amite and Wilkinson Counties in Mississippi to the west. The parish seat is Greensburg. As of the 2010 census, the population was 11,203.
Geography
St. Helena Parish is located in the southeastern part of the state of Louisiana. It is bordered by East Feliciana Parish to the north, Tangipahoa Parish to the east, Washington Parish to the south, and Amite and Wilkinson Counties in Mississippi to the west. The parish has a total area of 545 square miles, of which 543 square miles is land and 2 square miles (0.4%) is water.
The parish is located in the Piney Woods region of Louisiana. The terrain is mostly flat with some rolling hills. The soil is sandy and loamy. The parish is drained by the Tickfaw River, which flows through the center of the parish.
Economy
St. Helena Parish has a diversified economy. The main industries are timber, agriculture, and manufacturing. The timber industry is the largest employer in the parish, with over 1,000 people employed in the industry. The main crops grown in the parish are corn, soybeans, cotton, and rice. Manufacturing is also an important part of the economy, with companies such as Georgia-Pacific and International Paper having plants in the parish.
Demographics
As of the 2010 census, there were 11,203 people, 4,072 households, and 2,945 families residing in the parish. The population density was 20.6 people per square mile. There were 4,717 housing units at an average density of 8.7 per square mile. The racial makeup of the parish was 68.2% White, 29.3% African American, 0.4% Native American, 0.2% Asian, 0.1% Pacific Islander, 0.7% from other races, and 1.1% from two or more races. Hispanic or Latino of any race were 1.7% of the population.
There were 4,072 households, out of which 33.2% had children under the age of 18 living with them, 51.2% were married couples living together, 15.2% had a female householder with no husband present, and 28.7% were non-families. 24.3% of all households were made up of individuals, and 10.2% had someone living alone who was 65 years of age or older. The average household size was 2.63 and the average family size was 3.13.
In the parish, the population was spread out, with 25.7% under the age of 18, 8.7% from 18 to 24, 27.2% from 25 to 44, 24.2% from 45 to 64, and 14.2% who were 65 years of age or older. The median age was 37 years. For every 100 females, there were 97.2 males. For every 100 females age 18 and over, there were 94.2 males.
The median income for a household in the parish was $30,917, and the median income for a family was $37,813. Males had a median income of $31,945 versus $20,917 for females. The per capita income for the parish was $14,945. About 17.2% of families and 20.7% of the population were below the poverty line, including 28.2% of those under age 18 and 17.2% of those age 65 or over.
Conclusion
St. Helena Parish is a rural parish located in the southeastern part of the state of Louisiana. It is bordered by East Feliciana Parish to the north, Tangipahoa Parish to the east, Washington Parish to the south, and Amite and Wilkinson Counties in Mississippi to the west. The parish has a total area of 545 square miles, of which 543 square miles is land and 2 square miles (0.4%) is water. The parish has a diversified economy, with the main industries being timber, agriculture, and manufacturing. As of the 2010 census, the population was 11,203. The racial makeup of the parish was 68.2% White, 29.3% African American, 0.4% Native American, 0.2% Asian, 0.1% Pacific Islander, 0.7% from other races, and 1.1% from two or more races. The median income for a household in the parish was $30,917, and the median income for a family was $37,813. About 17.2% of families and 20.7% of the population were below the poverty line.
Common Questions
What is the Total Population of St. Helena Parish?
Total Population of St. Helena Parish is 10,872.
What is the Total Male Population of St. Helena Parish?
Total Male Population of St. Helena Parish is 5,400.
What is the Total Female Population of St. Helena Parish?
Total Female Population of St. Helena Parish is 5,472.
What is the Ratio of Males per 100 Females in St. Helena Parish?
There are 98.68 Males per 100 Females in St. Helena Parish.
What is the Ratio of Females per 100 Males in St. Helena Parish?
There are 101.33 Females per 100 Males in St. Helena Parish.
What is the Median Population Age in St. Helena Parish?
Median Population Age in St. Helena Parish is 42.2 Years.
What is the Average Family Size in St. Helena Parish
Average Family Size in St. Helena Parish is 3.7 People.
What is the Average Household Size in St. Helena Parish
Average Household Size in St. Helena Parish is 2.7 People.
What is Per Capita Income in St. Helena Parish?
Per Capita income in St. Helena Parish is $24,660.
What is the Median Family Income in St. Helena Parish?
Median Family Income in St. Helena Parish is $56,836.
What is the Median Household income in St. Helena Parish?
Median Household Income in St. Helena Parish is $46,402.
What is Income or Wage Gap in St. Helena Parish?
Income or Wage Gap in St. Helena Parish is 18.6%.
Women in St. Helena Parish earn 81.4 cents for every dollar earned by a man.
What is Inequality or Gini Index in St. Helena Parish?
Inequality or Gini Index in St. Helena Parish is 0.50.
How Large is the Labor Force in St. Helena Parish?
There are 4,949 People in the Labor Forcein in St. Helena Parish.
What is the Percentage of People in the Labor Force in St. Helena Parish?
55.8% of People are in the Labor Force in St. Helena Parish.
What is the Unemployment Rate in St. Helena Parish?
Unemployment Rate in St. Helena Parish is 21.5%.