St. Charles Parish, LA
St. Charles Parish Overview
52,191
TOTAL POPULATION
26,017
MALE POPULATION
26,174
FEMALE POPULATION
99.40
MALES / 100 FEMALES
100.60
FEMALES / 100 MALES
38.8
MEDIAN AGE
3.2
AVG FAMILY SIZE
2.8
AVG HOUSEHOLD SIZE
$38,220
PER CAPITA INCOME
$94,964
AVG FAMILY INCOME
$79,191
AVG HOUSEHOLD INCOME
34.1%
WAGE / INCOME GAP [ % ]
65.9¢/ $1
WAGE / INCOME GAP [ $ ]
$6,796
FAMILY INCOME DEFICIT
0.44
INEQUALITY / GINI INDEX
26,219
LABOR FORCE [ PEOPLE ]
63.9%
PERCENT IN LABOR FORCE
6.7%
UNEMPLOYMENT RATE
St. Charles Parish Area Codes
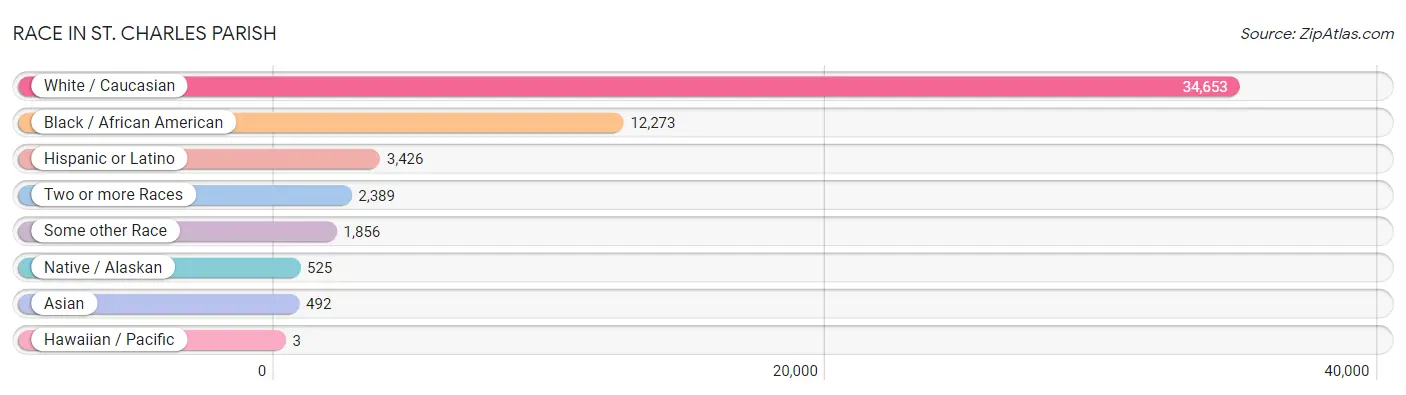
Race in St. Charles Parish
The most populous races in St. Charles Parish are White / Caucasian (34,653 | 66.4%), Black / African American (12,273 | 23.5%), and Hispanic or Latino (3,426 | 6.6%).
| Race | # Population | % Population |
| Asian | 492 | 0.9% |
| Black / African American | 12,273 | 23.5% |
| Hawaiian / Pacific | 3 | 0.0% |
| Hispanic or Latino | 3,426 | 6.6% |
| Native / Alaskan | 525 | 1.0% |
| White / Caucasian | 34,653 | 66.4% |
| Two or more Races | 2,389 | 4.6% |
| Some other Race | 1,856 | 3.6% |
| Total | 52,191 | 100.0% |
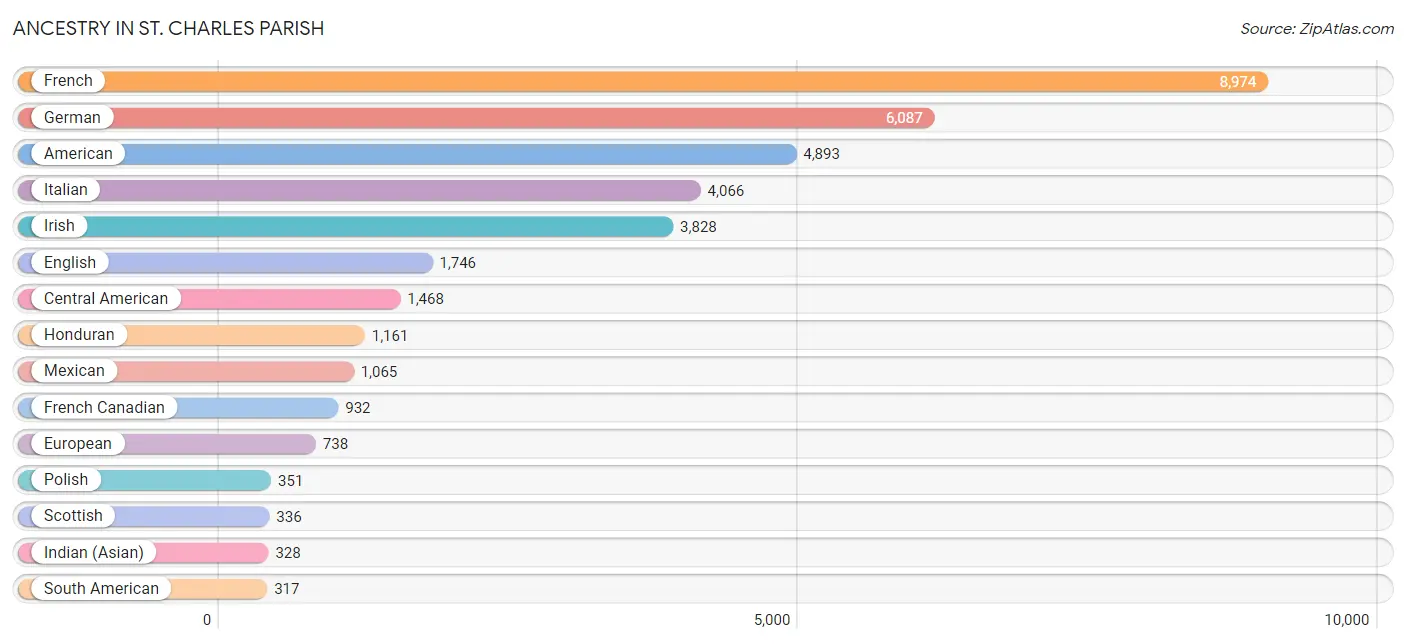
Ancestry in St. Charles Parish
The most populous ancestries reported in St. Charles Parish are French (8,974 | 17.2%), German (6,087 | 11.7%), American (4,893 | 9.4%), Italian (4,066 | 7.8%), and Irish (3,828 | 7.3%), together accounting for 53.3% of all St. Charles Parish residents.
| Ancestry | # Population | % Population |
| African | 138 | 0.3% |
| American | 4,893 | 9.4% |
| Arab | 164 | 0.3% |
| Australian | 100 | 0.2% |
| Austrian | 40 | 0.1% |
| Basque | 5 | 0.0% |
| Bhutanese | 21 | 0.0% |
| Brazilian | 14 | 0.0% |
| British | 154 | 0.3% |
| Burmese | 22 | 0.0% |
| Cajun | 291 | 0.6% |
| Canadian | 6 | 0.0% |
| Central American | 1,468 | 2.8% |
| Cherokee | 182 | 0.4% |
| Chickasaw | 15 | 0.0% |
| Choctaw | 8 | 0.0% |
| Colombian | 16 | 0.0% |
| Costa Rican | 54 | 0.1% |
| Creek | 51 | 0.1% |
| Croatian | 46 | 0.1% |
| Cuban | 113 | 0.2% |
| Czech | 9 | 0.0% |
| Danish | 7 | 0.0% |
| Dominican | 65 | 0.1% |
| Dutch | 21 | 0.0% |
| Eastern European | 6 | 0.0% |
| Ecuadorian | 264 | 0.5% |
| Egyptian | 47 | 0.1% |
| English | 1,746 | 3.4% |
| European | 738 | 1.4% |
| French | 8,974 | 17.2% |
| French American Indian | 7 | 0.0% |
| French Canadian | 932 | 1.8% |
| German | 6,087 | 11.7% |
| Greek | 42 | 0.1% |
| Guatemalan | 63 | 0.1% |
| Haitian | 47 | 0.1% |
| Honduran | 1,161 | 2.2% |
| Houma | 244 | 0.5% |
| Hungarian | 15 | 0.0% |
| Indian (Asian) | 328 | 0.6% |
| Iranian | 27 | 0.1% |
| Irish | 3,828 | 7.3% |
| Israeli | 9 | 0.0% |
| Italian | 4,066 | 7.8% |
| Jamaican | 4 | 0.0% |
| Korean | 141 | 0.3% |
| Latvian | 54 | 0.1% |
| Lithuanian | 33 | 0.1% |
| Lumbee | 73 | 0.1% |
| Mexican | 1,065 | 2.0% |
| Native Hawaiian | 25 | 0.1% |
| Nicaraguan | 112 | 0.2% |
| Nigerian | 7 | 0.0% |
| Northern European | 68 | 0.1% |
| Norwegian | 119 | 0.2% |
| Panamanian | 27 | 0.1% |
| Polish | 351 | 0.7% |
| Portuguese | 72 | 0.1% |
| Potawatomi | 6 | 0.0% |
| Puerto Rican | 89 | 0.2% |
| Russian | 67 | 0.1% |
| Salvadoran | 17 | 0.0% |
| Samoan | 22 | 0.0% |
| Scandinavian | 54 | 0.1% |
| Scotch-Irish | 135 | 0.3% |
| Scottish | 336 | 0.6% |
| Seminole | 103 | 0.2% |
| South African | 72 | 0.1% |
| South American | 317 | 0.6% |
| Spanish | 130 | 0.3% |
| Sri Lankan | 168 | 0.3% |
| Subsaharan African | 217 | 0.4% |
| Swedish | 102 | 0.2% |
| Swiss | 32 | 0.1% |
| Syrian | 4 | 0.0% |
| Thai | 39 | 0.1% |
| Venezuelan | 37 | 0.1% |
| Welsh | 81 | 0.2% |
| Yaqui | 45 | 0.1% | View All 80 Rows |
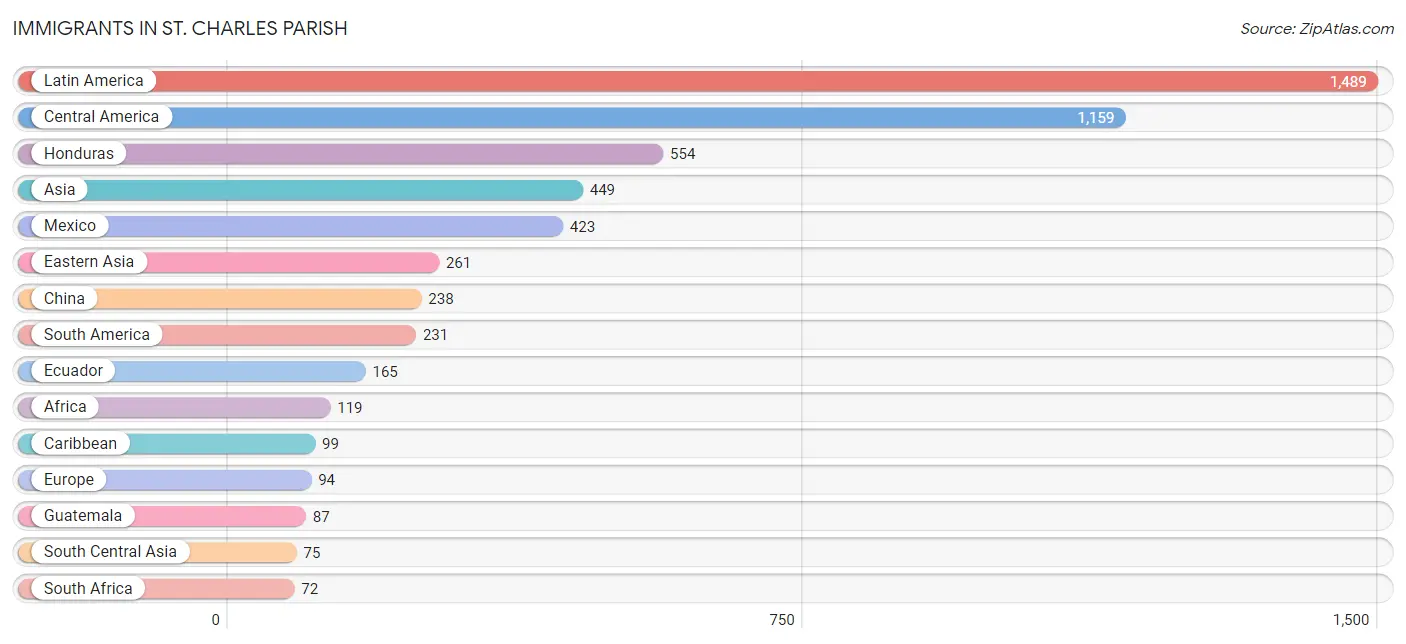
Immigrants in St. Charles Parish
The most numerous immigrant groups reported in St. Charles Parish came from Latin America (1,489 | 2.9%), Central America (1,159 | 2.2%), Honduras (554 | 1.1%), Asia (449 | 0.9%), and Mexico (423 | 0.8%), together accounting for 7.8% of all St. Charles Parish residents.
| Immigration Origin | # Population | % Population |
| Africa | 119 | 0.2% |
| Asia | 449 | 0.9% |
| Australia | 33 | 0.1% |
| Canada | 13 | 0.0% |
| Caribbean | 99 | 0.2% |
| Central America | 1,159 | 2.2% |
| China | 238 | 0.5% |
| Colombia | 8 | 0.0% |
| Costa Rica | 15 | 0.0% |
| Croatia | 23 | 0.0% |
| Cuba | 33 | 0.1% |
| Dominican Republic | 51 | 0.1% |
| Eastern Asia | 261 | 0.5% |
| Eastern Europe | 23 | 0.0% |
| Ecuador | 165 | 0.3% |
| Egypt | 47 | 0.1% |
| Europe | 94 | 0.2% |
| France | 6 | 0.0% |
| Germany | 26 | 0.1% |
| Greece | 10 | 0.0% |
| Guatemala | 87 | 0.2% |
| Guyana | 21 | 0.0% |
| Honduras | 554 | 1.1% |
| India | 2 | 0.0% |
| Iran | 27 | 0.1% |
| Israel | 26 | 0.1% |
| Italy | 29 | 0.1% |
| Japan | 23 | 0.0% |
| Kazakhstan | 46 | 0.1% |
| Kuwait | 26 | 0.1% |
| Latin America | 1,489 | 2.9% |
| Mexico | 423 | 0.8% |
| Nicaragua | 53 | 0.1% |
| Northern Africa | 47 | 0.1% |
| Oceania | 33 | 0.1% |
| Panama | 27 | 0.1% |
| Philippines | 14 | 0.0% |
| South Africa | 72 | 0.1% |
| South America | 231 | 0.4% |
| South Central Asia | 75 | 0.1% |
| South Eastern Asia | 61 | 0.1% |
| Southern Europe | 39 | 0.1% |
| Taiwan | 23 | 0.0% |
| Trinidad and Tobago | 15 | 0.0% |
| Venezuela | 37 | 0.1% |
| Vietnam | 47 | 0.1% |
| Western Asia | 52 | 0.1% |
| Western Europe | 32 | 0.1% | View All 48 Rows |
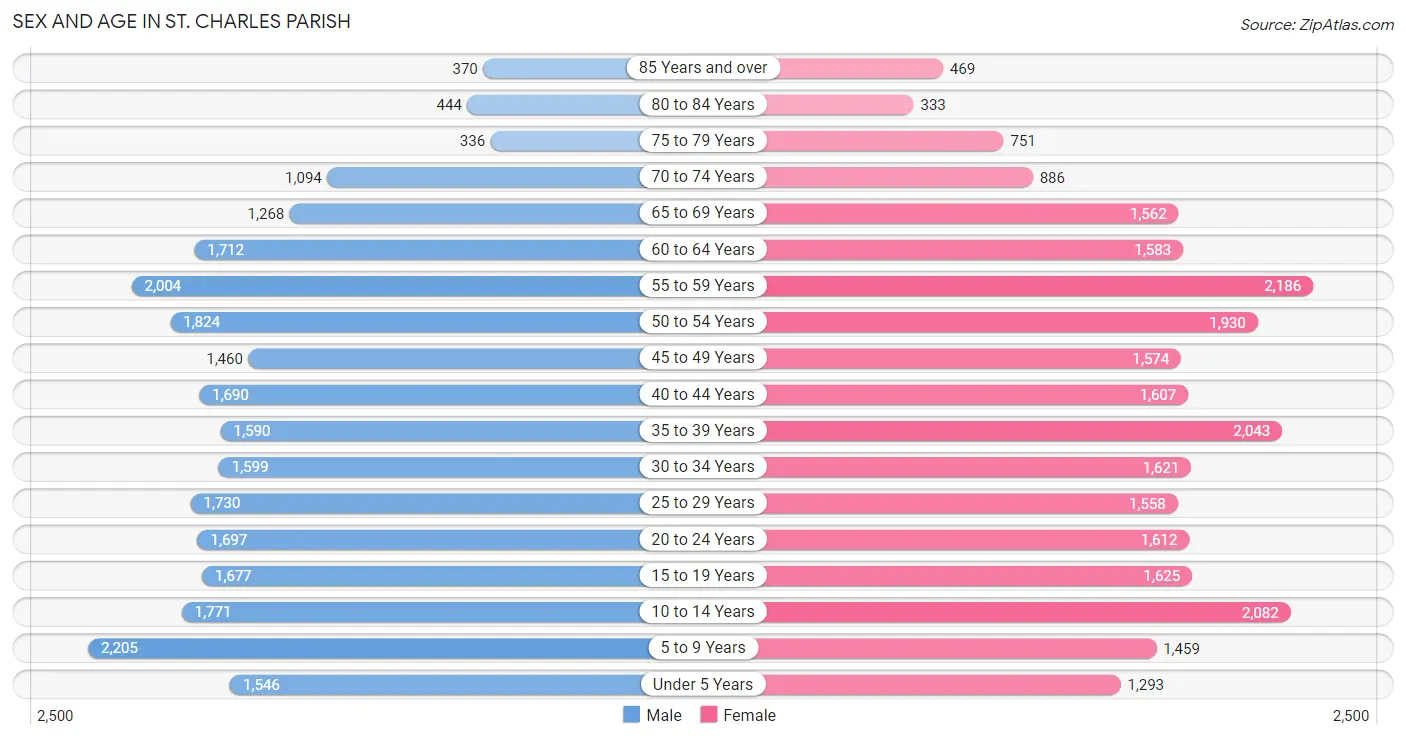
Sex and Age in St. Charles Parish
Sex and Age in St. Charles Parish
The most populous age groups in St. Charles Parish are 5 to 9 Years (2,205 | 8.5%) for men and 55 to 59 Years (2,186 | 8.4%) for women.
| Age Bracket | Male | Female |
| Under 5 Years | 1,546 (5.9%) | 1,293 (4.9%) |
| 5 to 9 Years | 2,205 (8.5%) | 1,459 (5.6%) |
| 10 to 14 Years | 1,771 (6.8%) | 2,082 (8.0%) |
| 15 to 19 Years | 1,677 (6.5%) | 1,625 (6.2%) |
| 20 to 24 Years | 1,697 (6.5%) | 1,612 (6.2%) |
| 25 to 29 Years | 1,730 (6.7%) | 1,558 (5.9%) |
| 30 to 34 Years | 1,599 (6.1%) | 1,621 (6.2%) |
| 35 to 39 Years | 1,590 (6.1%) | 2,043 (7.8%) |
| 40 to 44 Years | 1,690 (6.5%) | 1,607 (6.1%) |
| 45 to 49 Years | 1,460 (5.6%) | 1,574 (6.0%) |
| 50 to 54 Years | 1,824 (7.0%) | 1,930 (7.4%) |
| 55 to 59 Years | 2,004 (7.7%) | 2,186 (8.4%) |
| 60 to 64 Years | 1,712 (6.6%) | 1,583 (6.0%) |
| 65 to 69 Years | 1,268 (4.9%) | 1,562 (6.0%) |
| 70 to 74 Years | 1,094 (4.2%) | 886 (3.4%) |
| 75 to 79 Years | 336 (1.3%) | 751 (2.9%) |
| 80 to 84 Years | 444 (1.7%) | 333 (1.3%) |
| 85 Years and over | 370 (1.4%) | 469 (1.8%) |
| Total | 26,017 (100.0%) | 26,174 (100.0%) |
Families and Households in St. Charles Parish
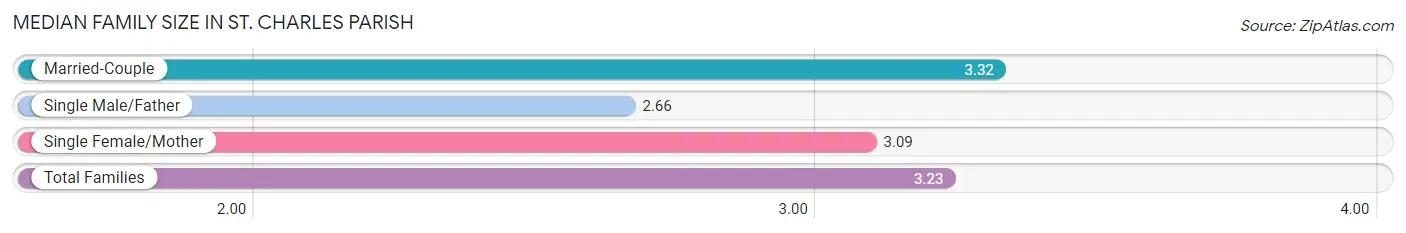
Median Family Size in St. Charles Parish
The median family size in St. Charles Parish is 3.23 persons per family, with married-couple families (10,063 | 72.6%) accounting for the largest median family size of 3.32 persons per family. On the other hand, single male/father families (887 | 6.4%) represent the smallest median family size with 2.66 persons per family.
| Family Type | # Families | Family Size |
| Married-Couple | 10,063 (72.6%) | 3.32 |
| Single Male/Father | 887 (6.4%) | 2.66 |
| Single Female/Mother | 2,909 (21.0%) | 3.09 |
| Total Families | 13,859 (100.0%) | 3.23 |
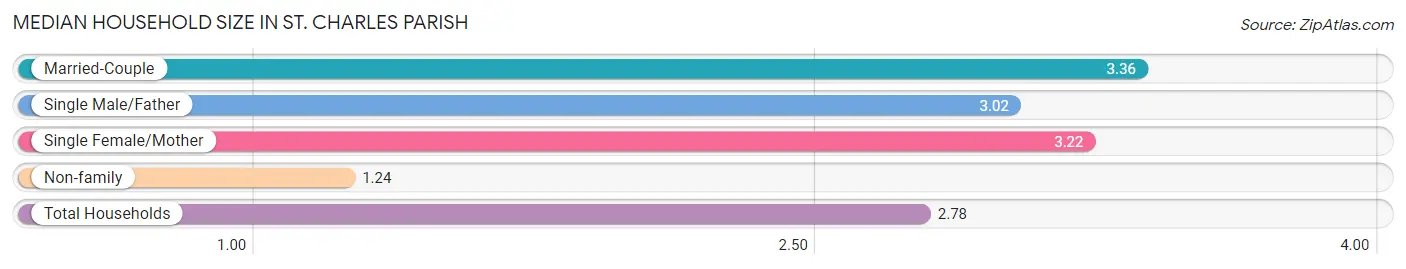
Median Household Size in St. Charles Parish
The median household size in St. Charles Parish is 2.78 persons per household, with married-couple households (10,063 | 54.1%) accounting for the largest median household size of 3.36 persons per household. non-family households (4,732 | 25.5%) represent the smallest median household size with 1.24 persons per household.
| Household Type | # Households | Household Size |
| Married-Couple | 10,063 (54.1%) | 3.36 |
| Single Male/Father | 887 (4.8%) | 3.02 |
| Single Female/Mother | 2,909 (15.7%) | 3.22 |
| Non-family | 4,732 (25.5%) | 1.24 |
| Total Households | 18,591 (100.0%) | 2.78 |
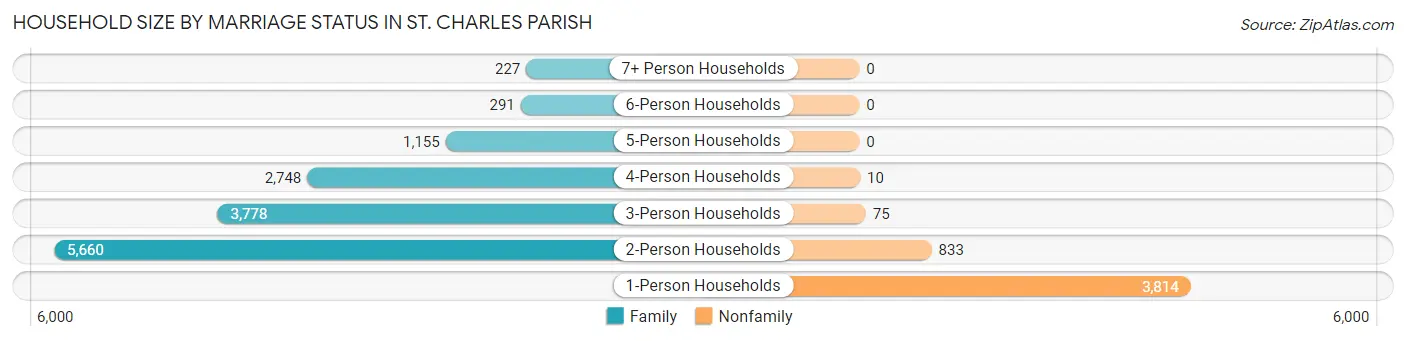
Household Size by Marriage Status in St. Charles Parish
Out of a total of 18,591 households in St. Charles Parish, 13,859 (74.6%) are family households, while 4,732 (25.5%) are nonfamily households. The most numerous type of family households are 2-person households, comprising 5,660, and the most common type of nonfamily households are 1-person households, comprising 3,814.
| Household Size | Family Households | Nonfamily Households |
| 1-Person Households | - | 3,814 (20.5%) |
| 2-Person Households | 5,660 (30.4%) | 833 (4.5%) |
| 3-Person Households | 3,778 (20.3%) | 75 (0.4%) |
| 4-Person Households | 2,748 (14.8%) | 10 (0.1%) |
| 5-Person Households | 1,155 (6.2%) | 0 (0.0%) |
| 6-Person Households | 291 (1.6%) | 0 (0.0%) |
| 7+ Person Households | 227 (1.2%) | 0 (0.0%) |
| Total | 13,859 (74.6%) | 4,732 (25.5%) |
Female Fertility in St. Charles Parish
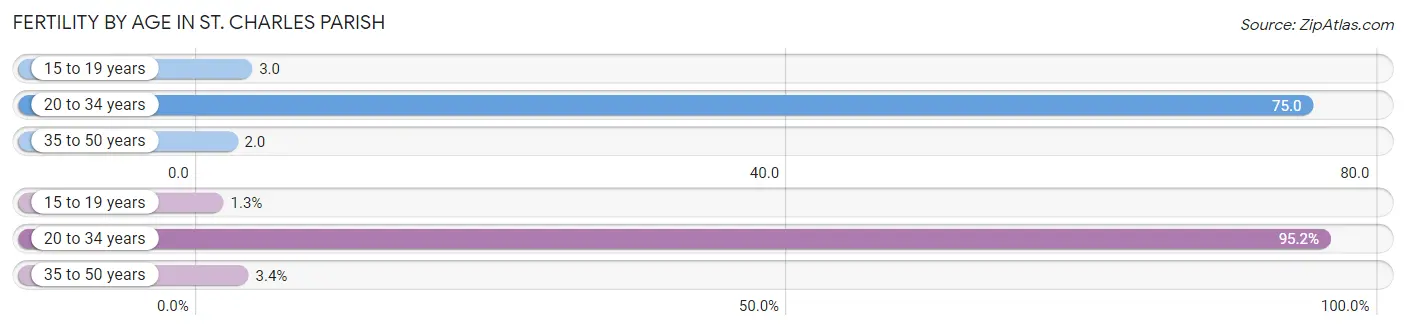
Fertility by Age in St. Charles Parish
Average fertility rate in St. Charles Parish is 31.0 births per 1,000 women. Women in the age bracket of 20 to 34 years have the highest fertility rate with 75.0 births per 1,000 women. Women in the age bracket of 20 to 34 years acount for 95.2% of all women with births.
| Age Bracket | Women with Births | Births / 1,000 Women |
| 15 to 19 years | 5 (1.3%) | 3.0 |
| 20 to 34 years | 360 (95.2%) | 75.0 |
| 35 to 50 years | 13 (3.4%) | 2.0 |
| Total | 378 (100.0%) | 31.0 |
Fertility by Age by Marriage Status in St. Charles Parish
72.5% of women with births (378) in St. Charles Parish are married. The highest percentage of unmarried women with births falls into 35 to 50 years age bracket with 61.5% of them unmarried at the time of birth, while the lowest percentage of unmarried women with births belong to 15 to 19 years age bracket with 0.0% of them unmarried.
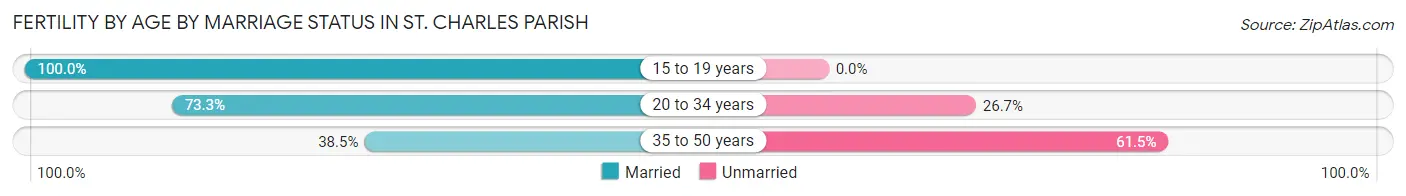
| Age Bracket | Married | Unmarried |
| 15 to 19 years | 5 (100.0%) | 0 (0.0%) |
| 20 to 34 years | 264 (73.3%) | 96 (26.7%) |
| 35 to 50 years | 5 (38.5%) | 8 (61.5%) |
| Total | 274 (72.5%) | 104 (27.5%) |
Fertility by Education in St. Charles Parish
Average fertility rate in St. Charles Parish is 31.0 births per 1,000 women. Women with the education attainment of graduate degree have the highest fertility rate of 97.0 births per 1,000 women, while women with the education attainment of less than high school have the lowest fertility at 1.0 births per 1,000 women. Women with the education attainment of college or associate's degree represent 31.8% of all women with births.
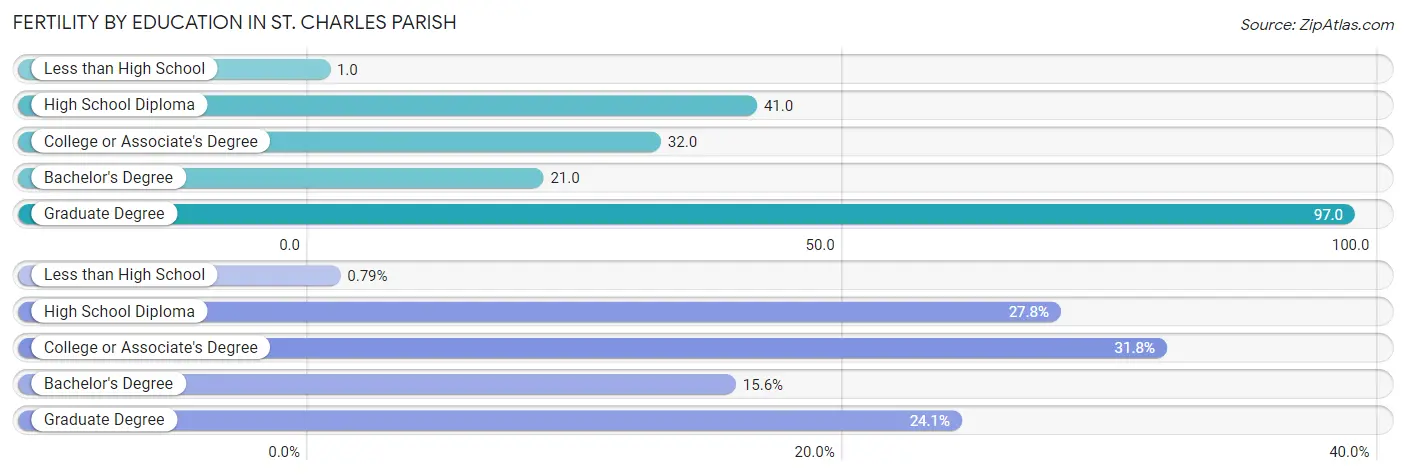
| Educational Attainment | Women with Births | Births / 1,000 Women |
| Less than High School | 3 (0.8%) | 1.0 |
| High School Diploma | 105 (27.8%) | 41.0 |
| College or Associate's Degree | 120 (31.8%) | 32.0 |
| Bachelor's Degree | 59 (15.6%) | 21.0 |
| Graduate Degree | 91 (24.1%) | 97.0 |
| Total | 378 (100.0%) | 31.0 |
Fertility by Education by Marriage Status in St. Charles Parish
27.5% of women with births in St. Charles Parish are unmarried. Women with the educational attainment of less than high school are most likely to be married with 100.0% of them married at childbirth, while women with the educational attainment of high school diploma are least likely to be married with 64.8% of them unmarried at childbirth.
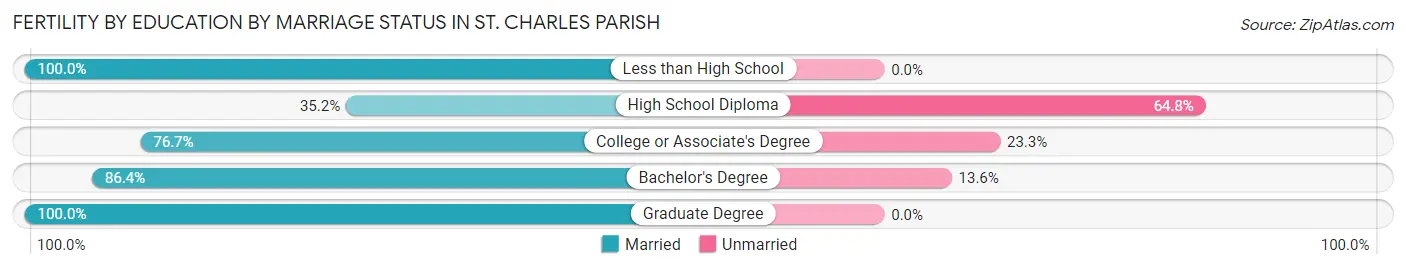
| Educational Attainment | Married | Unmarried |
| Less than High School | 3 (100.0%) | 0 (0.0%) |
| High School Diploma | 37 (35.2%) | 68 (64.8%) |
| College or Associate's Degree | 92 (76.7%) | 28 (23.3%) |
| Bachelor's Degree | 51 (86.4%) | 8 (13.6%) |
| Graduate Degree | 91 (100.0%) | 0 (0.0%) |
| Total | 274 (72.5%) | 104 (27.5%) |
Income in St. Charles Parish
Income Overview in St. Charles Parish
Per Capita Income in St. Charles Parish is $38,220, while median incomes of families and households are $94,964 and $79,191 respectively.
| Characteristic | Number | Measure |
| Per Capita Income | 52,191 | $38,220 |
| Median Family Income | 13,859 | $94,964 |
| Mean Family Income | 13,859 | $113,222 |
| Median Household Income | 18,591 | $79,191 |
| Mean Household Income | 18,591 | $103,356 |
| Income Deficit | 13,859 | $6,796 |
| Wage / Income Gap (%) | 52,191 | 34.07% |
| Wage / Income Gap ($) | 52,191 | 65.93¢ per $1 |
| Gini / Inequality Index | 52,191 | 0.44 |
Earnings by Sex in St. Charles Parish
Average Earnings in St. Charles Parish are $46,184, $55,903 for men and $36,858 for women, a difference of 34.1%.
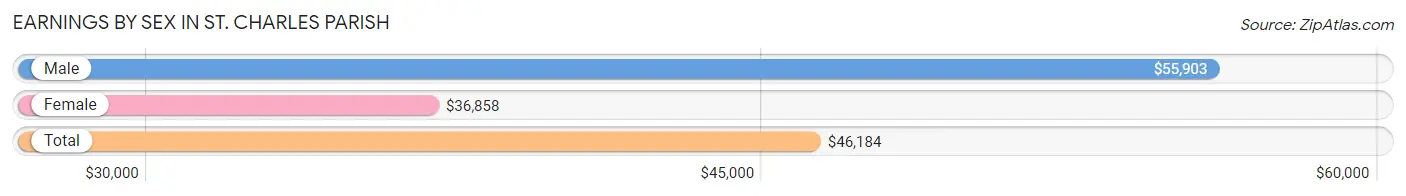
| Sex | Number | Average Earnings |
| Male | 13,890 (51.9%) | $55,903 |
| Female | 12,878 (48.1%) | $36,858 |
| Total | 26,768 (100.0%) | $46,184 |
Earnings by Sex by Income Bracket in St. Charles Parish
The most common earnings brackets in St. Charles Parish are $100,000+ for men (3,054 | 22.0%) and $55,000 to $64,999 for women (1,354 | 10.5%).
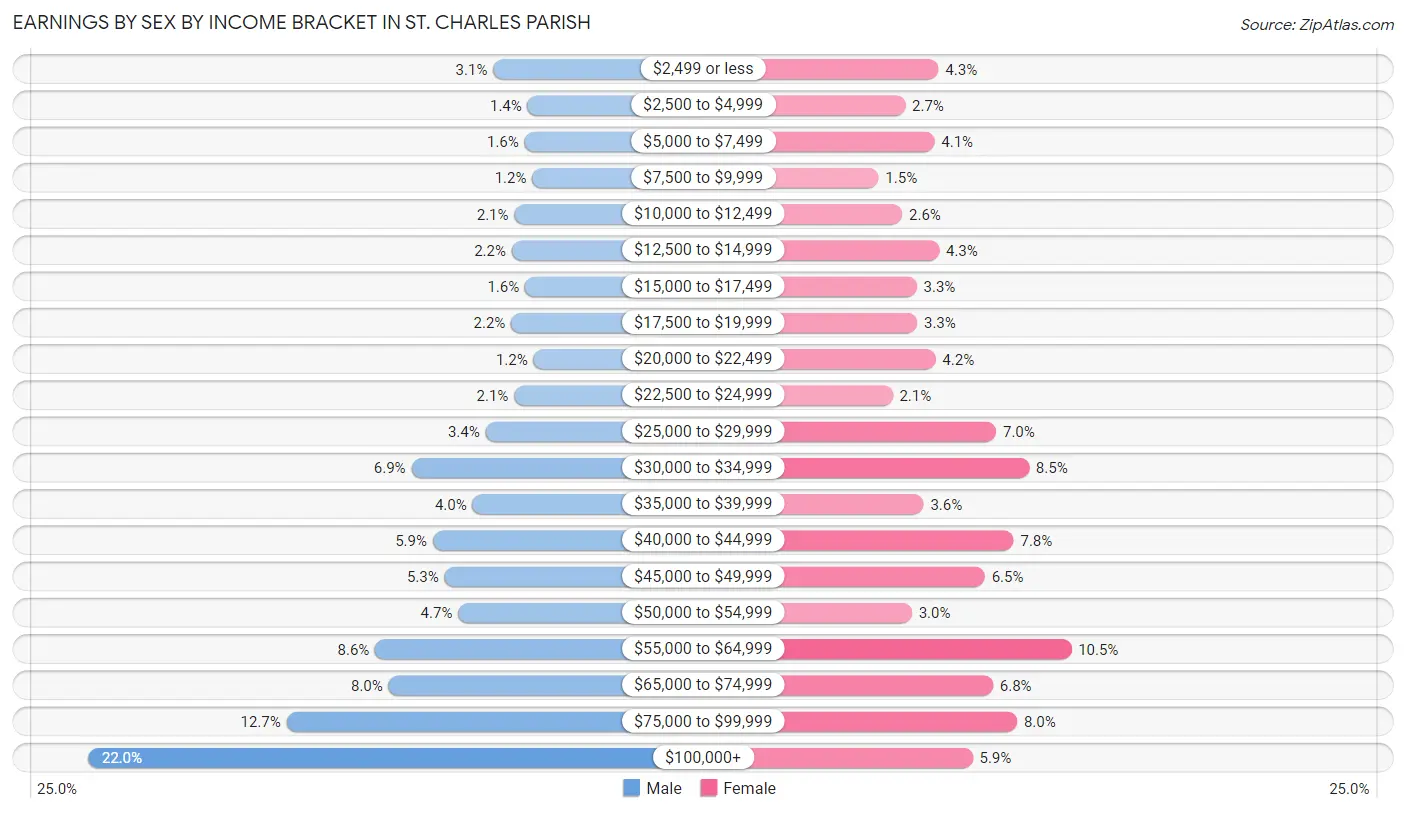
| Income | Male | Female |
| $2,499 or less | 423 (3.0%) | 552 (4.3%) |
| $2,500 to $4,999 | 200 (1.4%) | 352 (2.7%) |
| $5,000 to $7,499 | 220 (1.6%) | 528 (4.1%) |
| $7,500 to $9,999 | 170 (1.2%) | 191 (1.5%) |
| $10,000 to $12,499 | 286 (2.1%) | 334 (2.6%) |
| $12,500 to $14,999 | 303 (2.2%) | 556 (4.3%) |
| $15,000 to $17,499 | 217 (1.6%) | 421 (3.3%) |
| $17,500 to $19,999 | 307 (2.2%) | 424 (3.3%) |
| $20,000 to $22,499 | 161 (1.2%) | 535 (4.2%) |
| $22,500 to $24,999 | 288 (2.1%) | 275 (2.1%) |
| $25,000 to $29,999 | 473 (3.4%) | 900 (7.0%) |
| $30,000 to $34,999 | 956 (6.9%) | 1,099 (8.5%) |
| $35,000 to $39,999 | 558 (4.0%) | 462 (3.6%) |
| $40,000 to $44,999 | 817 (5.9%) | 1,006 (7.8%) |
| $45,000 to $49,999 | 741 (5.3%) | 832 (6.5%) |
| $50,000 to $54,999 | 652 (4.7%) | 391 (3.0%) |
| $55,000 to $64,999 | 1,192 (8.6%) | 1,354 (10.5%) |
| $65,000 to $74,999 | 1,104 (8.0%) | 881 (6.8%) |
| $75,000 to $99,999 | 1,768 (12.7%) | 1,027 (8.0%) |
| $100,000+ | 3,054 (22.0%) | 758 (5.9%) |
| Total | 13,890 (100.0%) | 12,878 (100.0%) |
Earnings by Sex by Educational Attainment in St. Charles Parish
Average earnings in St. Charles Parish are $60,884 for men and $42,882 for women, a difference of 29.6%. Men with an educational attainment of bachelor's degree enjoy the highest average annual earnings of $79,390, while those with less than high school education earn the least with $45,753. Women with an educational attainment of bachelor's degree earn the most with the average annual earnings of $59,564, while those with less than high school education have the smallest earnings of $27,969.
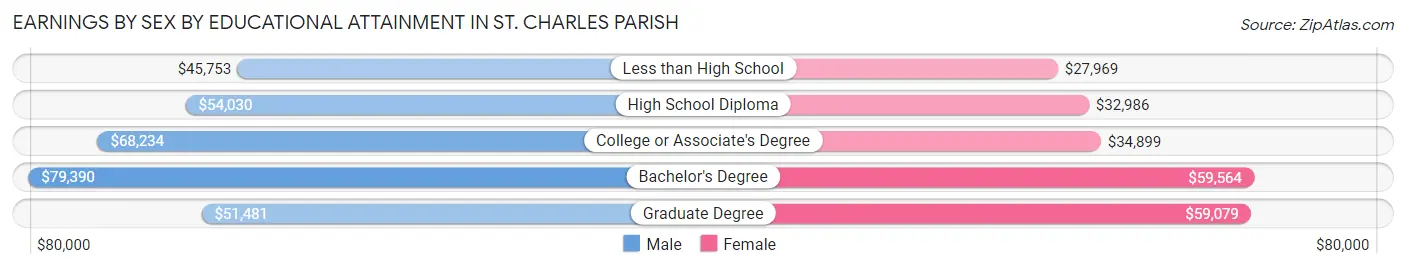
| Educational Attainment | Male Income | Female Income |
| Less than High School | $45,753 | $27,969 |
| High School Diploma | $54,030 | $32,986 |
| College or Associate's Degree | $68,234 | $34,899 |
| Bachelor's Degree | $79,390 | $59,564 |
| Graduate Degree | $51,481 | $59,079 |
| Total | $60,884 | $42,882 |
Family Income in St. Charles Parish
Family Income Brackets in St. Charles Parish
According to the St. Charles Parish family income data, there are 2,994 families falling into the $100,000 to $149,999 income range, which is the most common income bracket and makes up 21.6% of all families. Conversely, the less than $10,000 income bracket is the least frequent group with only 180 families (1.3%) belonging to this category.
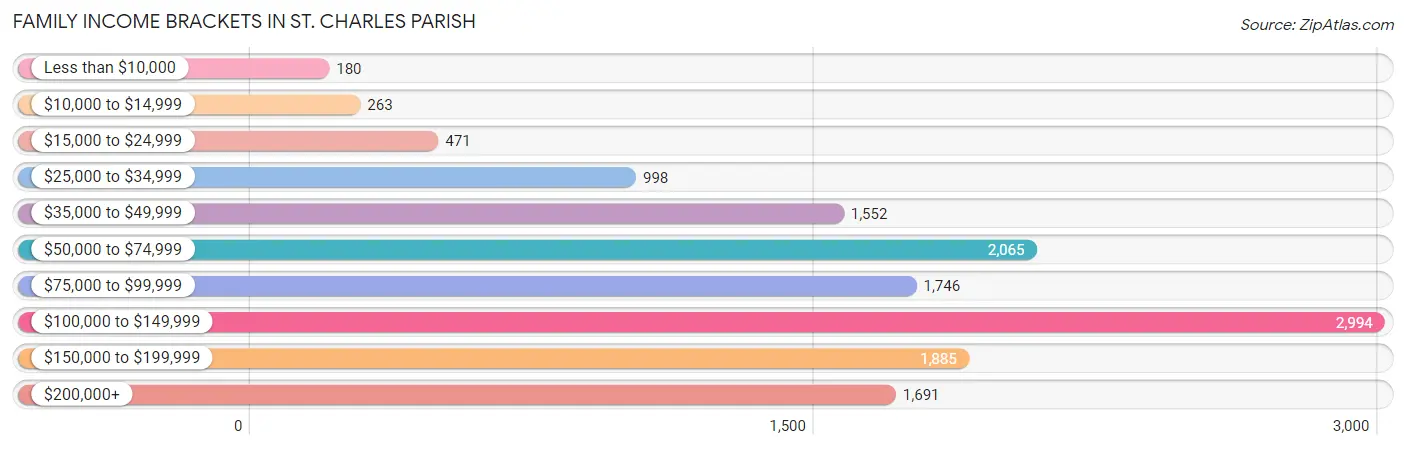
| Income Bracket | # Families | % Families |
| Less than $10,000 | 180 | 1.3% |
| $10,000 to $14,999 | 263 | 1.9% |
| $15,000 to $24,999 | 471 | 3.4% |
| $25,000 to $34,999 | 998 | 7.2% |
| $35,000 to $49,999 | 1,552 | 11.2% |
| $50,000 to $74,999 | 2,065 | 14.9% |
| $75,000 to $99,999 | 1,746 | 12.6% |
| $100,000 to $149,999 | 2,994 | 21.6% |
| $150,000 to $199,999 | 1,885 | 13.6% |
| $200,000+ | 1,691 | 12.2% |
Family Income by Famaliy Size in St. Charles Parish
7+ person families (198 | 1.4%) account for the highest median family income in St. Charles Parish with $173,000 per family, while 2-person families (6,097 | 44.0%) have the highest median income of $39,202 per family member.
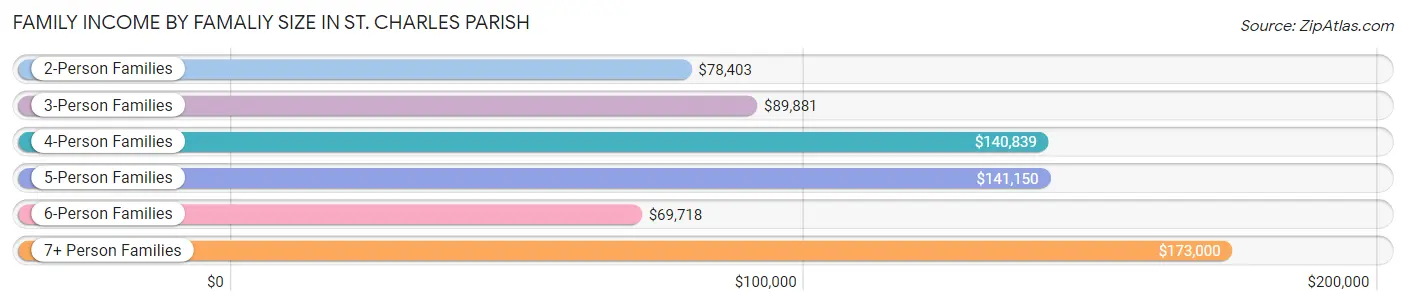
| Income Bracket | # Families | Median Income |
| 2-Person Families | 6,097 (44.0%) | $78,403 |
| 3-Person Families | 3,626 (26.2%) | $89,881 |
| 4-Person Families | 2,577 (18.6%) | $140,839 |
| 5-Person Families | 1,143 (8.3%) | $141,150 |
| 6-Person Families | 218 (1.6%) | $69,718 |
| 7+ Person Families | 198 (1.4%) | $173,000 |
| Total | 13,859 (100.0%) | $94,964 |
Family Income by Number of Earners in St. Charles Parish
The median family income in St. Charles Parish is $94,964, with families comprising 3+ earners (1,413) having the highest median family income of $166,774, while families with no earners (1,744) have the lowest median family income of $45,878, accounting for 10.2% and 12.6% of families, respectively.
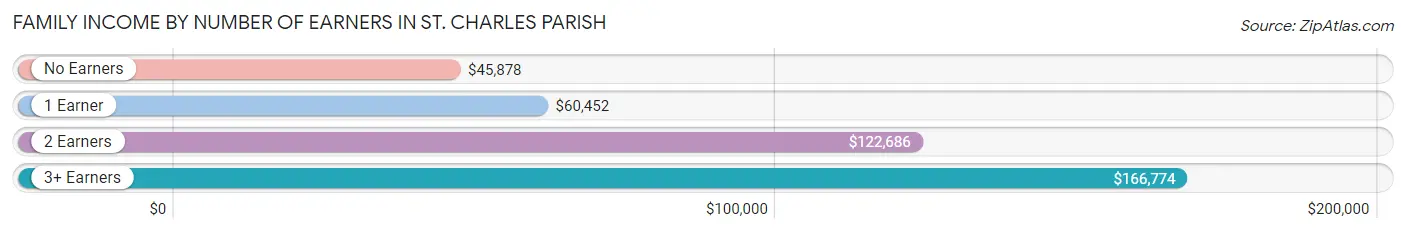
| Number of Earners | # Families | Median Income |
| No Earners | 1,744 (12.6%) | $45,878 |
| 1 Earner | 4,757 (34.3%) | $60,452 |
| 2 Earners | 5,945 (42.9%) | $122,686 |
| 3+ Earners | 1,413 (10.2%) | $166,774 |
| Total | 13,859 (100.0%) | $94,964 |
Household Income in St. Charles Parish
Household Income Brackets in St. Charles Parish
With 3,458 households falling in the category, the $100,000 to $149,999 income range is the most frequent in St. Charles Parish, accounting for 18.6% of all households. In contrast, only 614 households (3.3%) fall into the $10,000 to $14,999 income bracket, making it the least populous group.
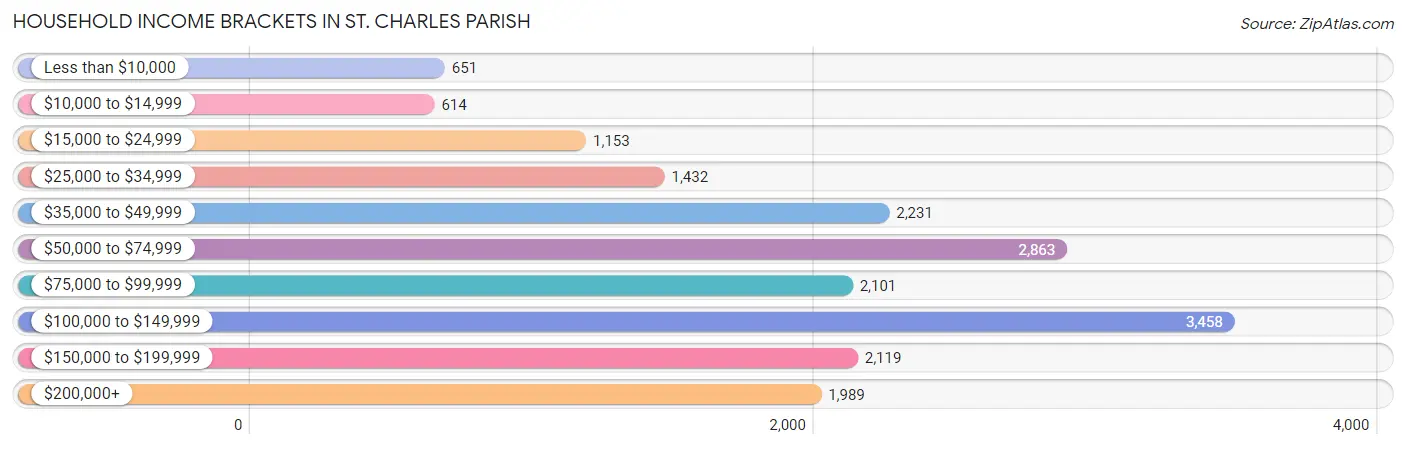
| Income Bracket | # Households | % Households |
| Less than $10,000 | 651 | 3.5% |
| $10,000 to $14,999 | 614 | 3.3% |
| $15,000 to $24,999 | 1,153 | 6.2% |
| $25,000 to $34,999 | 1,432 | 7.7% |
| $35,000 to $49,999 | 2,231 | 12.0% |
| $50,000 to $74,999 | 2,863 | 15.4% |
| $75,000 to $99,999 | 2,101 | 11.3% |
| $100,000 to $149,999 | 3,458 | 18.6% |
| $150,000 to $199,999 | 2,119 | 11.4% |
| $200,000+ | 1,989 | 10.7% |
Household Income by Householder Age in St. Charles Parish
The median household income in St. Charles Parish is $79,191, with the highest median household income of $98,365 found in the 45 to 64 years age bracket for the primary householder. A total of 7,909 households (42.5%) fall into this category. Meanwhile, the 15 to 24 years age bracket for the primary householder has the lowest median household income of $31,997, with 301 households (1.6%) in this group.
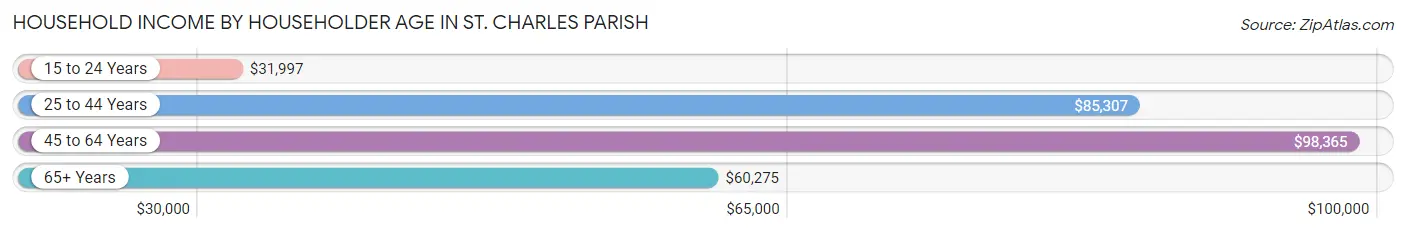
| Income Bracket | # Households | Median Income |
| 15 to 24 Years | 301 (1.6%) | $31,997 |
| 25 to 44 Years | 5,934 (31.9%) | $85,307 |
| 45 to 64 Years | 7,909 (42.5%) | $98,365 |
| 65+ Years | 4,447 (23.9%) | $60,275 |
| Total | 18,591 (100.0%) | $79,191 |
Poverty in St. Charles Parish
Income Below Poverty by Sex and Age in St. Charles Parish
With 10.7% poverty level for males and 9.7% for females among the residents of St. Charles Parish, under 5 year old males and under 5 year old females are the most vulnerable to poverty, with 588 males (38.6%) and 264 females (20.7%) in their respective age groups living below the poverty level.
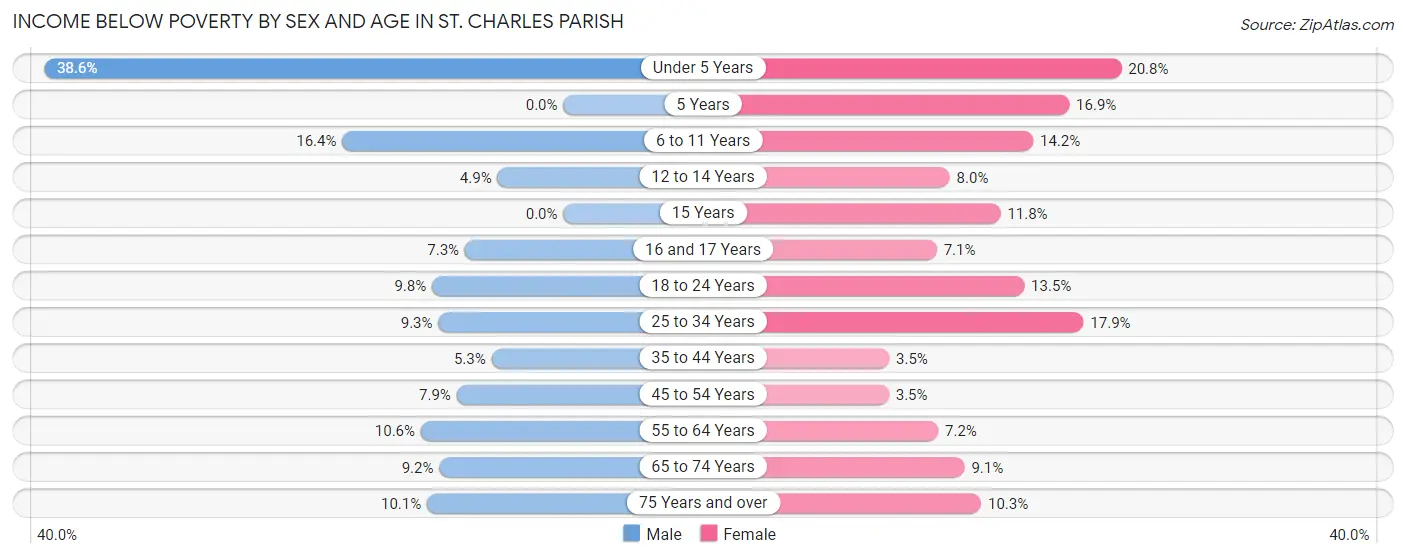
| Age Bracket | Male | Female |
| Under 5 Years | 588 (38.6%) | 264 (20.7%) |
| 5 Years | 0 (0.0%) | 27 (16.9%) |
| 6 to 11 Years | 379 (16.4%) | 276 (14.2%) |
| 12 to 14 Years | 52 (4.9%) | 114 (8.0%) |
| 15 Years | 0 (0.0%) | 39 (11.8%) |
| 16 and 17 Years | 50 (7.3%) | 56 (7.0%) |
| 18 to 24 Years | 208 (9.8%) | 286 (13.5%) |
| 25 to 34 Years | 301 (9.3%) | 567 (17.9%) |
| 35 to 44 Years | 168 (5.3%) | 128 (3.5%) |
| 45 to 54 Years | 254 (7.9%) | 122 (3.5%) |
| 55 to 64 Years | 392 (10.6%) | 269 (7.1%) |
| 65 to 74 Years | 217 (9.2%) | 222 (9.1%) |
| 75 Years and over | 116 (10.1%) | 154 (10.3%) |
| Total | 2,725 (10.7%) | 2,524 (9.7%) |
Income Above Poverty by Sex and Age in St. Charles Parish
According to the poverty statistics in St. Charles Parish, males aged 5 years and females aged 45 to 54 years are the age groups that are most secure financially, with 100.0% of males and 96.5% of females in these age groups living above the poverty line.
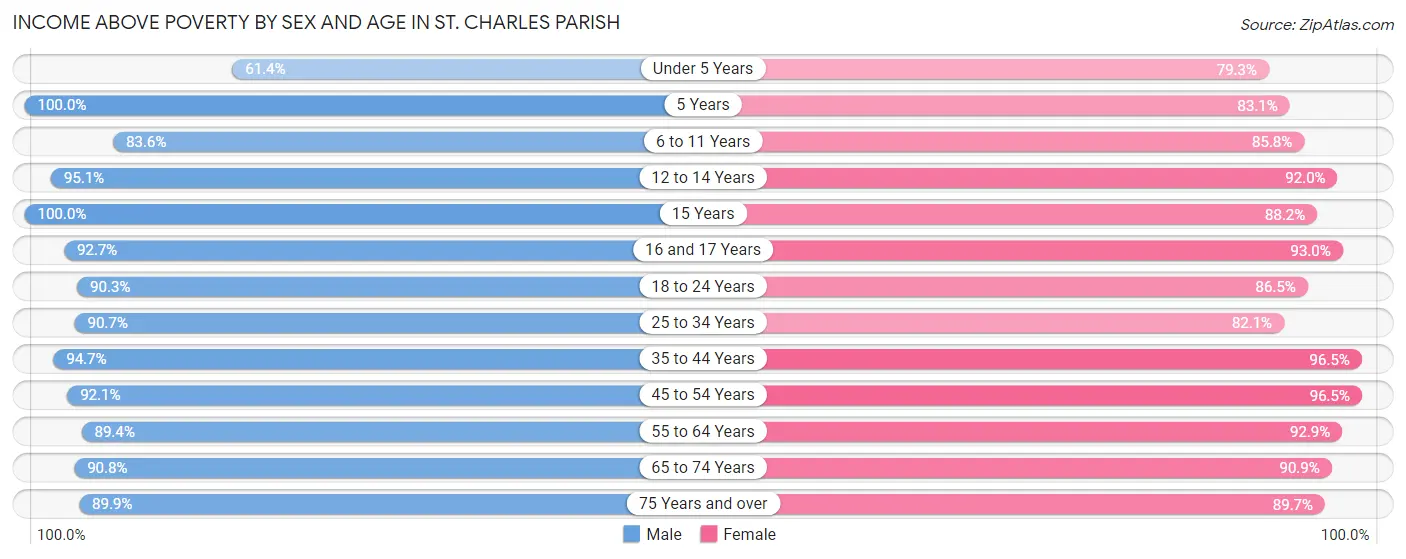
| Age Bracket | Male | Female |
| Under 5 Years | 937 (61.4%) | 1,008 (79.2%) |
| 5 Years | 528 (100.0%) | 133 (83.1%) |
| 6 to 11 Years | 1,930 (83.6%) | 1,668 (85.8%) |
| 12 to 14 Years | 1,011 (95.1%) | 1,310 (92.0%) |
| 15 Years | 473 (100.0%) | 292 (88.2%) |
| 16 and 17 Years | 634 (92.7%) | 738 (92.9%) |
| 18 to 24 Years | 1,925 (90.2%) | 1,826 (86.5%) |
| 25 to 34 Years | 2,944 (90.7%) | 2,593 (82.1%) |
| 35 to 44 Years | 2,983 (94.7%) | 3,514 (96.5%) |
| 45 to 54 Years | 2,954 (92.1%) | 3,375 (96.5%) |
| 55 to 64 Years | 3,314 (89.4%) | 3,493 (92.8%) |
| 65 to 74 Years | 2,140 (90.8%) | 2,216 (90.9%) |
| 75 Years and over | 1,030 (89.9%) | 1,336 (89.7%) |
| Total | 22,803 (89.3%) | 23,502 (90.3%) |
Income Below Poverty Among Married-Couple Families in St. Charles Parish
The poverty statistics for married-couple families in St. Charles Parish show that 1.3% or 128 of the total 10,063 families live below the poverty line. Families with 3 or 4 children have the highest poverty rate of 4.4%, comprising of 32 families. On the other hand, families with 5 or more children have the lowest poverty rate of 0.0%, which includes 0 families.
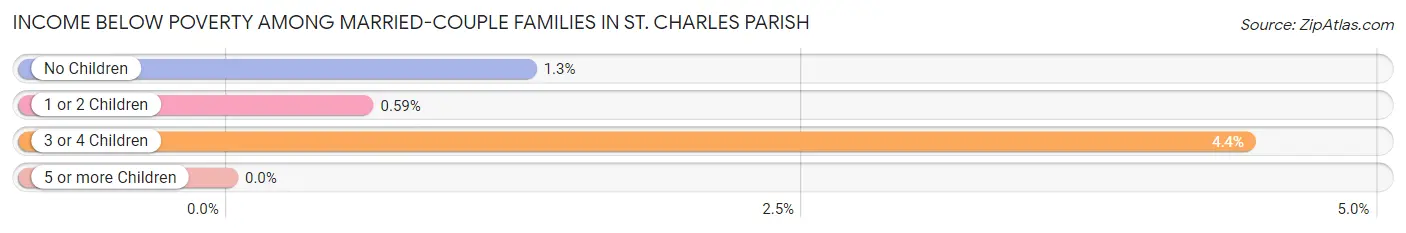
| Children | Above Poverty | Below Poverty |
| No Children | 5,789 (98.7%) | 76 (1.3%) |
| 1 or 2 Children | 3,372 (99.4%) | 20 (0.6%) |
| 3 or 4 Children | 691 (95.6%) | 32 (4.4%) |
| 5 or more Children | 83 (100.0%) | 0 (0.0%) |
| Total | 9,935 (98.7%) | 128 (1.3%) |
Income Below Poverty Among Single-Parent Households in St. Charles Parish
According to the poverty data in St. Charles Parish, 24.3% or 216 single-father households and 23.8% or 693 single-mother households are living below the poverty line. Among single-father households, those with 3 or 4 children have the highest poverty rate, with 11 households (42.3%) experiencing poverty. Likewise, among single-mother households, those with 3 or 4 children have the highest poverty rate, with 191 households (47.4%) falling below the poverty line.
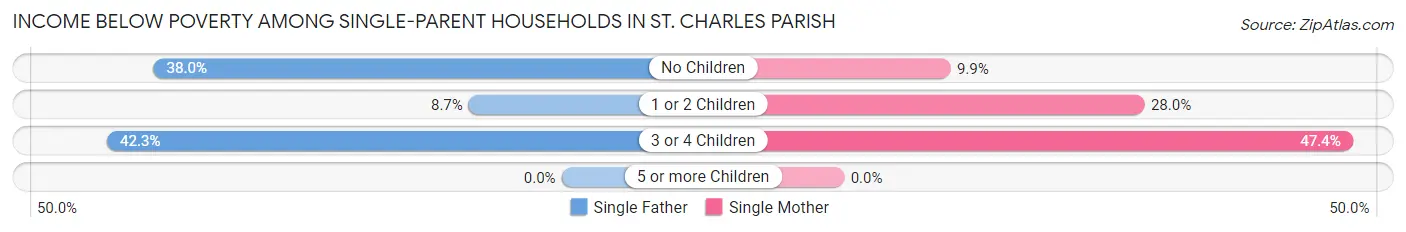
| Children | Single Father | Single Mother |
| No Children | 169 (38.0%) | 109 (9.9%) |
| 1 or 2 Children | 36 (8.6%) | 393 (28.0%) |
| 3 or 4 Children | 11 (42.3%) | 191 (47.4%) |
| 5 or more Children | 0 (0.0%) | 0 (0.0%) |
| Total | 216 (24.3%) | 693 (23.8%) |
Income Below Poverty Among Married-Couple vs Single-Parent Households in St. Charles Parish
The poverty data for St. Charles Parish shows that 128 of the married-couple family households (1.3%) and 909 of the single-parent households (23.9%) are living below the poverty level. Within the married-couple family households, those with 3 or 4 children have the highest poverty rate, with 32 households (4.4%) falling below the poverty line. Among the single-parent households, those with 3 or 4 children have the highest poverty rate, with 202 household (47.1%) living below poverty.
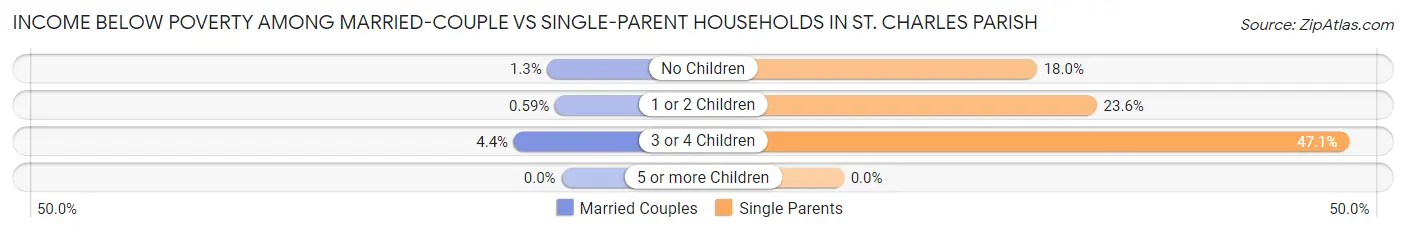
| Children | Married-Couple Families | Single-Parent Households |
| No Children | 76 (1.3%) | 278 (18.0%) |
| 1 or 2 Children | 20 (0.6%) | 429 (23.6%) |
| 3 or 4 Children | 32 (4.4%) | 202 (47.1%) |
| 5 or more Children | 0 (0.0%) | 0 (0.0%) |
| Total | 128 (1.3%) | 909 (23.9%) |
Employment Characteristics in St. Charles Parish
Employment by Class of Employer in St. Charles Parish
Among the 23,995 employed individuals in St. Charles Parish, private company employees (16,310 | 68.0%), local government employees (3,006 | 12.5%), and not-for-profit organizations (1,249 | 5.2%) make up the most common classes of employment.
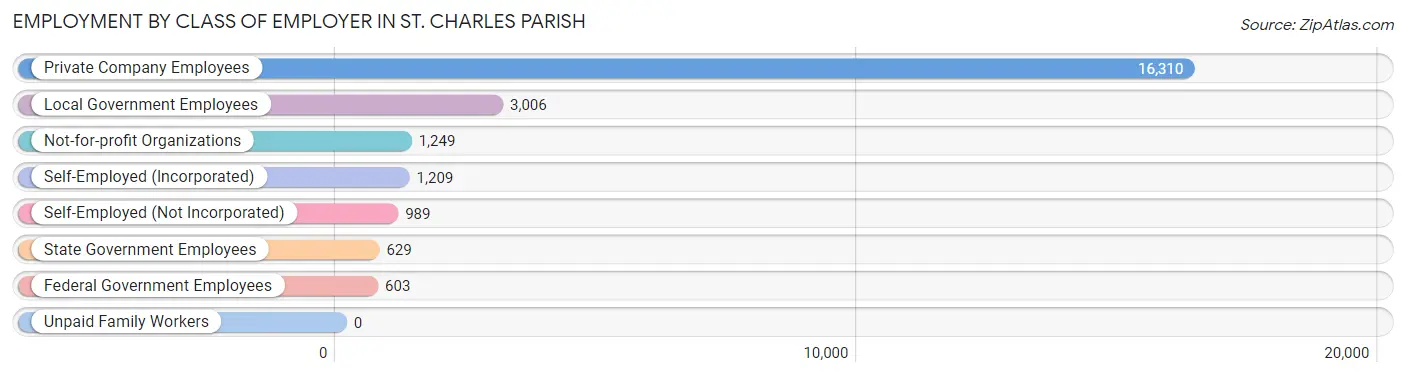
| Employer Class | # Employees | % Employees |
| Private Company Employees | 16,310 | 68.0% |
| Self-Employed (Incorporated) | 1,209 | 5.0% |
| Self-Employed (Not Incorporated) | 989 | 4.1% |
| Not-for-profit Organizations | 1,249 | 5.2% |
| Local Government Employees | 3,006 | 12.5% |
| State Government Employees | 629 | 2.6% |
| Federal Government Employees | 603 | 2.5% |
| Unpaid Family Workers | 0 | 0.0% |
| Total | 23,995 | 100.0% |
Employment Status by Age in St. Charles Parish
According to the labor force statistics for St. Charles Parish, out of the total population over 16 years of age (41,031), 63.9% or 26,219 individuals are in the labor force, with 6.7% or 1,757 of them unemployed. The age group with the highest labor force participation rate is 30 to 34 years, with 88.1% or 2,837 individuals in the labor force. Within the labor force, the 55 to 59 years age range has the highest percentage of unemployed individuals, with 13.4% or 408 of them being unemployed.
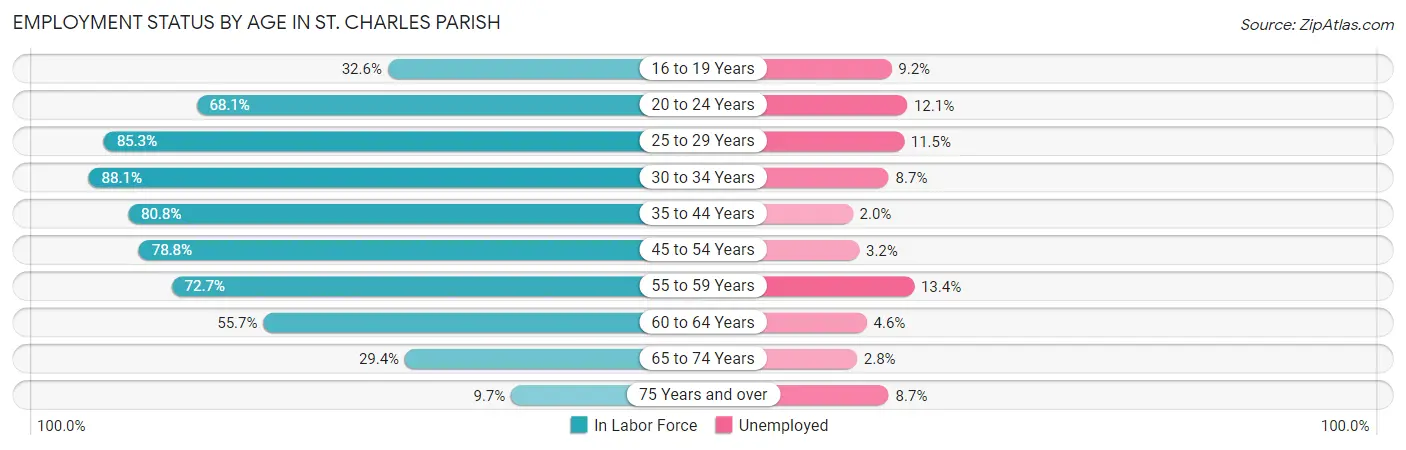
| Age Bracket | In Labor Force | Unemployed |
| 16 to 19 Years | 814 (32.6%) | 75 (9.2%) |
| 20 to 24 Years | 2,253 (68.1%) | 273 (12.1%) |
| 25 to 29 Years | 2,805 (85.3%) | 323 (11.5%) |
| 30 to 34 Years | 2,837 (88.1%) | 247 (8.7%) |
| 35 to 44 Years | 5,599 (80.8%) | 112 (2.0%) |
| 45 to 54 Years | 5,349 (78.8%) | 171 (3.2%) |
| 55 to 59 Years | 3,046 (72.7%) | 408 (13.4%) |
| 60 to 64 Years | 1,835 (55.7%) | 84 (4.6%) |
| 65 to 74 Years | 1,414 (29.4%) | 40 (2.8%) |
| 75 Years and over | 262 (9.7%) | 23 (8.7%) |
| Total | 26,219 (63.9%) | 1,757 (6.7%) |
Employment Status by Educational Attainment in St. Charles Parish
According to labor force statistics for St. Charles Parish, 77.5% of individuals (21,476) out of the total population between 25 and 64 years of age (27,711) are in the labor force, with 6.3% or 1,353 of them being unemployed. The group with the highest labor force participation rate are those with the educational attainment of bachelor's degree or higher, with 89.9% or 6,935 individuals in the labor force. Within the labor force, individuals with less than high school education have the highest percentage of unemployment, with 15.2% or 211 of them being unemployed.
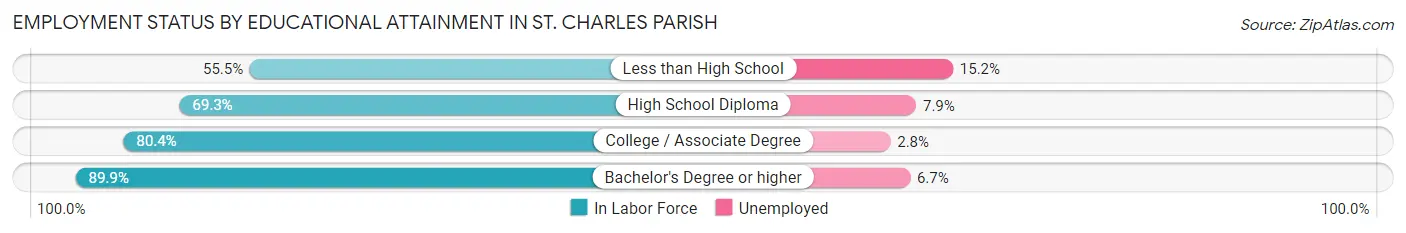
| Educational Attainment | In Labor Force | Unemployed |
| Less than High School | 1,391 (55.5%) | 381 (15.2%) |
| High School Diploma | 5,775 (69.3%) | 658 (7.9%) |
| College / Associate Degree | 7,361 (80.4%) | 256 (2.8%) |
| Bachelor's Degree or higher | 6,935 (89.9%) | 517 (6.7%) |
| Total | 21,476 (77.5%) | 1,746 (6.3%) |
Employment Occupations by Sex in St. Charles Parish
Management, Business, Science and Arts Occupations
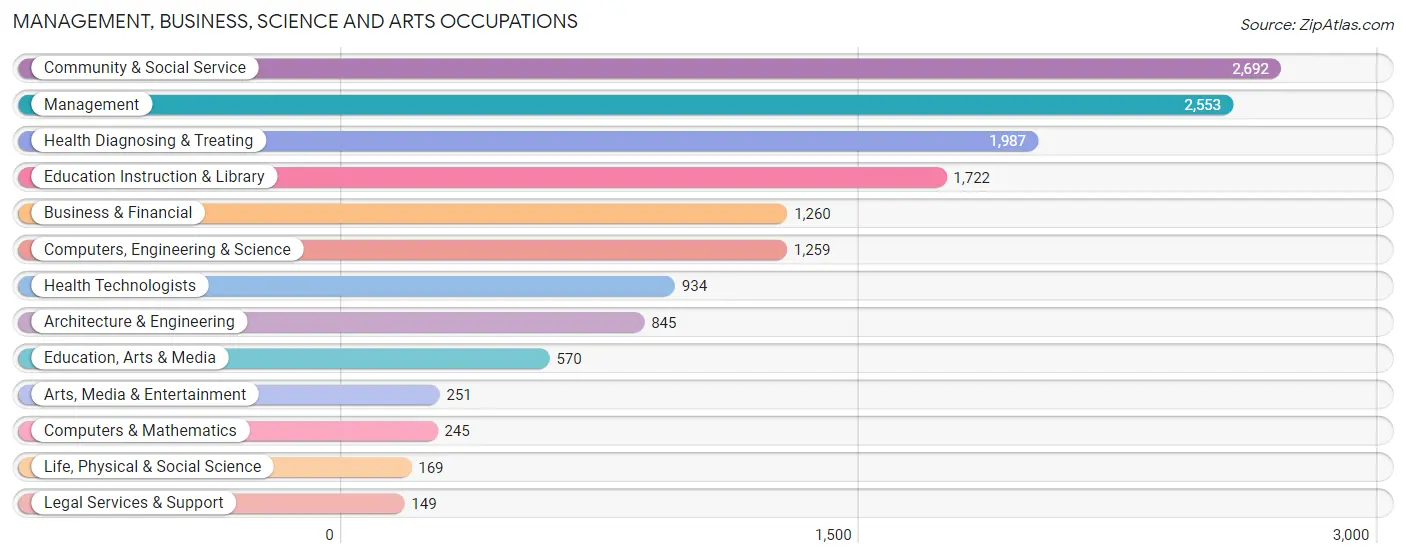
The most common Management, Business, Science and Arts occupations in St. Charles Parish are Community & Social Service (2,692 | 11.0%), Management (2,553 | 10.5%), Health Diagnosing & Treating (1,987 | 8.1%), Education Instruction & Library (1,722 | 7.1%), and Business & Financial (1,260 | 5.2%).
Management, Business, Science and Arts Occupations by Sex
Within the Management, Business, Science and Arts occupations in St. Charles Parish, the most male-oriented occupations are Architecture & Engineering (78.0%), Computers & Mathematics (74.7%), and Computers, Engineering & Science (72.7%), while the most female-oriented occupations are Education Instruction & Library (88.6%), Health Diagnosing & Treating (85.2%), and Education, Arts & Media (83.2%).
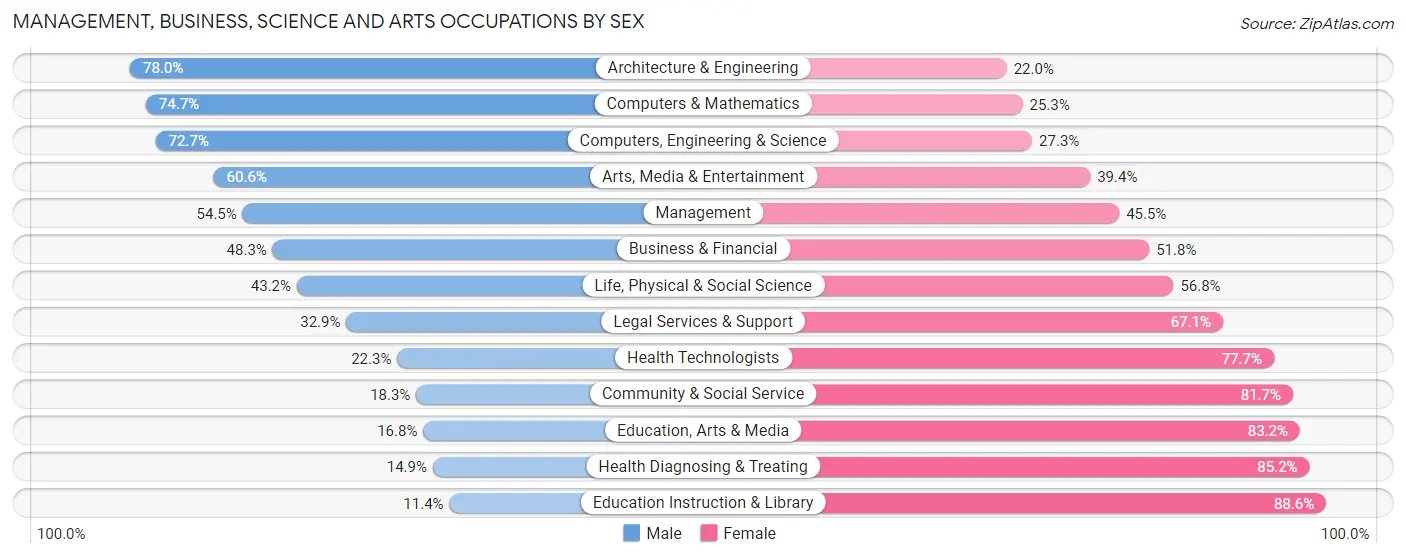
| Occupation | Male | Female |
| Management | 1,392 (54.5%) | 1,161 (45.5%) |
| Business & Financial | 608 (48.2%) | 652 (51.7%) |
| Computers, Engineering & Science | 915 (72.7%) | 344 (27.3%) |
| Computers & Mathematics | 183 (74.7%) | 62 (25.3%) |
| Architecture & Engineering | 659 (78.0%) | 186 (22.0%) |
| Life, Physical & Social Science | 73 (43.2%) | 96 (56.8%) |
| Community & Social Service | 493 (18.3%) | 2,199 (81.7%) |
| Education, Arts & Media | 96 (16.8%) | 474 (83.2%) |
| Legal Services & Support | 49 (32.9%) | 100 (67.1%) |
| Education Instruction & Library | 196 (11.4%) | 1,526 (88.6%) |
| Arts, Media & Entertainment | 152 (60.6%) | 99 (39.4%) |
| Health Diagnosing & Treating | 295 (14.8%) | 1,692 (85.2%) |
| Health Technologists | 208 (22.3%) | 726 (77.7%) |
| Total (Category) | 3,703 (38.0%) | 6,048 (62.0%) |
| Total (Overall) | 12,742 (52.2%) | 11,657 (47.8%) |
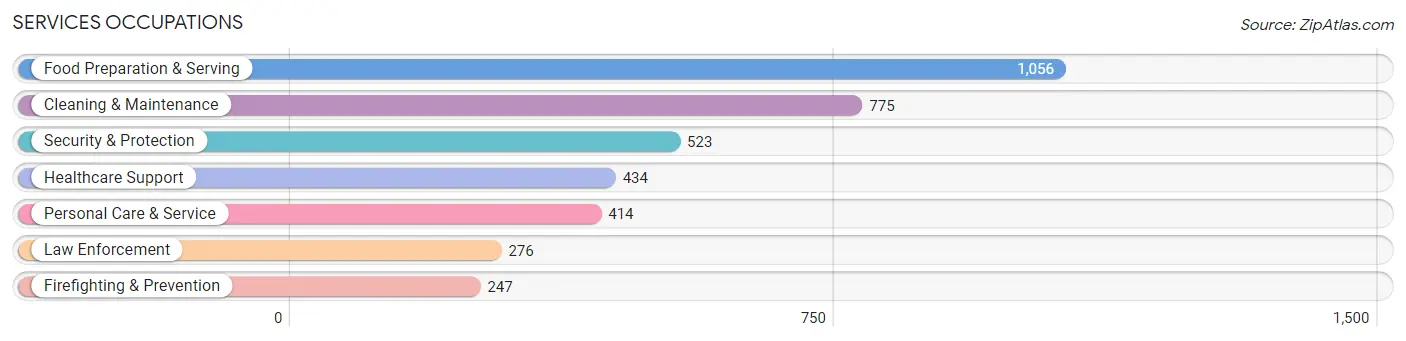
Services Occupations
The most common Services occupations in St. Charles Parish are Food Preparation & Serving (1,056 | 4.3%), Cleaning & Maintenance (775 | 3.2%), Security & Protection (523 | 2.1%), Healthcare Support (434 | 1.8%), and Personal Care & Service (414 | 1.7%).
Services Occupations by Sex
Within the Services occupations in St. Charles Parish, the most male-oriented occupations are Firefighting & Prevention (83.0%), Security & Protection (78.2%), and Law Enforcement (73.9%), while the most female-oriented occupations are Healthcare Support (92.6%), Personal Care & Service (81.4%), and Food Preparation & Serving (58.4%).
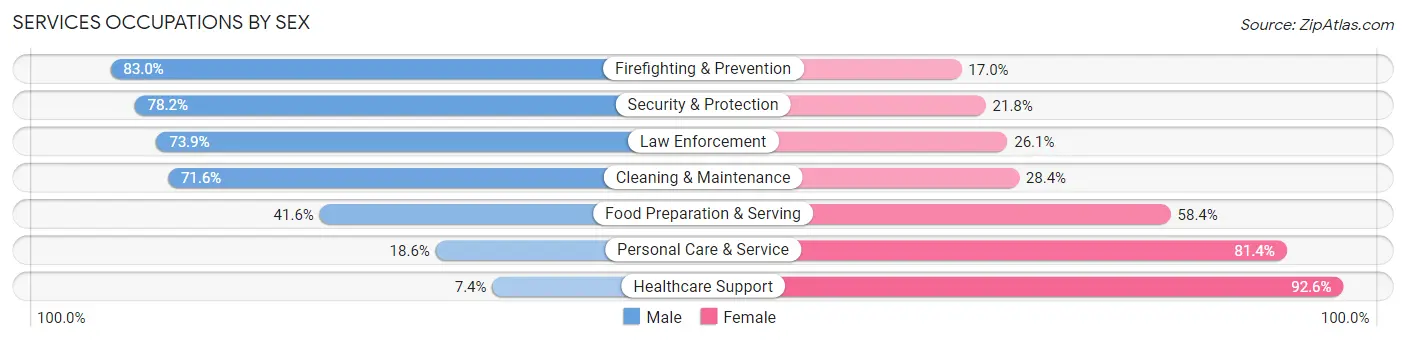
| Occupation | Male | Female |
| Healthcare Support | 32 (7.4%) | 402 (92.6%) |
| Security & Protection | 409 (78.2%) | 114 (21.8%) |
| Firefighting & Prevention | 205 (83.0%) | 42 (17.0%) |
| Law Enforcement | 204 (73.9%) | 72 (26.1%) |
| Food Preparation & Serving | 439 (41.6%) | 617 (58.4%) |
| Cleaning & Maintenance | 555 (71.6%) | 220 (28.4%) |
| Personal Care & Service | 77 (18.6%) | 337 (81.4%) |
| Total (Category) | 1,512 (47.2%) | 1,690 (52.8%) |
| Total (Overall) | 12,742 (52.2%) | 11,657 (47.8%) |
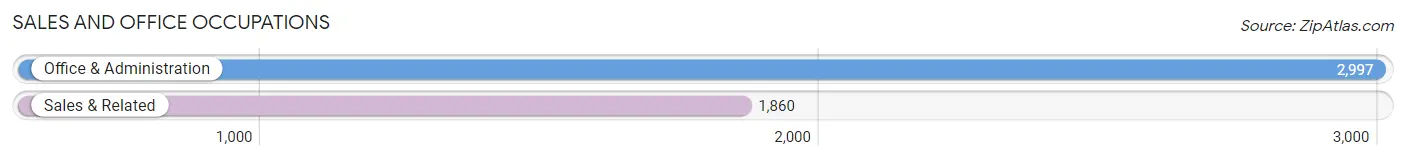
Sales and Office Occupations
The most common Sales and Office occupations in St. Charles Parish are Office & Administration (2,997 | 12.3%), and Sales & Related (1,860 | 7.6%).
Sales and Office Occupations by Sex
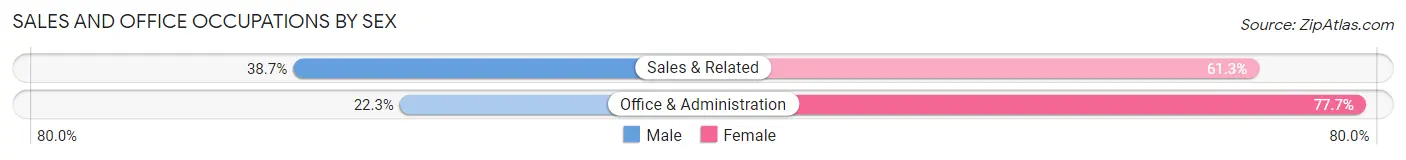
| Occupation | Male | Female |
| Sales & Related | 720 (38.7%) | 1,140 (61.3%) |
| Office & Administration | 668 (22.3%) | 2,329 (77.7%) |
| Total (Category) | 1,388 (28.6%) | 3,469 (71.4%) |
| Total (Overall) | 12,742 (52.2%) | 11,657 (47.8%) |
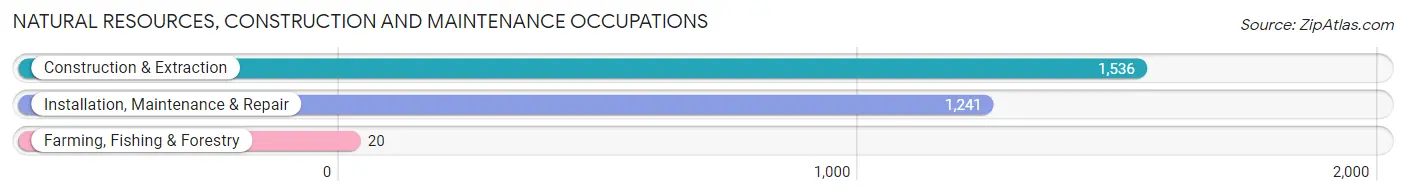
Natural Resources, Construction and Maintenance Occupations
The most common Natural Resources, Construction and Maintenance occupations in St. Charles Parish are Construction & Extraction (1,536 | 6.3%), Installation, Maintenance & Repair (1,241 | 5.1%), and Farming, Fishing & Forestry (20 | 0.1%).
Natural Resources, Construction and Maintenance Occupations by Sex
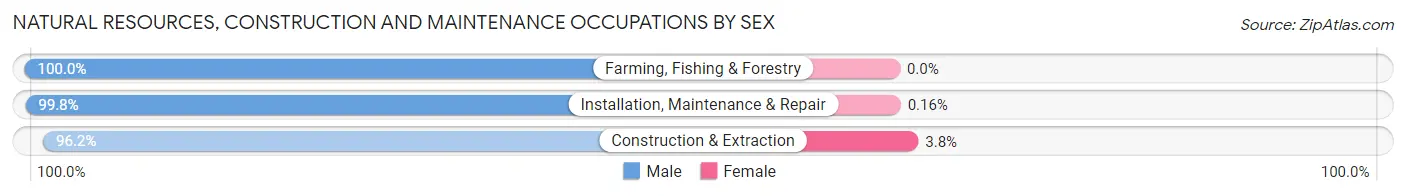
| Occupation | Male | Female |
| Farming, Fishing & Forestry | 20 (100.0%) | 0 (0.0%) |
| Construction & Extraction | 1,477 (96.2%) | 59 (3.8%) |
| Installation, Maintenance & Repair | 1,239 (99.8%) | 2 (0.2%) |
| Total (Category) | 2,736 (97.8%) | 61 (2.2%) |
| Total (Overall) | 12,742 (52.2%) | 11,657 (47.8%) |
Production, Transportation and Moving Occupations
The most common Production, Transportation and Moving occupations in St. Charles Parish are Production (1,433 | 5.9%), Transportation (1,431 | 5.9%), and Material Moving (928 | 3.8%).
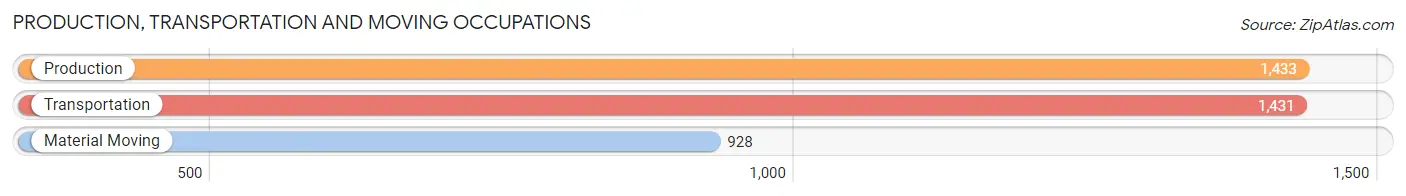
Production, Transportation and Moving Occupations by Sex
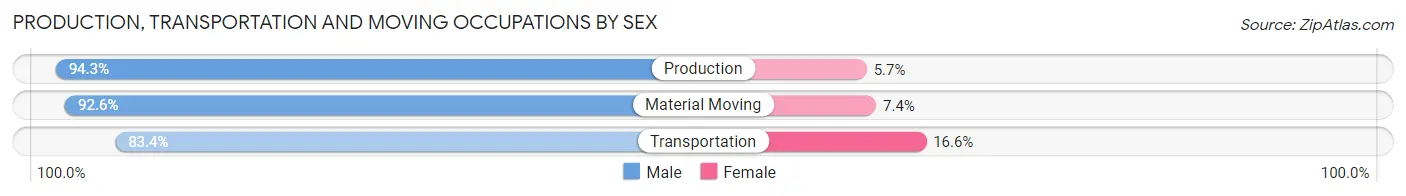
| Occupation | Male | Female |
| Production | 1,351 (94.3%) | 82 (5.7%) |
| Transportation | 1,193 (83.4%) | 238 (16.6%) |
| Material Moving | 859 (92.6%) | 69 (7.4%) |
| Total (Category) | 3,403 (89.7%) | 389 (10.3%) |
| Total (Overall) | 12,742 (52.2%) | 11,657 (47.8%) |
Employment Industries by Sex in St. Charles Parish
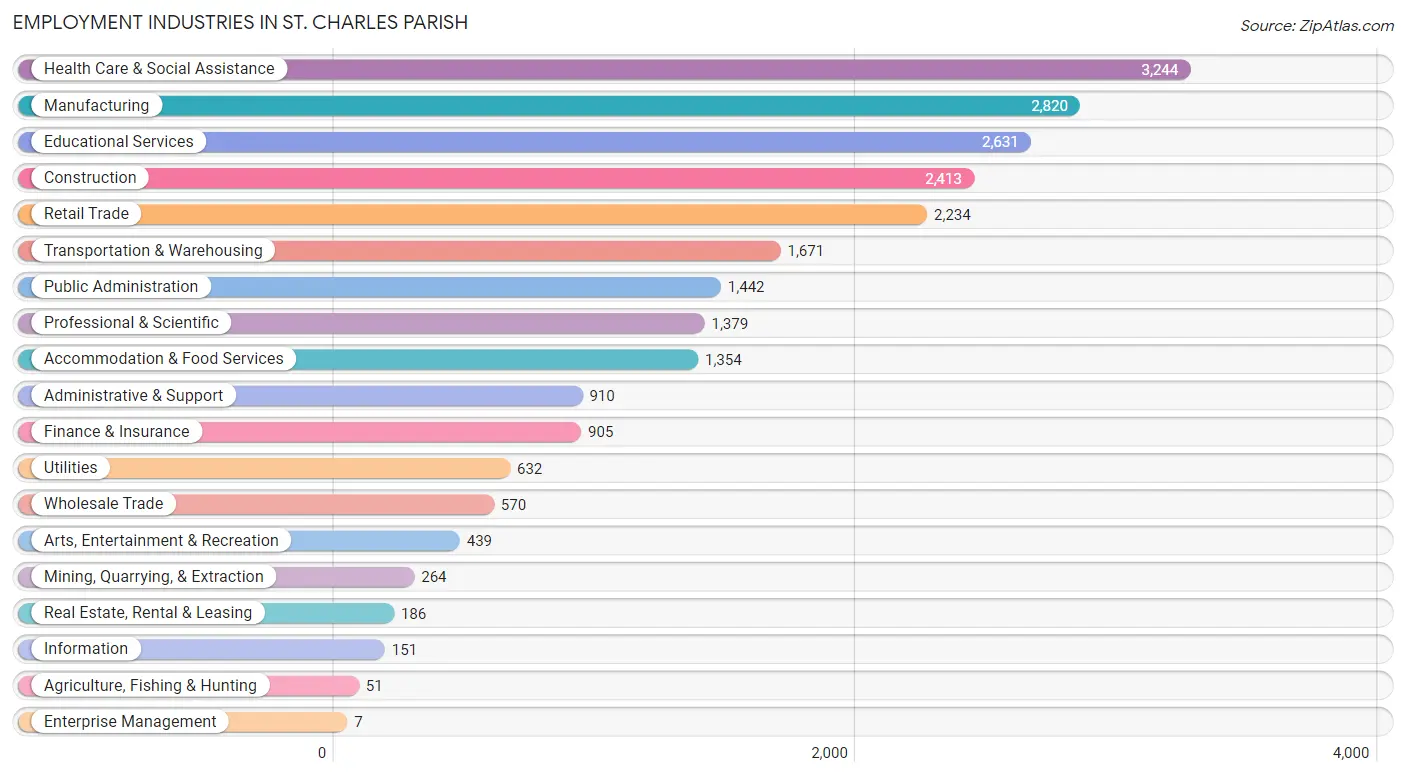
Employment Industries in St. Charles Parish
The major employment industries in St. Charles Parish include Health Care & Social Assistance (3,244 | 13.3%), Manufacturing (2,820 | 11.6%), Educational Services (2,631 | 10.8%), Construction (2,413 | 9.9%), and Retail Trade (2,234 | 9.2%).
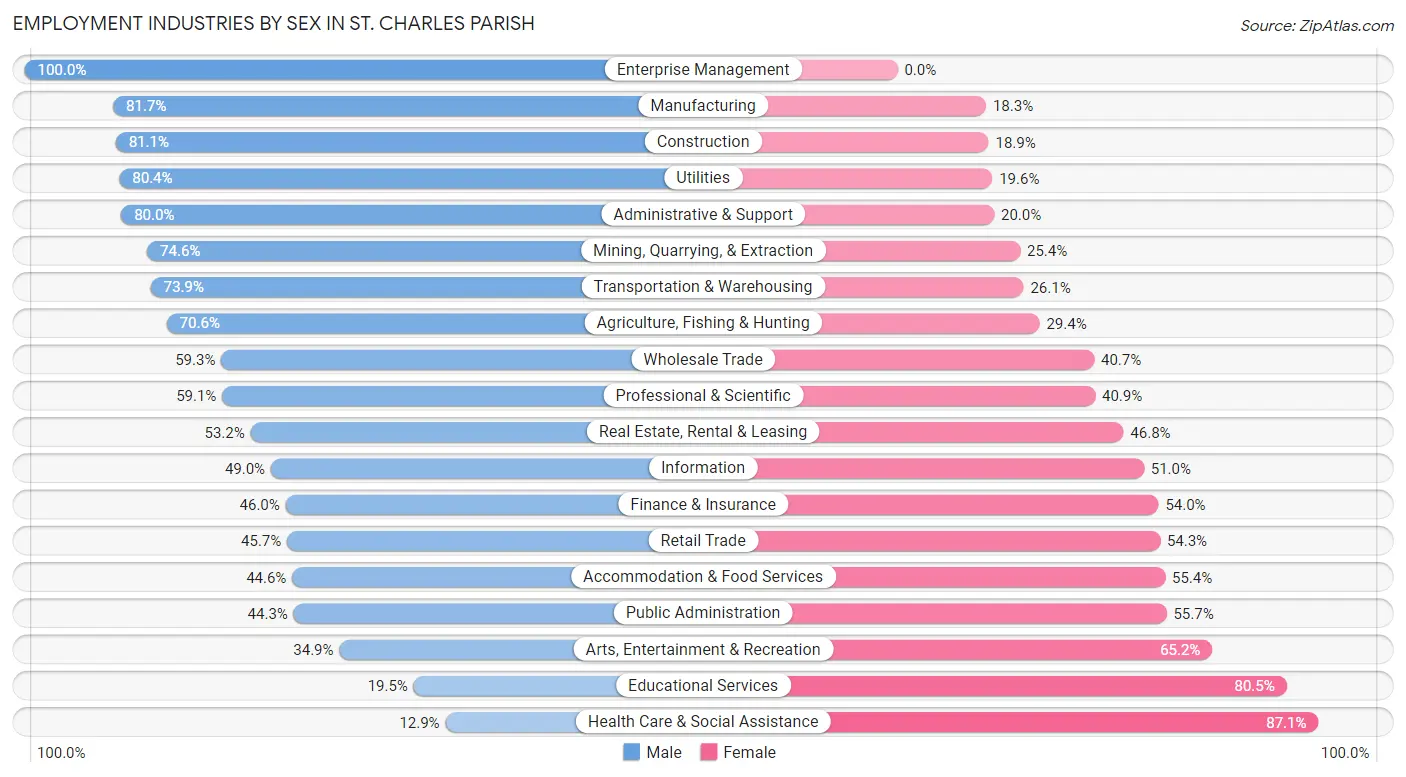
Employment Industries by Sex in St. Charles Parish
The St. Charles Parish industries that see more men than women are Enterprise Management (100.0%), Manufacturing (81.7%), and Construction (81.1%), whereas the industries that tend to have a higher number of women are Health Care & Social Assistance (87.1%), Educational Services (80.5%), and Arts, Entertainment & Recreation (65.1%).
| Industry | Male | Female |
| Agriculture, Fishing & Hunting | 36 (70.6%) | 15 (29.4%) |
| Mining, Quarrying, & Extraction | 197 (74.6%) | 67 (25.4%) |
| Construction | 1,958 (81.1%) | 455 (18.9%) |
| Manufacturing | 2,303 (81.7%) | 517 (18.3%) |
| Wholesale Trade | 338 (59.3%) | 232 (40.7%) |
| Retail Trade | 1,020 (45.7%) | 1,214 (54.3%) |
| Transportation & Warehousing | 1,235 (73.9%) | 436 (26.1%) |
| Utilities | 508 (80.4%) | 124 (19.6%) |
| Information | 74 (49.0%) | 77 (51.0%) |
| Finance & Insurance | 416 (46.0%) | 489 (54.0%) |
| Real Estate, Rental & Leasing | 99 (53.2%) | 87 (46.8%) |
| Professional & Scientific | 815 (59.1%) | 564 (40.9%) |
| Enterprise Management | 7 (100.0%) | 0 (0.0%) |
| Administrative & Support | 728 (80.0%) | 182 (20.0%) |
| Educational Services | 512 (19.5%) | 2,119 (80.5%) |
| Health Care & Social Assistance | 418 (12.9%) | 2,826 (87.1%) |
| Arts, Entertainment & Recreation | 153 (34.8%) | 286 (65.1%) |
| Accommodation & Food Services | 604 (44.6%) | 750 (55.4%) |
| Public Administration | 639 (44.3%) | 803 (55.7%) |
| Total | 12,742 (52.2%) | 11,657 (47.8%) |
Education in St. Charles Parish
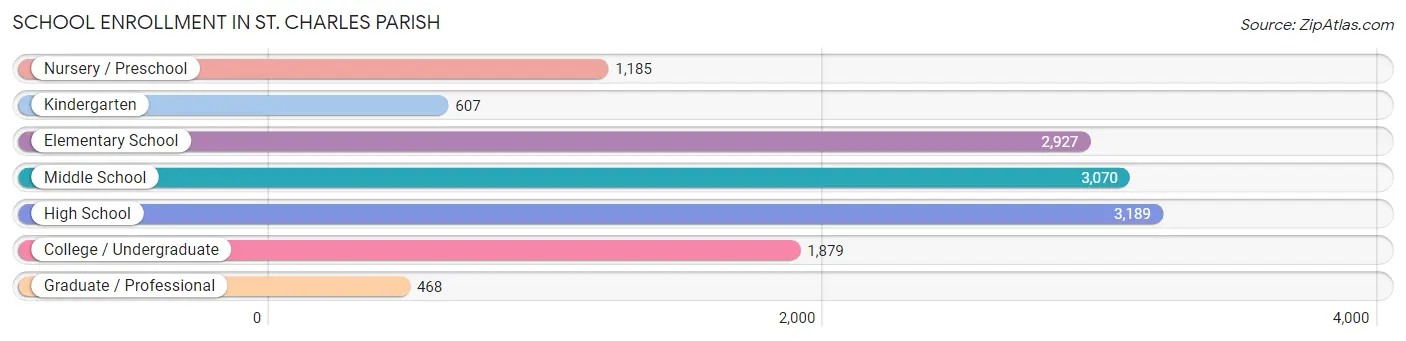
School Enrollment in St. Charles Parish
The most common levels of schooling among the 13,325 students in St. Charles Parish are high school (3,189 | 23.9%), middle school (3,070 | 23.0%), and elementary school (2,927 | 22.0%).
| School Level | # Students | % Students |
| Nursery / Preschool | 1,185 | 8.9% |
| Kindergarten | 607 | 4.6% |
| Elementary School | 2,927 | 22.0% |
| Middle School | 3,070 | 23.0% |
| High School | 3,189 | 23.9% |
| College / Undergraduate | 1,879 | 14.1% |
| Graduate / Professional | 468 | 3.5% |
| Total | 13,325 | 100.0% |
School Enrollment by Age by Funding Source in St. Charles Parish
Out of a total of 13,325 students who are enrolled in schools in St. Charles Parish, 2,052 (15.4%) attend a private institution, while the remaining 11,273 (84.6%) are enrolled in public schools. The age group of 35 years and over has the highest likelihood of being enrolled in private schools, with 224 (44.2% in the age bracket) enrolled. Conversely, the age group of 20 to 24 year olds has the lowest likelihood of being enrolled in a private school, with 1,141 (95.1% in the age bracket) attending a public institution.
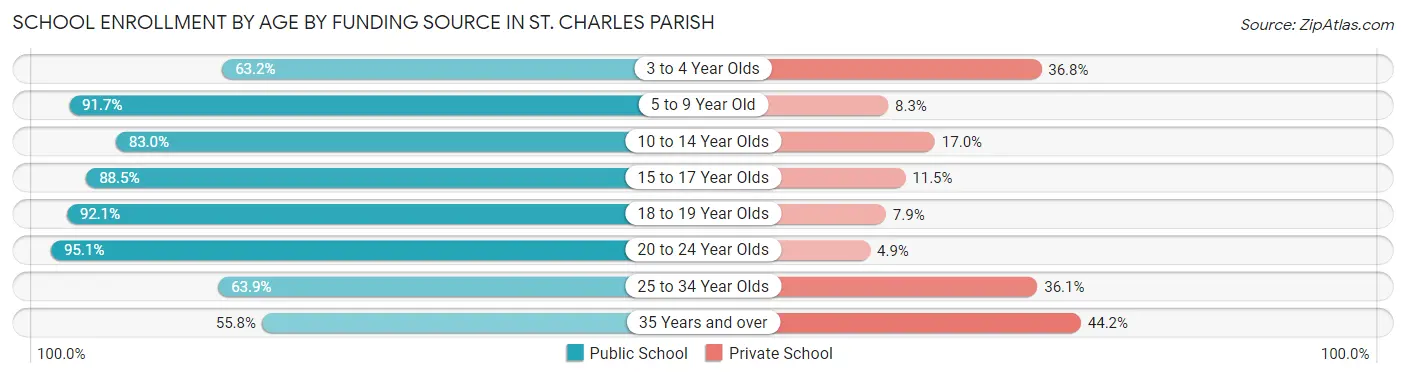
| Age Bracket | Public School | Private School |
| 3 to 4 Year Olds | 546 (63.2%) | 318 (36.8%) |
| 5 to 9 Year Old | 3,266 (91.7%) | 295 (8.3%) |
| 10 to 14 Year Olds | 3,157 (83.0%) | 646 (17.0%) |
| 15 to 17 Year Olds | 2,010 (88.5%) | 261 (11.5%) |
| 18 to 19 Year Olds | 492 (92.1%) | 42 (7.9%) |
| 20 to 24 Year Olds | 1,141 (95.1%) | 59 (4.9%) |
| 25 to 34 Year Olds | 374 (63.9%) | 211 (36.1%) |
| 35 Years and over | 283 (55.8%) | 224 (44.2%) |
| Total | 11,273 (84.6%) | 2,052 (15.4%) |
Educational Attainment by Field of Study in St. Charles Parish
Business (2,336 | 23.4%), education (1,647 | 16.5%), science & technology (1,377 | 13.8%), engineering (945 | 9.5%), and arts & humanities (569 | 5.7%) are the most common fields of study among 9,985 individuals in St. Charles Parish who have obtained a bachelor's degree or higher.
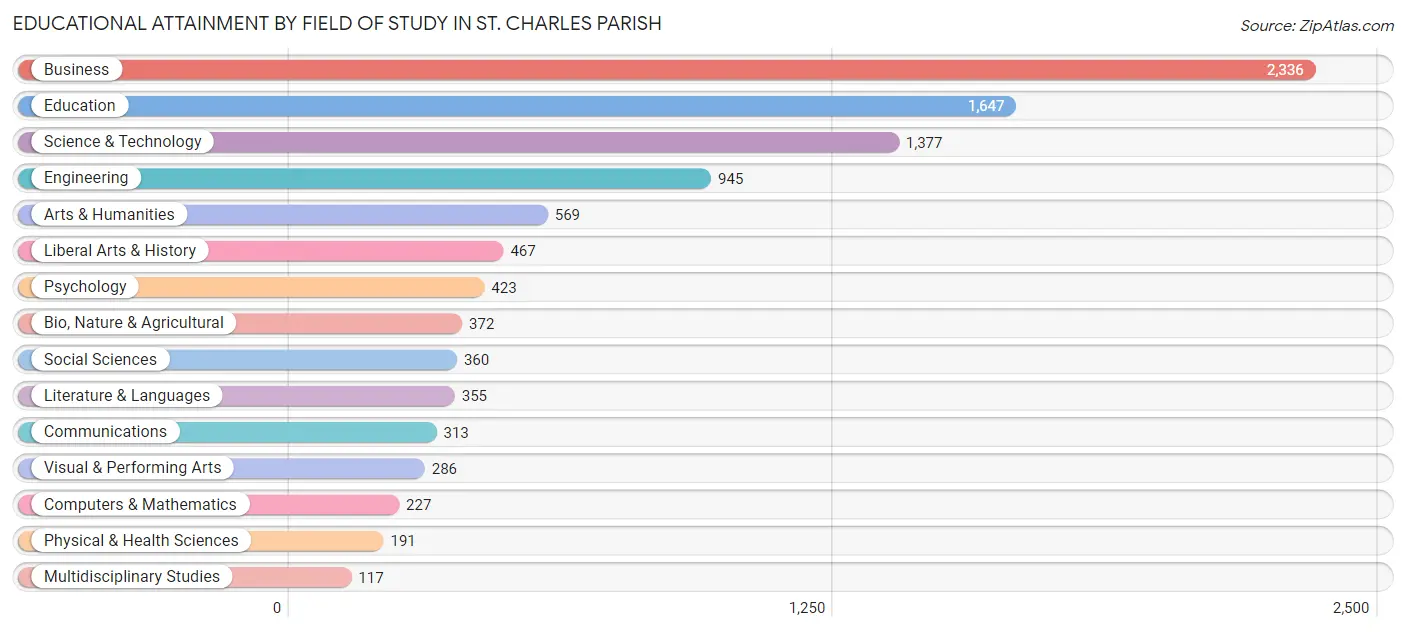
| Field of Study | # Graduates | % Graduates |
| Computers & Mathematics | 227 | 2.3% |
| Bio, Nature & Agricultural | 372 | 3.7% |
| Physical & Health Sciences | 191 | 1.9% |
| Psychology | 423 | 4.2% |
| Social Sciences | 360 | 3.6% |
| Engineering | 945 | 9.5% |
| Multidisciplinary Studies | 117 | 1.2% |
| Science & Technology | 1,377 | 13.8% |
| Business | 2,336 | 23.4% |
| Education | 1,647 | 16.5% |
| Literature & Languages | 355 | 3.6% |
| Liberal Arts & History | 467 | 4.7% |
| Visual & Performing Arts | 286 | 2.9% |
| Communications | 313 | 3.1% |
| Arts & Humanities | 569 | 5.7% |
| Total | 9,985 | 100.0% |
Transportation & Commute in St. Charles Parish
Vehicle Availability by Sex in St. Charles Parish
The most prevalent vehicle ownership categories in St. Charles Parish are males with 2 vehicles (5,639, accounting for 44.7%) and females with 2 vehicles (4,897, making up 49.6%).
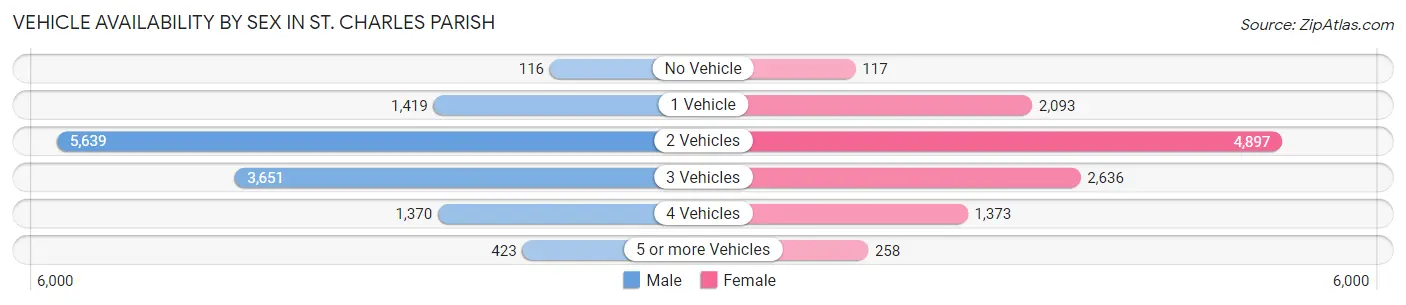
| Vehicles Available | Male | Female |
| No Vehicle | 116 (0.9%) | 117 (1.0%) |
| 1 Vehicle | 1,419 (11.3%) | 2,093 (18.4%) |
| 2 Vehicles | 5,639 (44.7%) | 4,897 (43.0%) |
| 3 Vehicles | 3,651 (28.9%) | 2,636 (23.2%) |
| 4 Vehicles | 1,370 (10.9%) | 1,373 (12.1%) |
| 5 or more Vehicles | 423 (3.4%) | 258 (2.3%) |
| Total | 12,618 (100.0%) | 11,374 (100.0%) |
Commute Time in St. Charles Parish
The most frequently occuring commute durations in St. Charles Parish are 20 to 24 minutes (3,635 commuters, 16.2%), 30 to 34 minutes (3,360 commuters, 14.9%), and 15 to 19 minutes (2,958 commuters, 13.2%).
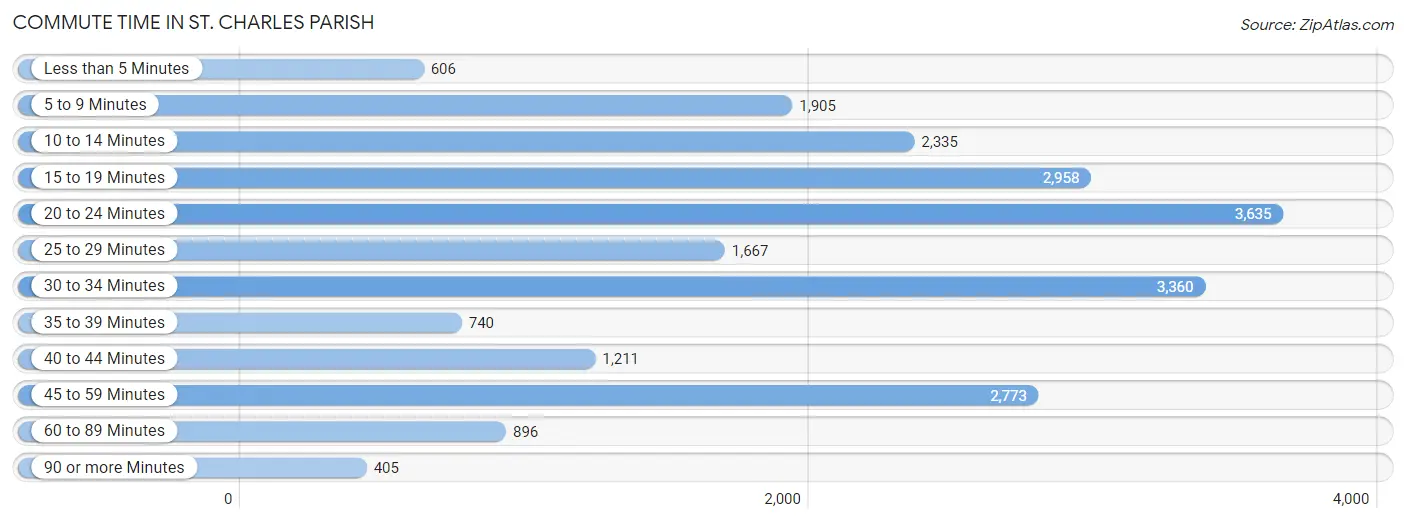
| Commute Time | # Commuters | % Commuters |
| Less than 5 Minutes | 606 | 2.7% |
| 5 to 9 Minutes | 1,905 | 8.5% |
| 10 to 14 Minutes | 2,335 | 10.4% |
| 15 to 19 Minutes | 2,958 | 13.2% |
| 20 to 24 Minutes | 3,635 | 16.2% |
| 25 to 29 Minutes | 1,667 | 7.4% |
| 30 to 34 Minutes | 3,360 | 14.9% |
| 35 to 39 Minutes | 740 | 3.3% |
| 40 to 44 Minutes | 1,211 | 5.4% |
| 45 to 59 Minutes | 2,773 | 12.3% |
| 60 to 89 Minutes | 896 | 4.0% |
| 90 or more Minutes | 405 | 1.8% |
Commute Time by Sex in St. Charles Parish
The most common commute times in St. Charles Parish are 20 to 24 minutes (2,064 commuters, 17.0%) for males and 30 to 34 minutes (1,635 commuters, 15.8%) for females.
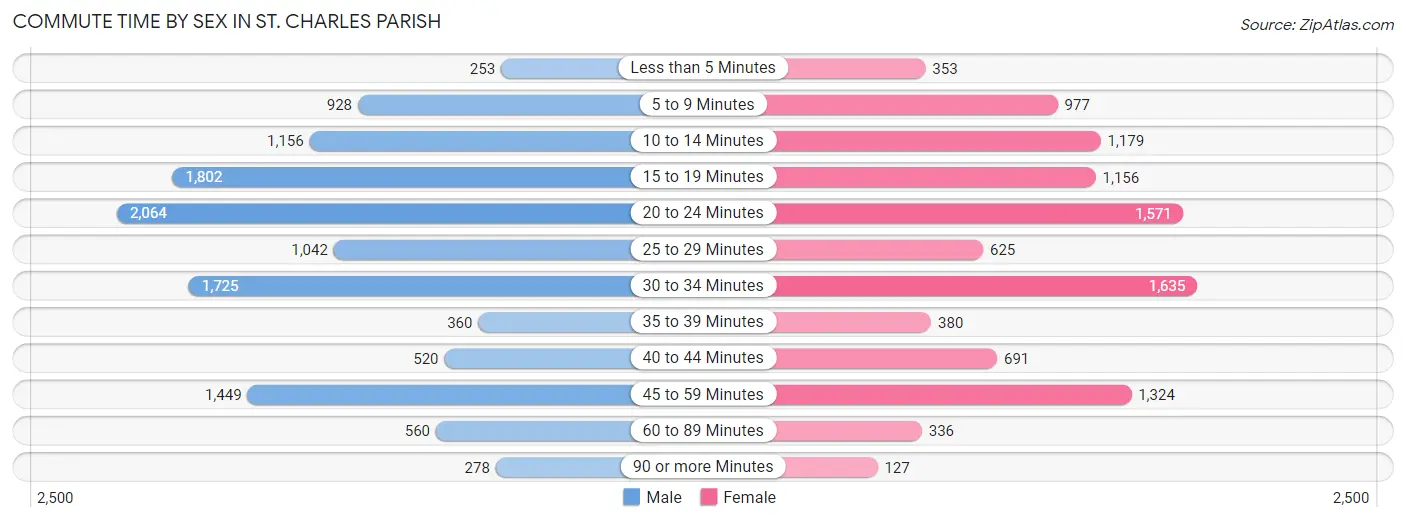
| Commute Time | Male | Female |
| Less than 5 Minutes | 253 (2.1%) | 353 (3.4%) |
| 5 to 9 Minutes | 928 (7.6%) | 977 (9.4%) |
| 10 to 14 Minutes | 1,156 (9.5%) | 1,179 (11.4%) |
| 15 to 19 Minutes | 1,802 (14.8%) | 1,156 (11.2%) |
| 20 to 24 Minutes | 2,064 (17.0%) | 1,571 (15.2%) |
| 25 to 29 Minutes | 1,042 (8.6%) | 625 (6.0%) |
| 30 to 34 Minutes | 1,725 (14.2%) | 1,635 (15.8%) |
| 35 to 39 Minutes | 360 (3.0%) | 380 (3.7%) |
| 40 to 44 Minutes | 520 (4.3%) | 691 (6.7%) |
| 45 to 59 Minutes | 1,449 (11.9%) | 1,324 (12.8%) |
| 60 to 89 Minutes | 560 (4.6%) | 336 (3.3%) |
| 90 or more Minutes | 278 (2.3%) | 127 (1.2%) |
Time of Departure to Work by Sex in St. Charles Parish
The most frequent times of departure to work in St. Charles Parish are 12:00 AM to 4:59 AM (2,013, 16.6%) for males and 7:00 AM to 7:29 AM (2,240, 21.6%) for females.
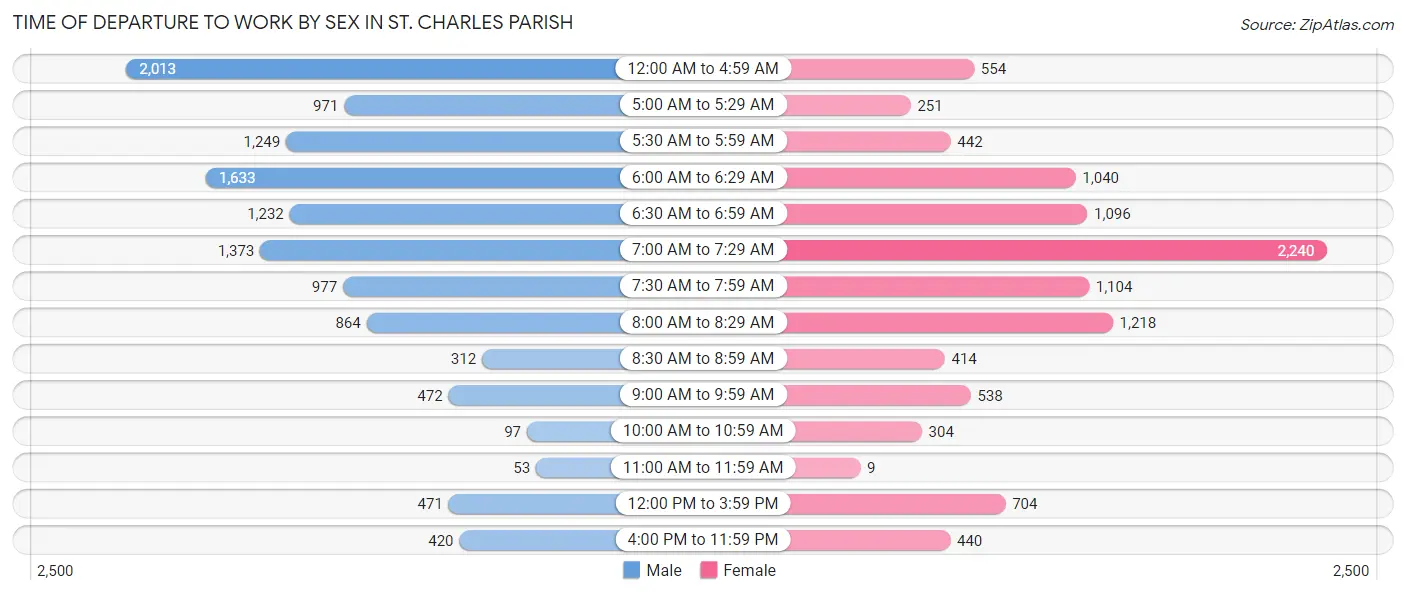
| Time of Departure | Male | Female |
| 12:00 AM to 4:59 AM | 2,013 (16.6%) | 554 (5.3%) |
| 5:00 AM to 5:29 AM | 971 (8.0%) | 251 (2.4%) |
| 5:30 AM to 5:59 AM | 1,249 (10.3%) | 442 (4.3%) |
| 6:00 AM to 6:29 AM | 1,633 (13.5%) | 1,040 (10.0%) |
| 6:30 AM to 6:59 AM | 1,232 (10.2%) | 1,096 (10.6%) |
| 7:00 AM to 7:29 AM | 1,373 (11.3%) | 2,240 (21.6%) |
| 7:30 AM to 7:59 AM | 977 (8.1%) | 1,104 (10.7%) |
| 8:00 AM to 8:29 AM | 864 (7.1%) | 1,218 (11.8%) |
| 8:30 AM to 8:59 AM | 312 (2.6%) | 414 (4.0%) |
| 9:00 AM to 9:59 AM | 472 (3.9%) | 538 (5.2%) |
| 10:00 AM to 10:59 AM | 97 (0.8%) | 304 (2.9%) |
| 11:00 AM to 11:59 AM | 53 (0.4%) | 9 (0.1%) |
| 12:00 PM to 3:59 PM | 471 (3.9%) | 704 (6.8%) |
| 4:00 PM to 11:59 PM | 420 (3.5%) | 440 (4.3%) |
| Total | 12,137 (100.0%) | 10,354 (100.0%) |
Housing Occupancy in St. Charles Parish
Occupancy by Ownership in St. Charles Parish
Of the total 18,591 dwellings in St. Charles Parish, owner-occupied units account for 15,349 (82.6%), while renter-occupied units make up 3,242 (17.4%).
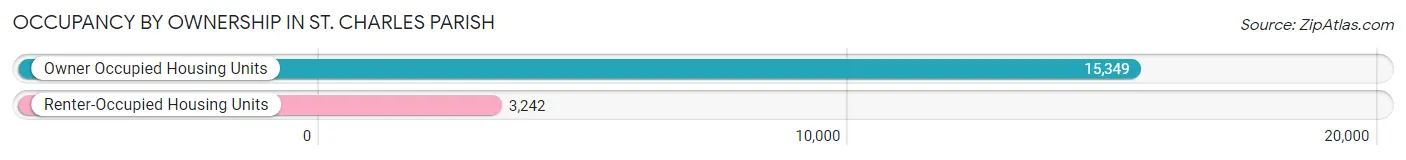
| Occupancy | # Housing Units | % Housing Units |
| Owner Occupied Housing Units | 15,349 | 82.6% |
| Renter-Occupied Housing Units | 3,242 | 17.4% |
| Total Occupied Housing Units | 18,591 | 100.0% |
Occupancy by Household Size in St. Charles Parish
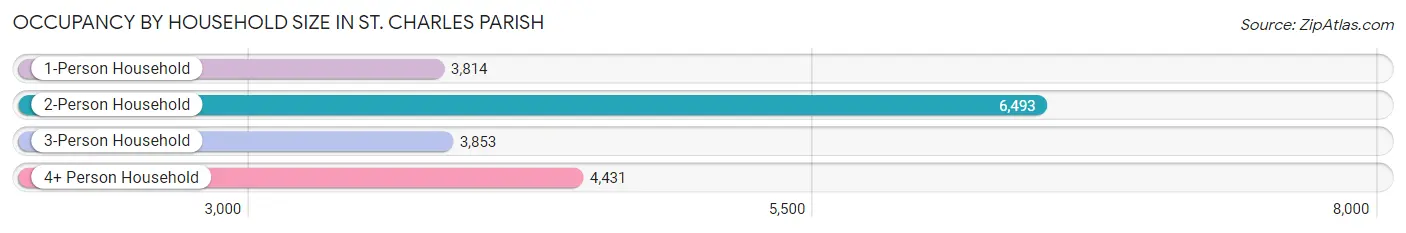
| Household Size | # Housing Units | % Housing Units |
| 1-Person Household | 3,814 | 20.5% |
| 2-Person Household | 6,493 | 34.9% |
| 3-Person Household | 3,853 | 20.7% |
| 4+ Person Household | 4,431 | 23.8% |
| Total Housing Units | 18,591 | 100.0% |
Occupancy by Ownership by Household Size in St. Charles Parish
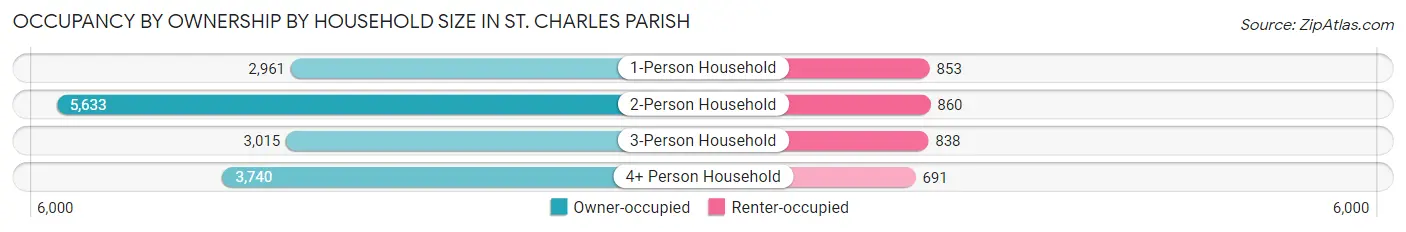
| Household Size | Owner-occupied | Renter-occupied |
| 1-Person Household | 2,961 (77.6%) | 853 (22.4%) |
| 2-Person Household | 5,633 (86.8%) | 860 (13.3%) |
| 3-Person Household | 3,015 (78.2%) | 838 (21.7%) |
| 4+ Person Household | 3,740 (84.4%) | 691 (15.6%) |
| Total Housing Units | 15,349 (82.6%) | 3,242 (17.4%) |
Occupancy by Educational Attainment in St. Charles Parish
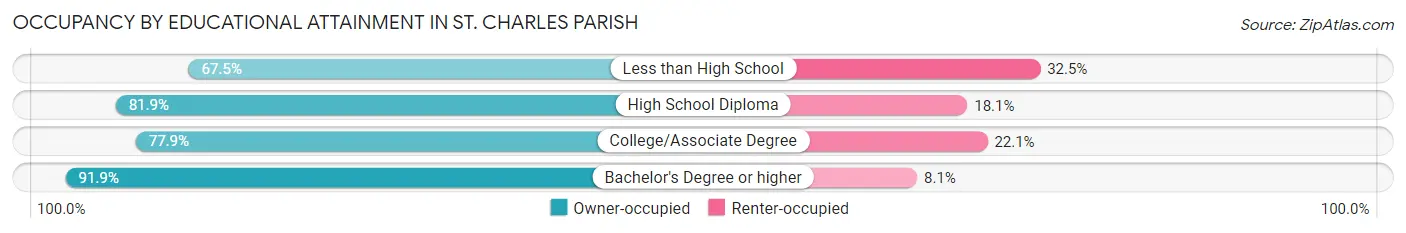
| Household Size | Owner-occupied | Renter-occupied |
| Less than High School | 990 (67.5%) | 477 (32.5%) |
| High School Diploma | 4,326 (81.9%) | 954 (18.1%) |
| College/Associate Degree | 4,748 (77.9%) | 1,344 (22.1%) |
| Bachelor's Degree or higher | 5,285 (91.9%) | 467 (8.1%) |
Occupancy by Age of Householder in St. Charles Parish
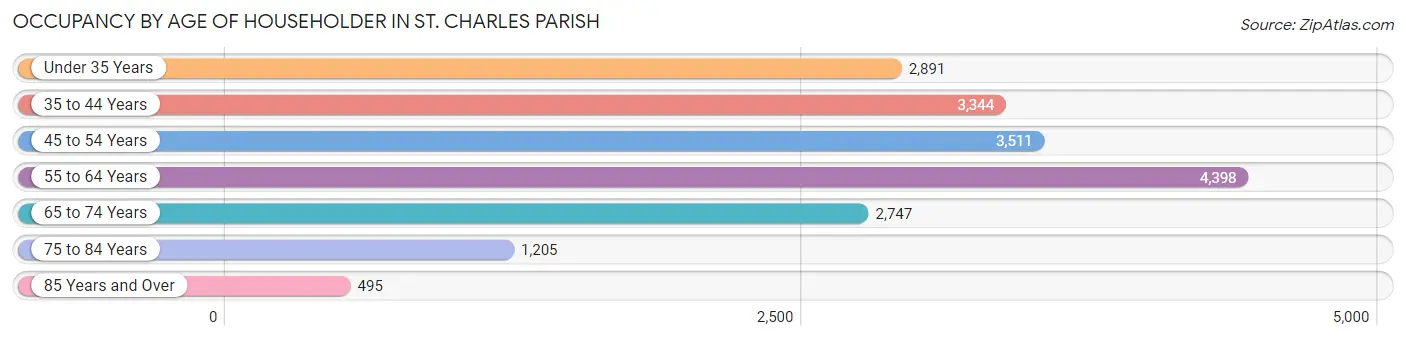
| Age Bracket | # Households | % Households |
| Under 35 Years | 2,891 | 15.5% |
| 35 to 44 Years | 3,344 | 18.0% |
| 45 to 54 Years | 3,511 | 18.9% |
| 55 to 64 Years | 4,398 | 23.7% |
| 65 to 74 Years | 2,747 | 14.8% |
| 75 to 84 Years | 1,205 | 6.5% |
| 85 Years and Over | 495 | 2.7% |
| Total | 18,591 | 100.0% |
Housing Finances in St. Charles Parish
Median Income by Occupancy in St. Charles Parish
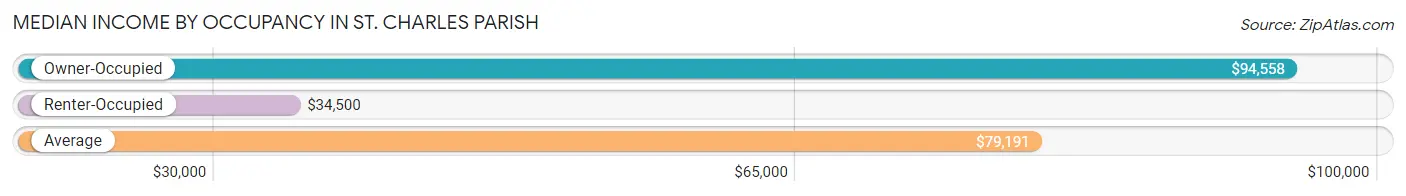
| Occupancy Type | # Households | Median Income |
| Owner-Occupied | 15,349 (82.6%) | $94,558 |
| Renter-Occupied | 3,242 (17.4%) | $34,500 |
| Average | 18,591 (100.0%) | $79,191 |
Occupancy by Householder Income Bracket in St. Charles Parish
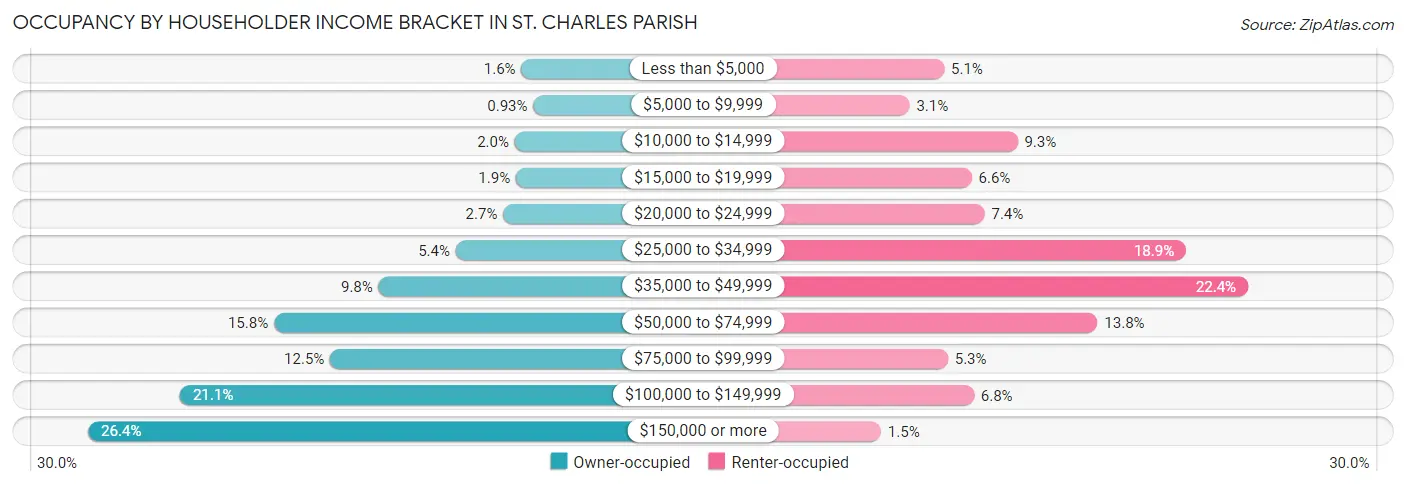
| Income Bracket | Owner-occupied | Renter-occupied |
| Less than $5,000 | 247 (1.6%) | 164 (5.1%) |
| $5,000 to $9,999 | 143 (0.9%) | 100 (3.1%) |
| $10,000 to $14,999 | 305 (2.0%) | 300 (9.2%) |
| $15,000 to $19,999 | 295 (1.9%) | 215 (6.6%) |
| $20,000 to $24,999 | 407 (2.6%) | 239 (7.4%) |
| $25,000 to $34,999 | 823 (5.4%) | 612 (18.9%) |
| $35,000 to $49,999 | 1,499 (9.8%) | 727 (22.4%) |
| $50,000 to $74,999 | 2,418 (15.8%) | 448 (13.8%) |
| $75,000 to $99,999 | 1,924 (12.5%) | 171 (5.3%) |
| $100,000 to $149,999 | 3,241 (21.1%) | 219 (6.8%) |
| $150,000 or more | 4,047 (26.4%) | 47 (1.5%) |
| Total | 15,349 (100.0%) | 3,242 (100.0%) |
Monthly Housing Cost Tiers in St. Charles Parish
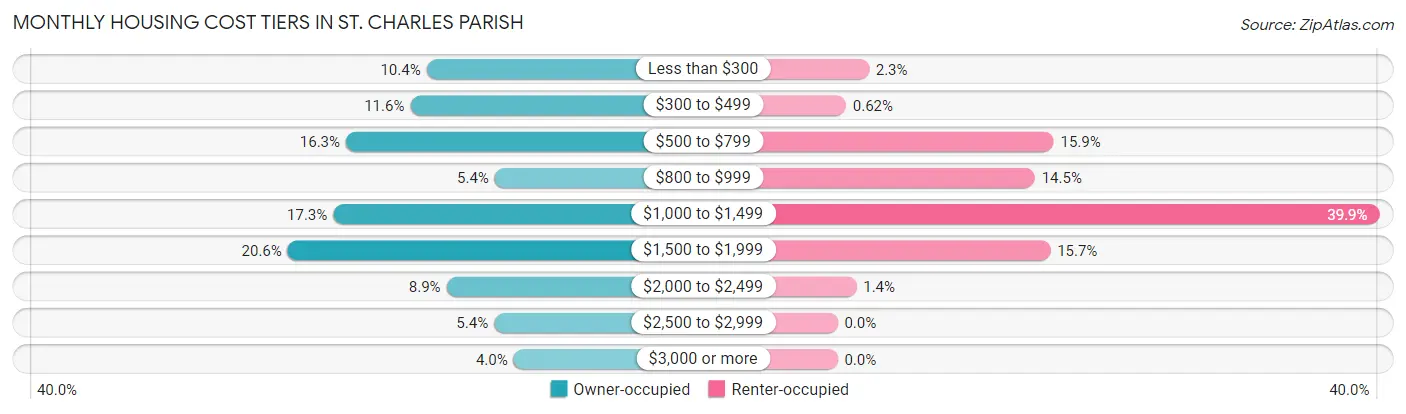
| Monthly Cost | Owner-occupied | Renter-occupied |
| Less than $300 | 1,597 (10.4%) | 75 (2.3%) |
| $300 to $499 | 1,781 (11.6%) | 20 (0.6%) |
| $500 to $799 | 2,508 (16.3%) | 516 (15.9%) |
| $800 to $999 | 826 (5.4%) | 471 (14.5%) |
| $1,000 to $1,499 | 2,653 (17.3%) | 1,294 (39.9%) |
| $1,500 to $1,999 | 3,166 (20.6%) | 508 (15.7%) |
| $2,000 to $2,499 | 1,371 (8.9%) | 45 (1.4%) |
| $2,500 to $2,999 | 834 (5.4%) | 0 (0.0%) |
| $3,000 or more | 613 (4.0%) | 0 (0.0%) |
| Total | 15,349 (100.0%) | 3,242 (100.0%) |
Physical Housing Characteristics in St. Charles Parish
Housing Structures in St. Charles Parish
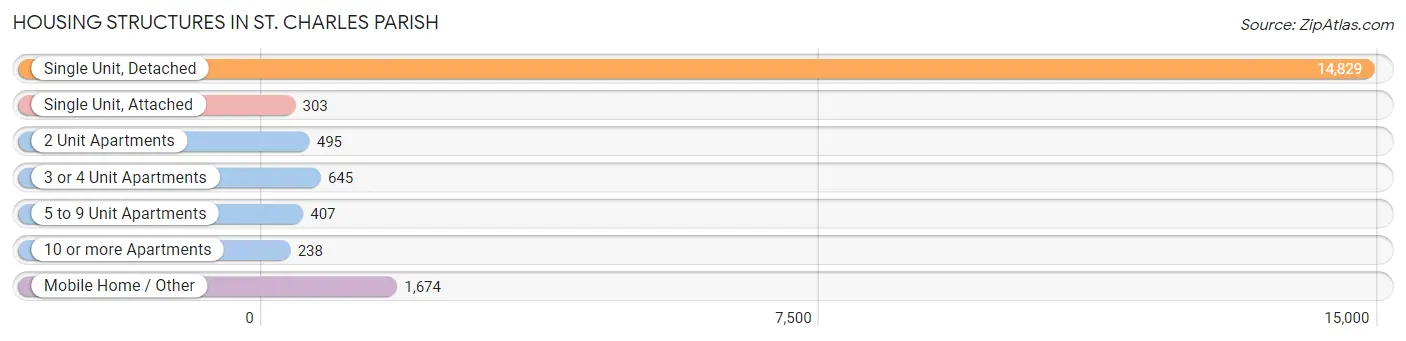
| Structure Type | # Housing Units | % Housing Units |
| Single Unit, Detached | 14,829 | 79.8% |
| Single Unit, Attached | 303 | 1.6% |
| 2 Unit Apartments | 495 | 2.7% |
| 3 or 4 Unit Apartments | 645 | 3.5% |
| 5 to 9 Unit Apartments | 407 | 2.2% |
| 10 or more Apartments | 238 | 1.3% |
| Mobile Home / Other | 1,674 | 9.0% |
| Total | 18,591 | 100.0% |
Housing Structures by Occupancy in St. Charles Parish
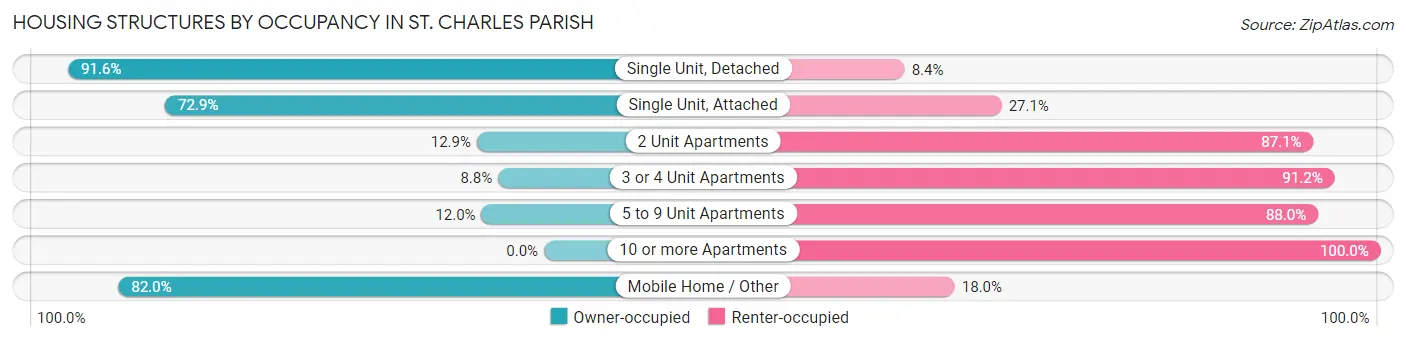
| Structure Type | Owner-occupied | Renter-occupied |
| Single Unit, Detached | 13,586 (91.6%) | 1,243 (8.4%) |
| Single Unit, Attached | 221 (72.9%) | 82 (27.1%) |
| 2 Unit Apartments | 64 (12.9%) | 431 (87.1%) |
| 3 or 4 Unit Apartments | 57 (8.8%) | 588 (91.2%) |
| 5 to 9 Unit Apartments | 49 (12.0%) | 358 (88.0%) |
| 10 or more Apartments | 0 (0.0%) | 238 (100.0%) |
| Mobile Home / Other | 1,372 (82.0%) | 302 (18.0%) |
| Total | 15,349 (82.6%) | 3,242 (17.4%) |
Housing Structures by Number of Rooms in St. Charles Parish
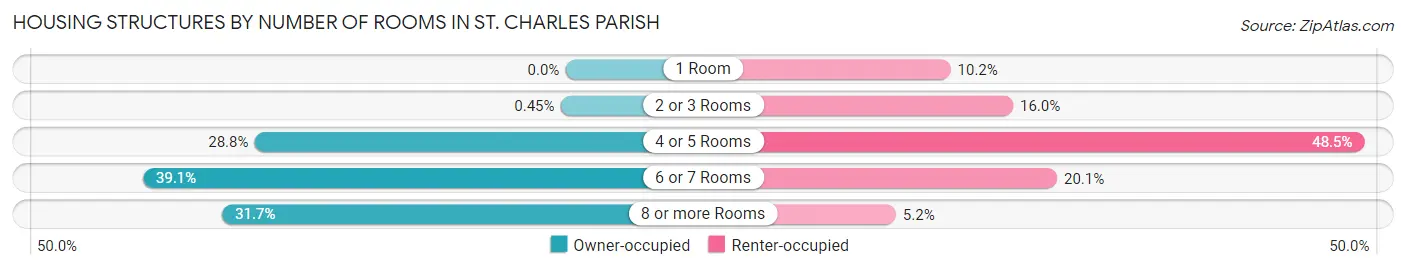
| Number of Rooms | Owner-occupied | Renter-occupied |
| 1 Room | 0 (0.0%) | 332 (10.2%) |
| 2 or 3 Rooms | 69 (0.4%) | 519 (16.0%) |
| 4 or 5 Rooms | 4,414 (28.8%) | 1,572 (48.5%) |
| 6 or 7 Rooms | 5,995 (39.1%) | 651 (20.1%) |
| 8 or more Rooms | 4,871 (31.7%) | 168 (5.2%) |
| Total | 15,349 (100.0%) | 3,242 (100.0%) |
Housing Structure by Heating Type in St. Charles Parish
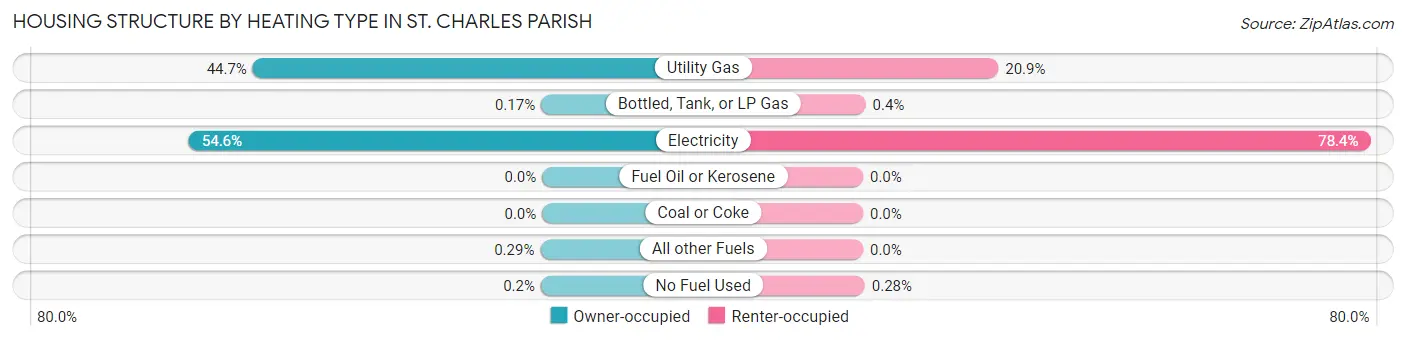
| Heating Type | Owner-occupied | Renter-occupied |
| Utility Gas | 6,867 (44.7%) | 678 (20.9%) |
| Bottled, Tank, or LP Gas | 26 (0.2%) | 13 (0.4%) |
| Electricity | 8,381 (54.6%) | 2,542 (78.4%) |
| Fuel Oil or Kerosene | 0 (0.0%) | 0 (0.0%) |
| Coal or Coke | 0 (0.0%) | 0 (0.0%) |
| All other Fuels | 45 (0.3%) | 0 (0.0%) |
| No Fuel Used | 30 (0.2%) | 9 (0.3%) |
| Total | 15,349 (100.0%) | 3,242 (100.0%) |
Household Vehicle Usage in St. Charles Parish
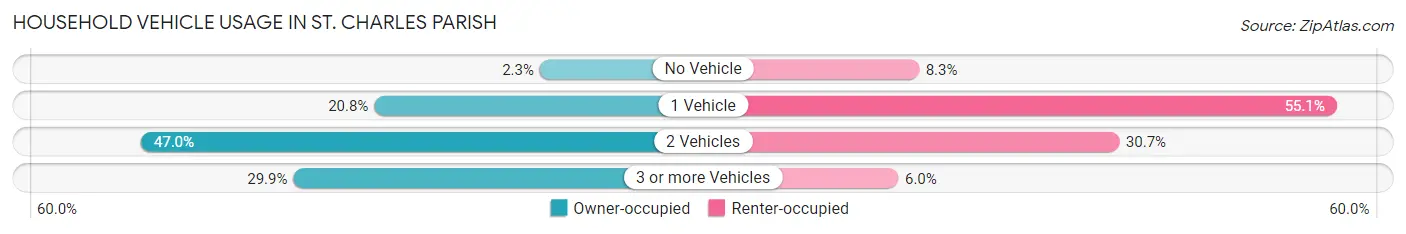
| Vehicles per Household | Owner-occupied | Renter-occupied |
| No Vehicle | 352 (2.3%) | 268 (8.3%) |
| 1 Vehicle | 3,198 (20.8%) | 1,786 (55.1%) |
| 2 Vehicles | 7,209 (47.0%) | 995 (30.7%) |
| 3 or more Vehicles | 4,590 (29.9%) | 193 (5.9%) |
| Total | 15,349 (100.0%) | 3,242 (100.0%) |
Real Estate & Mortgages in St. Charles Parish
Real Estate and Mortgage Overview in St. Charles Parish
| Characteristic | Without Mortgage | With Mortgage |
| Housing Units | 6,309 | 9,040 |
| Median Property Value | $199,900 | $270,400 |
| Median Household Income | $66,380 | $3,059 |
| Monthly Housing Costs | $485 | $602 |
| Real Estate Taxes | $1,259 | $975 |
Property Value by Mortgage Status in St. Charles Parish
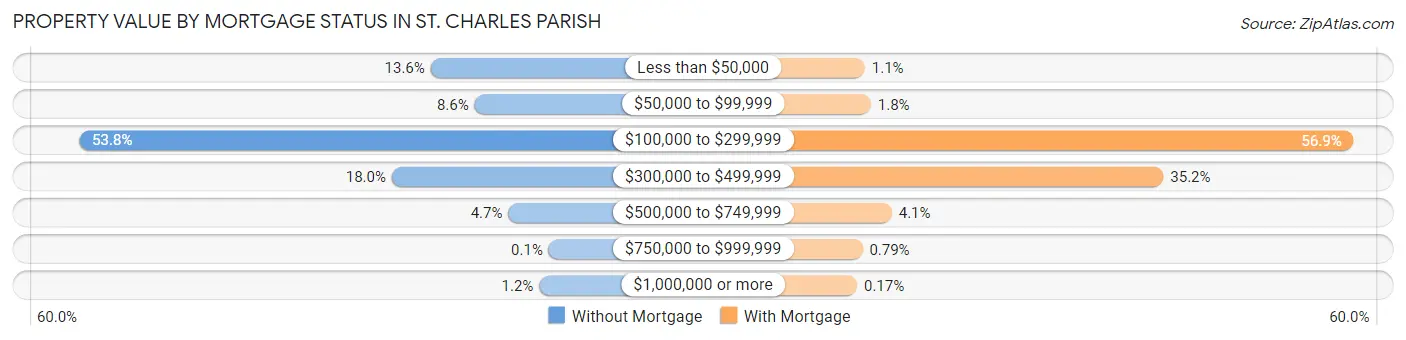
| Property Value | Without Mortgage | With Mortgage |
| Less than $50,000 | 858 (13.6%) | 96 (1.1%) |
| $50,000 to $99,999 | 541 (8.6%) | 158 (1.8%) |
| $100,000 to $299,999 | 3,393 (53.8%) | 5,146 (56.9%) |
| $300,000 to $499,999 | 1,138 (18.0%) | 3,180 (35.2%) |
| $500,000 to $749,999 | 298 (4.7%) | 374 (4.1%) |
| $750,000 to $999,999 | 6 (0.1%) | 71 (0.8%) |
| $1,000,000 or more | 75 (1.2%) | 15 (0.2%) |
| Total | 6,309 (100.0%) | 9,040 (100.0%) |
Household Income by Mortgage Status in St. Charles Parish
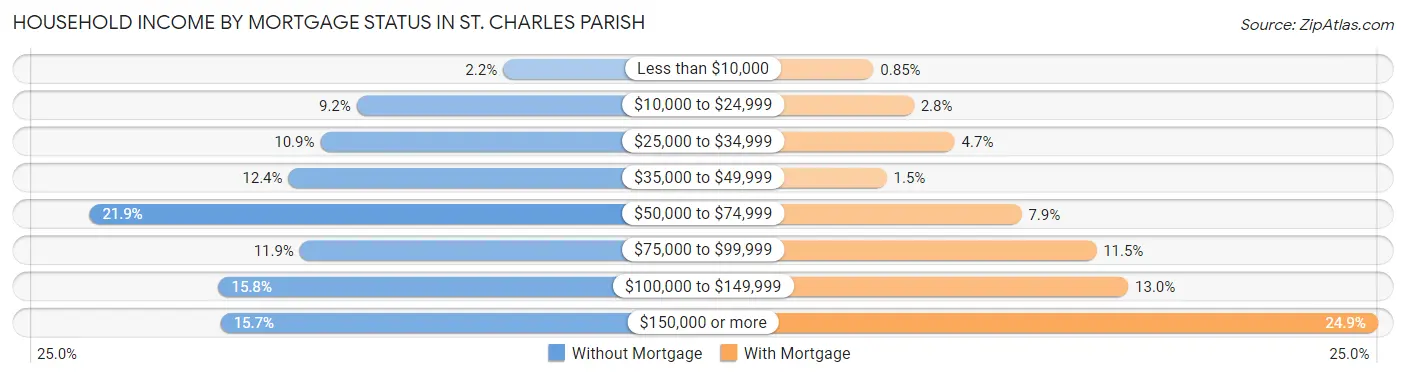
| Household Income | Without Mortgage | With Mortgage |
| Less than $10,000 | 140 (2.2%) | 77 (0.9%) |
| $10,000 to $24,999 | 580 (9.2%) | 250 (2.8%) |
| $25,000 to $34,999 | 689 (10.9%) | 427 (4.7%) |
| $35,000 to $49,999 | 785 (12.4%) | 134 (1.5%) |
| $50,000 to $74,999 | 1,382 (21.9%) | 714 (7.9%) |
| $75,000 to $99,999 | 751 (11.9%) | 1,036 (11.5%) |
| $100,000 to $149,999 | 994 (15.8%) | 1,173 (13.0%) |
| $150,000 or more | 988 (15.7%) | 2,247 (24.9%) |
| Total | 6,309 (100.0%) | 9,040 (100.0%) |
Property Value to Household Income Ratio in St. Charles Parish
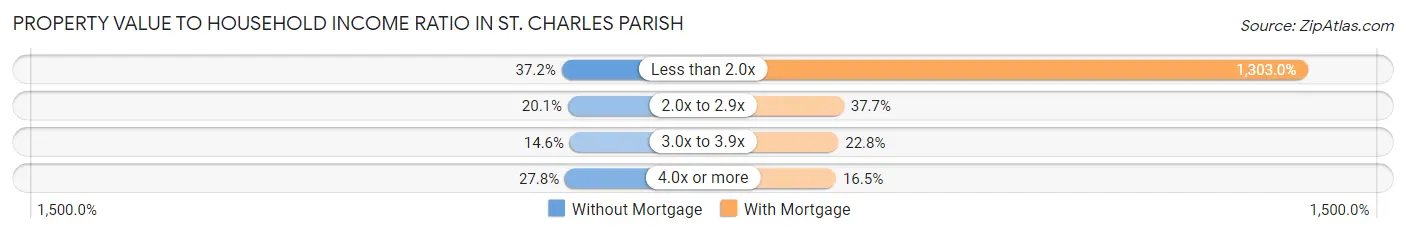
| Value-to-Income Ratio | Without Mortgage | With Mortgage |
| Less than 2.0x | 2,345 (37.2%) | 117,789 (1,303.0%) |
| 2.0x to 2.9x | 1,269 (20.1%) | 3,410 (37.7%) |
| 3.0x to 3.9x | 918 (14.5%) | 2,060 (22.8%) |
| 4.0x or more | 1,752 (27.8%) | 1,493 (16.5%) |
| Total | 6,309 (100.0%) | 9,040 (100.0%) |
Real Estate Taxes by Mortgage Status in St. Charles Parish
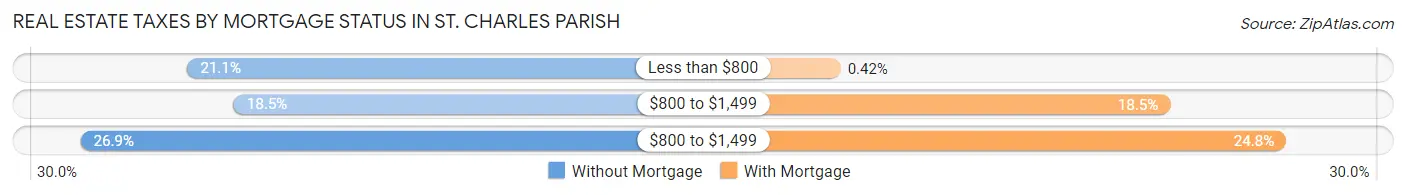
| Property Taxes | Without Mortgage | With Mortgage |
| Less than $800 | 1,329 (21.1%) | 38 (0.4%) |
| $800 to $1,499 | 1,169 (18.5%) | 1,670 (18.5%) |
| $800 to $1,499 | 1,699 (26.9%) | 2,244 (24.8%) |
| Total | 6,309 (100.0%) | 9,040 (100.0%) |
Health & Disability in St. Charles Parish
Health Insurance Coverage by Age in St. Charles Parish
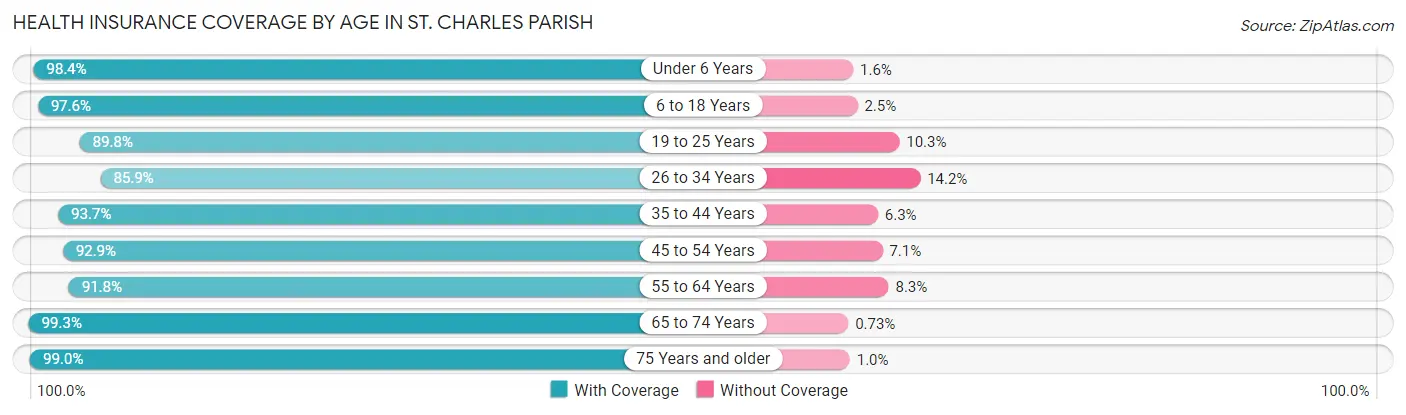
| Age Bracket | With Coverage | Without Coverage |
| Under 6 Years | 3,487 (98.4%) | 58 (1.6%) |
| 6 to 18 Years | 9,360 (97.6%) | 235 (2.5%) |
| 19 to 25 Years | 3,712 (89.7%) | 424 (10.2%) |
| 26 to 34 Years | 5,119 (85.9%) | 844 (14.1%) |
| 35 to 44 Years | 6,361 (93.7%) | 425 (6.3%) |
| 45 to 54 Years | 6,220 (92.9%) | 476 (7.1%) |
| 55 to 64 Years | 6,852 (91.7%) | 616 (8.3%) |
| 65 to 74 Years | 4,760 (99.3%) | 35 (0.7%) |
| 75 Years and older | 2,609 (99.0%) | 27 (1.0%) |
| Total | 48,480 (93.9%) | 3,140 (6.1%) |
Health Insurance Coverage by Citizenship Status in St. Charles Parish
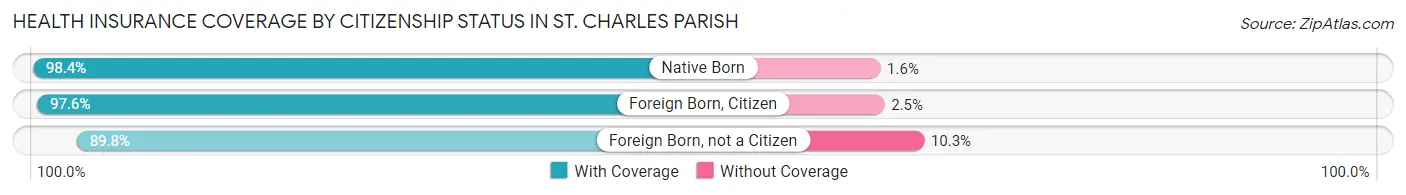
| Citizenship Status | With Coverage | Without Coverage |
| Native Born | 3,487 (98.4%) | 58 (1.6%) |
| Foreign Born, Citizen | 9,360 (97.6%) | 235 (2.5%) |
| Foreign Born, not a Citizen | 3,712 (89.7%) | 424 (10.2%) |
Health Insurance Coverage by Household Income in St. Charles Parish
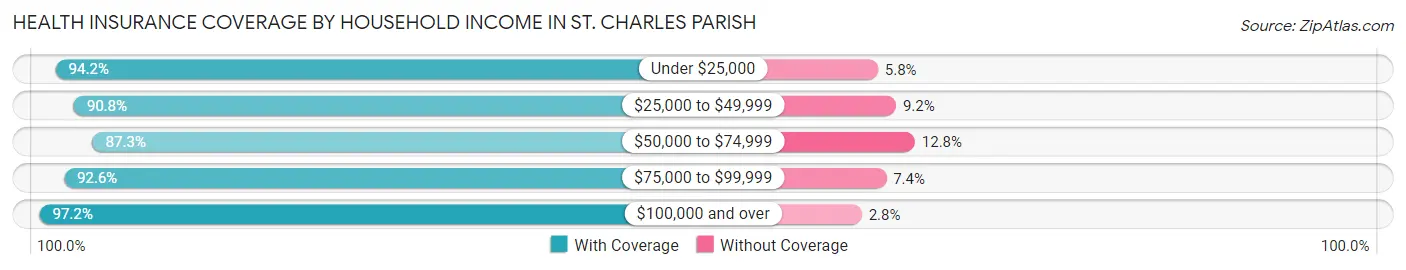
| Household Income | With Coverage | Without Coverage |
| Under $25,000 | 4,222 (94.2%) | 261 (5.8%) |
| $25,000 to $49,999 | 7,817 (90.8%) | 794 (9.2%) |
| $50,000 to $74,999 | 6,430 (87.3%) | 940 (12.8%) |
| $75,000 to $99,999 | 5,522 (92.6%) | 440 (7.4%) |
| $100,000 and over | 24,477 (97.2%) | 704 (2.8%) |
Public vs Private Health Insurance Coverage by Age in St. Charles Parish
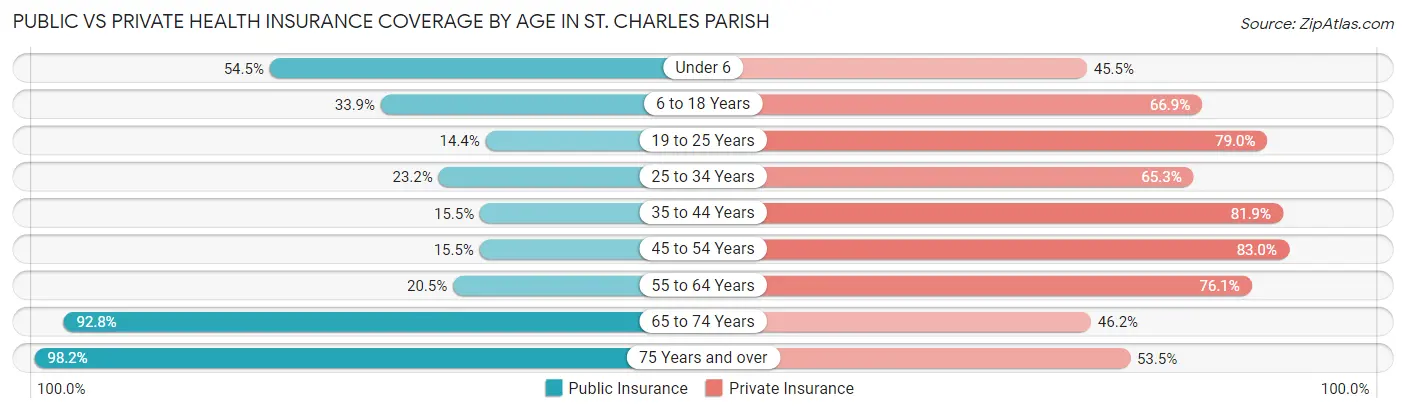
| Age Bracket | Public Insurance | Private Insurance |
| Under 6 | 1,932 (54.5%) | 1,612 (45.5%) |
| 6 to 18 Years | 3,250 (33.9%) | 6,415 (66.9%) |
| 19 to 25 Years | 597 (14.4%) | 3,266 (79.0%) |
| 25 to 34 Years | 1,381 (23.2%) | 3,892 (65.3%) |
| 35 to 44 Years | 1,049 (15.5%) | 5,555 (81.9%) |
| 45 to 54 Years | 1,040 (15.5%) | 5,554 (83.0%) |
| 55 to 64 Years | 1,529 (20.5%) | 5,680 (76.1%) |
| 65 to 74 Years | 4,449 (92.8%) | 2,217 (46.2%) |
| 75 Years and over | 2,588 (98.2%) | 1,410 (53.5%) |
| Total | 17,815 (34.5%) | 35,601 (69.0%) |
Disability Status by Sex by Age in St. Charles Parish
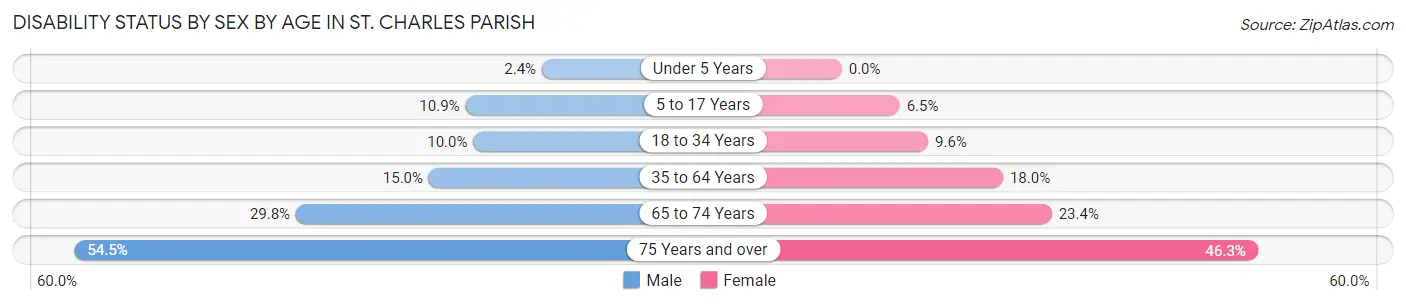
| Age Bracket | Male | Female |
| Under 5 Years | 37 (2.4%) | 0 (0.0%) |
| 5 to 17 Years | 560 (10.9%) | 301 (6.5%) |
| 18 to 34 Years | 536 (10.0%) | 505 (9.6%) |
| 35 to 64 Years | 1,506 (15.0%) | 1,956 (17.9%) |
| 65 to 74 Years | 702 (29.8%) | 570 (23.4%) |
| 75 Years and over | 624 (54.4%) | 690 (46.3%) |
Disability Class by Sex by Age in St. Charles Parish
Disability Class: Hearing Difficulty
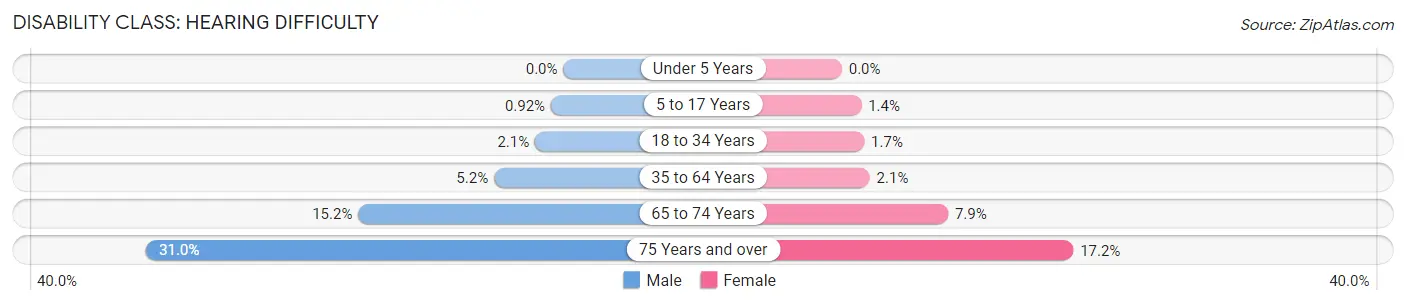
| Age Bracket | Male | Female |
| Under 5 Years | 0 (0.0%) | 0 (0.0%) |
| 5 to 17 Years | 47 (0.9%) | 67 (1.4%) |
| 18 to 34 Years | 112 (2.1%) | 87 (1.7%) |
| 35 to 64 Years | 518 (5.1%) | 226 (2.1%) |
| 65 to 74 Years | 359 (15.2%) | 192 (7.9%) |
| 75 Years and over | 355 (31.0%) | 256 (17.2%) |
Disability Class: Vision Difficulty
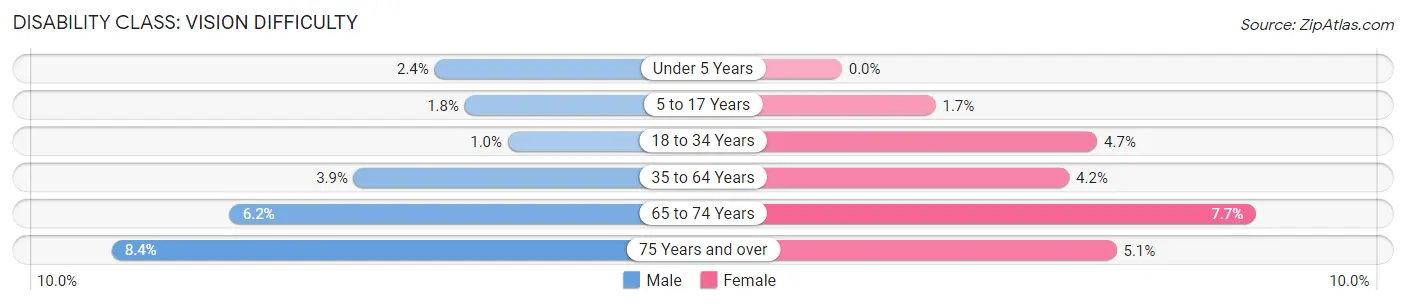
| Age Bracket | Male | Female |
| Under 5 Years | 37 (2.4%) | 0 (0.0%) |
| 5 to 17 Years | 94 (1.8%) | 81 (1.7%) |
| 18 to 34 Years | 55 (1.0%) | 249 (4.7%) |
| 35 to 64 Years | 391 (3.9%) | 460 (4.2%) |
| 65 to 74 Years | 146 (6.2%) | 187 (7.7%) |
| 75 Years and over | 96 (8.4%) | 76 (5.1%) |
Disability Class: Cognitive Difficulty
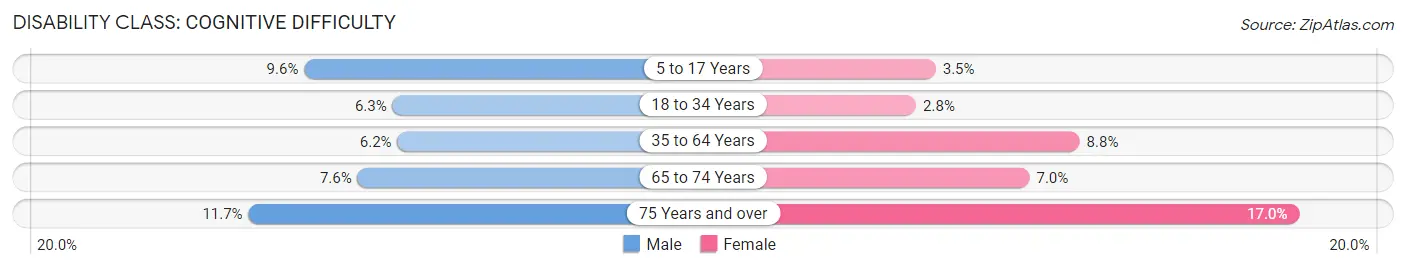
| Age Bracket | Male | Female |
| 5 to 17 Years | 494 (9.6%) | 163 (3.5%) |
| 18 to 34 Years | 339 (6.3%) | 145 (2.8%) |
| 35 to 64 Years | 619 (6.2%) | 962 (8.8%) |
| 65 to 74 Years | 180 (7.6%) | 170 (7.0%) |
| 75 Years and over | 134 (11.7%) | 253 (17.0%) |
Disability Class: Ambulatory Difficulty
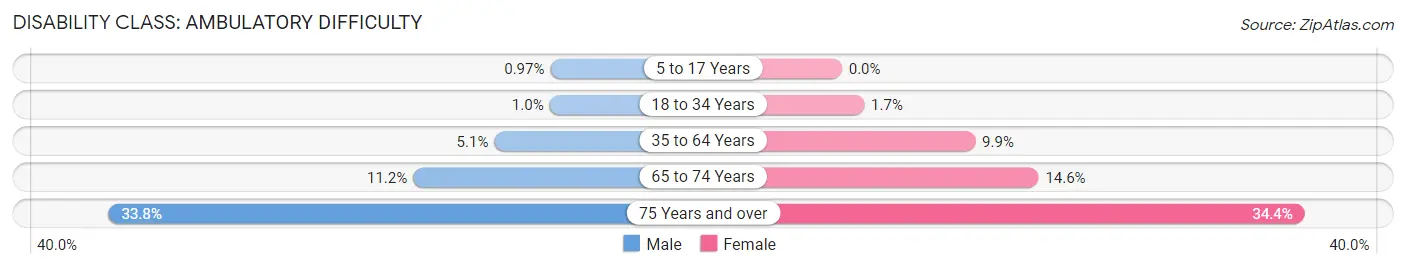
| Age Bracket | Male | Female |
| 5 to 17 Years | 50 (1.0%) | 0 (0.0%) |
| 18 to 34 Years | 55 (1.0%) | 87 (1.7%) |
| 35 to 64 Years | 516 (5.1%) | 1,078 (9.9%) |
| 65 to 74 Years | 263 (11.2%) | 356 (14.6%) |
| 75 Years and over | 387 (33.8%) | 512 (34.4%) |
Disability Class: Self-Care Difficulty
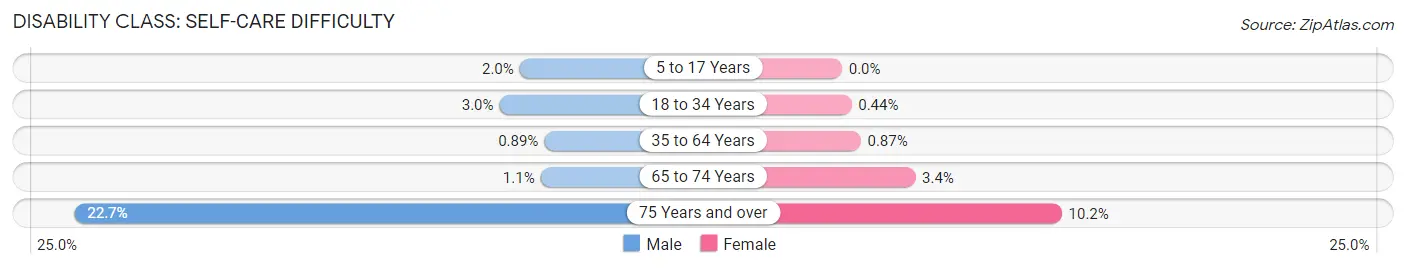
| Age Bracket | Male | Female |
| 5 to 17 Years | 104 (2.0%) | 0 (0.0%) |
| 18 to 34 Years | 159 (3.0%) | 23 (0.4%) |
| 35 to 64 Years | 89 (0.9%) | 95 (0.9%) |
| 65 to 74 Years | 25 (1.1%) | 83 (3.4%) |
| 75 Years and over | 260 (22.7%) | 152 (10.2%) |
Technology Access in St. Charles Parish
Computing Device Access in St. Charles Parish
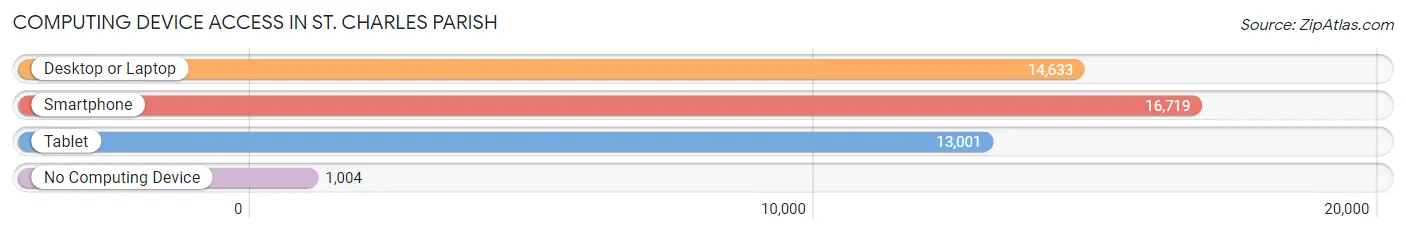
| Device Type | # Households | % Households |
| Desktop or Laptop | 14,633 | 78.7% |
| Smartphone | 16,719 | 89.9% |
| Tablet | 13,001 | 69.9% |
| No Computing Device | 1,004 | 5.4% |
| Total | 18,591 | 100.0% |
Internet Access in St. Charles Parish
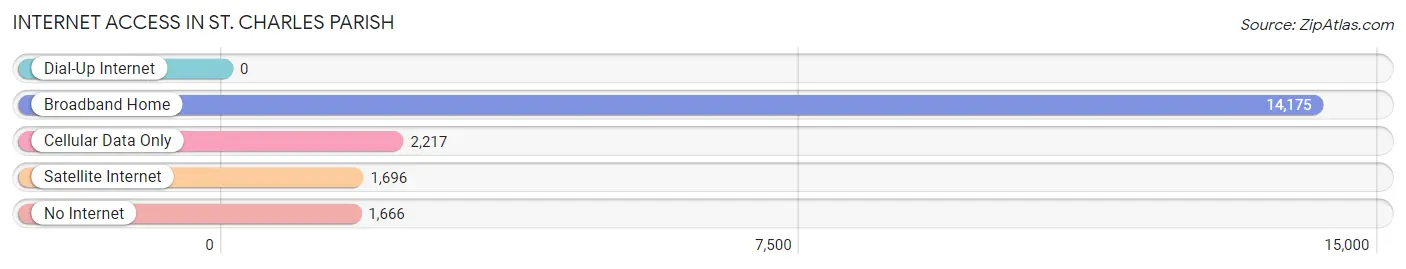
| Internet Type | # Households | % Households |
| Dial-Up Internet | 0 | 0.0% |
| Broadband Home | 14,175 | 76.2% |
| Cellular Data Only | 2,217 | 11.9% |
| Satellite Internet | 1,696 | 9.1% |
| No Internet | 1,666 | 9.0% |
| Total | 18,591 | 100.0% |
St. Charles Parish Summary
St. Charles Parish is a parish located in the southeastern part of Louisiana, United States. It is part of the New Orleans-Metairie-Kenner Metropolitan Statistical Area. As of the 2010 census, the population was 52,780. The parish seat is Hahnville.
History
St. Charles Parish was established in 1807, making it one of the oldest parishes in Louisiana. It was named after Charles III, King of Spain, who had granted the land to the French in 1762. The parish was originally part of the German Coast, an area of Louisiana settled by German immigrants in the early 1700s.
The parish was home to many plantations, including the historic Destrehan Plantation, which was built in 1787 and is now a National Historic Landmark. The parish was also home to the first sugar mill in the United States, which was built in 1795.
Geography
St. Charles Parish is located in the southeastern part of Louisiana, about 25 miles west of New Orleans. It is bordered by Jefferson Parish to the north, St. John the Baptist Parish to the east, and St. James Parish to the south. The Mississippi River forms the western boundary of the parish.
The parish has a total area of 545 square miles, of which 541 square miles is land and 4.2 square miles is water. The terrain is mostly flat, with some rolling hills in the northern part of the parish.
Economy
St. Charles Parish has a diverse economy, with industries ranging from agriculture to manufacturing. The parish is home to several large industrial plants, including a chemical plant, a paper mill, and a steel mill.
Agriculture is also an important part of the economy, with sugarcane, soybeans, and corn being the main crops. The parish is also home to several seafood processing plants, which process shrimp, oysters, and crabs.
Demographics
As of the 2010 census, there were 52,780 people, 18,845 households, and 14,072 families residing in the parish. The population density was 97.7 people per square mile. The racial makeup of the parish was 68.2% White, 28.2% African American, 0.4% Native American, 0.7% Asian, 0.1% Pacific Islander, 0.7% from other races, and 1.7% from two or more races. Hispanic or Latino of any race were 3.2% of the population.
The median income for a household in the parish was $50,945, and the median income for a family was $60,945. The per capita income for the parish was $24,845. About 11.2% of families and 14.2% of the population were below the poverty line, including 19.2% of those under age 18 and 10.2% of those age 65 or over.
Common Questions
What is the Total Population of St. Charles Parish?
Total Population of St. Charles Parish is 52,191.
What is the Total Male Population of St. Charles Parish?
Total Male Population of St. Charles Parish is 26,017.
What is the Total Female Population of St. Charles Parish?
Total Female Population of St. Charles Parish is 26,174.
What is the Ratio of Males per 100 Females in St. Charles Parish?
There are 99.40 Males per 100 Females in St. Charles Parish.
What is the Ratio of Females per 100 Males in St. Charles Parish?
There are 100.60 Females per 100 Males in St. Charles Parish.
What is the Median Population Age in St. Charles Parish?
Median Population Age in St. Charles Parish is 38.8 Years.
What is the Average Family Size in St. Charles Parish
Average Family Size in St. Charles Parish is 3.2 People.
What is the Average Household Size in St. Charles Parish
Average Household Size in St. Charles Parish is 2.8 People.
What is Per Capita Income in St. Charles Parish?
Per Capita income in St. Charles Parish is $38,220.
What is the Median Family Income in St. Charles Parish?
Median Family Income in St. Charles Parish is $94,964.
What is the Median Household income in St. Charles Parish?
Median Household Income in St. Charles Parish is $79,191.
What is Income or Wage Gap in St. Charles Parish?
Income or Wage Gap in St. Charles Parish is 34.1%.
Women in St. Charles Parish earn 65.9 cents for every dollar earned by a man.
What is Family Income Deficit in St. Charles Parish?
Family Income Deficit in St. Charles Parish is $6,796.
Families that are below poverty line in St. Charles Parish earn $6,796 less on average than the poverty threshold level.
What is Inequality or Gini Index in St. Charles Parish?
Inequality or Gini Index in St. Charles Parish is 0.44.
How Large is the Labor Force in St. Charles Parish?
There are 26,219 People in the Labor Forcein in St. Charles Parish.
What is the Percentage of People in the Labor Force in St. Charles Parish?
63.9% of People are in the Labor Force in St. Charles Parish.
What is the Unemployment Rate in St. Charles Parish?
Unemployment Rate in St. Charles Parish is 6.7%.