St. Bernard Parish, LA
St. Bernard Parish Map
St. Bernard Parish Overview
44,038
TOTAL POPULATION
21,711
MALE POPULATION
22,327
FEMALE POPULATION
97.24
MALES / 100 FEMALES
102.84
FEMALES / 100 MALES
35.6
MEDIAN AGE
3.4
AVG FAMILY SIZE
2.8
AVG HOUSEHOLD SIZE
$28,451
PER CAPITA INCOME
$66,964
AVG FAMILY INCOME
$55,857
AVG HOUSEHOLD INCOME
30.7%
WAGE / INCOME GAP [ % ]
69.3¢/ $1
WAGE / INCOME GAP [ $ ]
$11,372
FAMILY INCOME DEFICIT
0.48
INEQUALITY / GINI INDEX
20,538
LABOR FORCE [ PEOPLE ]
60.5%
PERCENT IN LABOR FORCE
8.0%
UNEMPLOYMENT RATE
St. Bernard Parish Area Codes
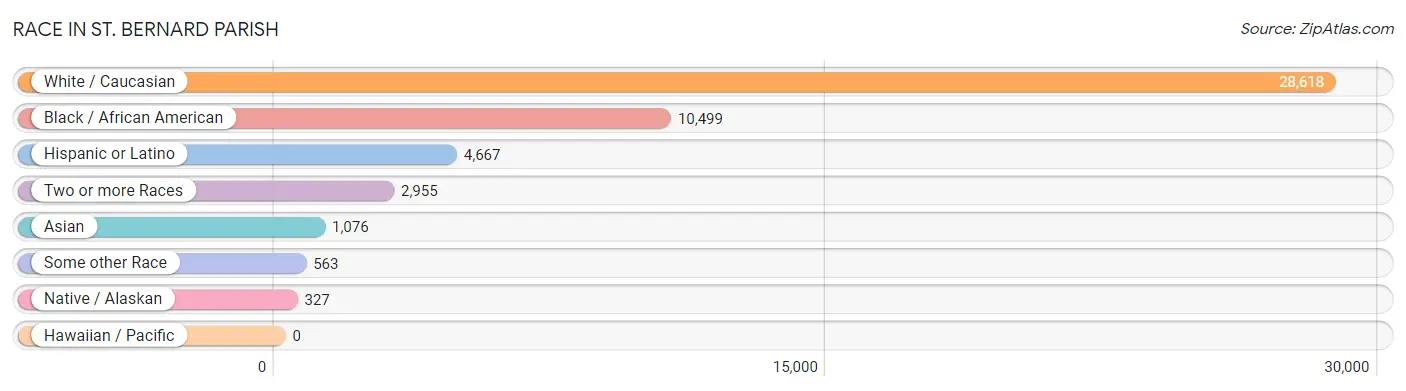
Race in St. Bernard Parish
The most populous races in St. Bernard Parish are White / Caucasian (28,618 | 65.0%), Black / African American (10,499 | 23.8%), and Hispanic or Latino (4,667 | 10.6%).
| Race | # Population | % Population |
| Asian | 1,076 | 2.4% |
| Black / African American | 10,499 | 23.8% |
| Hawaiian / Pacific | 0 | 0.0% |
| Hispanic or Latino | 4,667 | 10.6% |
| Native / Alaskan | 327 | 0.7% |
| White / Caucasian | 28,618 | 65.0% |
| Two or more Races | 2,955 | 6.7% |
| Some other Race | 563 | 1.3% |
| Total | 44,038 | 100.0% |
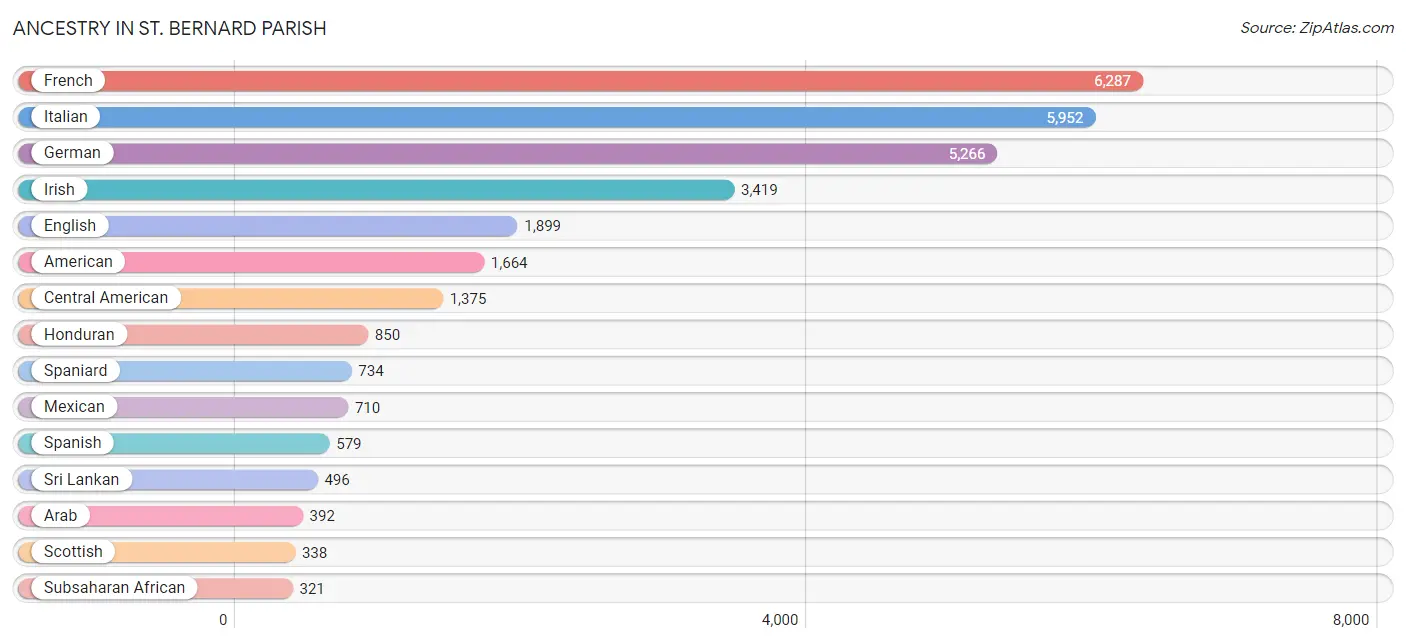
Ancestry in St. Bernard Parish
The most populous ancestries reported in St. Bernard Parish are French (6,287 | 14.3%), Italian (5,952 | 13.5%), German (5,266 | 12.0%), Irish (3,419 | 7.8%), and English (1,899 | 4.3%), together accounting for 51.8% of all St. Bernard Parish residents.
| Ancestry | # Population | % Population |
| African | 297 | 0.7% |
| American | 1,664 | 3.8% |
| Apache | 7 | 0.0% |
| Arab | 392 | 0.9% |
| Austrian | 75 | 0.2% |
| Belgian | 6 | 0.0% |
| Belizean | 17 | 0.0% |
| Brazilian | 19 | 0.0% |
| British | 234 | 0.5% |
| Cajun | 239 | 0.5% |
| Canadian | 6 | 0.0% |
| Carpatho Rusyn | 6 | 0.0% |
| Central American | 1,375 | 3.1% |
| Cherokee | 112 | 0.3% |
| Chilean | 7 | 0.0% |
| Choctaw | 7 | 0.0% |
| Colombian | 13 | 0.0% |
| Comanche | 13 | 0.0% |
| Costa Rican | 18 | 0.0% |
| Creek | 3 | 0.0% |
| Croatian | 5 | 0.0% |
| Crow | 68 | 0.2% |
| Cuban | 212 | 0.5% |
| Czech | 24 | 0.1% |
| Czechoslovakian | 10 | 0.0% |
| Danish | 21 | 0.1% |
| Dominican | 16 | 0.0% |
| Dutch | 148 | 0.3% |
| Ecuadorian | 24 | 0.1% |
| Egyptian | 83 | 0.2% |
| English | 1,899 | 4.3% |
| European | 277 | 0.6% |
| French | 6,287 | 14.3% |
| French American Indian | 27 | 0.1% |
| French Canadian | 261 | 0.6% |
| German | 5,266 | 12.0% |
| Greek | 132 | 0.3% |
| Guatemalan | 108 | 0.3% |
| Haitian | 63 | 0.1% |
| Honduran | 850 | 1.9% |
| Houma | 99 | 0.2% |
| Hungarian | 6 | 0.0% |
| Icelander | 52 | 0.1% |
| Indian (Asian) | 262 | 0.6% |
| Irish | 3,419 | 7.8% |
| Italian | 5,952 | 13.5% |
| Jamaican | 19 | 0.0% |
| Japanese | 49 | 0.1% |
| Jordanian | 13 | 0.0% |
| Korean | 275 | 0.6% |
| Laotian | 2 | 0.0% |
| Lebanese | 34 | 0.1% |
| Malaysian | 10 | 0.0% |
| Mexican | 710 | 1.6% |
| Nicaraguan | 162 | 0.4% |
| Northern European | 6 | 0.0% |
| Norwegian | 39 | 0.1% |
| Palestinian | 254 | 0.6% |
| Polish | 111 | 0.3% |
| Portuguese | 22 | 0.1% |
| Pueblo | 48 | 0.1% |
| Puerto Rican | 186 | 0.4% |
| Russian | 73 | 0.2% |
| Salvadoran | 237 | 0.5% |
| Scandinavian | 99 | 0.2% |
| Scotch-Irish | 147 | 0.3% |
| Scottish | 338 | 0.8% |
| Slavic | 2 | 0.0% |
| Slovak | 8 | 0.0% |
| South American | 44 | 0.1% |
| Spaniard | 734 | 1.7% |
| Spanish | 579 | 1.3% |
| Sri Lankan | 496 | 1.1% |
| Subsaharan African | 321 | 0.7% |
| Swedish | 68 | 0.2% |
| Swiss | 39 | 0.1% |
| Thai | 148 | 0.3% |
| Turkish | 11 | 0.0% |
| Ukrainian | 14 | 0.0% |
| Welsh | 102 | 0.2% |
| Zimbabwean | 11 | 0.0% | View All 81 Rows |
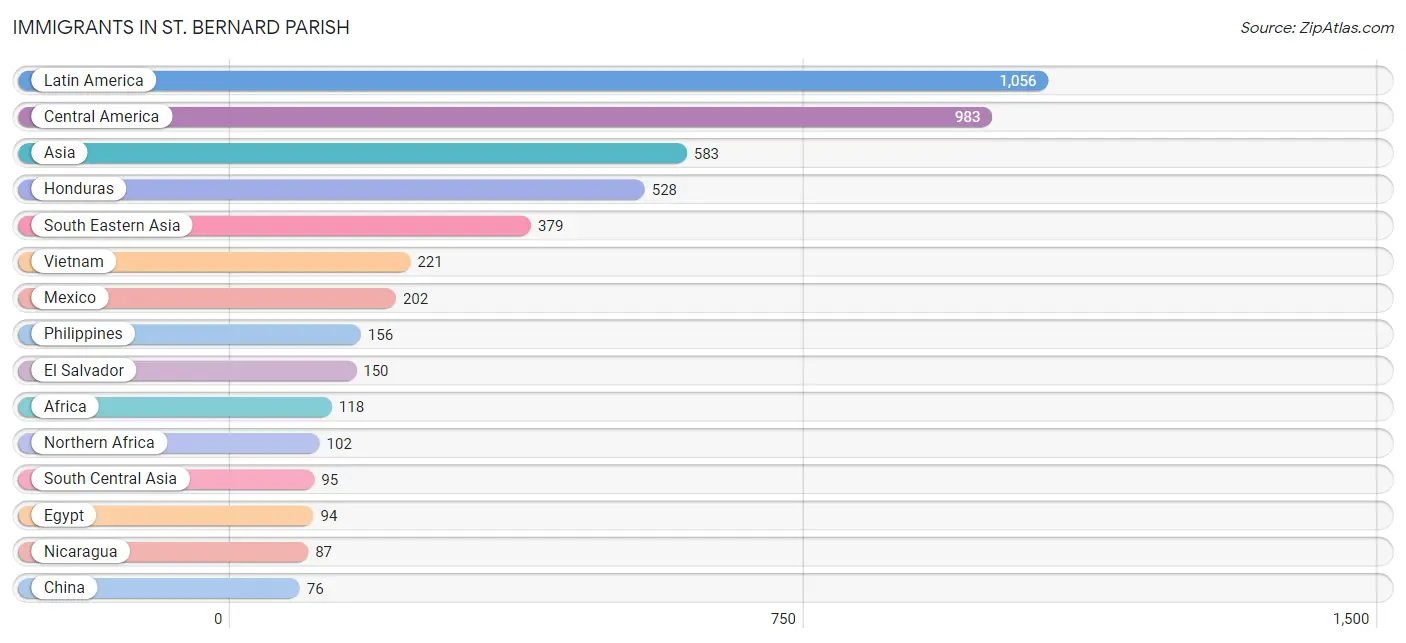
Immigrants in St. Bernard Parish
The most numerous immigrant groups reported in St. Bernard Parish came from Latin America (1,056 | 2.4%), Central America (983 | 2.2%), Asia (583 | 1.3%), Honduras (528 | 1.2%), and South Eastern Asia (379 | 0.9%), together accounting for 8.0% of all St. Bernard Parish residents.
| Immigration Origin | # Population | % Population |
| Africa | 118 | 0.3% |
| Asia | 583 | 1.3% |
| Brazil | 1 | 0.0% |
| Canada | 8 | 0.0% |
| Caribbean | 47 | 0.1% |
| Central America | 983 | 2.2% |
| Chile | 3 | 0.0% |
| China | 76 | 0.2% |
| Colombia | 4 | 0.0% |
| Cuba | 47 | 0.1% |
| Eastern Africa | 11 | 0.0% |
| Eastern Asia | 76 | 0.2% |
| Egypt | 94 | 0.2% |
| El Salvador | 150 | 0.3% |
| Europe | 72 | 0.2% |
| France | 20 | 0.1% |
| Germany | 25 | 0.1% |
| Guatemala | 16 | 0.0% |
| Honduras | 528 | 1.2% |
| India | 10 | 0.0% |
| Indonesia | 2 | 0.0% |
| Israel | 12 | 0.0% |
| Italy | 17 | 0.0% |
| Jordan | 15 | 0.0% |
| Latin America | 1,056 | 2.4% |
| Mexico | 202 | 0.5% |
| Nicaragua | 87 | 0.2% |
| Northern Africa | 102 | 0.2% |
| Pakistan | 71 | 0.2% |
| Peru | 18 | 0.0% |
| Philippines | 156 | 0.4% |
| South America | 26 | 0.1% |
| South Central Asia | 95 | 0.2% |
| South Eastern Asia | 379 | 0.9% |
| Southern Europe | 17 | 0.0% |
| Sri Lanka | 14 | 0.0% |
| Vietnam | 221 | 0.5% |
| Western Africa | 5 | 0.0% |
| Western Asia | 27 | 0.1% |
| Western Europe | 45 | 0.1% |
| Zimbabwe | 11 | 0.0% | View All 41 Rows |
Sex and Age in St. Bernard Parish
Sex and Age in St. Bernard Parish
The most populous age groups in St. Bernard Parish are 10 to 14 Years (1,739 | 8.0%) for men and 30 to 34 Years (1,958 | 8.8%) for women.
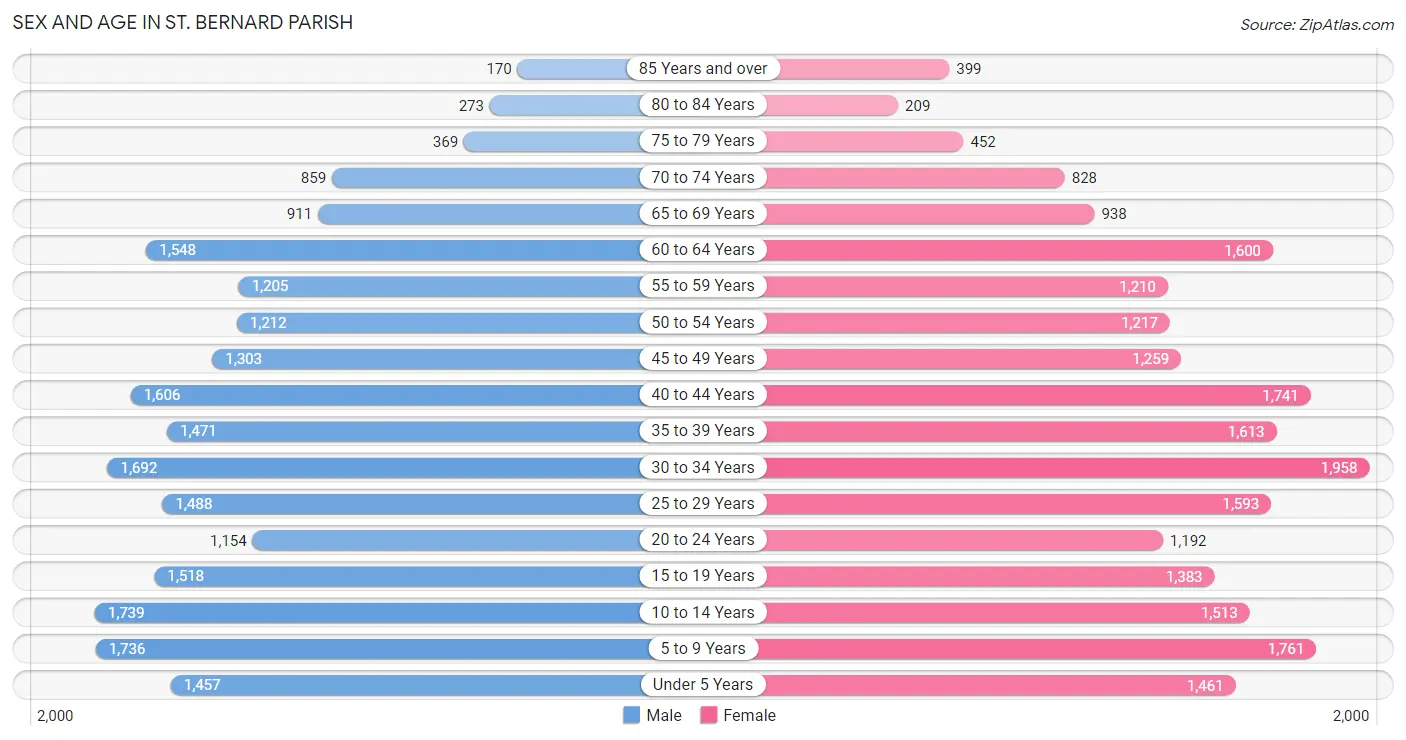
| Age Bracket | Male | Female |
| Under 5 Years | 1,457 (6.7%) | 1,461 (6.5%) |
| 5 to 9 Years | 1,736 (8.0%) | 1,761 (7.9%) |
| 10 to 14 Years | 1,739 (8.0%) | 1,513 (6.8%) |
| 15 to 19 Years | 1,518 (7.0%) | 1,383 (6.2%) |
| 20 to 24 Years | 1,154 (5.3%) | 1,192 (5.3%) |
| 25 to 29 Years | 1,488 (6.9%) | 1,593 (7.1%) |
| 30 to 34 Years | 1,692 (7.8%) | 1,958 (8.8%) |
| 35 to 39 Years | 1,471 (6.8%) | 1,613 (7.2%) |
| 40 to 44 Years | 1,606 (7.4%) | 1,741 (7.8%) |
| 45 to 49 Years | 1,303 (6.0%) | 1,259 (5.6%) |
| 50 to 54 Years | 1,212 (5.6%) | 1,217 (5.4%) |
| 55 to 59 Years | 1,205 (5.6%) | 1,210 (5.4%) |
| 60 to 64 Years | 1,548 (7.1%) | 1,600 (7.2%) |
| 65 to 69 Years | 911 (4.2%) | 938 (4.2%) |
| 70 to 74 Years | 859 (4.0%) | 828 (3.7%) |
| 75 to 79 Years | 369 (1.7%) | 452 (2.0%) |
| 80 to 84 Years | 273 (1.3%) | 209 (0.9%) |
| 85 Years and over | 170 (0.8%) | 399 (1.8%) |
| Total | 21,711 (100.0%) | 22,327 (100.0%) |
Families and Households in St. Bernard Parish
Median Family Size in St. Bernard Parish
The median family size in St. Bernard Parish is 3.44 persons per family, with single female/mother families (3,191 | 30.6%) accounting for the largest median family size of 3.59 persons per family. On the other hand, single male/father families (1,078 | 10.3%) represent the smallest median family size with 2.94 persons per family.
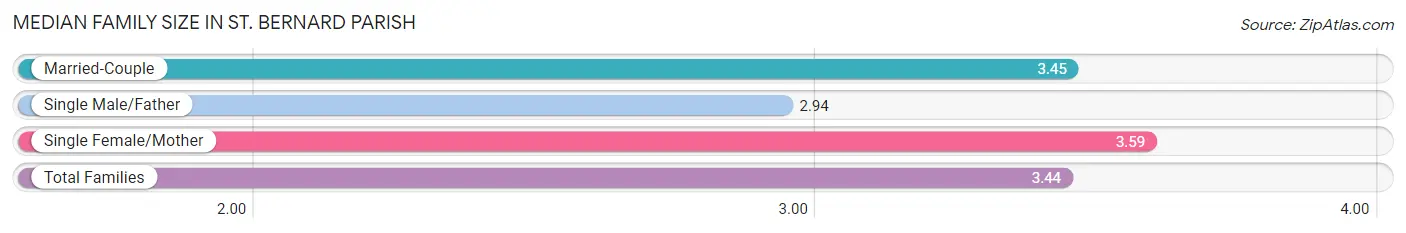
| Family Type | # Families | Family Size |
| Married-Couple | 6,152 (59.0%) | 3.45 |
| Single Male/Father | 1,078 (10.3%) | 2.94 |
| Single Female/Mother | 3,191 (30.6%) | 3.59 |
| Total Families | 10,421 (100.0%) | 3.44 |
Median Household Size in St. Bernard Parish
The median household size in St. Bernard Parish is 2.78 persons per household, with single female/mother households (3,191 | 20.3%) accounting for the largest median household size of 3.81 persons per household. non-family households (5,311 | 33.8%) represent the smallest median household size with 1.23 persons per household.
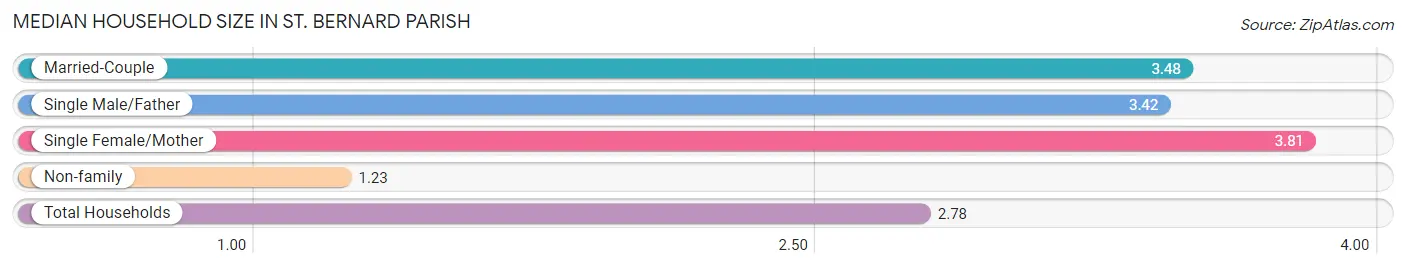
| Household Type | # Households | Household Size |
| Married-Couple | 6,152 (39.1%) | 3.48 |
| Single Male/Father | 1,078 (6.9%) | 3.42 |
| Single Female/Mother | 3,191 (20.3%) | 3.81 |
| Non-family | 5,311 (33.8%) | 1.23 |
| Total Households | 15,732 (100.0%) | 2.78 |
Household Size by Marriage Status in St. Bernard Parish
Out of a total of 15,732 households in St. Bernard Parish, 10,421 (66.2%) are family households, while 5,311 (33.8%) are nonfamily households. The most numerous type of family households are 2-person households, comprising 3,944, and the most common type of nonfamily households are 1-person households, comprising 4,472.
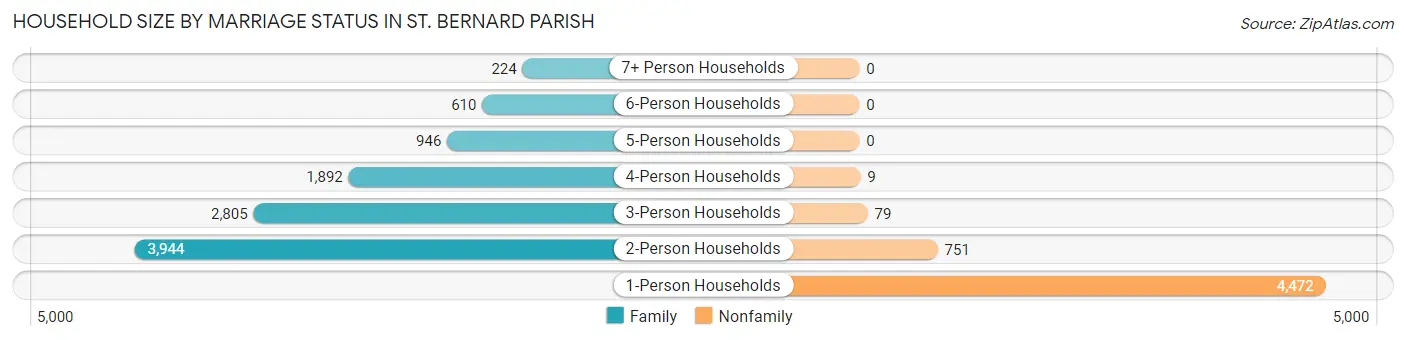
| Household Size | Family Households | Nonfamily Households |
| 1-Person Households | - | 4,472 (28.4%) |
| 2-Person Households | 3,944 (25.1%) | 751 (4.8%) |
| 3-Person Households | 2,805 (17.8%) | 79 (0.5%) |
| 4-Person Households | 1,892 (12.0%) | 9 (0.1%) |
| 5-Person Households | 946 (6.0%) | 0 (0.0%) |
| 6-Person Households | 610 (3.9%) | 0 (0.0%) |
| 7+ Person Households | 224 (1.4%) | 0 (0.0%) |
| Total | 10,421 (66.2%) | 5,311 (33.8%) |
Female Fertility in St. Bernard Parish
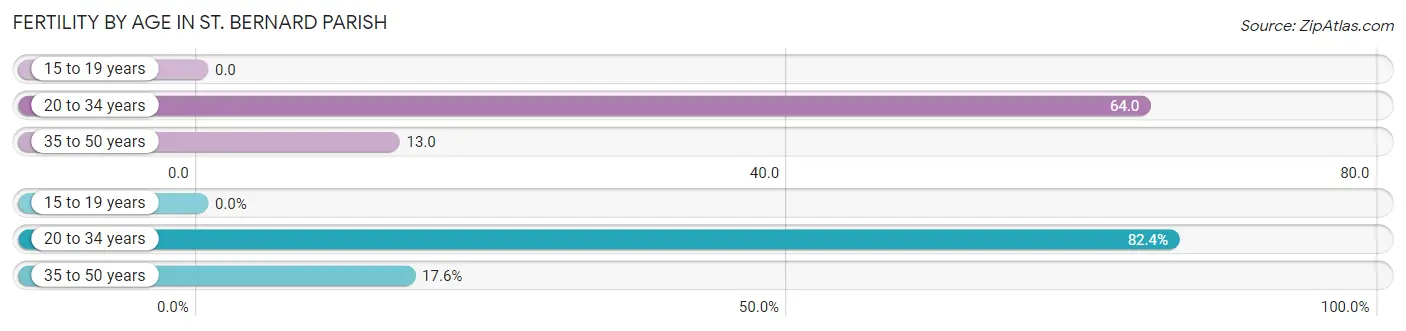
Fertility by Age in St. Bernard Parish
Average fertility rate in St. Bernard Parish is 34.0 births per 1,000 women. Women in the age bracket of 20 to 34 years have the highest fertility rate with 64.0 births per 1,000 women. Women in the age bracket of 20 to 34 years acount for 82.4% of all women with births.
| Age Bracket | Women with Births | Births / 1,000 Women |
| 15 to 19 years | 0 (0.0%) | 0.0 |
| 20 to 34 years | 305 (82.4%) | 64.0 |
| 35 to 50 years | 65 (17.6%) | 13.0 |
| Total | 370 (100.0%) | 34.0 |
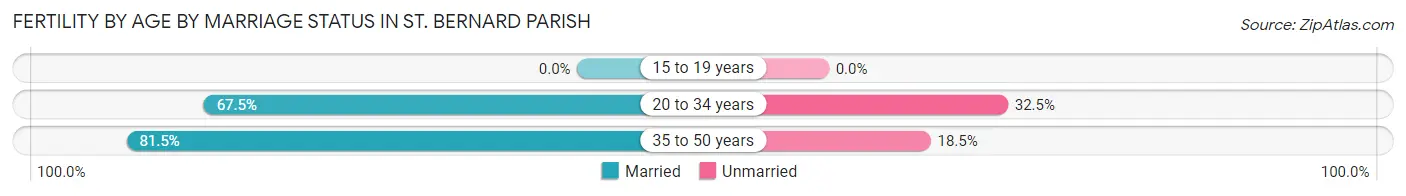
Fertility by Age by Marriage Status in St. Bernard Parish
70.0% of women with births (370) in St. Bernard Parish are married. The highest percentage of unmarried women with births falls into 20 to 34 years age bracket with 32.5% of them unmarried at the time of birth, while the lowest percentage of unmarried women with births belong to 35 to 50 years age bracket with 18.5% of them unmarried.
| Age Bracket | Married | Unmarried |
| 15 to 19 years | 0 (0.0%) | 0 (0.0%) |
| 20 to 34 years | 206 (67.5%) | 99 (32.5%) |
| 35 to 50 years | 53 (81.5%) | 12 (18.5%) |
| Total | 259 (70.0%) | 111 (30.0%) |
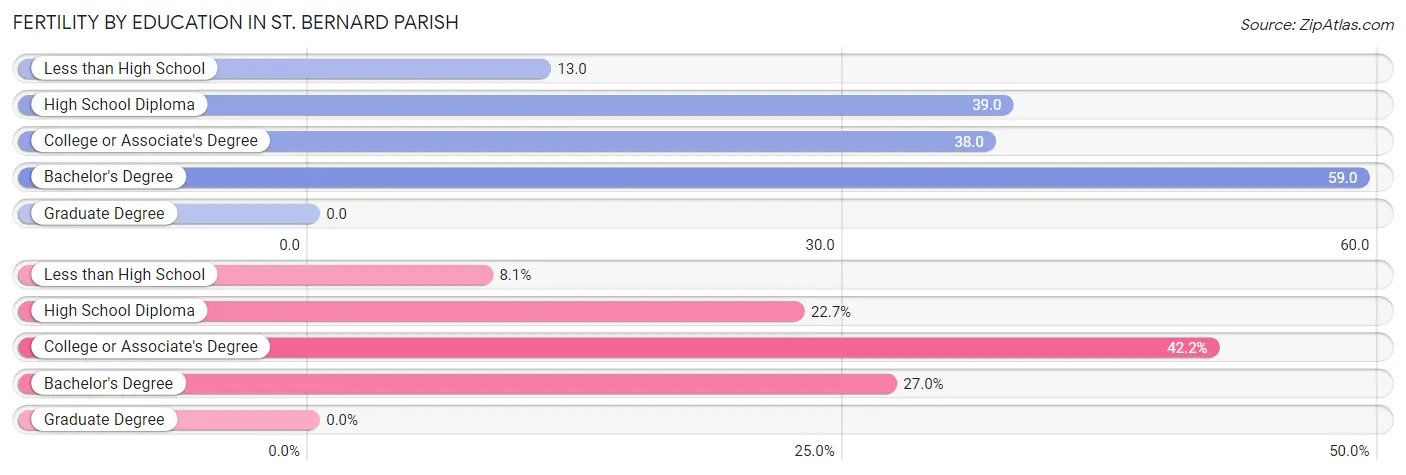
Fertility by Education in St. Bernard Parish
| Educational Attainment | Women with Births | Births / 1,000 Women |
| Less than High School | 30 (8.1%) | 13.0 |
| High School Diploma | 84 (22.7%) | 39.0 |
| College or Associate's Degree | 156 (42.2%) | 38.0 |
| Bachelor's Degree | 100 (27.0%) | 59.0 |
| Graduate Degree | 0 (0.0%) | 0.0 |
| Total | 370 (100.0%) | 34.0 |
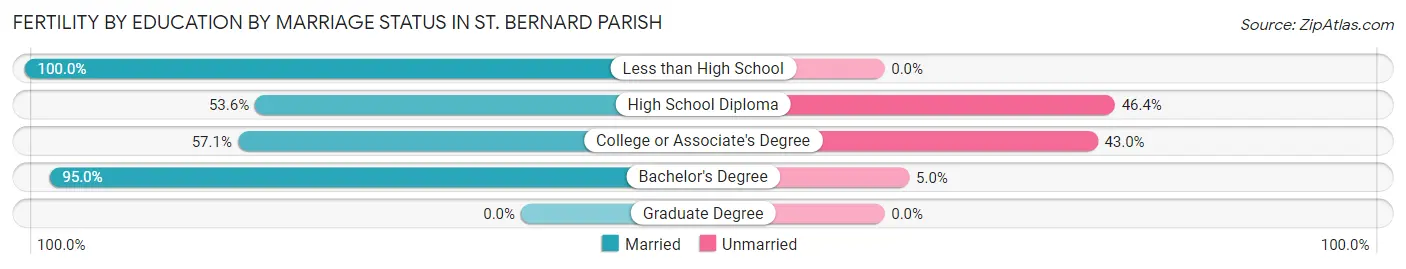
Fertility by Education by Marriage Status in St. Bernard Parish
30.0% of women with births in St. Bernard Parish are unmarried. Women with the educational attainment of less than high school are most likely to be married with 100.0% of them married at childbirth, while women with the educational attainment of high school diploma are least likely to be married with 46.4% of them unmarried at childbirth.
| Educational Attainment | Married | Unmarried |
| Less than High School | 30 (100.0%) | 0 (0.0%) |
| High School Diploma | 45 (53.6%) | 39 (46.4%) |
| College or Associate's Degree | 89 (57.1%) | 67 (42.9%) |
| Bachelor's Degree | 95 (95.0%) | 5 (5.0%) |
| Graduate Degree | 0 (0.0%) | 0 (0.0%) |
| Total | 259 (70.0%) | 111 (30.0%) |
Income in St. Bernard Parish
Income Overview in St. Bernard Parish
Per Capita Income in St. Bernard Parish is $28,451, while median incomes of families and households are $66,964 and $55,857 respectively.
| Characteristic | Number | Measure |
| Per Capita Income | 44,038 | $28,451 |
| Median Family Income | 10,421 | $66,964 |
| Mean Family Income | 10,421 | $82,737 |
| Median Household Income | 15,732 | $55,857 |
| Mean Household Income | 15,732 | $73,752 |
| Income Deficit | 10,421 | $11,372 |
| Wage / Income Gap (%) | 44,038 | 30.71% |
| Wage / Income Gap ($) | 44,038 | 69.29¢ per $1 |
| Gini / Inequality Index | 44,038 | 0.48 |
Earnings by Sex in St. Bernard Parish
Average Earnings in St. Bernard Parish are $40,083, $48,021 for men and $33,275 for women, a difference of 30.7%.
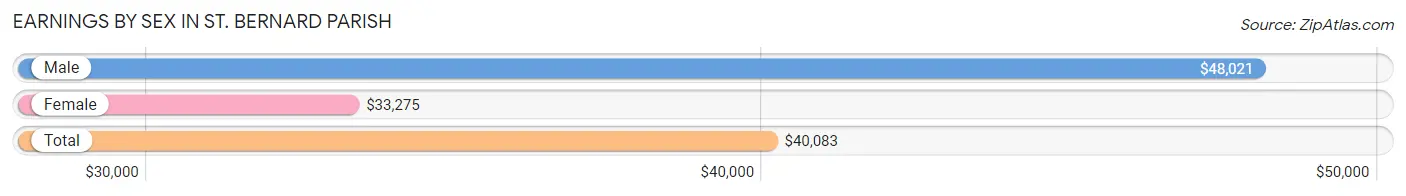
| Sex | Number | Average Earnings |
| Male | 10,745 (50.6%) | $48,021 |
| Female | 10,476 (49.4%) | $33,275 |
| Total | 21,221 (100.0%) | $40,083 |
Earnings by Sex by Income Bracket in St. Bernard Parish
The most common earnings brackets in St. Bernard Parish are $75,000 to $99,999 for men (1,477 | 13.8%) and $45,000 to $49,999 for women (1,033 | 9.9%).
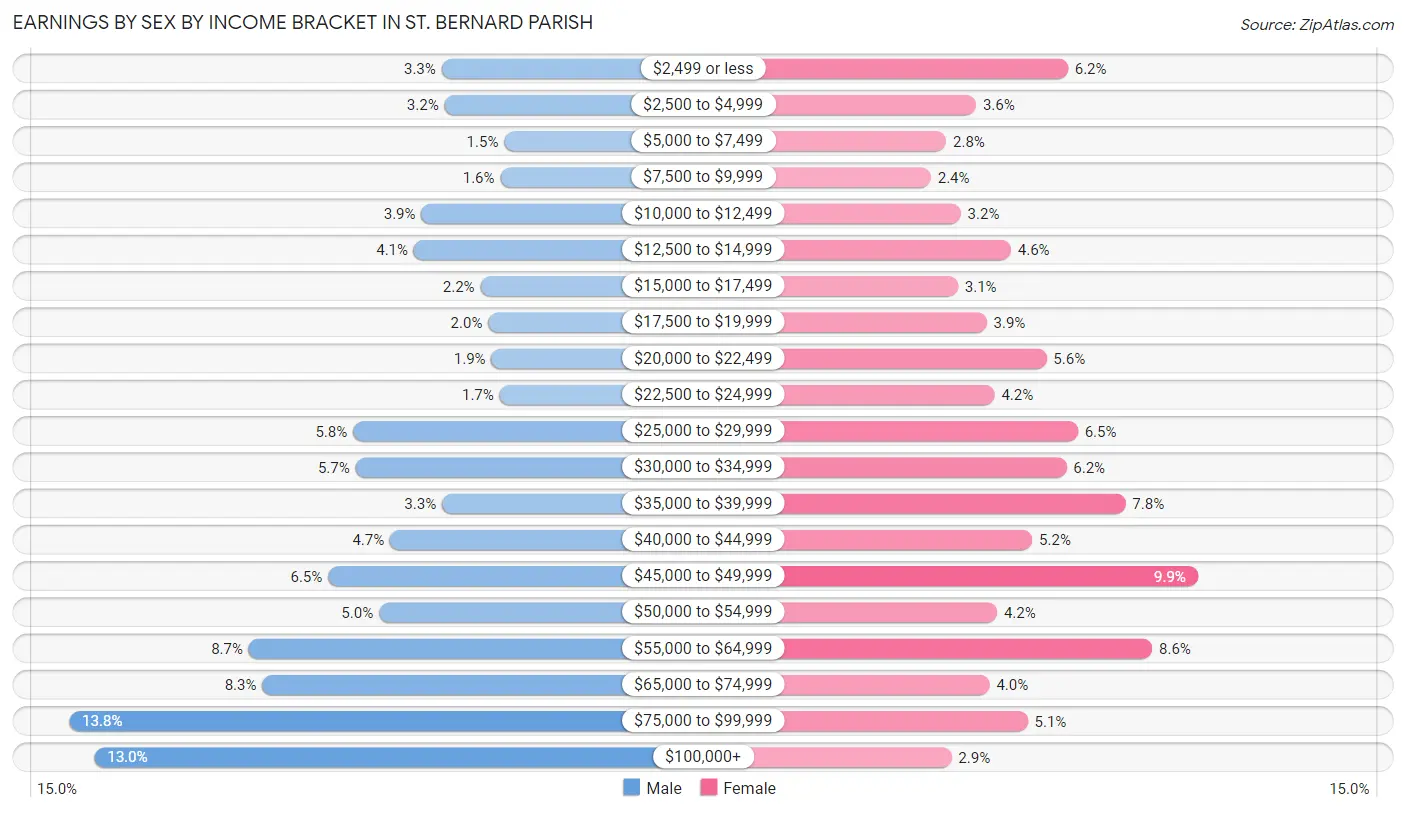
| Income | Male | Female |
| $2,499 or less | 352 (3.3%) | 651 (6.2%) |
| $2,500 to $4,999 | 344 (3.2%) | 380 (3.6%) |
| $5,000 to $7,499 | 163 (1.5%) | 292 (2.8%) |
| $7,500 to $9,999 | 175 (1.6%) | 247 (2.4%) |
| $10,000 to $12,499 | 414 (3.8%) | 335 (3.2%) |
| $12,500 to $14,999 | 436 (4.1%) | 483 (4.6%) |
| $15,000 to $17,499 | 235 (2.2%) | 327 (3.1%) |
| $17,500 to $19,999 | 212 (2.0%) | 412 (3.9%) |
| $20,000 to $22,499 | 202 (1.9%) | 588 (5.6%) |
| $22,500 to $24,999 | 177 (1.7%) | 435 (4.2%) |
| $25,000 to $29,999 | 620 (5.8%) | 680 (6.5%) |
| $30,000 to $34,999 | 612 (5.7%) | 646 (6.2%) |
| $35,000 to $39,999 | 351 (3.3%) | 820 (7.8%) |
| $40,000 to $44,999 | 508 (4.7%) | 546 (5.2%) |
| $45,000 to $49,999 | 695 (6.5%) | 1,033 (9.9%) |
| $50,000 to $54,999 | 542 (5.0%) | 442 (4.2%) |
| $55,000 to $64,999 | 935 (8.7%) | 899 (8.6%) |
| $65,000 to $74,999 | 894 (8.3%) | 420 (4.0%) |
| $75,000 to $99,999 | 1,477 (13.8%) | 532 (5.1%) |
| $100,000+ | 1,401 (13.0%) | 308 (2.9%) |
| Total | 10,745 (100.0%) | 10,476 (100.0%) |
Earnings by Sex by Educational Attainment in St. Bernard Parish
Average earnings in St. Bernard Parish are $53,170 for men and $36,367 for women, a difference of 31.6%. Men with an educational attainment of bachelor's degree enjoy the highest average annual earnings of $67,712, while those with less than high school education earn the least with $35,859. Women with an educational attainment of graduate degree earn the most with the average annual earnings of $53,438, while those with less than high school education have the smallest earnings of $19,986.
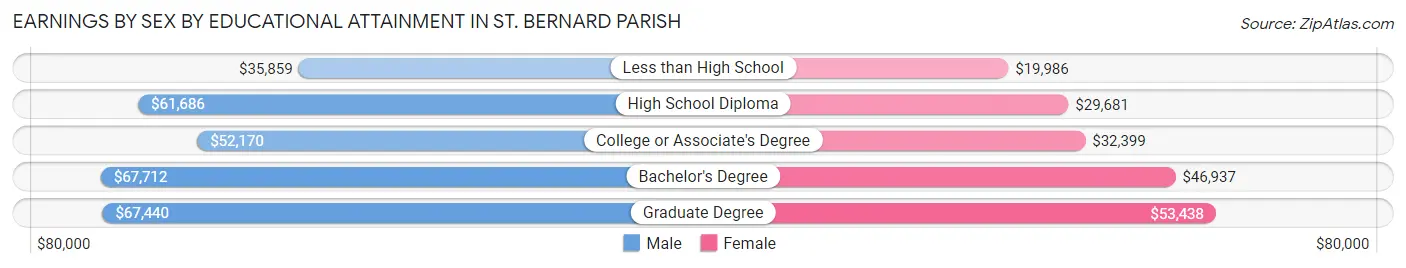
| Educational Attainment | Male Income | Female Income |
| Less than High School | $35,859 | $19,986 |
| High School Diploma | $61,686 | $29,681 |
| College or Associate's Degree | $52,170 | $32,399 |
| Bachelor's Degree | $67,712 | $46,937 |
| Graduate Degree | $67,440 | $53,438 |
| Total | $53,170 | $36,367 |
Family Income in St. Bernard Parish
Family Income Brackets in St. Bernard Parish
According to the St. Bernard Parish family income data, there are 1,772 families falling into the $75,000 to $99,999 income range, which is the most common income bracket and makes up 17.0% of all families. Conversely, the $10,000 to $14,999 income bracket is the least frequent group with only 375 families (3.6%) belonging to this category.
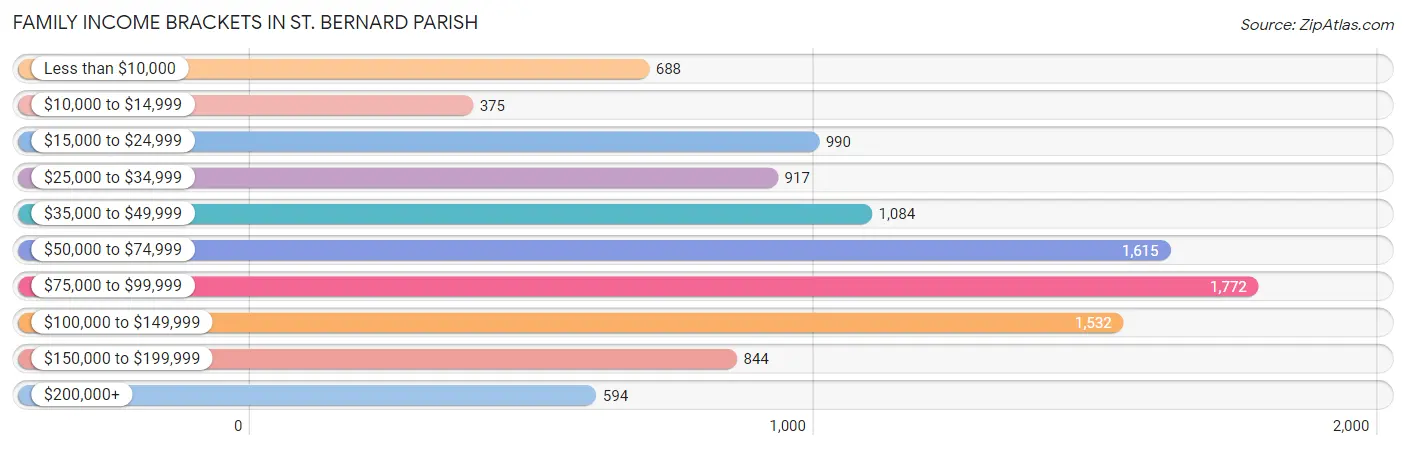
| Income Bracket | # Families | % Families |
| Less than $10,000 | 688 | 6.6% |
| $10,000 to $14,999 | 375 | 3.6% |
| $15,000 to $24,999 | 990 | 9.5% |
| $25,000 to $34,999 | 917 | 8.8% |
| $35,000 to $49,999 | 1,084 | 10.4% |
| $50,000 to $74,999 | 1,615 | 15.5% |
| $75,000 to $99,999 | 1,772 | 17.0% |
| $100,000 to $149,999 | 1,532 | 14.7% |
| $150,000 to $199,999 | 844 | 8.1% |
| $200,000+ | 594 | 5.7% |
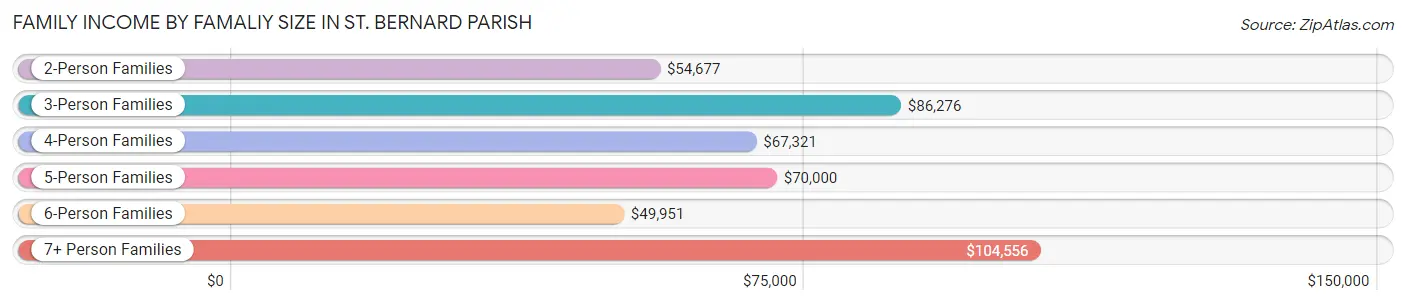
Family Income by Famaliy Size in St. Bernard Parish
7+ person families (155 | 1.5%) account for the highest median family income in St. Bernard Parish with $104,556 per family, while 3-person families (2,501 | 24.0%) have the highest median income of $28,759 per family member.
| Income Bracket | # Families | Median Income |
| 2-Person Families | 4,430 (42.5%) | $54,677 |
| 3-Person Families | 2,501 (24.0%) | $86,276 |
| 4-Person Families | 1,989 (19.1%) | $67,321 |
| 5-Person Families | 776 (7.4%) | $70,000 |
| 6-Person Families | 570 (5.5%) | $49,951 |
| 7+ Person Families | 155 (1.5%) | $104,556 |
| Total | 10,421 (100.0%) | $66,964 |
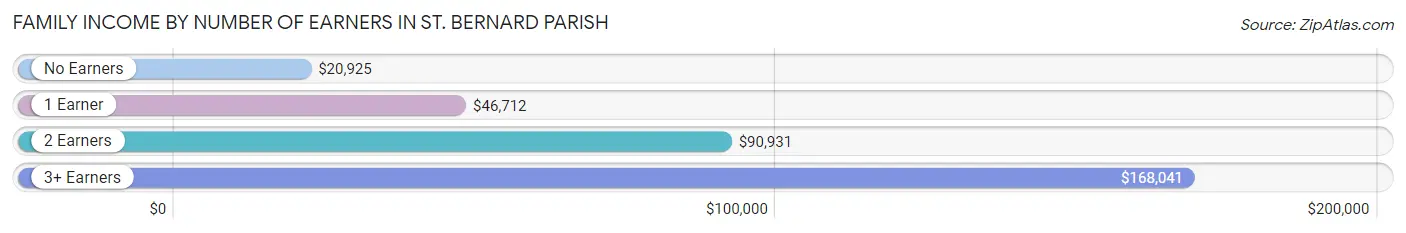
Family Income by Number of Earners in St. Bernard Parish
The median family income in St. Bernard Parish is $66,964, with families comprising 3+ earners (1,163) having the highest median family income of $168,041, while families with no earners (1,580) have the lowest median family income of $20,925, accounting for 11.2% and 15.2% of families, respectively.
| Number of Earners | # Families | Median Income |
| No Earners | 1,580 (15.2%) | $20,925 |
| 1 Earner | 4,028 (38.7%) | $46,712 |
| 2 Earners | 3,650 (35.0%) | $90,931 |
| 3+ Earners | 1,163 (11.2%) | $168,041 |
| Total | 10,421 (100.0%) | $66,964 |
Household Income in St. Bernard Parish
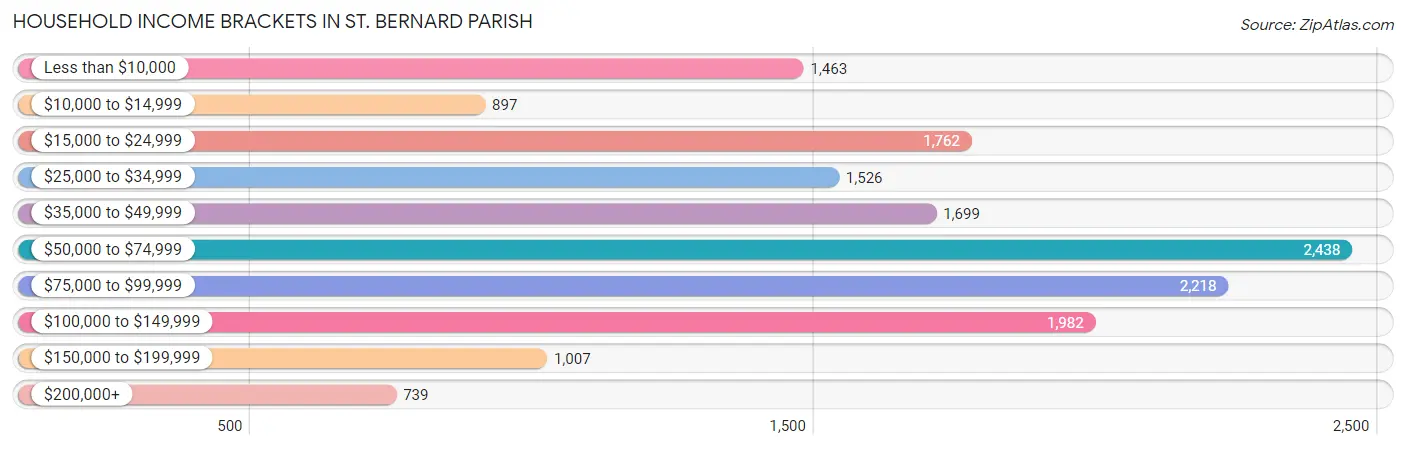
Household Income Brackets in St. Bernard Parish
With 2,438 households falling in the category, the $50,000 to $74,999 income range is the most frequent in St. Bernard Parish, accounting for 15.5% of all households. In contrast, only 739 households (4.7%) fall into the $200,000+ income bracket, making it the least populous group.
| Income Bracket | # Households | % Households |
| Less than $10,000 | 1,463 | 9.3% |
| $10,000 to $14,999 | 897 | 5.7% |
| $15,000 to $24,999 | 1,762 | 11.2% |
| $25,000 to $34,999 | 1,526 | 9.7% |
| $35,000 to $49,999 | 1,699 | 10.8% |
| $50,000 to $74,999 | 2,438 | 15.5% |
| $75,000 to $99,999 | 2,218 | 14.1% |
| $100,000 to $149,999 | 1,982 | 12.6% |
| $150,000 to $199,999 | 1,007 | 6.4% |
| $200,000+ | 739 | 4.7% |
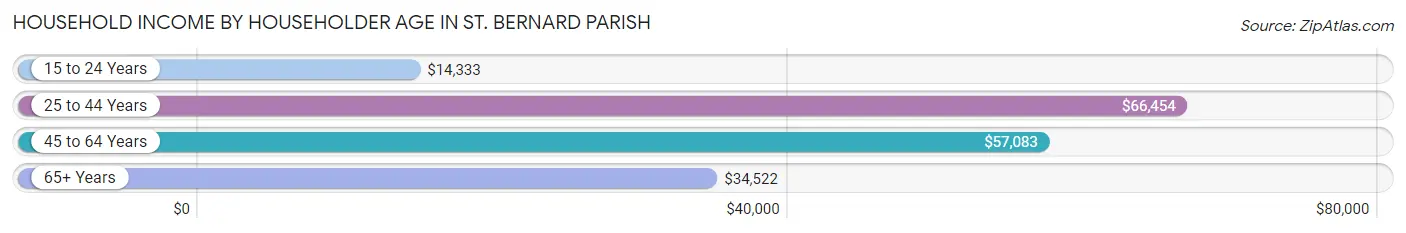
Household Income by Householder Age in St. Bernard Parish
The median household income in St. Bernard Parish is $55,857, with the highest median household income of $66,454 found in the 25 to 44 years age bracket for the primary householder. A total of 5,957 households (37.9%) fall into this category. Meanwhile, the 15 to 24 years age bracket for the primary householder has the lowest median household income of $14,333, with 176 households (1.1%) in this group.
| Income Bracket | # Households | Median Income |
| 15 to 24 Years | 176 (1.1%) | $14,333 |
| 25 to 44 Years | 5,957 (37.9%) | $66,454 |
| 45 to 64 Years | 6,383 (40.6%) | $57,083 |
| 65+ Years | 3,216 (20.4%) | $34,522 |
| Total | 15,732 (100.0%) | $55,857 |
Poverty in St. Bernard Parish
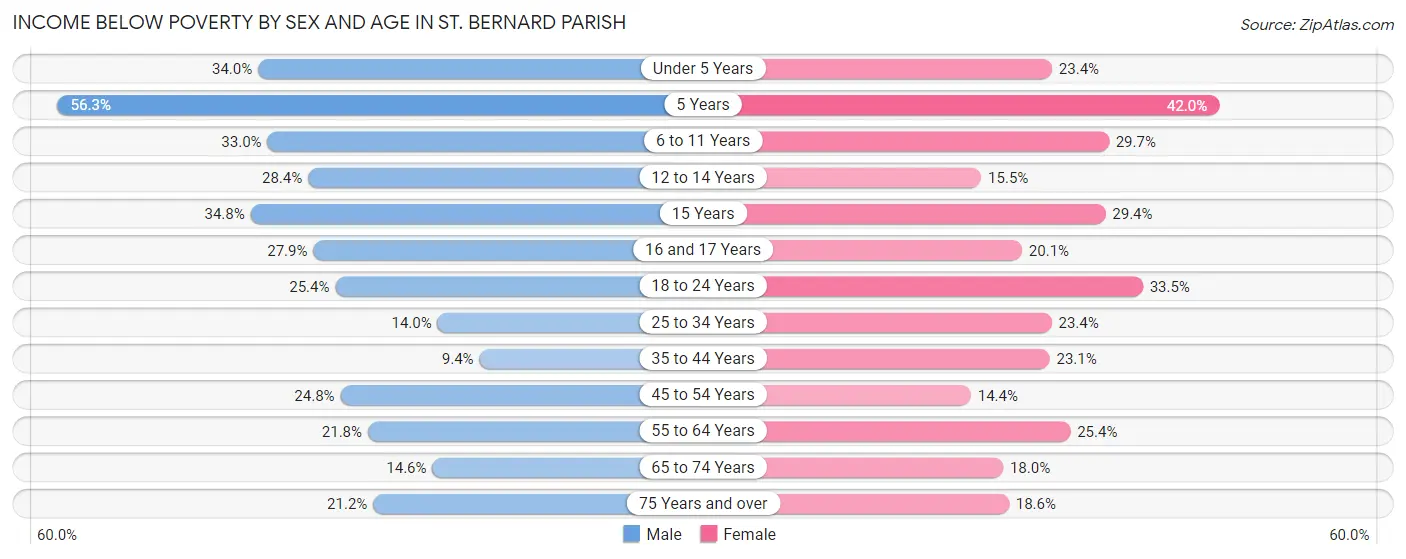
Income Below Poverty by Sex and Age in St. Bernard Parish
With 21.8% poverty level for males and 23.2% for females among the residents of St. Bernard Parish, 5 year old males and 5 year old females are the most vulnerable to poverty, with 107 males (56.3%) and 184 females (42.0%) in their respective age groups living below the poverty level.
| Age Bracket | Male | Female |
| Under 5 Years | 494 (34.0%) | 333 (23.4%) |
| 5 Years | 107 (56.3%) | 184 (42.0%) |
| 6 to 11 Years | 711 (33.0%) | 536 (29.7%) |
| 12 to 14 Years | 296 (28.4%) | 155 (15.5%) |
| 15 Years | 77 (34.8%) | 59 (29.3%) |
| 16 and 17 Years | 193 (27.9%) | 141 (20.1%) |
| 18 to 24 Years | 445 (25.4%) | 560 (33.5%) |
| 25 to 34 Years | 436 (14.0%) | 828 (23.4%) |
| 35 to 44 Years | 284 (9.3%) | 776 (23.1%) |
| 45 to 54 Years | 617 (24.8%) | 355 (14.4%) |
| 55 to 64 Years | 595 (21.8%) | 715 (25.4%) |
| 65 to 74 Years | 257 (14.6%) | 317 (17.9%) |
| 75 Years and over | 172 (21.2%) | 197 (18.6%) |
| Total | 4,684 (21.8%) | 5,156 (23.2%) |
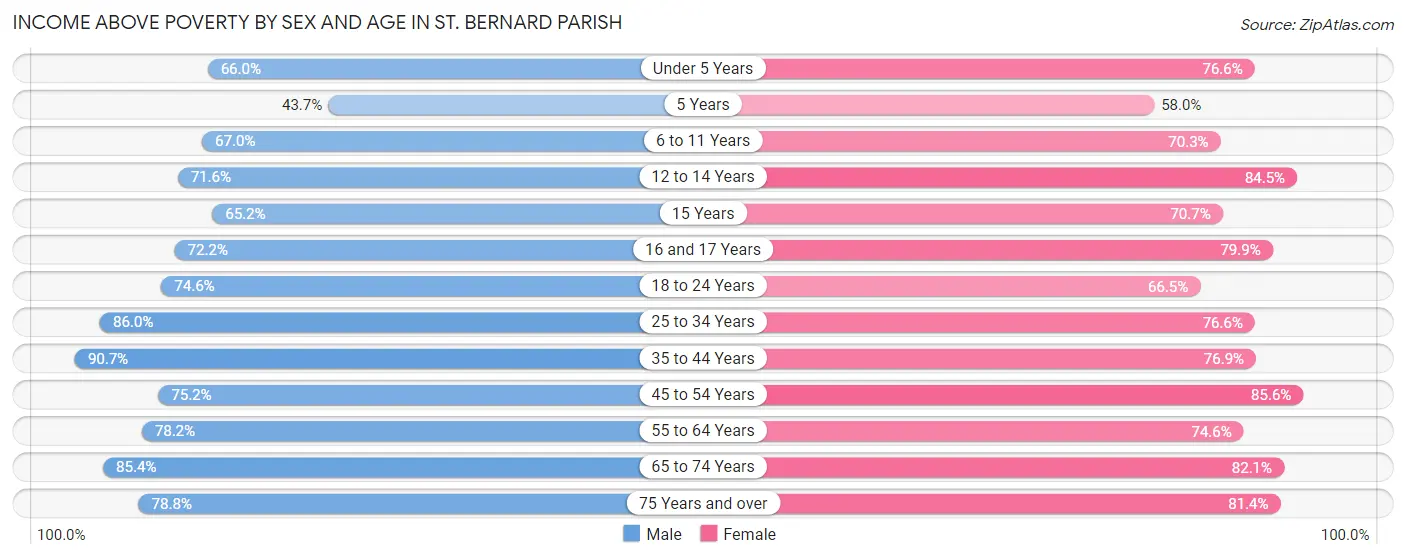
Income Above Poverty by Sex and Age in St. Bernard Parish
According to the poverty statistics in St. Bernard Parish, males aged 35 to 44 years and females aged 45 to 54 years are the age groups that are most secure financially, with 90.6% of males and 85.6% of females in these age groups living above the poverty line.
| Age Bracket | Male | Female |
| Under 5 Years | 959 (66.0%) | 1,090 (76.6%) |
| 5 Years | 83 (43.7%) | 254 (58.0%) |
| 6 to 11 Years | 1,446 (67.0%) | 1,267 (70.3%) |
| 12 to 14 Years | 745 (71.6%) | 844 (84.5%) |
| 15 Years | 144 (65.2%) | 142 (70.7%) |
| 16 and 17 Years | 500 (72.2%) | 562 (79.9%) |
| 18 to 24 Years | 1,307 (74.6%) | 1,111 (66.5%) |
| 25 to 34 Years | 2,675 (86.0%) | 2,717 (76.6%) |
| 35 to 44 Years | 2,753 (90.6%) | 2,578 (76.9%) |
| 45 to 54 Years | 1,868 (75.2%) | 2,116 (85.6%) |
| 55 to 64 Years | 2,138 (78.2%) | 2,095 (74.6%) |
| 65 to 74 Years | 1,505 (85.4%) | 1,449 (82.1%) |
| 75 Years and over | 640 (78.8%) | 862 (81.4%) |
| Total | 16,763 (78.2%) | 17,087 (76.8%) |
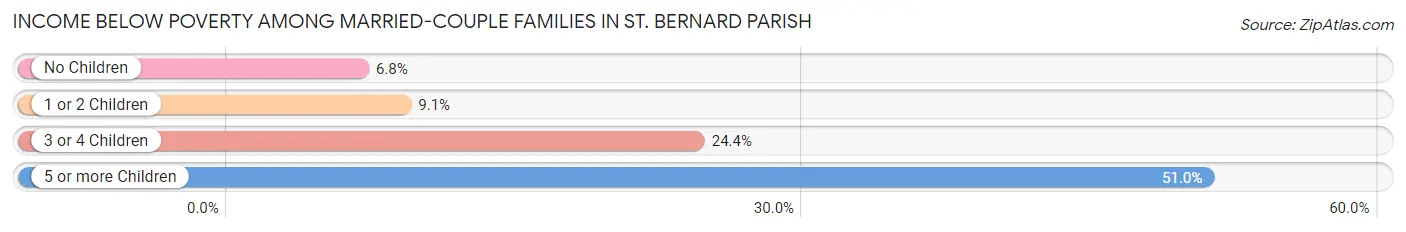
Income Below Poverty Among Married-Couple Families in St. Bernard Parish
The poverty statistics for married-couple families in St. Bernard Parish show that 9.8% or 605 of the total 6,152 families live below the poverty line. Families with 5 or more children have the highest poverty rate of 51.0%, comprising of 26 families. On the other hand, families with no children have the lowest poverty rate of 6.8%, which includes 242 families.
| Children | Above Poverty | Below Poverty |
| No Children | 3,296 (93.2%) | 242 (6.8%) |
| 1 or 2 Children | 1,708 (90.9%) | 170 (9.0%) |
| 3 or 4 Children | 518 (75.6%) | 167 (24.4%) |
| 5 or more Children | 25 (49.0%) | 26 (51.0%) |
| Total | 5,547 (90.2%) | 605 (9.8%) |
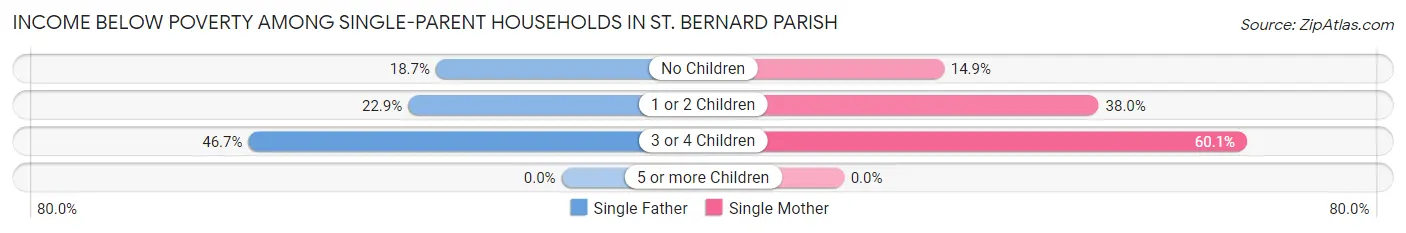
Income Below Poverty Among Single-Parent Households in St. Bernard Parish
According to the poverty data in St. Bernard Parish, 24.1% or 260 single-father households and 34.6% or 1,104 single-mother households are living below the poverty line. Among single-father households, those with 3 or 4 children have the highest poverty rate, with 56 households (46.7%) experiencing poverty. Likewise, among single-mother households, those with 3 or 4 children have the highest poverty rate, with 292 households (60.1%) falling below the poverty line.
| Children | Single Father | Single Mother |
| No Children | 68 (18.7%) | 127 (14.9%) |
| 1 or 2 Children | 136 (22.9%) | 685 (38.0%) |
| 3 or 4 Children | 56 (46.7%) | 292 (60.1%) |
| 5 or more Children | 0 (0.0%) | 0 (0.0%) |
| Total | 260 (24.1%) | 1,104 (34.6%) |
Income Below Poverty Among Married-Couple vs Single-Parent Households in St. Bernard Parish
The poverty data for St. Bernard Parish shows that 605 of the married-couple family households (9.8%) and 1,364 of the single-parent households (32.0%) are living below the poverty level. Within the married-couple family households, those with 5 or more children have the highest poverty rate, with 26 households (51.0%) falling below the poverty line. Among the single-parent households, those with 3 or 4 children have the highest poverty rate, with 348 household (57.4%) living below poverty.
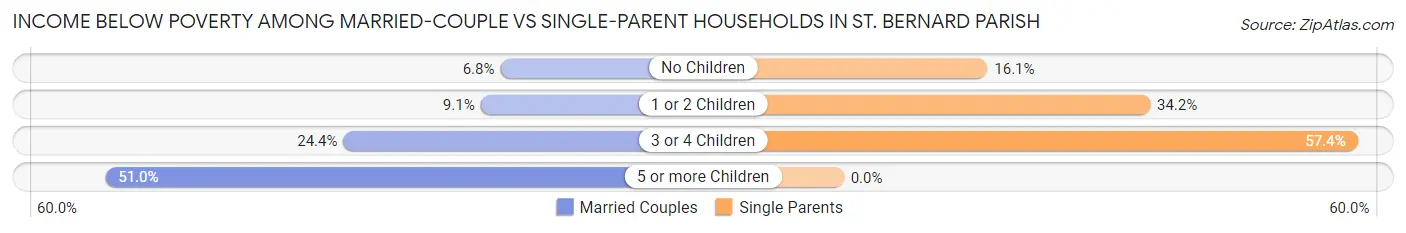
| Children | Married-Couple Families | Single-Parent Households |
| No Children | 242 (6.8%) | 195 (16.1%) |
| 1 or 2 Children | 170 (9.0%) | 821 (34.2%) |
| 3 or 4 Children | 167 (24.4%) | 348 (57.4%) |
| 5 or more Children | 26 (51.0%) | 0 (0.0%) |
| Total | 605 (9.8%) | 1,364 (32.0%) |
Employment Characteristics in St. Bernard Parish
Employment by Class of Employer in St. Bernard Parish
Among the 18,507 employed individuals in St. Bernard Parish, private company employees (12,540 | 67.8%), local government employees (1,946 | 10.5%), and self-employed (not incorporated) (1,154 | 6.2%) make up the most common classes of employment.
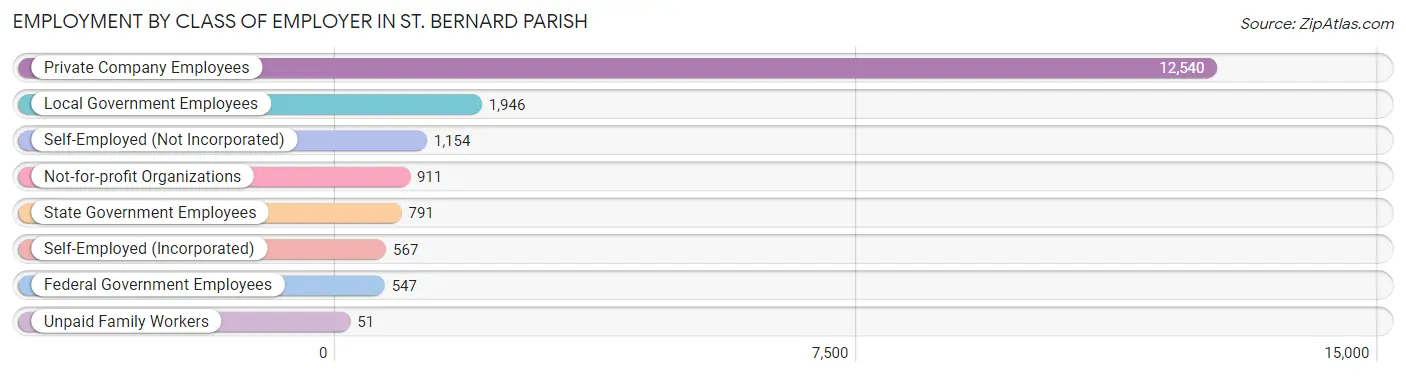
| Employer Class | # Employees | % Employees |
| Private Company Employees | 12,540 | 67.8% |
| Self-Employed (Incorporated) | 567 | 3.1% |
| Self-Employed (Not Incorporated) | 1,154 | 6.2% |
| Not-for-profit Organizations | 911 | 4.9% |
| Local Government Employees | 1,946 | 10.5% |
| State Government Employees | 791 | 4.3% |
| Federal Government Employees | 547 | 3.0% |
| Unpaid Family Workers | 51 | 0.3% |
| Total | 18,507 | 100.0% |
Employment Status by Age in St. Bernard Parish
According to the labor force statistics for St. Bernard Parish, out of the total population over 16 years of age (33,947), 60.5% or 20,538 individuals are in the labor force, with 8.0% or 1,643 of them unemployed. The age group with the highest labor force participation rate is 25 to 29 years, with 86.4% or 2,662 individuals in the labor force. Within the labor force, the 16 to 19 years age range has the highest percentage of unemployed individuals, with 26.1% or 161 of them being unemployed.
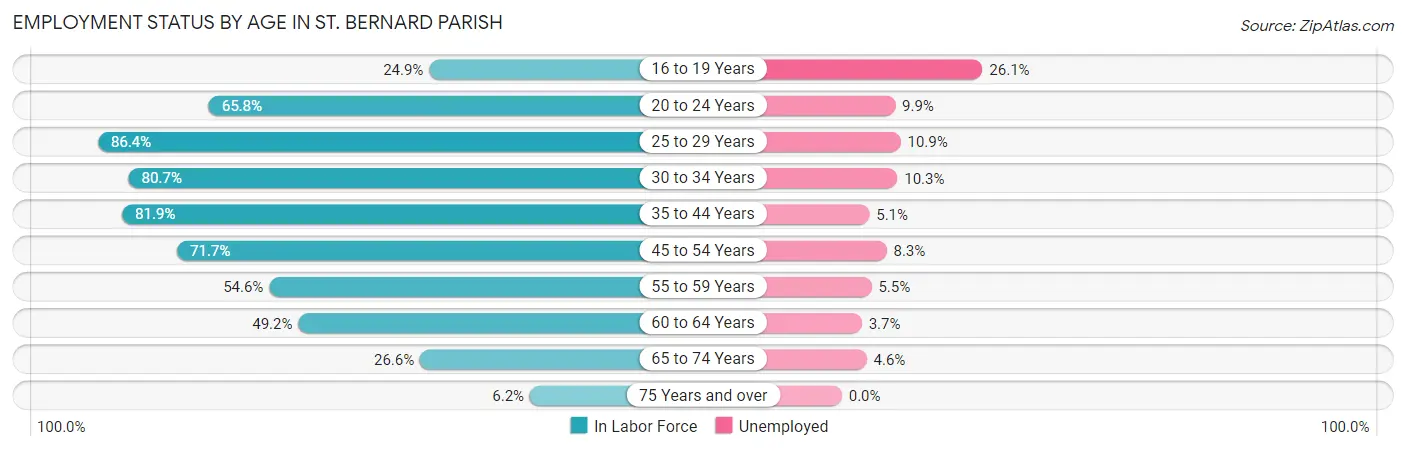
| Age Bracket | In Labor Force | Unemployed |
| 16 to 19 Years | 617 (24.9%) | 161 (26.1%) |
| 20 to 24 Years | 1,544 (65.8%) | 153 (9.9%) |
| 25 to 29 Years | 2,662 (86.4%) | 290 (10.9%) |
| 30 to 34 Years | 2,946 (80.7%) | 303 (10.3%) |
| 35 to 44 Years | 5,267 (81.9%) | 269 (5.1%) |
| 45 to 54 Years | 3,579 (71.7%) | 297 (8.3%) |
| 55 to 59 Years | 1,319 (54.6%) | 73 (5.5%) |
| 60 to 64 Years | 1,549 (49.2%) | 57 (3.7%) |
| 65 to 74 Years | 941 (26.6%) | 43 (4.6%) |
| 75 Years and over | 116 (6.2%) | 0 (0.0%) |
| Total | 20,538 (60.5%) | 1,643 (8.0%) |
Employment Status by Educational Attainment in St. Bernard Parish
According to labor force statistics for St. Bernard Parish, 73.0% of individuals (17,313) out of the total population between 25 and 64 years of age (23,716) are in the labor force, with 7.4% or 1,281 of them being unemployed. The group with the highest labor force participation rate are those with the educational attainment of bachelor's degree or higher, with 87.1% or 3,733 individuals in the labor force. Within the labor force, individuals with less than high school education have the highest percentage of unemployment, with 16.7% or 373 of them being unemployed.
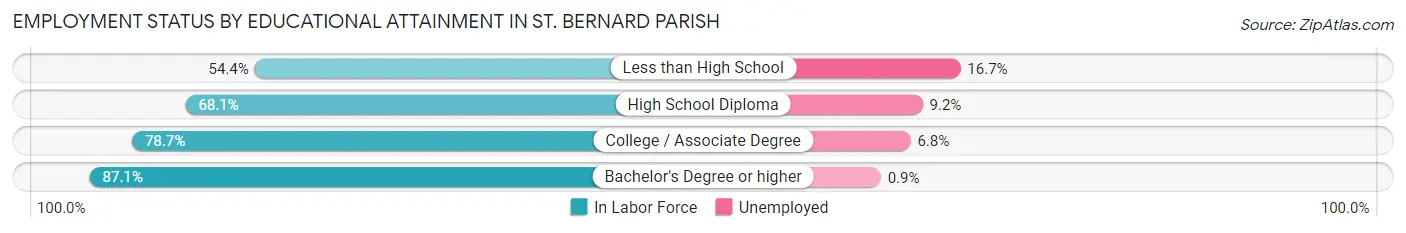
| Educational Attainment | In Labor Force | Unemployed |
| Less than High School | 2,233 (54.4%) | 686 (16.7%) |
| High School Diploma | 4,528 (68.1%) | 612 (9.2%) |
| College / Associate Degree | 6,828 (78.7%) | 590 (6.8%) |
| Bachelor's Degree or higher | 3,733 (87.1%) | 39 (0.9%) |
| Total | 17,313 (73.0%) | 1,755 (7.4%) |
Employment Occupations by Sex in St. Bernard Parish
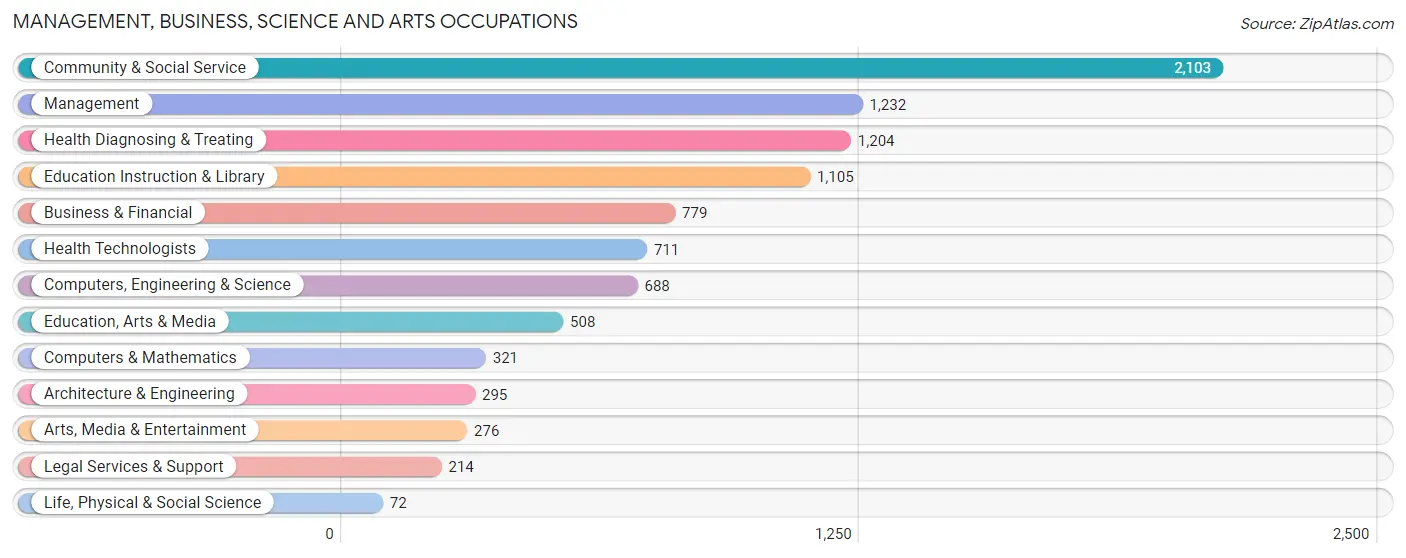
Management, Business, Science and Arts Occupations
The most common Management, Business, Science and Arts occupations in St. Bernard Parish are Community & Social Service (2,103 | 11.2%), Management (1,232 | 6.5%), Health Diagnosing & Treating (1,204 | 6.4%), Education Instruction & Library (1,105 | 5.9%), and Business & Financial (779 | 4.1%).
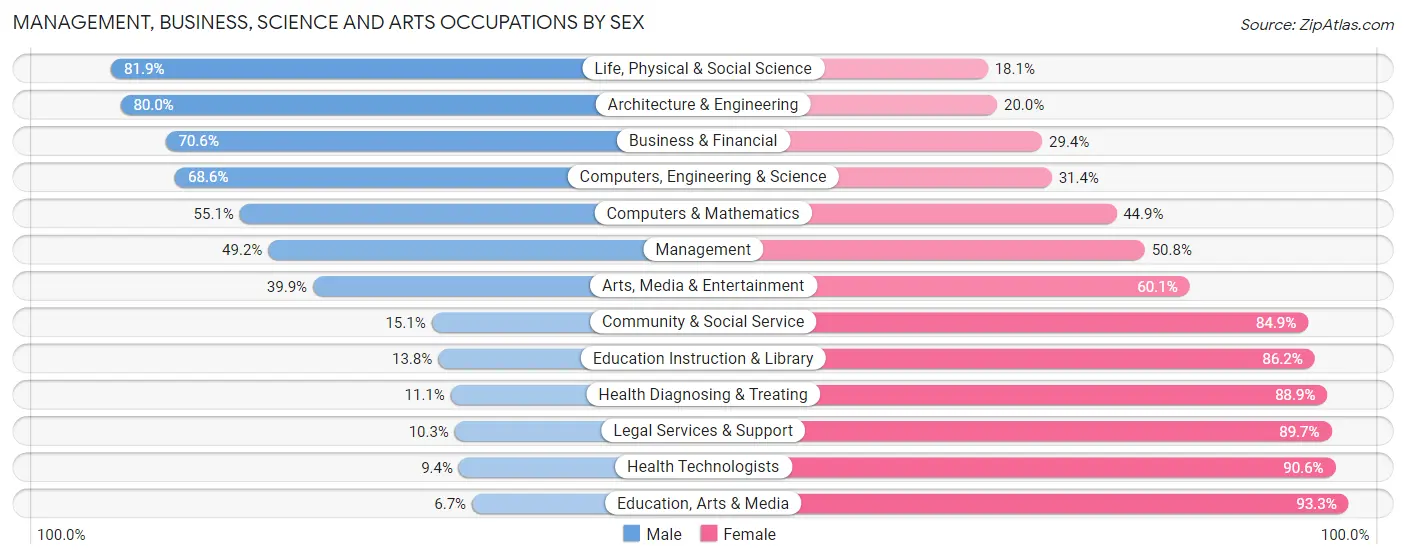
Management, Business, Science and Arts Occupations by Sex
Within the Management, Business, Science and Arts occupations in St. Bernard Parish, the most male-oriented occupations are Life, Physical & Social Science (81.9%), Architecture & Engineering (80.0%), and Business & Financial (70.6%), while the most female-oriented occupations are Education, Arts & Media (93.3%), Health Technologists (90.6%), and Legal Services & Support (89.7%).
| Occupation | Male | Female |
| Management | 606 (49.2%) | 626 (50.8%) |
| Business & Financial | 550 (70.6%) | 229 (29.4%) |
| Computers, Engineering & Science | 472 (68.6%) | 216 (31.4%) |
| Computers & Mathematics | 177 (55.1%) | 144 (44.9%) |
| Architecture & Engineering | 236 (80.0%) | 59 (20.0%) |
| Life, Physical & Social Science | 59 (81.9%) | 13 (18.1%) |
| Community & Social Service | 318 (15.1%) | 1,785 (84.9%) |
| Education, Arts & Media | 34 (6.7%) | 474 (93.3%) |
| Legal Services & Support | 22 (10.3%) | 192 (89.7%) |
| Education Instruction & Library | 152 (13.8%) | 953 (86.2%) |
| Arts, Media & Entertainment | 110 (39.9%) | 166 (60.1%) |
| Health Diagnosing & Treating | 134 (11.1%) | 1,070 (88.9%) |
| Health Technologists | 67 (9.4%) | 644 (90.6%) |
| Total (Category) | 2,080 (34.6%) | 3,926 (65.4%) |
| Total (Overall) | 9,386 (49.8%) | 9,467 (50.2%) |
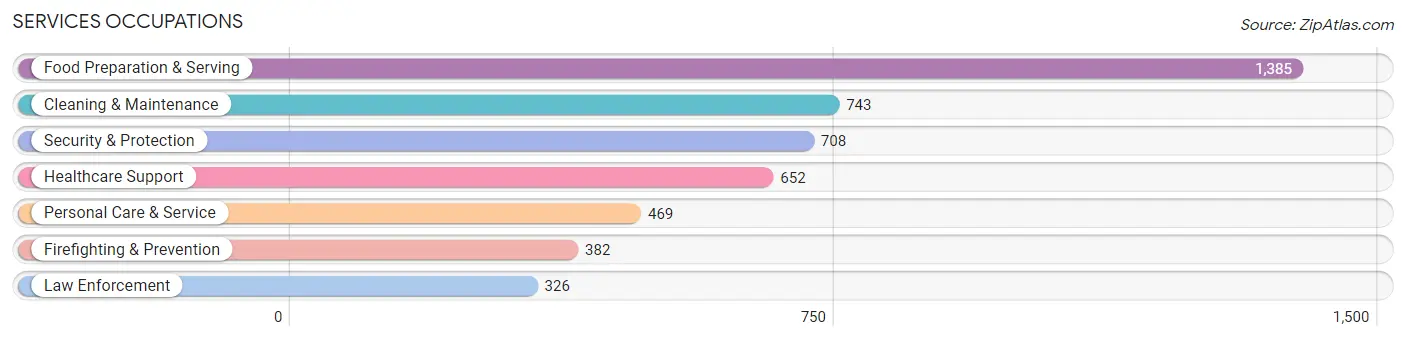
Services Occupations
The most common Services occupations in St. Bernard Parish are Food Preparation & Serving (1,385 | 7.3%), Cleaning & Maintenance (743 | 3.9%), Security & Protection (708 | 3.8%), Healthcare Support (652 | 3.5%), and Personal Care & Service (469 | 2.5%).
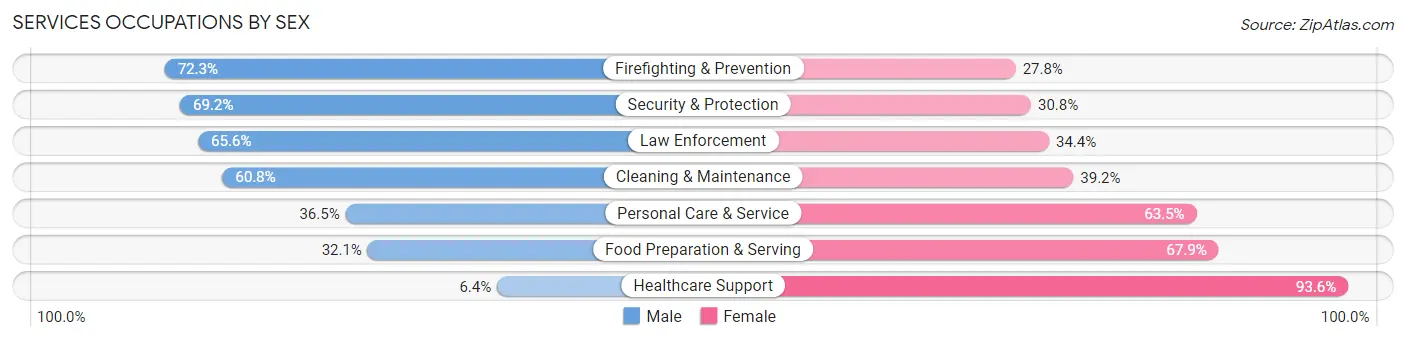
Services Occupations by Sex
Within the Services occupations in St. Bernard Parish, the most male-oriented occupations are Firefighting & Prevention (72.3%), Security & Protection (69.2%), and Law Enforcement (65.6%), while the most female-oriented occupations are Healthcare Support (93.6%), Food Preparation & Serving (67.9%), and Personal Care & Service (63.5%).
| Occupation | Male | Female |
| Healthcare Support | 42 (6.4%) | 610 (93.6%) |
| Security & Protection | 490 (69.2%) | 218 (30.8%) |
| Firefighting & Prevention | 276 (72.3%) | 106 (27.8%) |
| Law Enforcement | 214 (65.6%) | 112 (34.4%) |
| Food Preparation & Serving | 444 (32.1%) | 941 (67.9%) |
| Cleaning & Maintenance | 452 (60.8%) | 291 (39.2%) |
| Personal Care & Service | 171 (36.5%) | 298 (63.5%) |
| Total (Category) | 1,599 (40.4%) | 2,358 (59.6%) |
| Total (Overall) | 9,386 (49.8%) | 9,467 (50.2%) |
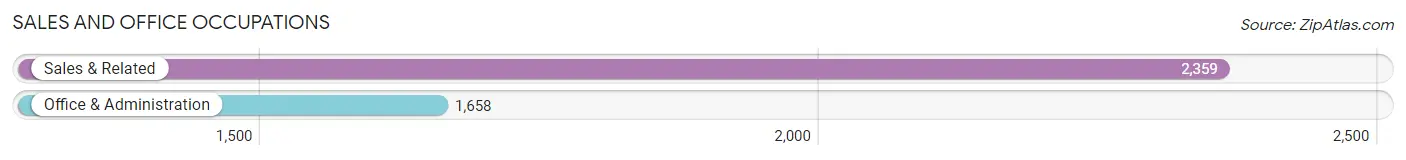
Sales and Office Occupations
The most common Sales and Office occupations in St. Bernard Parish are Sales & Related (2,359 | 12.5%), and Office & Administration (1,658 | 8.8%).
Sales and Office Occupations by Sex
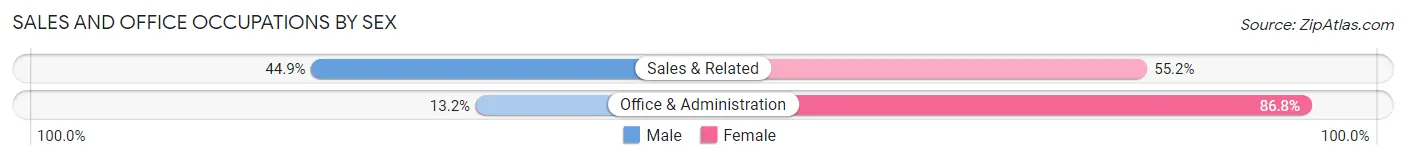
| Occupation | Male | Female |
| Sales & Related | 1,058 (44.9%) | 1,301 (55.1%) |
| Office & Administration | 219 (13.2%) | 1,439 (86.8%) |
| Total (Category) | 1,277 (31.8%) | 2,740 (68.2%) |
| Total (Overall) | 9,386 (49.8%) | 9,467 (50.2%) |
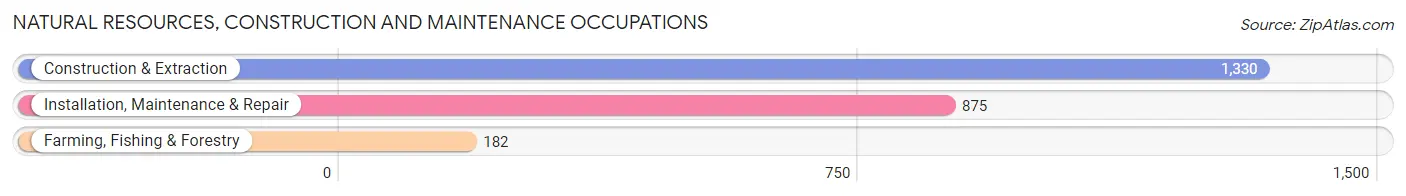
Natural Resources, Construction and Maintenance Occupations
The most common Natural Resources, Construction and Maintenance occupations in St. Bernard Parish are Construction & Extraction (1,330 | 7.0%), Installation, Maintenance & Repair (875 | 4.6%), and Farming, Fishing & Forestry (182 | 1.0%).
Natural Resources, Construction and Maintenance Occupations by Sex
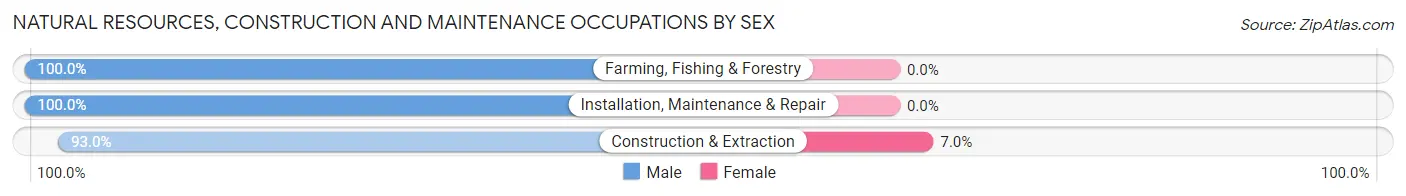
| Occupation | Male | Female |
| Farming, Fishing & Forestry | 182 (100.0%) | 0 (0.0%) |
| Construction & Extraction | 1,237 (93.0%) | 93 (7.0%) |
| Installation, Maintenance & Repair | 875 (100.0%) | 0 (0.0%) |
| Total (Category) | 2,294 (96.1%) | 93 (3.9%) |
| Total (Overall) | 9,386 (49.8%) | 9,467 (50.2%) |
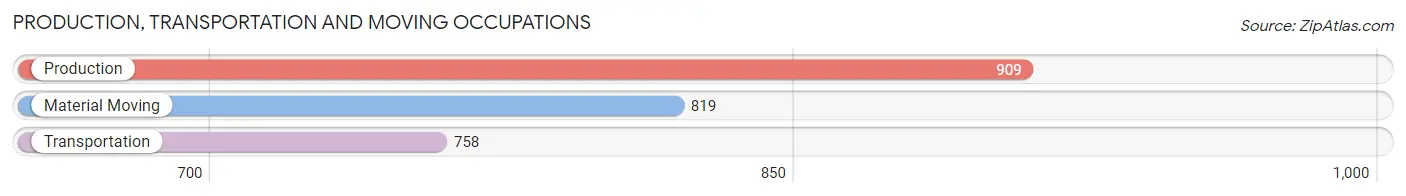
Production, Transportation and Moving Occupations
The most common Production, Transportation and Moving occupations in St. Bernard Parish are Production (909 | 4.8%), Material Moving (819 | 4.3%), and Transportation (758 | 4.0%).
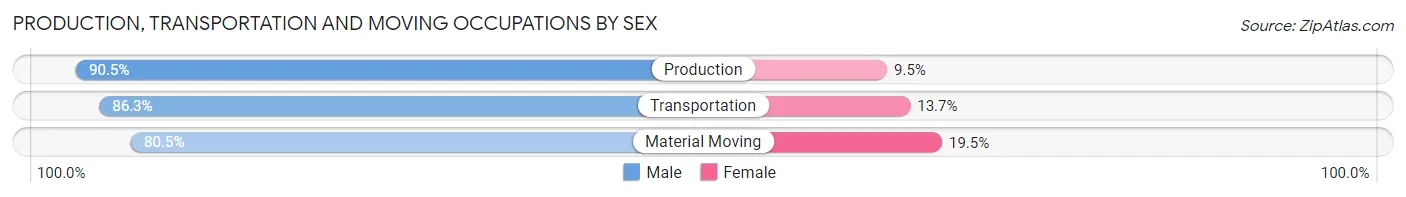
Production, Transportation and Moving Occupations by Sex
| Occupation | Male | Female |
| Production | 823 (90.5%) | 86 (9.5%) |
| Transportation | 654 (86.3%) | 104 (13.7%) |
| Material Moving | 659 (80.5%) | 160 (19.5%) |
| Total (Category) | 2,136 (85.9%) | 350 (14.1%) |
| Total (Overall) | 9,386 (49.8%) | 9,467 (50.2%) |
Employment Industries by Sex in St. Bernard Parish
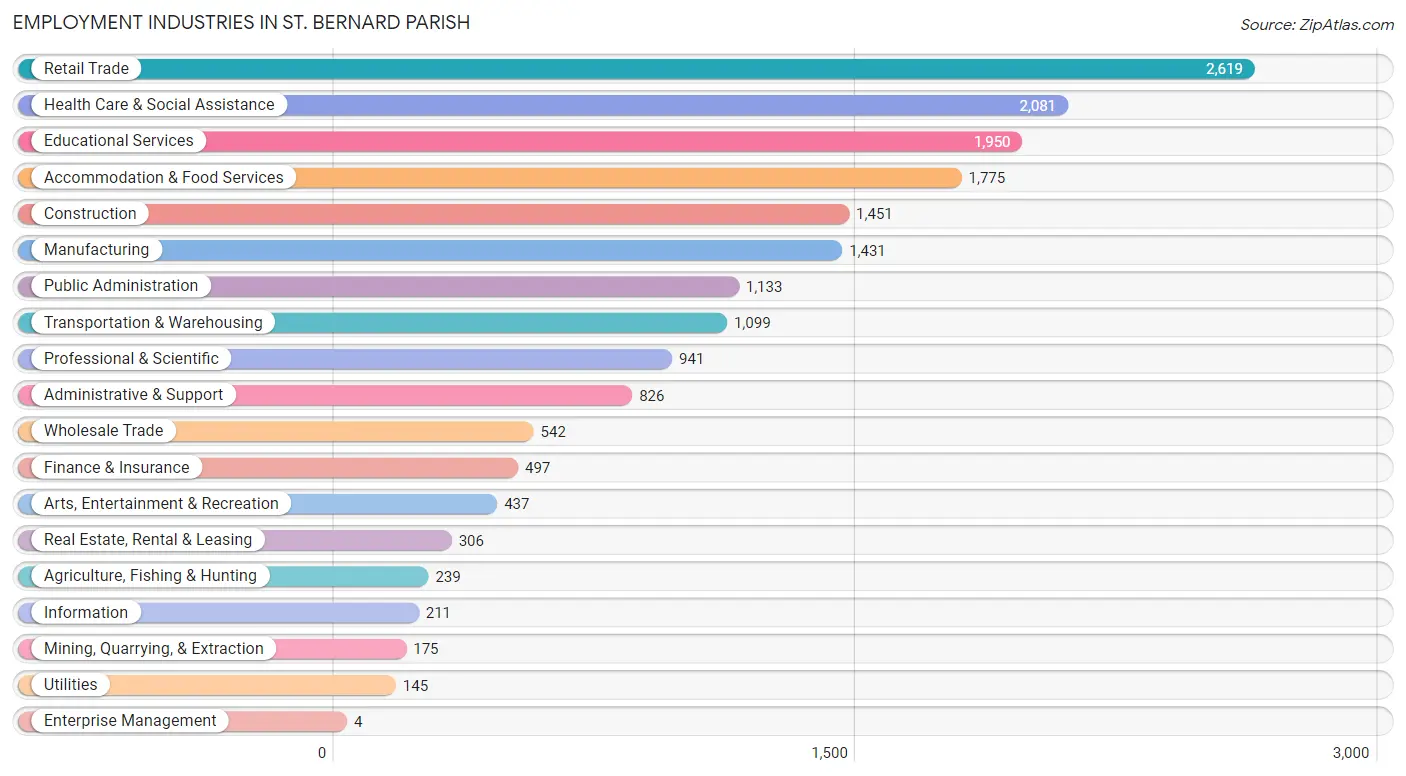
Employment Industries in St. Bernard Parish
The major employment industries in St. Bernard Parish include Retail Trade (2,619 | 13.9%), Health Care & Social Assistance (2,081 | 11.0%), Educational Services (1,950 | 10.3%), Accommodation & Food Services (1,775 | 9.4%), and Construction (1,451 | 7.7%).
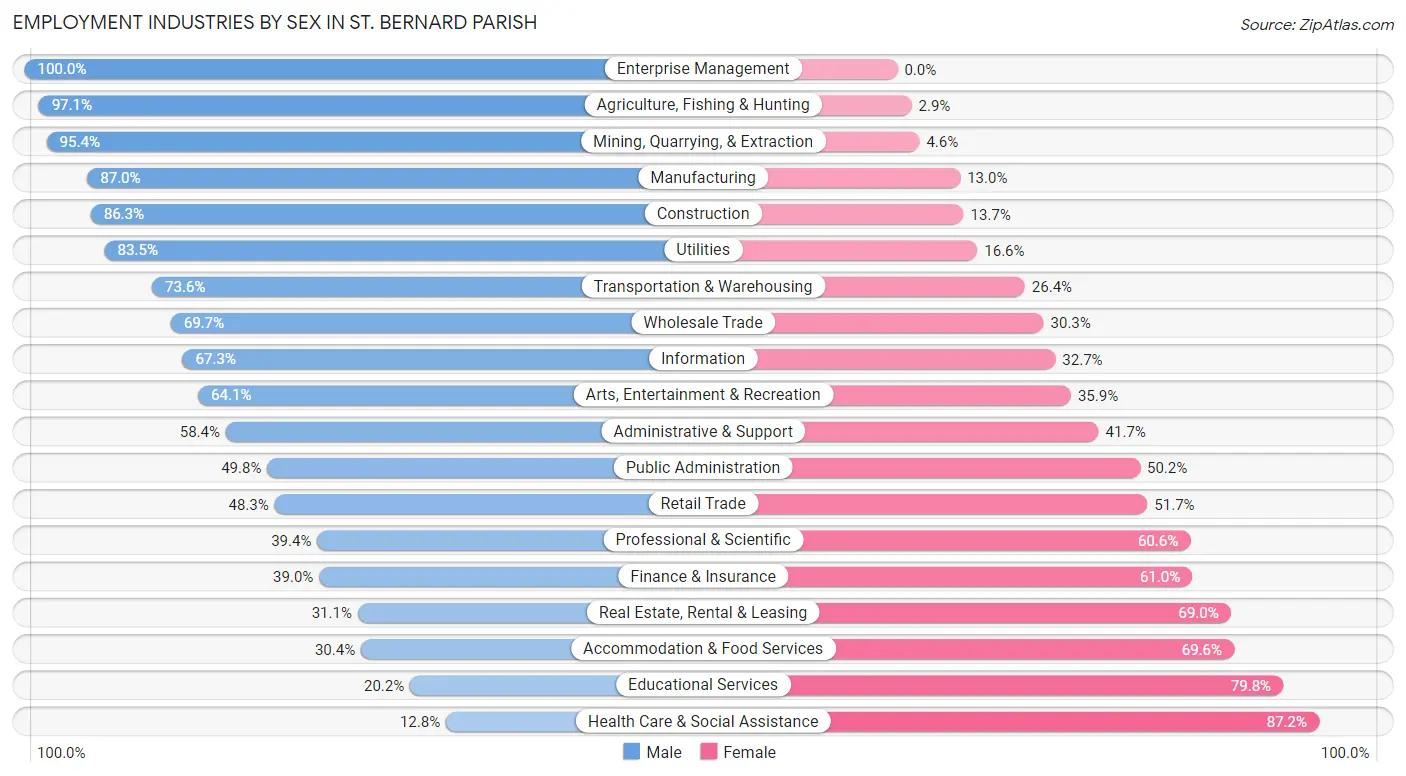
Employment Industries by Sex in St. Bernard Parish
The St. Bernard Parish industries that see more men than women are Enterprise Management (100.0%), Agriculture, Fishing & Hunting (97.1%), and Mining, Quarrying, & Extraction (95.4%), whereas the industries that tend to have a higher number of women are Health Care & Social Assistance (87.2%), Educational Services (79.8%), and Accommodation & Food Services (69.6%).
| Industry | Male | Female |
| Agriculture, Fishing & Hunting | 232 (97.1%) | 7 (2.9%) |
| Mining, Quarrying, & Extraction | 167 (95.4%) | 8 (4.6%) |
| Construction | 1,252 (86.3%) | 199 (13.7%) |
| Manufacturing | 1,245 (87.0%) | 186 (13.0%) |
| Wholesale Trade | 378 (69.7%) | 164 (30.3%) |
| Retail Trade | 1,264 (48.3%) | 1,355 (51.7%) |
| Transportation & Warehousing | 809 (73.6%) | 290 (26.4%) |
| Utilities | 121 (83.5%) | 24 (16.6%) |
| Information | 142 (67.3%) | 69 (32.7%) |
| Finance & Insurance | 194 (39.0%) | 303 (61.0%) |
| Real Estate, Rental & Leasing | 95 (31.0%) | 211 (69.0%) |
| Professional & Scientific | 371 (39.4%) | 570 (60.6%) |
| Enterprise Management | 4 (100.0%) | 0 (0.0%) |
| Administrative & Support | 482 (58.4%) | 344 (41.6%) |
| Educational Services | 394 (20.2%) | 1,556 (79.8%) |
| Health Care & Social Assistance | 266 (12.8%) | 1,815 (87.2%) |
| Arts, Entertainment & Recreation | 280 (64.1%) | 157 (35.9%) |
| Accommodation & Food Services | 539 (30.4%) | 1,236 (69.6%) |
| Public Administration | 564 (49.8%) | 569 (50.2%) |
| Total | 9,386 (49.8%) | 9,467 (50.2%) |
Education in St. Bernard Parish
School Enrollment in St. Bernard Parish
The most common levels of schooling among the 11,709 students in St. Bernard Parish are elementary school (2,790 | 23.8%), middle school (2,670 | 22.8%), and high school (2,487 | 21.2%).
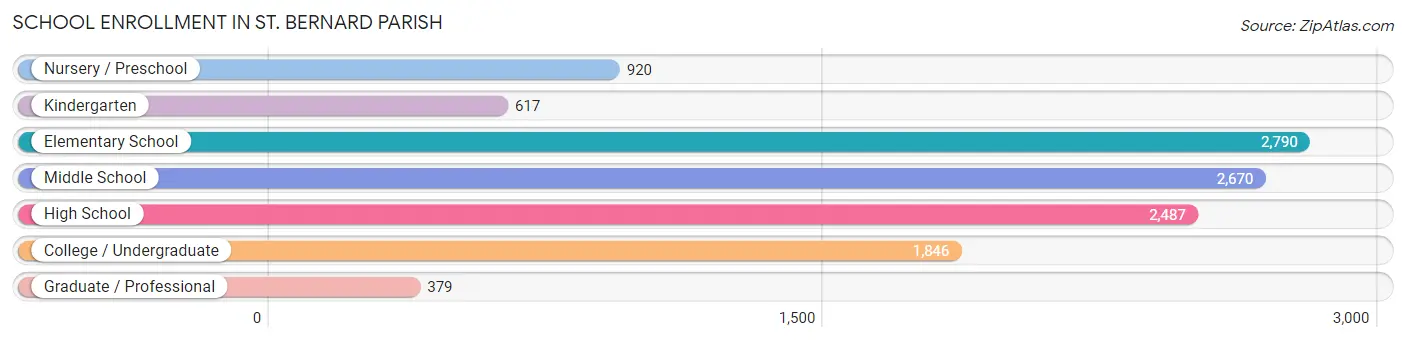
| School Level | # Students | % Students |
| Nursery / Preschool | 920 | 7.9% |
| Kindergarten | 617 | 5.3% |
| Elementary School | 2,790 | 23.8% |
| Middle School | 2,670 | 22.8% |
| High School | 2,487 | 21.2% |
| College / Undergraduate | 1,846 | 15.8% |
| Graduate / Professional | 379 | 3.2% |
| Total | 11,709 | 100.0% |
School Enrollment by Age by Funding Source in St. Bernard Parish
Out of a total of 11,709 students who are enrolled in schools in St. Bernard Parish, 1,639 (14.0%) attend a private institution, while the remaining 10,070 (86.0%) are enrolled in public schools. The age group of 25 to 34 year olds has the highest likelihood of being enrolled in private schools, with 372 (46.3% in the age bracket) enrolled. Conversely, the age group of 20 to 24 year olds has the lowest likelihood of being enrolled in a private school, with 658 (92.0% in the age bracket) attending a public institution.
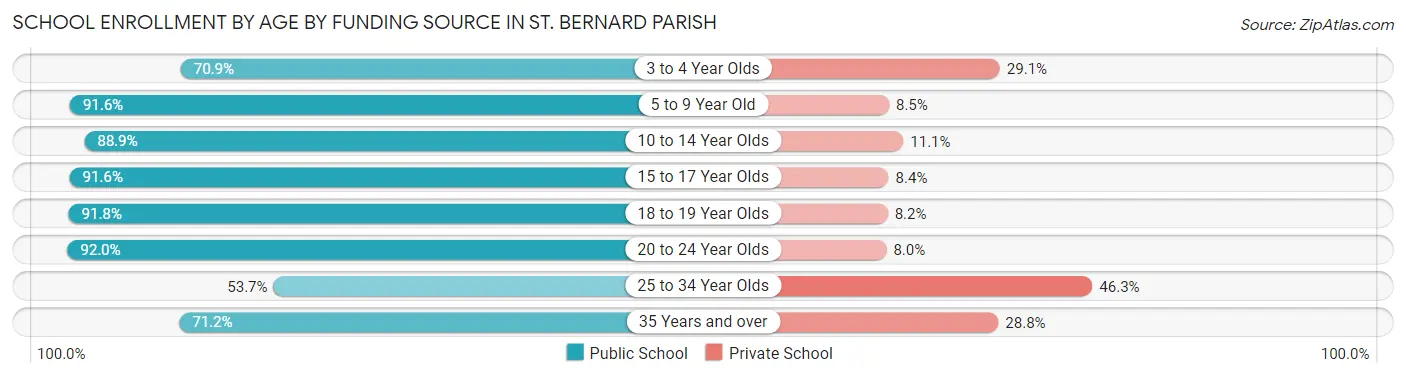
| Age Bracket | Public School | Private School |
| 3 to 4 Year Olds | 502 (70.9%) | 206 (29.1%) |
| 5 to 9 Year Old | 3,055 (91.5%) | 282 (8.5%) |
| 10 to 14 Year Olds | 2,844 (88.9%) | 356 (11.1%) |
| 15 to 17 Year Olds | 1,586 (91.6%) | 145 (8.4%) |
| 18 to 19 Year Olds | 593 (91.8%) | 53 (8.2%) |
| 20 to 24 Year Olds | 658 (92.0%) | 57 (8.0%) |
| 25 to 34 Year Olds | 431 (53.7%) | 372 (46.3%) |
| 35 Years and over | 405 (71.2%) | 164 (28.8%) |
| Total | 10,070 (86.0%) | 1,639 (14.0%) |
Educational Attainment by Field of Study in St. Bernard Parish
Education (1,180 | 22.8%), business (1,043 | 20.2%), science & technology (546 | 10.6%), arts & humanities (349 | 6.8%), and social sciences (302 | 5.8%) are the most common fields of study among 5,171 individuals in St. Bernard Parish who have obtained a bachelor's degree or higher.
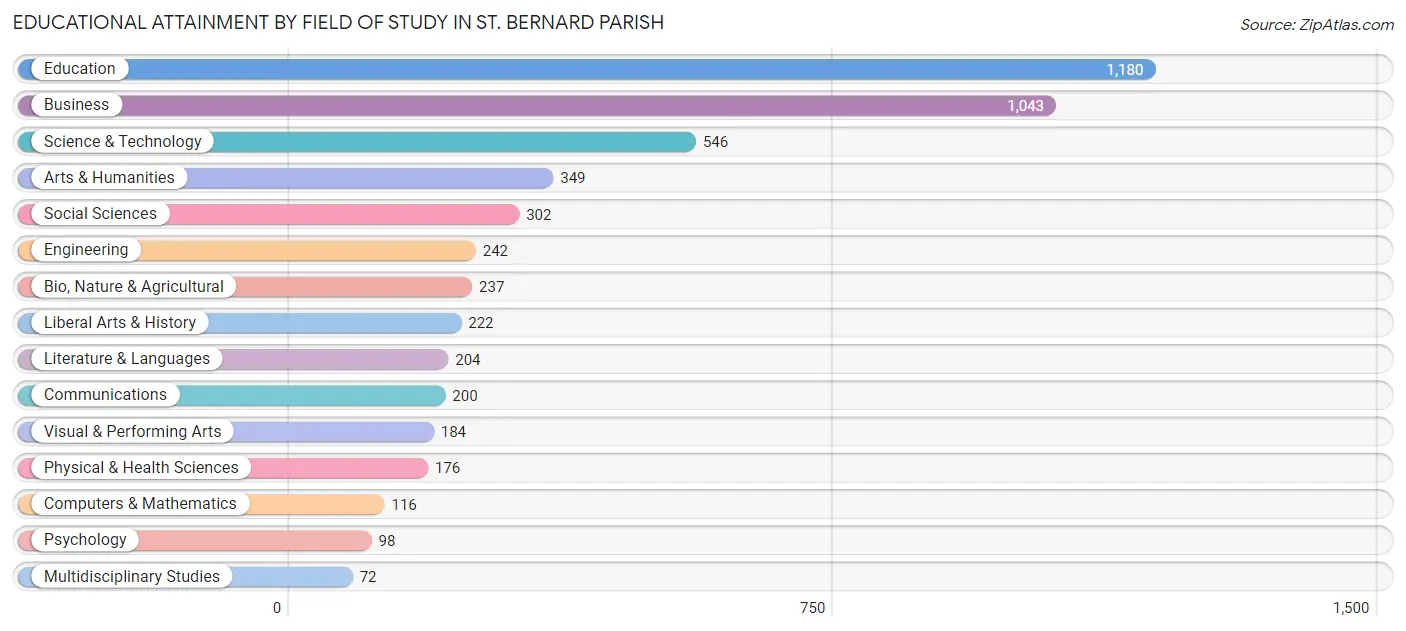
| Field of Study | # Graduates | % Graduates |
| Computers & Mathematics | 116 | 2.2% |
| Bio, Nature & Agricultural | 237 | 4.6% |
| Physical & Health Sciences | 176 | 3.4% |
| Psychology | 98 | 1.9% |
| Social Sciences | 302 | 5.8% |
| Engineering | 242 | 4.7% |
| Multidisciplinary Studies | 72 | 1.4% |
| Science & Technology | 546 | 10.6% |
| Business | 1,043 | 20.2% |
| Education | 1,180 | 22.8% |
| Literature & Languages | 204 | 4.0% |
| Liberal Arts & History | 222 | 4.3% |
| Visual & Performing Arts | 184 | 3.6% |
| Communications | 200 | 3.9% |
| Arts & Humanities | 349 | 6.8% |
| Total | 5,171 | 100.0% |
Transportation & Commute in St. Bernard Parish
Vehicle Availability by Sex in St. Bernard Parish
The most prevalent vehicle ownership categories in St. Bernard Parish are males with 2 vehicles (4,091, accounting for 44.2%) and females with 2 vehicles (3,653, making up 44.3%).
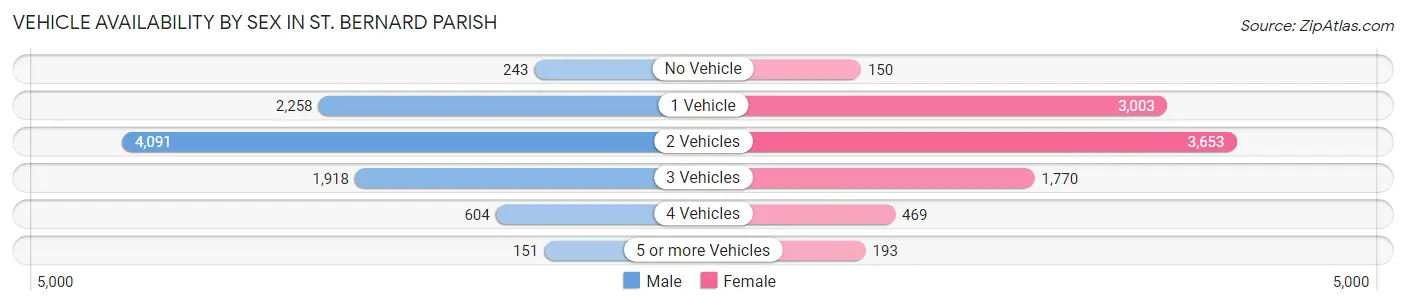
| Vehicles Available | Male | Female |
| No Vehicle | 243 (2.6%) | 150 (1.6%) |
| 1 Vehicle | 2,258 (24.4%) | 3,003 (32.5%) |
| 2 Vehicles | 4,091 (44.2%) | 3,653 (39.5%) |
| 3 Vehicles | 1,918 (20.7%) | 1,770 (19.2%) |
| 4 Vehicles | 604 (6.5%) | 469 (5.1%) |
| 5 or more Vehicles | 151 (1.6%) | 193 (2.1%) |
| Total | 9,265 (100.0%) | 9,238 (100.0%) |
Commute Time in St. Bernard Parish
The most frequently occuring commute durations in St. Bernard Parish are 45 to 59 minutes (2,675 commuters, 15.2%), 30 to 34 minutes (2,495 commuters, 14.2%), and 10 to 14 minutes (2,233 commuters, 12.7%).
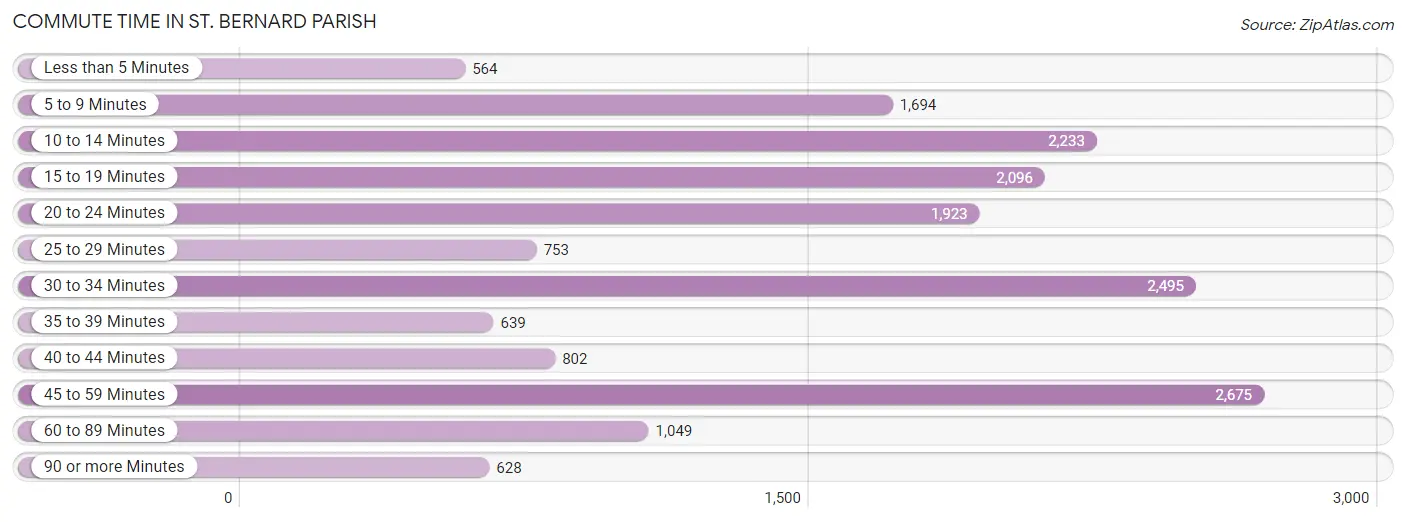
| Commute Time | # Commuters | % Commuters |
| Less than 5 Minutes | 564 | 3.2% |
| 5 to 9 Minutes | 1,694 | 9.7% |
| 10 to 14 Minutes | 2,233 | 12.7% |
| 15 to 19 Minutes | 2,096 | 11.9% |
| 20 to 24 Minutes | 1,923 | 11.0% |
| 25 to 29 Minutes | 753 | 4.3% |
| 30 to 34 Minutes | 2,495 | 14.2% |
| 35 to 39 Minutes | 639 | 3.6% |
| 40 to 44 Minutes | 802 | 4.6% |
| 45 to 59 Minutes | 2,675 | 15.2% |
| 60 to 89 Minutes | 1,049 | 6.0% |
| 90 or more Minutes | 628 | 3.6% |
Commute Time by Sex in St. Bernard Parish
The most common commute times in St. Bernard Parish are 45 to 59 minutes (1,403 commuters, 15.8%) for males and 30 to 34 minutes (1,281 commuters, 14.7%) for females.
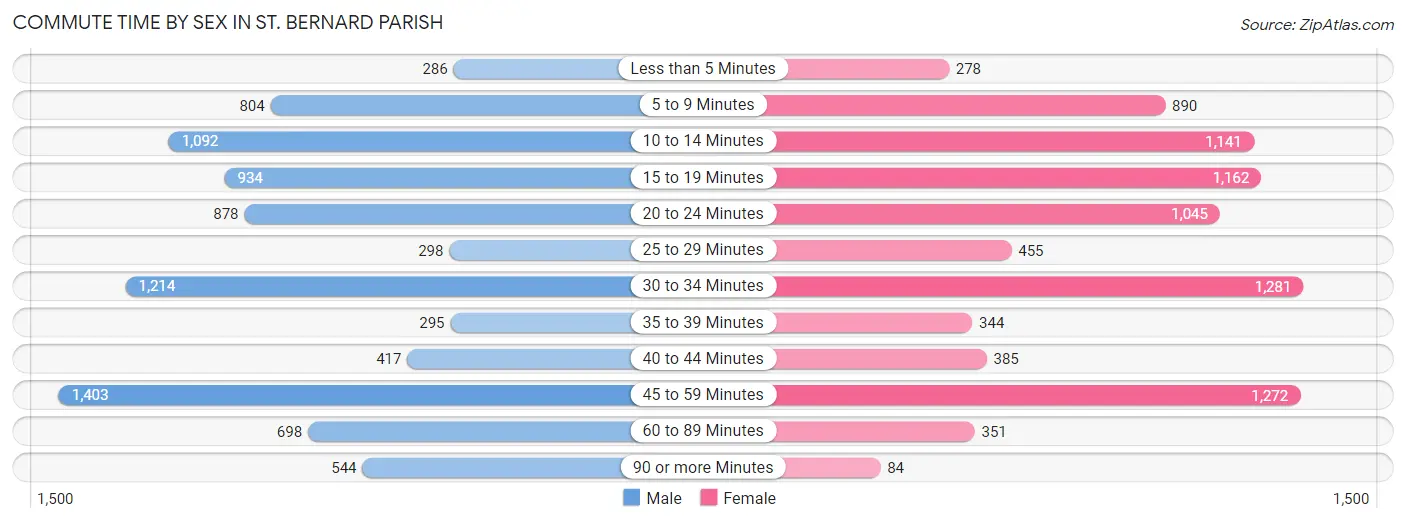
| Commute Time | Male | Female |
| Less than 5 Minutes | 286 (3.2%) | 278 (3.2%) |
| 5 to 9 Minutes | 804 (9.1%) | 890 (10.2%) |
| 10 to 14 Minutes | 1,092 (12.3%) | 1,141 (13.1%) |
| 15 to 19 Minutes | 934 (10.5%) | 1,162 (13.4%) |
| 20 to 24 Minutes | 878 (9.9%) | 1,045 (12.0%) |
| 25 to 29 Minutes | 298 (3.4%) | 455 (5.2%) |
| 30 to 34 Minutes | 1,214 (13.7%) | 1,281 (14.7%) |
| 35 to 39 Minutes | 295 (3.3%) | 344 (4.0%) |
| 40 to 44 Minutes | 417 (4.7%) | 385 (4.4%) |
| 45 to 59 Minutes | 1,403 (15.8%) | 1,272 (14.6%) |
| 60 to 89 Minutes | 698 (7.9%) | 351 (4.0%) |
| 90 or more Minutes | 544 (6.1%) | 84 (1.0%) |
Time of Departure to Work by Sex in St. Bernard Parish
The most frequent times of departure to work in St. Bernard Parish are 6:00 AM to 6:29 AM (1,248, 14.1%) for males and 7:00 AM to 7:29 AM (1,567, 18.0%) for females.
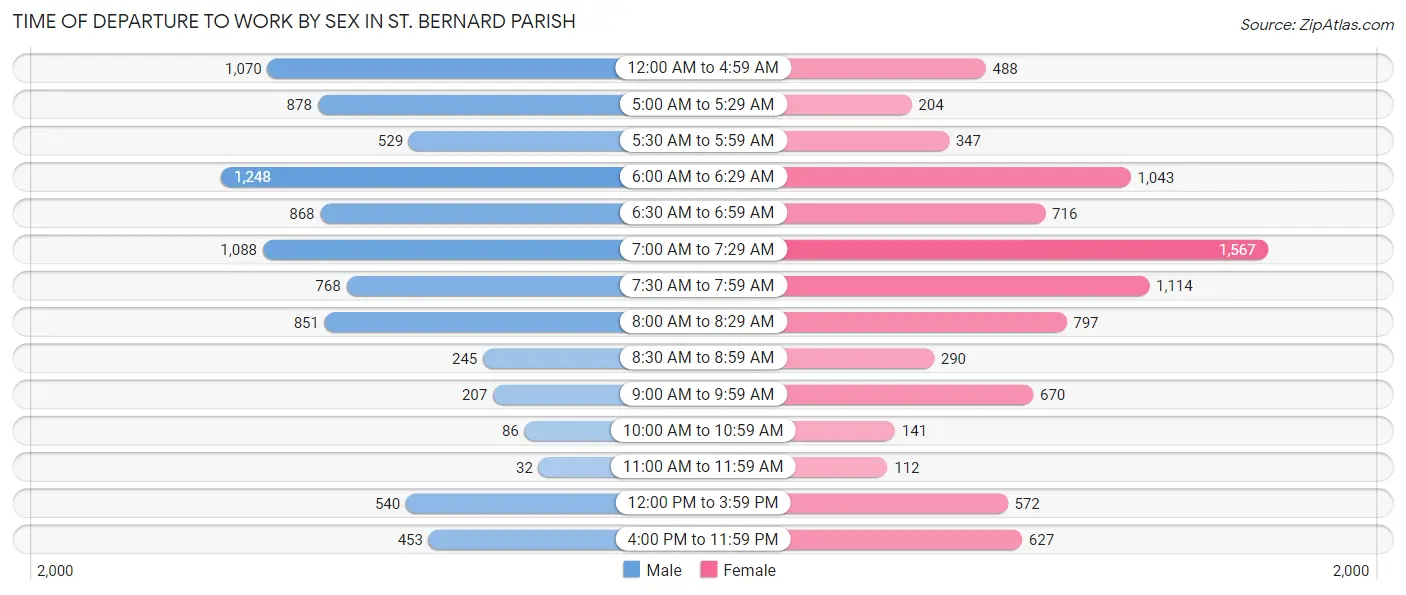
| Time of Departure | Male | Female |
| 12:00 AM to 4:59 AM | 1,070 (12.1%) | 488 (5.6%) |
| 5:00 AM to 5:29 AM | 878 (9.9%) | 204 (2.4%) |
| 5:30 AM to 5:59 AM | 529 (6.0%) | 347 (4.0%) |
| 6:00 AM to 6:29 AM | 1,248 (14.1%) | 1,043 (12.0%) |
| 6:30 AM to 6:59 AM | 868 (9.8%) | 716 (8.2%) |
| 7:00 AM to 7:29 AM | 1,088 (12.3%) | 1,567 (18.0%) |
| 7:30 AM to 7:59 AM | 768 (8.7%) | 1,114 (12.8%) |
| 8:00 AM to 8:29 AM | 851 (9.6%) | 797 (9.2%) |
| 8:30 AM to 8:59 AM | 245 (2.8%) | 290 (3.3%) |
| 9:00 AM to 9:59 AM | 207 (2.3%) | 670 (7.7%) |
| 10:00 AM to 10:59 AM | 86 (1.0%) | 141 (1.6%) |
| 11:00 AM to 11:59 AM | 32 (0.4%) | 112 (1.3%) |
| 12:00 PM to 3:59 PM | 540 (6.1%) | 572 (6.6%) |
| 4:00 PM to 11:59 PM | 453 (5.1%) | 627 (7.2%) |
| Total | 8,863 (100.0%) | 8,688 (100.0%) |
Housing Occupancy in St. Bernard Parish
Occupancy by Ownership in St. Bernard Parish
Of the total 15,732 dwellings in St. Bernard Parish, owner-occupied units account for 11,312 (71.9%), while renter-occupied units make up 4,420 (28.1%).
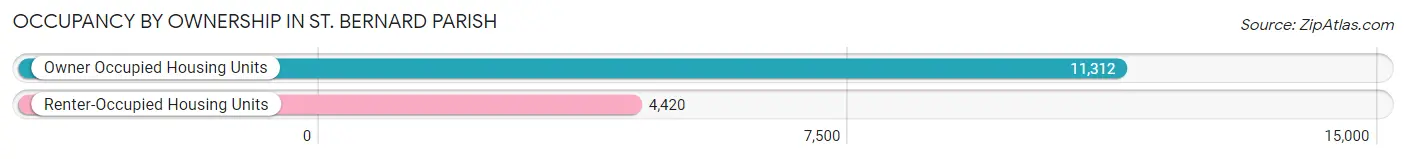
| Occupancy | # Housing Units | % Housing Units |
| Owner Occupied Housing Units | 11,312 | 71.9% |
| Renter-Occupied Housing Units | 4,420 | 28.1% |
| Total Occupied Housing Units | 15,732 | 100.0% |
Occupancy by Household Size in St. Bernard Parish
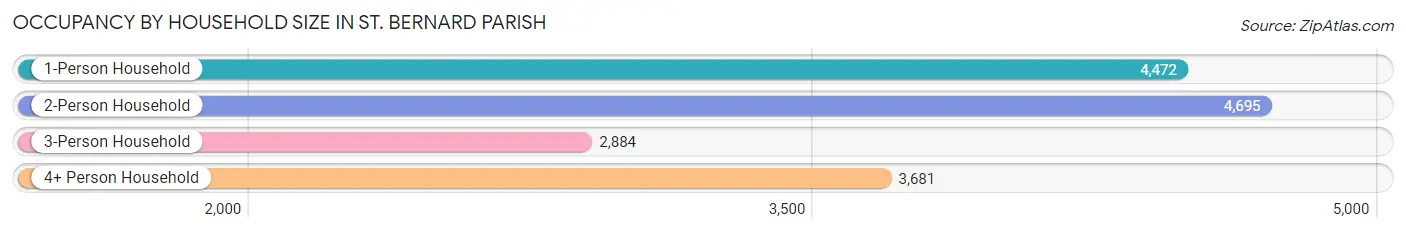
| Household Size | # Housing Units | % Housing Units |
| 1-Person Household | 4,472 | 28.4% |
| 2-Person Household | 4,695 | 29.8% |
| 3-Person Household | 2,884 | 18.3% |
| 4+ Person Household | 3,681 | 23.4% |
| Total Housing Units | 15,732 | 100.0% |
Occupancy by Ownership by Household Size in St. Bernard Parish
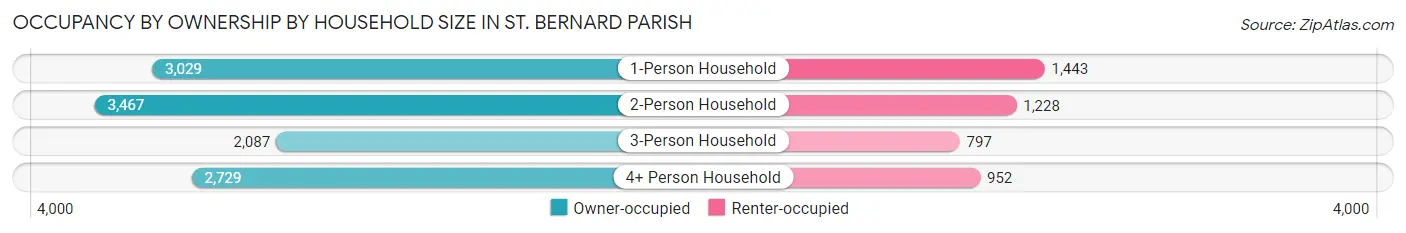
| Household Size | Owner-occupied | Renter-occupied |
| 1-Person Household | 3,029 (67.7%) | 1,443 (32.3%) |
| 2-Person Household | 3,467 (73.8%) | 1,228 (26.2%) |
| 3-Person Household | 2,087 (72.4%) | 797 (27.6%) |
| 4+ Person Household | 2,729 (74.1%) | 952 (25.9%) |
| Total Housing Units | 11,312 (71.9%) | 4,420 (28.1%) |
Occupancy by Educational Attainment in St. Bernard Parish
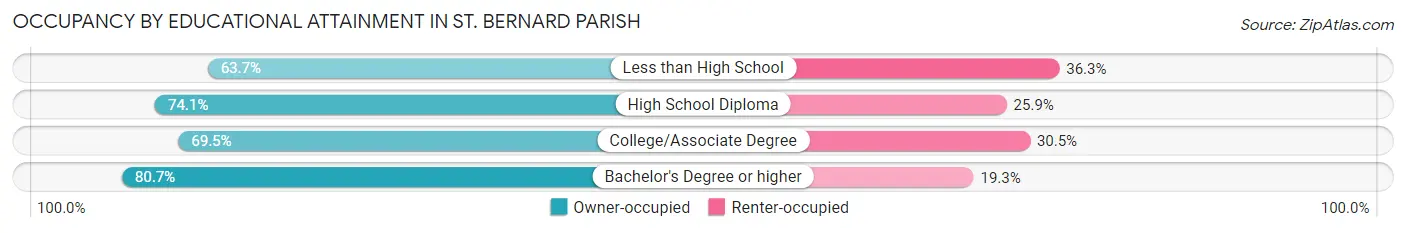
| Household Size | Owner-occupied | Renter-occupied |
| Less than High School | 1,596 (63.7%) | 910 (36.3%) |
| High School Diploma | 3,387 (74.1%) | 1,182 (25.9%) |
| College/Associate Degree | 4,084 (69.5%) | 1,791 (30.5%) |
| Bachelor's Degree or higher | 2,245 (80.7%) | 537 (19.3%) |
Occupancy by Age of Householder in St. Bernard Parish
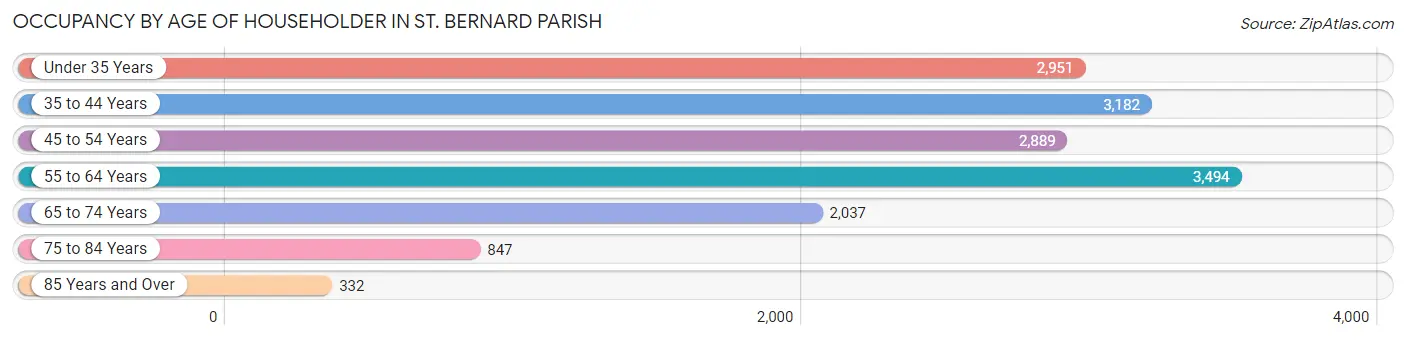
| Age Bracket | # Households | % Households |
| Under 35 Years | 2,951 | 18.8% |
| 35 to 44 Years | 3,182 | 20.2% |
| 45 to 54 Years | 2,889 | 18.4% |
| 55 to 64 Years | 3,494 | 22.2% |
| 65 to 74 Years | 2,037 | 13.0% |
| 75 to 84 Years | 847 | 5.4% |
| 85 Years and Over | 332 | 2.1% |
| Total | 15,732 | 100.0% |
Housing Finances in St. Bernard Parish
Median Income by Occupancy in St. Bernard Parish
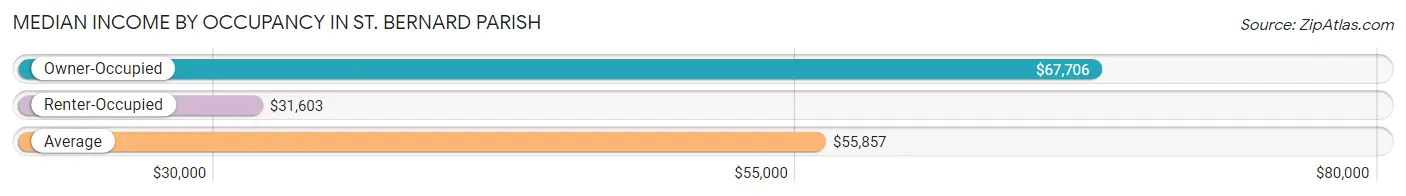
| Occupancy Type | # Households | Median Income |
| Owner-Occupied | 11,312 (71.9%) | $67,706 |
| Renter-Occupied | 4,420 (28.1%) | $31,603 |
| Average | 15,732 (100.0%) | $55,857 |
Occupancy by Householder Income Bracket in St. Bernard Parish
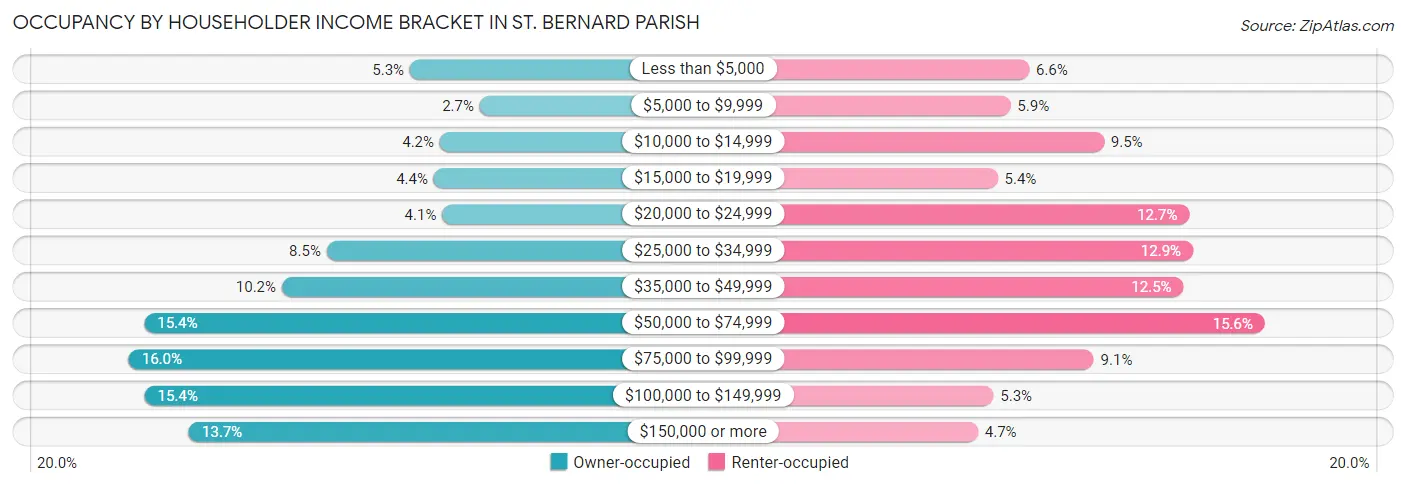
| Income Bracket | Owner-occupied | Renter-occupied |
| Less than $5,000 | 602 (5.3%) | 292 (6.6%) |
| $5,000 to $9,999 | 301 (2.7%) | 261 (5.9%) |
| $10,000 to $14,999 | 473 (4.2%) | 418 (9.5%) |
| $15,000 to $19,999 | 499 (4.4%) | 239 (5.4%) |
| $20,000 to $24,999 | 463 (4.1%) | 562 (12.7%) |
| $25,000 to $34,999 | 960 (8.5%) | 568 (12.9%) |
| $35,000 to $49,999 | 1,154 (10.2%) | 552 (12.5%) |
| $50,000 to $74,999 | 1,747 (15.4%) | 689 (15.6%) |
| $75,000 to $99,999 | 1,813 (16.0%) | 401 (9.1%) |
| $100,000 to $149,999 | 1,746 (15.4%) | 232 (5.2%) |
| $150,000 or more | 1,554 (13.7%) | 206 (4.7%) |
| Total | 11,312 (100.0%) | 4,420 (100.0%) |
Monthly Housing Cost Tiers in St. Bernard Parish
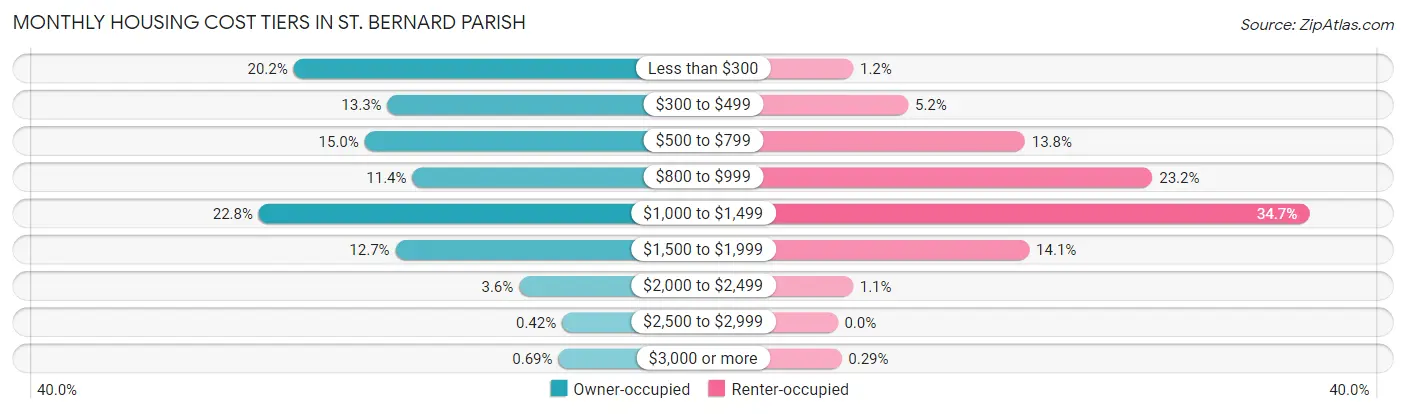
| Monthly Cost | Owner-occupied | Renter-occupied |
| Less than $300 | 2,284 (20.2%) | 51 (1.1%) |
| $300 to $499 | 1,502 (13.3%) | 230 (5.2%) |
| $500 to $799 | 1,692 (15.0%) | 610 (13.8%) |
| $800 to $999 | 1,294 (11.4%) | 1,025 (23.2%) |
| $1,000 to $1,499 | 2,574 (22.8%) | 1,535 (34.7%) |
| $1,500 to $1,999 | 1,435 (12.7%) | 624 (14.1%) |
| $2,000 to $2,499 | 405 (3.6%) | 50 (1.1%) |
| $2,500 to $2,999 | 48 (0.4%) | 0 (0.0%) |
| $3,000 or more | 78 (0.7%) | 13 (0.3%) |
| Total | 11,312 (100.0%) | 4,420 (100.0%) |
Physical Housing Characteristics in St. Bernard Parish
Housing Structures in St. Bernard Parish
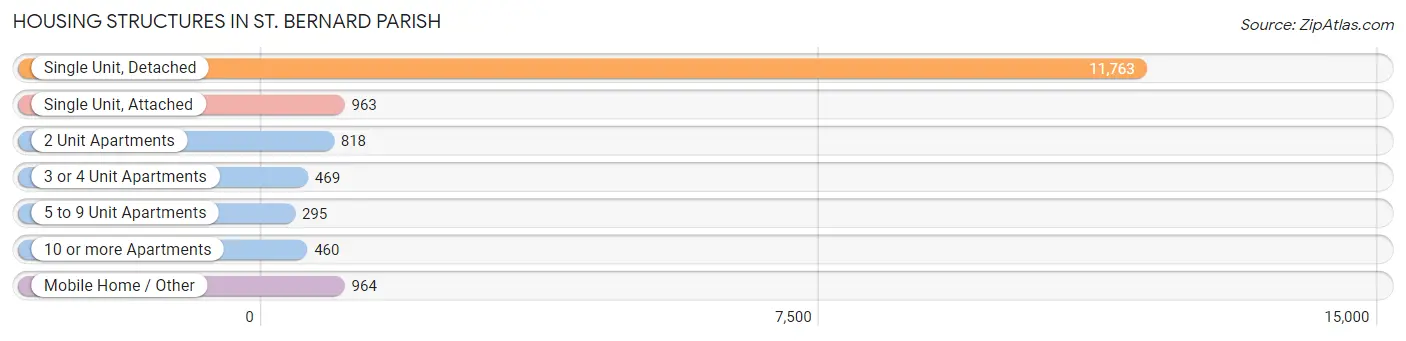
| Structure Type | # Housing Units | % Housing Units |
| Single Unit, Detached | 11,763 | 74.8% |
| Single Unit, Attached | 963 | 6.1% |
| 2 Unit Apartments | 818 | 5.2% |
| 3 or 4 Unit Apartments | 469 | 3.0% |
| 5 to 9 Unit Apartments | 295 | 1.9% |
| 10 or more Apartments | 460 | 2.9% |
| Mobile Home / Other | 964 | 6.1% |
| Total | 15,732 | 100.0% |
Housing Structures by Occupancy in St. Bernard Parish
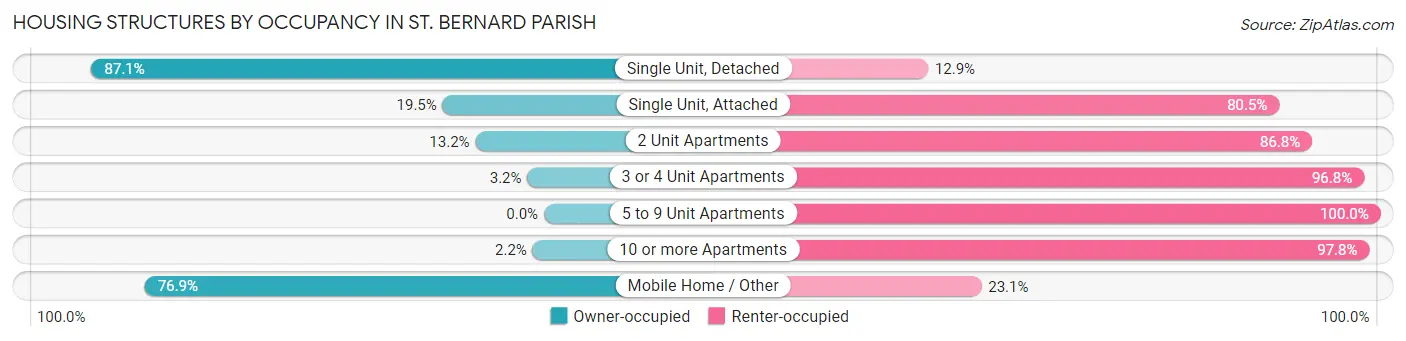
| Structure Type | Owner-occupied | Renter-occupied |
| Single Unit, Detached | 10,250 (87.1%) | 1,513 (12.9%) |
| Single Unit, Attached | 188 (19.5%) | 775 (80.5%) |
| 2 Unit Apartments | 108 (13.2%) | 710 (86.8%) |
| 3 or 4 Unit Apartments | 15 (3.2%) | 454 (96.8%) |
| 5 to 9 Unit Apartments | 0 (0.0%) | 295 (100.0%) |
| 10 or more Apartments | 10 (2.2%) | 450 (97.8%) |
| Mobile Home / Other | 741 (76.9%) | 223 (23.1%) |
| Total | 11,312 (71.9%) | 4,420 (28.1%) |
Housing Structures by Number of Rooms in St. Bernard Parish
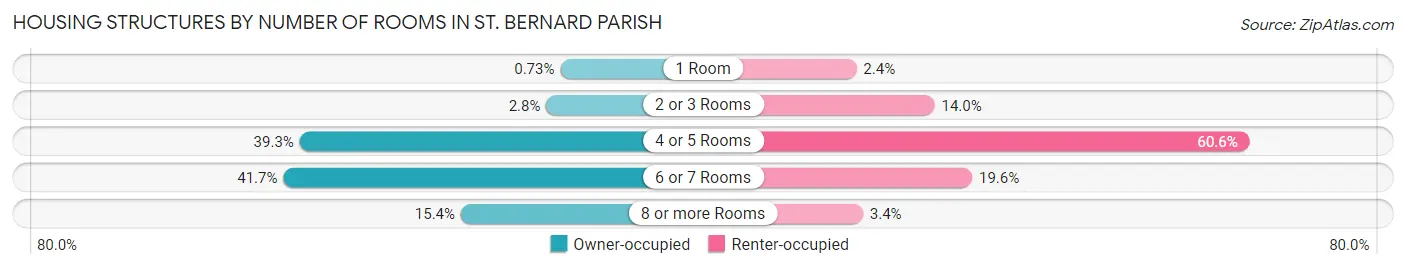
| Number of Rooms | Owner-occupied | Renter-occupied |
| 1 Room | 83 (0.7%) | 108 (2.4%) |
| 2 or 3 Rooms | 317 (2.8%) | 619 (14.0%) |
| 4 or 5 Rooms | 4,446 (39.3%) | 2,679 (60.6%) |
| 6 or 7 Rooms | 4,719 (41.7%) | 864 (19.6%) |
| 8 or more Rooms | 1,747 (15.4%) | 150 (3.4%) |
| Total | 11,312 (100.0%) | 4,420 (100.0%) |
Housing Structure by Heating Type in St. Bernard Parish
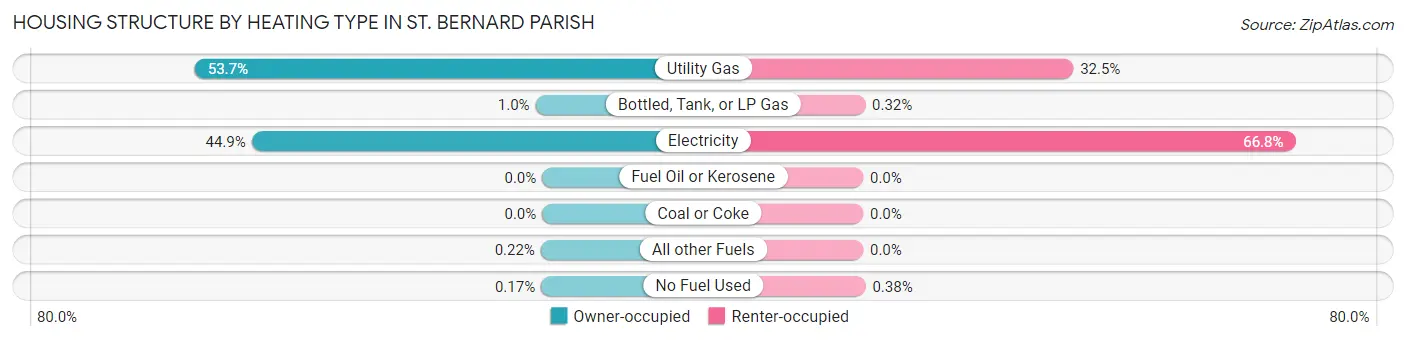
| Heating Type | Owner-occupied | Renter-occupied |
| Utility Gas | 6,072 (53.7%) | 1,436 (32.5%) |
| Bottled, Tank, or LP Gas | 116 (1.0%) | 14 (0.3%) |
| Electricity | 5,080 (44.9%) | 2,953 (66.8%) |
| Fuel Oil or Kerosene | 0 (0.0%) | 0 (0.0%) |
| Coal or Coke | 0 (0.0%) | 0 (0.0%) |
| All other Fuels | 25 (0.2%) | 0 (0.0%) |
| No Fuel Used | 19 (0.2%) | 17 (0.4%) |
| Total | 11,312 (100.0%) | 4,420 (100.0%) |
Household Vehicle Usage in St. Bernard Parish
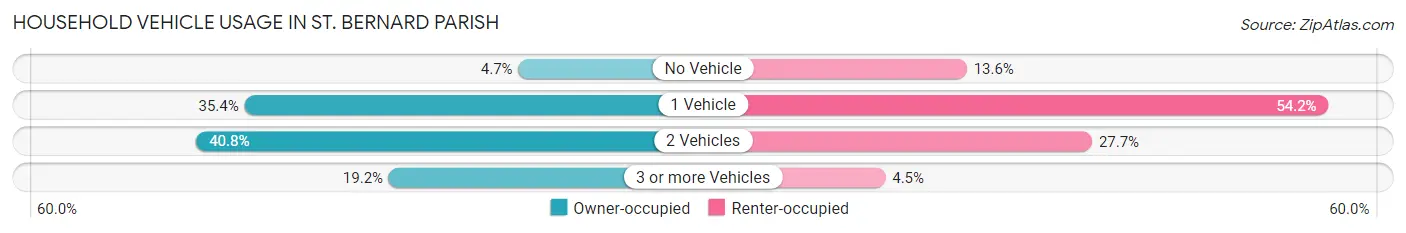
| Vehicles per Household | Owner-occupied | Renter-occupied |
| No Vehicle | 529 (4.7%) | 603 (13.6%) |
| 1 Vehicle | 4,000 (35.4%) | 2,394 (54.2%) |
| 2 Vehicles | 4,612 (40.8%) | 1,223 (27.7%) |
| 3 or more Vehicles | 2,171 (19.2%) | 200 (4.5%) |
| Total | 11,312 (100.0%) | 4,420 (100.0%) |
Real Estate & Mortgages in St. Bernard Parish
Real Estate and Mortgage Overview in St. Bernard Parish
| Characteristic | Without Mortgage | With Mortgage |
| Housing Units | 5,170 | 6,142 |
| Median Property Value | $162,700 | $196,400 |
| Median Household Income | $44,973 | $1,099 |
| Monthly Housing Costs | $343 | $78 |
| Real Estate Taxes | $873 | $1,146 |
Property Value by Mortgage Status in St. Bernard Parish
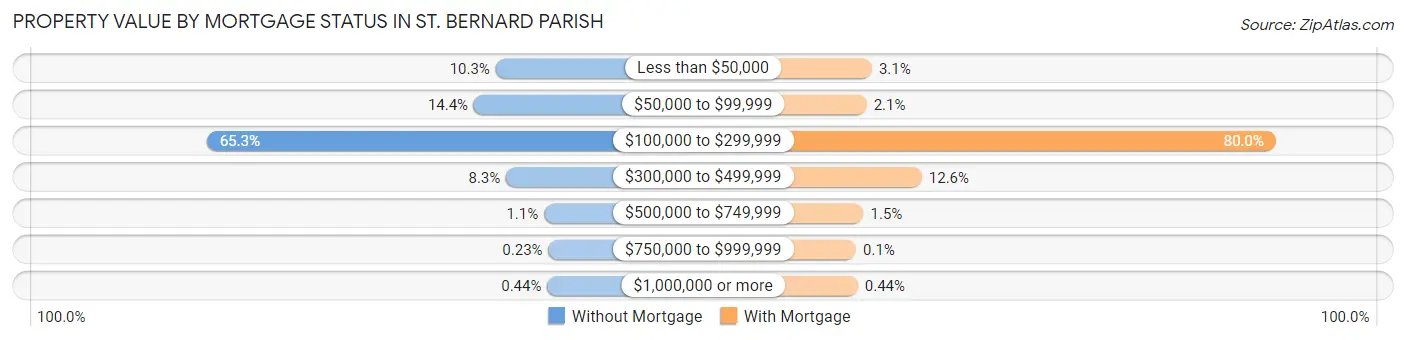
| Property Value | Without Mortgage | With Mortgage |
| Less than $50,000 | 531 (10.3%) | 192 (3.1%) |
| $50,000 to $99,999 | 745 (14.4%) | 131 (2.1%) |
| $100,000 to $299,999 | 3,376 (65.3%) | 4,916 (80.0%) |
| $300,000 to $499,999 | 428 (8.3%) | 776 (12.6%) |
| $500,000 to $749,999 | 55 (1.1%) | 94 (1.5%) |
| $750,000 to $999,999 | 12 (0.2%) | 6 (0.1%) |
| $1,000,000 or more | 23 (0.4%) | 27 (0.4%) |
| Total | 5,170 (100.0%) | 6,142 (100.0%) |
Household Income by Mortgage Status in St. Bernard Parish
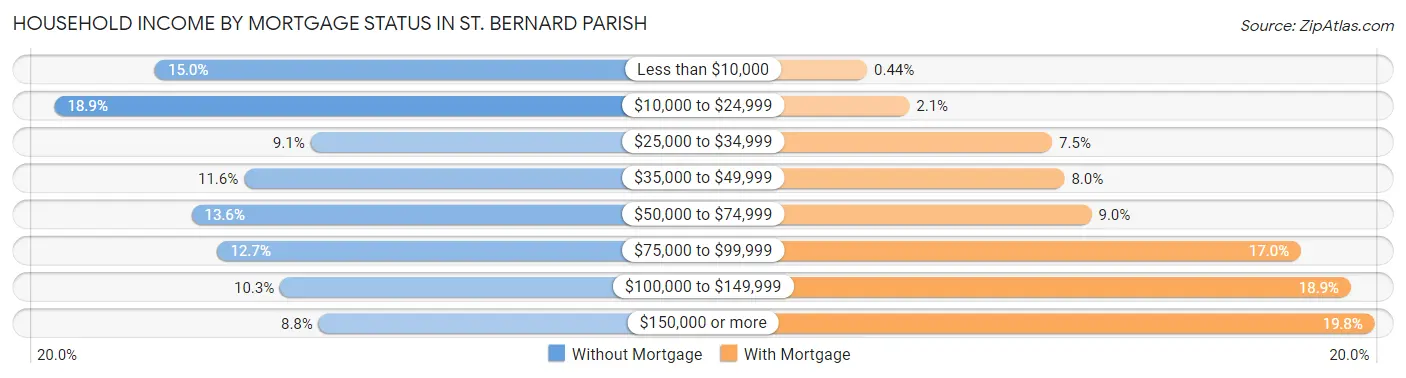
| Household Income | Without Mortgage | With Mortgage |
| Less than $10,000 | 777 (15.0%) | 27 (0.4%) |
| $10,000 to $24,999 | 975 (18.9%) | 126 (2.1%) |
| $25,000 to $34,999 | 471 (9.1%) | 460 (7.5%) |
| $35,000 to $49,999 | 602 (11.6%) | 489 (8.0%) |
| $50,000 to $74,999 | 705 (13.6%) | 552 (9.0%) |
| $75,000 to $99,999 | 654 (12.7%) | 1,042 (17.0%) |
| $100,000 to $149,999 | 531 (10.3%) | 1,159 (18.9%) |
| $150,000 or more | 455 (8.8%) | 1,215 (19.8%) |
| Total | 5,170 (100.0%) | 6,142 (100.0%) |
Property Value to Household Income Ratio in St. Bernard Parish
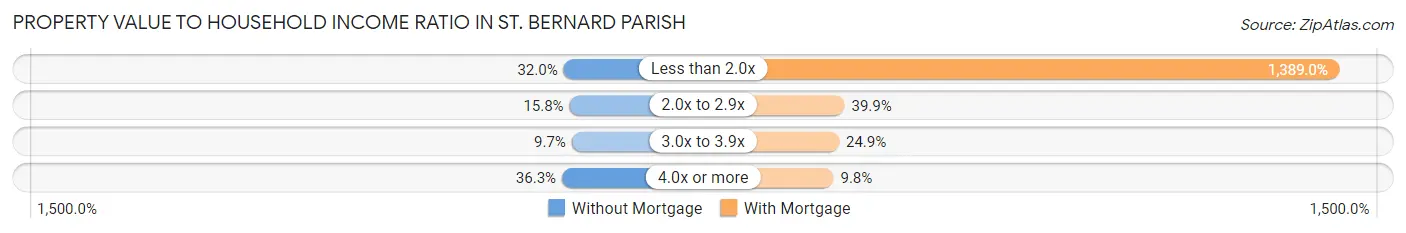
| Value-to-Income Ratio | Without Mortgage | With Mortgage |
| Less than 2.0x | 1,653 (32.0%) | 85,313 (1,389.0%) |
| 2.0x to 2.9x | 816 (15.8%) | 2,449 (39.9%) |
| 3.0x to 3.9x | 501 (9.7%) | 1,527 (24.9%) |
| 4.0x or more | 1,877 (36.3%) | 601 (9.8%) |
| Total | 5,170 (100.0%) | 6,142 (100.0%) |
Real Estate Taxes by Mortgage Status in St. Bernard Parish
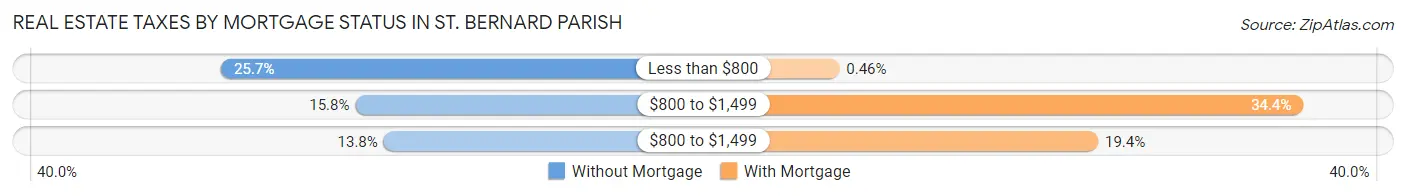
| Property Taxes | Without Mortgage | With Mortgage |
| Less than $800 | 1,326 (25.7%) | 28 (0.5%) |
| $800 to $1,499 | 819 (15.8%) | 2,110 (34.4%) |
| $800 to $1,499 | 712 (13.8%) | 1,189 (19.4%) |
| Total | 5,170 (100.0%) | 6,142 (100.0%) |
Health & Disability in St. Bernard Parish
Health Insurance Coverage by Age in St. Bernard Parish
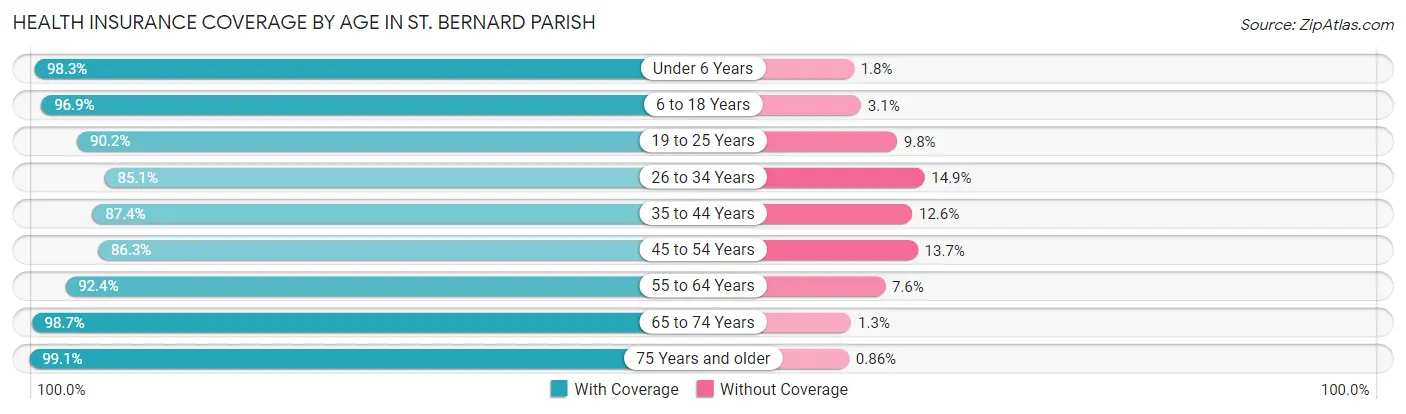
| Age Bracket | With Coverage | Without Coverage |
| Under 6 Years | 3,484 (98.3%) | 62 (1.8%) |
| 6 to 18 Years | 8,091 (96.9%) | 259 (3.1%) |
| 19 to 25 Years | 3,220 (90.2%) | 350 (9.8%) |
| 26 to 34 Years | 5,163 (85.1%) | 906 (14.9%) |
| 35 to 44 Years | 5,583 (87.4%) | 808 (12.6%) |
| 45 to 54 Years | 4,267 (86.3%) | 676 (13.7%) |
| 55 to 64 Years | 5,123 (92.4%) | 420 (7.6%) |
| 65 to 74 Years | 3,483 (98.7%) | 45 (1.3%) |
| 75 Years and older | 1,855 (99.1%) | 16 (0.9%) |
| Total | 40,269 (91.9%) | 3,542 (8.1%) |
Health Insurance Coverage by Citizenship Status in St. Bernard Parish

| Citizenship Status | With Coverage | Without Coverage |
| Native Born | 3,484 (98.3%) | 62 (1.8%) |
| Foreign Born, Citizen | 8,091 (96.9%) | 259 (3.1%) |
| Foreign Born, not a Citizen | 3,220 (90.2%) | 350 (9.8%) |
Health Insurance Coverage by Household Income in St. Bernard Parish
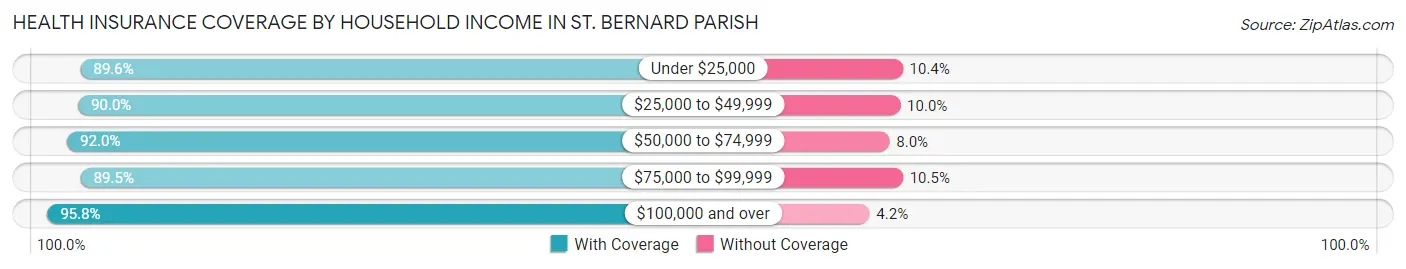
| Household Income | With Coverage | Without Coverage |
| Under $25,000 | 7,812 (89.6%) | 911 (10.4%) |
| $25,000 to $49,999 | 7,192 (90.0%) | 799 (10.0%) |
| $50,000 to $74,999 | 6,791 (92.0%) | 588 (8.0%) |
| $75,000 to $99,999 | 5,857 (89.5%) | 686 (10.5%) |
| $100,000 and over | 12,567 (95.8%) | 556 (4.2%) |
Public vs Private Health Insurance Coverage by Age in St. Bernard Parish
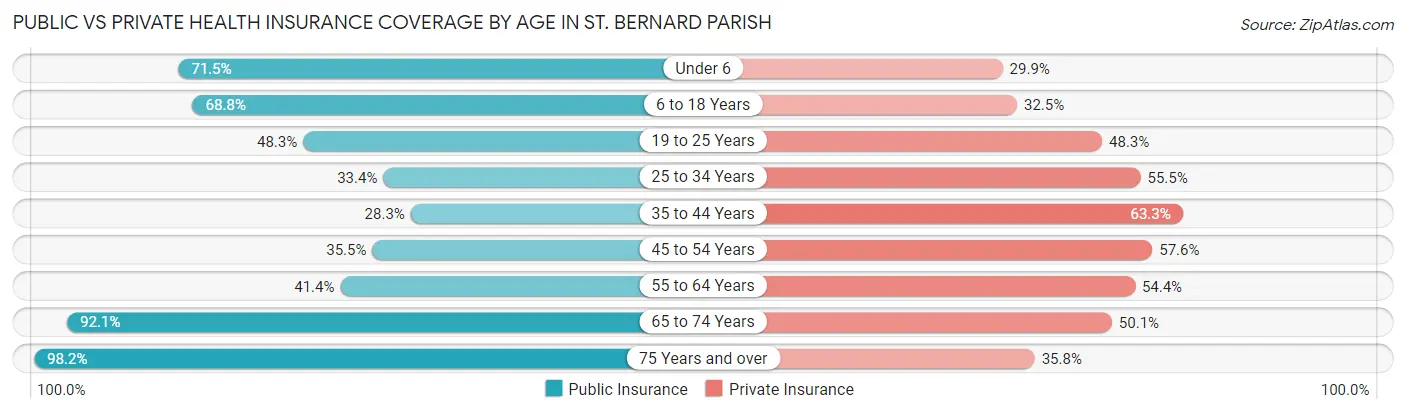
| Age Bracket | Public Insurance | Private Insurance |
| Under 6 | 2,534 (71.5%) | 1,059 (29.9%) |
| 6 to 18 Years | 5,746 (68.8%) | 2,716 (32.5%) |
| 19 to 25 Years | 1,725 (48.3%) | 1,725 (48.3%) |
| 25 to 34 Years | 2,029 (33.4%) | 3,365 (55.4%) |
| 35 to 44 Years | 1,811 (28.3%) | 4,042 (63.2%) |
| 45 to 54 Years | 1,753 (35.5%) | 2,849 (57.6%) |
| 55 to 64 Years | 2,295 (41.4%) | 3,016 (54.4%) |
| 65 to 74 Years | 3,250 (92.1%) | 1,769 (50.1%) |
| 75 Years and over | 1,838 (98.2%) | 670 (35.8%) |
| Total | 22,981 (52.4%) | 21,211 (48.4%) |
Disability Status by Sex by Age in St. Bernard Parish
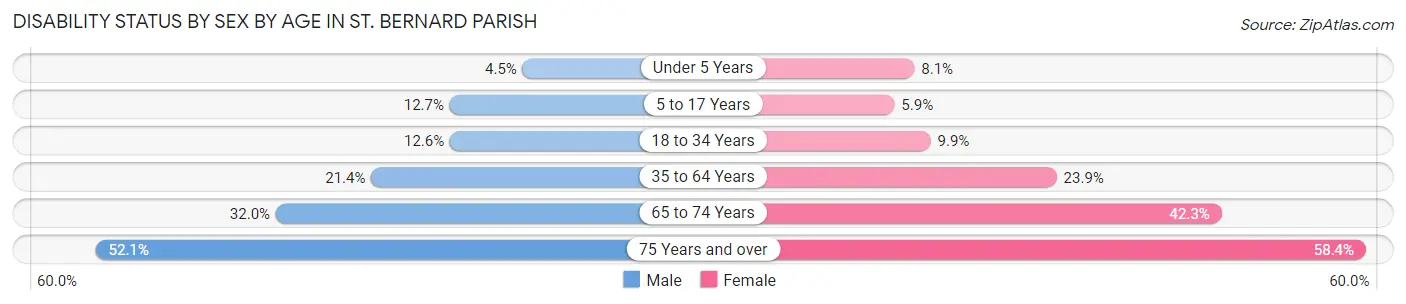
| Age Bracket | Male | Female |
| Under 5 Years | 66 (4.5%) | 118 (8.1%) |
| 5 to 17 Years | 555 (12.7%) | 245 (5.9%) |
| 18 to 34 Years | 610 (12.6%) | 516 (9.9%) |
| 35 to 64 Years | 1,766 (21.4%) | 2,063 (23.9%) |
| 65 to 74 Years | 564 (32.0%) | 747 (42.3%) |
| 75 Years and over | 423 (52.1%) | 618 (58.4%) |
Disability Class by Sex by Age in St. Bernard Parish
Disability Class: Hearing Difficulty
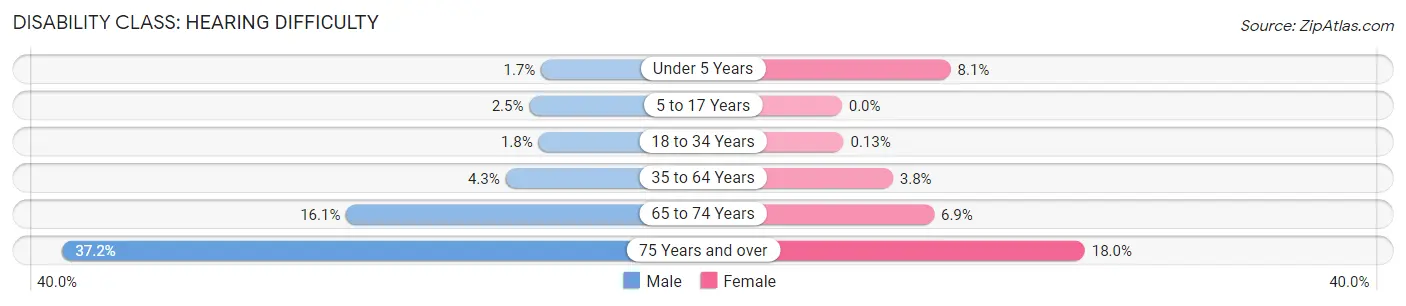
| Age Bracket | Male | Female |
| Under 5 Years | 24 (1.7%) | 118 (8.1%) |
| 5 to 17 Years | 111 (2.5%) | 0 (0.0%) |
| 18 to 34 Years | 89 (1.8%) | 7 (0.1%) |
| 35 to 64 Years | 354 (4.3%) | 327 (3.8%) |
| 65 to 74 Years | 284 (16.1%) | 121 (6.9%) |
| 75 Years and over | 302 (37.2%) | 191 (18.0%) |
Disability Class: Vision Difficulty
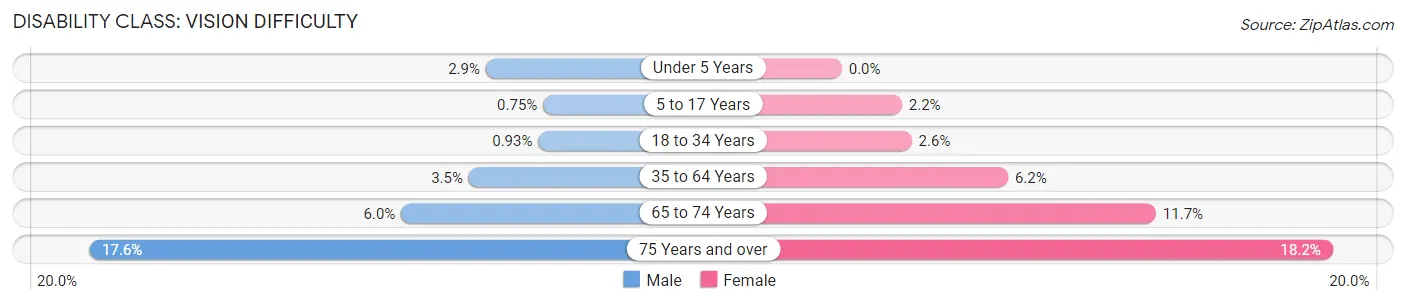
| Age Bracket | Male | Female |
| Under 5 Years | 42 (2.9%) | 0 (0.0%) |
| 5 to 17 Years | 33 (0.7%) | 93 (2.2%) |
| 18 to 34 Years | 45 (0.9%) | 135 (2.6%) |
| 35 to 64 Years | 290 (3.5%) | 532 (6.2%) |
| 65 to 74 Years | 106 (6.0%) | 206 (11.7%) |
| 75 Years and over | 143 (17.6%) | 193 (18.2%) |
Disability Class: Cognitive Difficulty
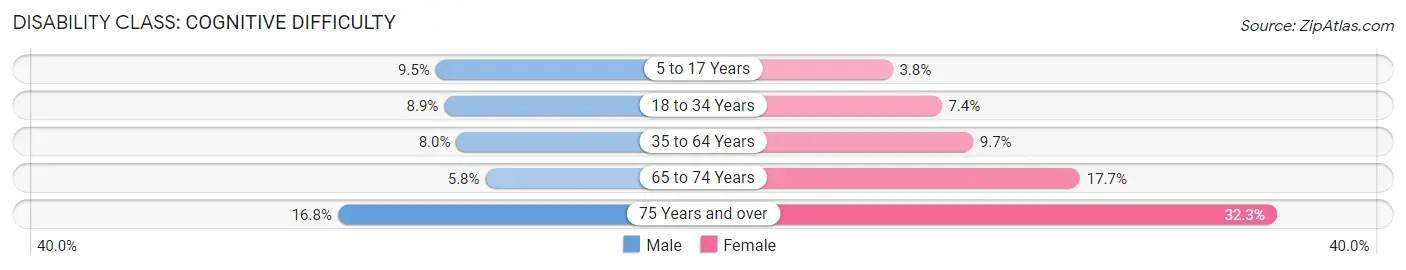
| Age Bracket | Male | Female |
| 5 to 17 Years | 416 (9.5%) | 157 (3.8%) |
| 18 to 34 Years | 428 (8.8%) | 386 (7.4%) |
| 35 to 64 Years | 656 (8.0%) | 839 (9.7%) |
| 65 to 74 Years | 102 (5.8%) | 312 (17.7%) |
| 75 Years and over | 136 (16.8%) | 342 (32.3%) |
Disability Class: Ambulatory Difficulty
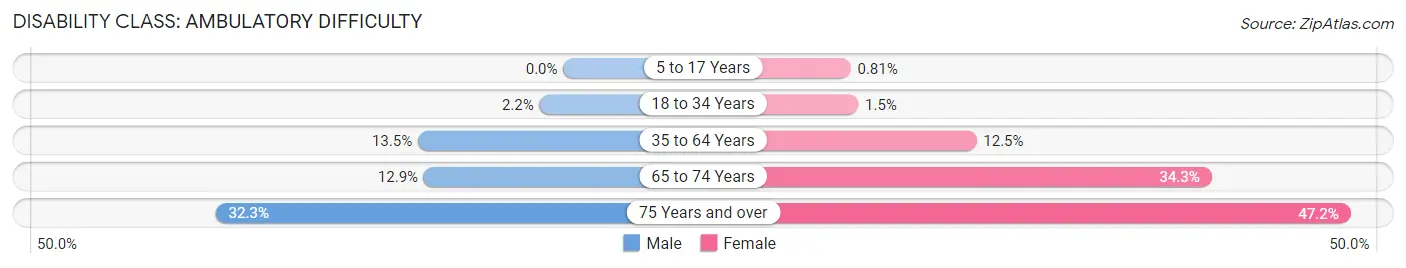
| Age Bracket | Male | Female |
| 5 to 17 Years | 0 (0.0%) | 34 (0.8%) |
| 18 to 34 Years | 107 (2.2%) | 79 (1.5%) |
| 35 to 64 Years | 1,114 (13.5%) | 1,077 (12.5%) |
| 65 to 74 Years | 228 (12.9%) | 606 (34.3%) |
| 75 Years and over | 262 (32.3%) | 500 (47.2%) |
Disability Class: Self-Care Difficulty
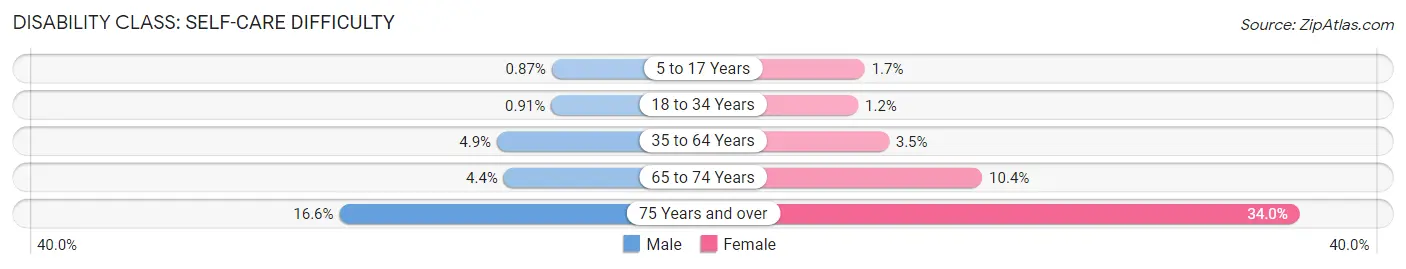
| Age Bracket | Male | Female |
| 5 to 17 Years | 38 (0.9%) | 71 (1.7%) |
| 18 to 34 Years | 44 (0.9%) | 63 (1.2%) |
| 35 to 64 Years | 407 (4.9%) | 301 (3.5%) |
| 65 to 74 Years | 78 (4.4%) | 184 (10.4%) |
| 75 Years and over | 135 (16.6%) | 360 (34.0%) |
Technology Access in St. Bernard Parish
Computing Device Access in St. Bernard Parish
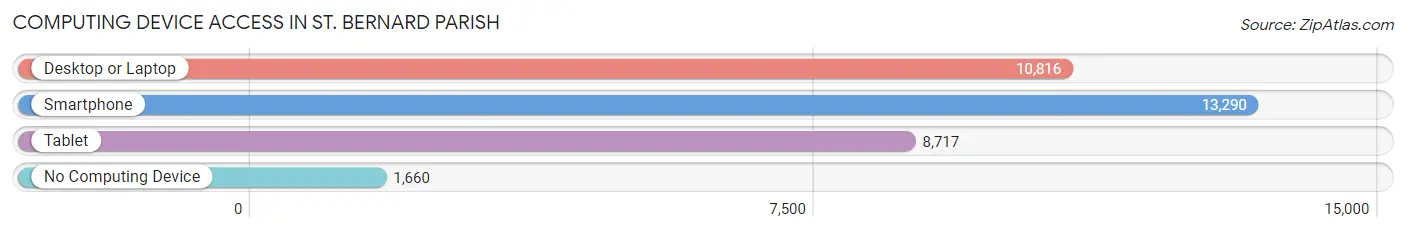
| Device Type | # Households | % Households |
| Desktop or Laptop | 10,816 | 68.8% |
| Smartphone | 13,290 | 84.5% |
| Tablet | 8,717 | 55.4% |
| No Computing Device | 1,660 | 10.5% |
| Total | 15,732 | 100.0% |
Internet Access in St. Bernard Parish
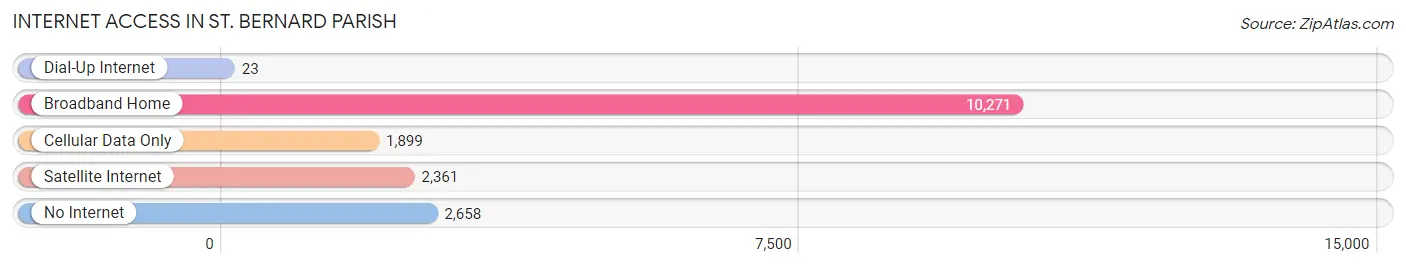
| Internet Type | # Households | % Households |
| Dial-Up Internet | 23 | 0.2% |
| Broadband Home | 10,271 | 65.3% |
| Cellular Data Only | 1,899 | 12.1% |
| Satellite Internet | 2,361 | 15.0% |
| No Internet | 2,658 | 16.9% |
| Total | 15,732 | 100.0% |
St. Bernard Parish Summary
St. Bernard Parish is a parish located in the southeastern part of Louisiana, United States. It is part of the New Orleans–Metairie–Kenner Metropolitan Statistical Area. As of the 2010 census, the population was 35,897. The parish seat and largest city is Chalmette.
History
St. Bernard Parish was established in 1807, and was named after Bernard de Marigny, a French-Creole aristocrat who was the first to settle the area. The parish was originally part of Orleans Parish, but was split off in 1807.
The parish was heavily damaged by Hurricane Katrina in 2005, and much of the population was displaced. The parish was declared a disaster area, and the federal government provided assistance to help rebuild the area.
Geography
St. Bernard Parish is located in the southeastern part of Louisiana, and is bordered by Orleans Parish to the north, Plaquemines Parish to the south, and the Gulf of Mexico to the east. The parish covers an area of 545 square miles, and has a population density of 66 people per square mile.
The parish is mostly flat, with some low hills in the northern part. The highest point in the parish is an unnamed hill in the northern part, which has an elevation of 25 feet. The parish is located in the Mississippi River Delta, and is mostly covered in marshland.
Economy
The economy of St. Bernard Parish is largely based on the oil and gas industry, as well as fishing and tourism. The parish is home to several oil and gas refineries, as well as a number of fishing and shrimping operations.
Tourism is also an important part of the economy, as the parish is home to several popular attractions, including the Jean Lafitte National Historical Park and Preserve, the Chalmette National Cemetery, and the St. Bernard State Park.
Demographics
As of the 2010 census, there were 35,897 people, 12,845 households, and 9,072 families living in the parish. The population density was 66 people per square mile. The racial makeup of the parish was 79.3% White, 15.2% African American, 0.5% Native American, 0.7% Asian, 0.1% Pacific Islander, 2.2% from other races, and 2.1% from two or more races. Hispanic or Latino of any race were 6.3% of the population.
The median income for a household in the parish was $41,922, and the median income for a family was $50,945. The per capita income for the parish was $20,845. About 14.3% of families and 17.7% of the population were below the poverty line, including 25.2% of those under age 18 and 11.2% of those age 65 or over.
Common Questions
What is the Total Population of St. Bernard Parish?
Total Population of St. Bernard Parish is 44,038.
What is the Total Male Population of St. Bernard Parish?
Total Male Population of St. Bernard Parish is 21,711.
What is the Total Female Population of St. Bernard Parish?
Total Female Population of St. Bernard Parish is 22,327.
What is the Ratio of Males per 100 Females in St. Bernard Parish?
There are 97.24 Males per 100 Females in St. Bernard Parish.
What is the Ratio of Females per 100 Males in St. Bernard Parish?
There are 102.84 Females per 100 Males in St. Bernard Parish.
What is the Median Population Age in St. Bernard Parish?
Median Population Age in St. Bernard Parish is 35.6 Years.
What is the Average Family Size in St. Bernard Parish
Average Family Size in St. Bernard Parish is 3.4 People.
What is the Average Household Size in St. Bernard Parish
Average Household Size in St. Bernard Parish is 2.8 People.
What is Per Capita Income in St. Bernard Parish?
Per Capita income in St. Bernard Parish is $28,451.
What is the Median Family Income in St. Bernard Parish?
Median Family Income in St. Bernard Parish is $66,964.
What is the Median Household income in St. Bernard Parish?
Median Household Income in St. Bernard Parish is $55,857.
What is Income or Wage Gap in St. Bernard Parish?
Income or Wage Gap in St. Bernard Parish is 30.7%.
Women in St. Bernard Parish earn 69.3 cents for every dollar earned by a man.
What is Family Income Deficit in St. Bernard Parish?
Family Income Deficit in St. Bernard Parish is $11,372.
Families that are below poverty line in St. Bernard Parish earn $11,372 less on average than the poverty threshold level.
What is Inequality or Gini Index in St. Bernard Parish?
Inequality or Gini Index in St. Bernard Parish is 0.48.
How Large is the Labor Force in St. Bernard Parish?
There are 20,538 People in the Labor Forcein in St. Bernard Parish.
What is the Percentage of People in the Labor Force in St. Bernard Parish?
60.5% of People are in the Labor Force in St. Bernard Parish.
What is the Unemployment Rate in St. Bernard Parish?
Unemployment Rate in St. Bernard Parish is 8.0%.