Sabine Parish, LA
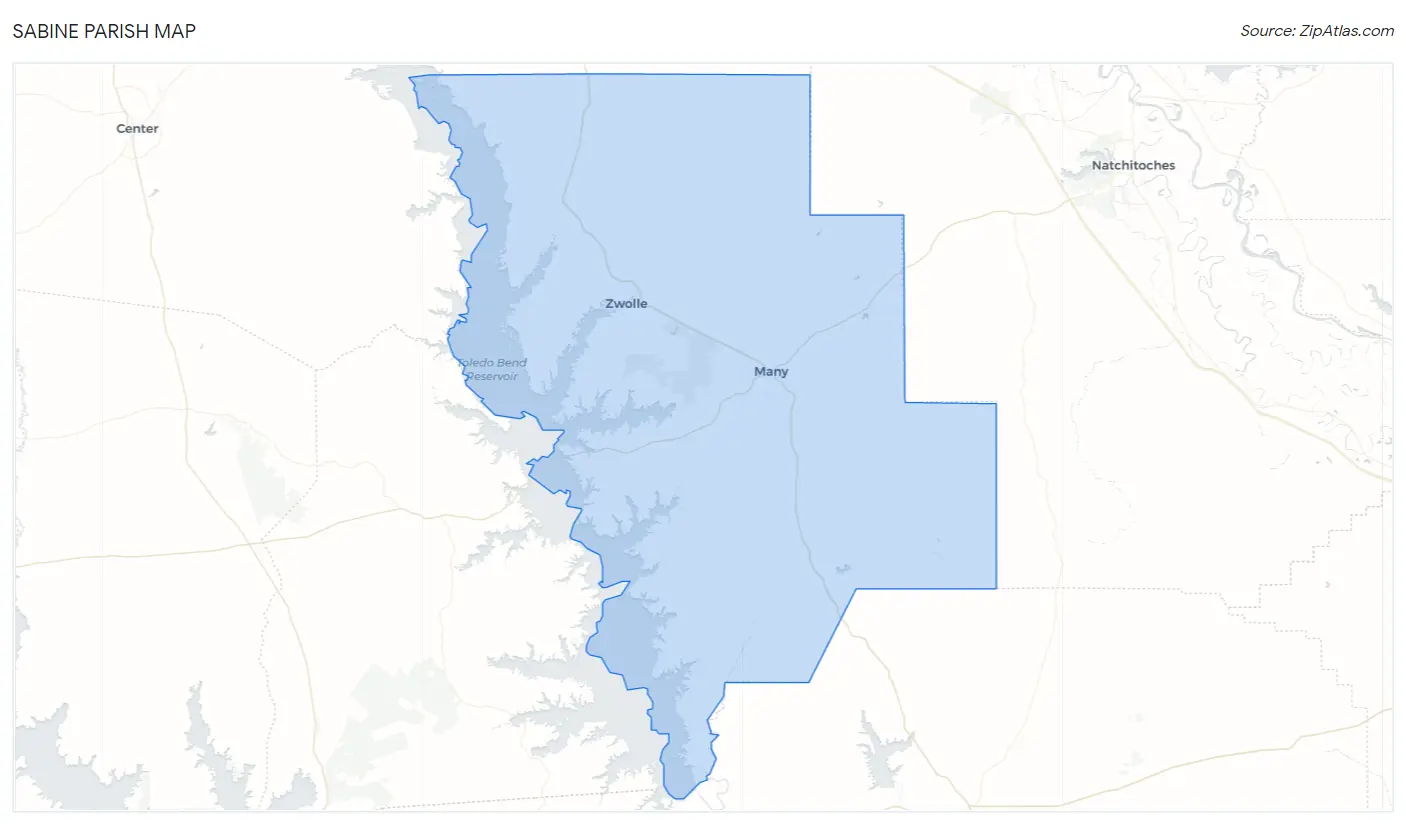
Sabine Parish Map
Sabine Parish Overview
22,209
TOTAL POPULATION
11,048
MALE POPULATION
11,161
FEMALE POPULATION
98.99
MALES / 100 FEMALES
101.02
FEMALES / 100 MALES
41.1
MEDIAN AGE
3.3
AVG FAMILY SIZE
2.6
AVG HOUSEHOLD SIZE
$24,911
PER CAPITA INCOME
$57,847
AVG FAMILY INCOME
$40,777
AVG HOUSEHOLD INCOME
55.5%
WAGE / INCOME GAP [ % ]
44.5¢/ $1
WAGE / INCOME GAP [ $ ]
$11,851
FAMILY INCOME DEFICIT
0.49
INEQUALITY / GINI INDEX
7,909
LABOR FORCE [ PEOPLE ]
44.7%
PERCENT IN LABOR FORCE
7.5%
UNEMPLOYMENT RATE
Sabine Parish Area Codes
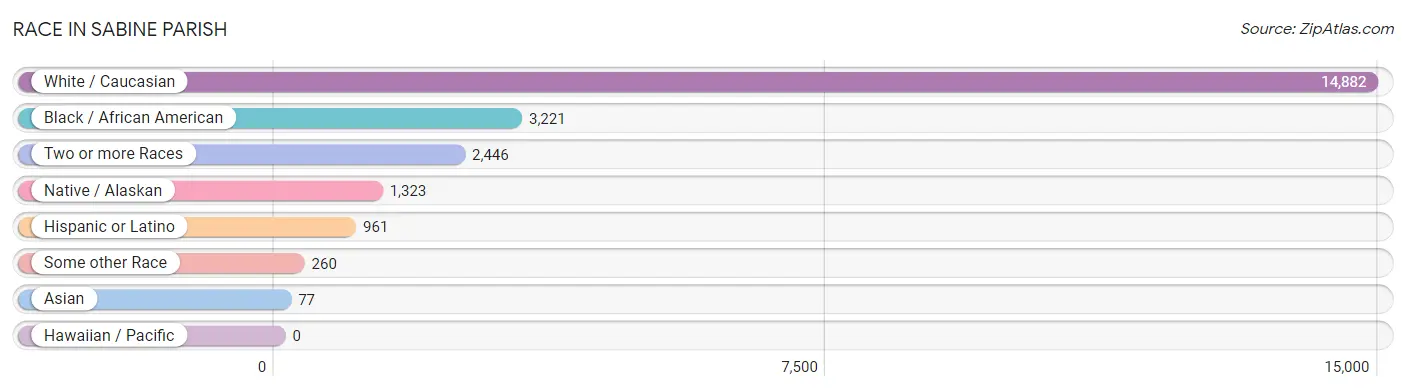
Race in Sabine Parish
The most populous races in Sabine Parish are White / Caucasian (14,882 | 67.0%), Black / African American (3,221 | 14.5%), and Two or more Races (2,446 | 11.0%).
| Race | # Population | % Population |
| Asian | 77 | 0.4% |
| Black / African American | 3,221 | 14.5% |
| Hawaiian / Pacific | 0 | 0.0% |
| Hispanic or Latino | 961 | 4.3% |
| Native / Alaskan | 1,323 | 6.0% |
| White / Caucasian | 14,882 | 67.0% |
| Two or more Races | 2,446 | 11.0% |
| Some other Race | 260 | 1.2% |
| Total | 22,209 | 100.0% |
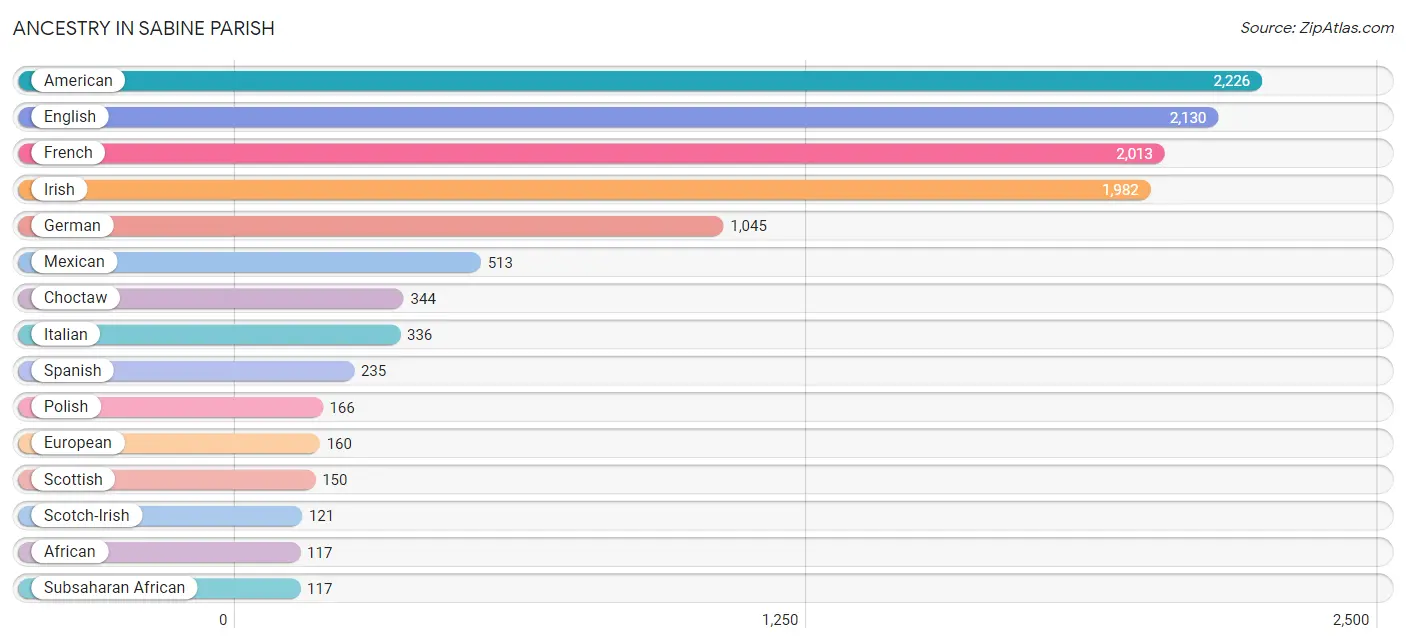
Ancestry in Sabine Parish
The most populous ancestries reported in Sabine Parish are American (2,226 | 10.0%), English (2,130 | 9.6%), French (2,013 | 9.1%), Irish (1,982 | 8.9%), and German (1,045 | 4.7%), together accounting for 42.3% of all Sabine Parish residents.
| Ancestry | # Population | % Population |
| African | 117 | 0.5% |
| American | 2,226 | 10.0% |
| Apache | 28 | 0.1% |
| Arab | 29 | 0.1% |
| Argentinean | 6 | 0.0% |
| Belgian | 3 | 0.0% |
| Bhutanese | 21 | 0.1% |
| Blackfeet | 6 | 0.0% |
| Brazilian | 1 | 0.0% |
| British | 11 | 0.1% |
| Burmese | 1 | 0.0% |
| Cajun | 58 | 0.3% |
| Canadian | 25 | 0.1% |
| Central American | 25 | 0.1% |
| Cherokee | 96 | 0.4% |
| Cheyenne | 5 | 0.0% |
| Choctaw | 344 | 1.5% |
| Comanche | 2 | 0.0% |
| Costa Rican | 13 | 0.1% |
| Croatian | 12 | 0.1% |
| Cuban | 44 | 0.2% |
| Czech | 5 | 0.0% |
| Czechoslovakian | 3 | 0.0% |
| Danish | 9 | 0.0% |
| Dutch | 99 | 0.4% |
| Eastern European | 61 | 0.3% |
| English | 2,130 | 9.6% |
| European | 160 | 0.7% |
| Finnish | 2 | 0.0% |
| French | 2,013 | 9.1% |
| French American Indian | 4 | 0.0% |
| French Canadian | 77 | 0.4% |
| German | 1,045 | 4.7% |
| German Russian | 2 | 0.0% |
| Greek | 11 | 0.1% |
| Guamanian / Chamorro | 5 | 0.0% |
| Guatemalan | 5 | 0.0% |
| Honduran | 2 | 0.0% |
| Houma | 35 | 0.2% |
| Hungarian | 23 | 0.1% |
| Indian (Asian) | 20 | 0.1% |
| Irish | 1,982 | 8.9% |
| Israeli | 54 | 0.2% |
| Italian | 336 | 1.5% |
| Korean | 11 | 0.1% |
| Laotian | 4 | 0.0% |
| Mexican | 513 | 2.3% |
| Mexican American Indian | 15 | 0.1% |
| Navajo | 6 | 0.0% |
| Northern European | 7 | 0.0% |
| Norwegian | 11 | 0.1% |
| Pakistani | 74 | 0.3% |
| Panamanian | 5 | 0.0% |
| Peruvian | 2 | 0.0% |
| Polish | 166 | 0.7% |
| Portuguese | 4 | 0.0% |
| Scandinavian | 36 | 0.2% |
| Scotch-Irish | 121 | 0.5% |
| Scottish | 150 | 0.7% |
| South American | 8 | 0.0% |
| Spaniard | 80 | 0.4% |
| Spanish | 235 | 1.1% |
| Spanish American Indian | 2 | 0.0% |
| Sri Lankan | 31 | 0.1% |
| Subsaharan African | 117 | 0.5% |
| Swedish | 22 | 0.1% |
| Swiss | 28 | 0.1% |
| Thai | 12 | 0.1% |
| Welsh | 35 | 0.2% |
| Yugoslavian | 9 | 0.0% | View All 70 Rows |
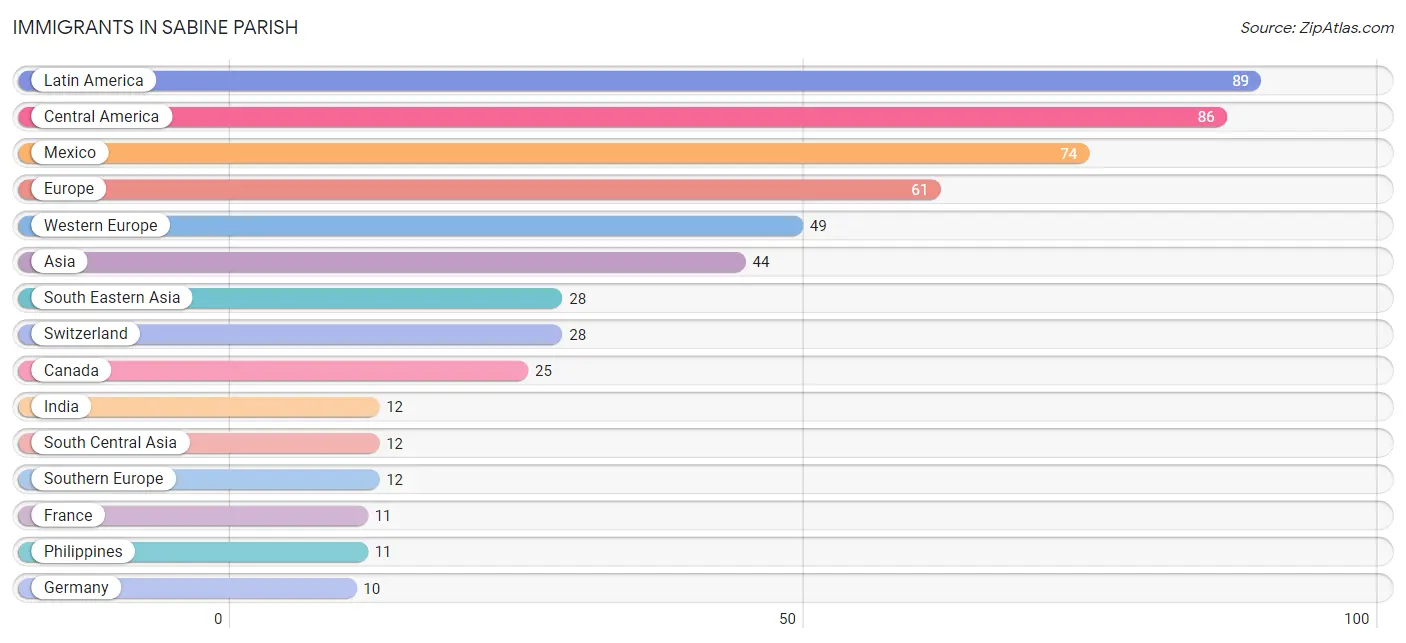
Immigrants in Sabine Parish
The most numerous immigrant groups reported in Sabine Parish came from Latin America (89 | 0.4%), Central America (86 | 0.4%), Mexico (74 | 0.3%), Europe (61 | 0.3%), and Western Europe (49 | 0.2%), together accounting for 1.6% of all Sabine Parish residents.
| Immigration Origin | # Population | % Population |
| Asia | 44 | 0.2% |
| Brazil | 1 | 0.0% |
| Canada | 25 | 0.1% |
| Central America | 86 | 0.4% |
| China | 3 | 0.0% |
| Eastern Asia | 4 | 0.0% |
| Europe | 61 | 0.3% |
| France | 11 | 0.1% |
| Germany | 10 | 0.1% |
| Guatemala | 5 | 0.0% |
| Honduras | 2 | 0.0% |
| India | 12 | 0.1% |
| Indonesia | 4 | 0.0% |
| Italy | 7 | 0.0% |
| Korea | 1 | 0.0% |
| Latin America | 89 | 0.4% |
| Mexico | 74 | 0.3% |
| Panama | 5 | 0.0% |
| Peru | 2 | 0.0% |
| Philippines | 11 | 0.1% |
| South America | 3 | 0.0% |
| South Central Asia | 12 | 0.1% |
| South Eastern Asia | 28 | 0.1% |
| Southern Europe | 12 | 0.1% |
| Spain | 5 | 0.0% |
| Switzerland | 28 | 0.1% |
| Thailand | 3 | 0.0% |
| Vietnam | 10 | 0.1% |
| Western Europe | 49 | 0.2% | View All 29 Rows |
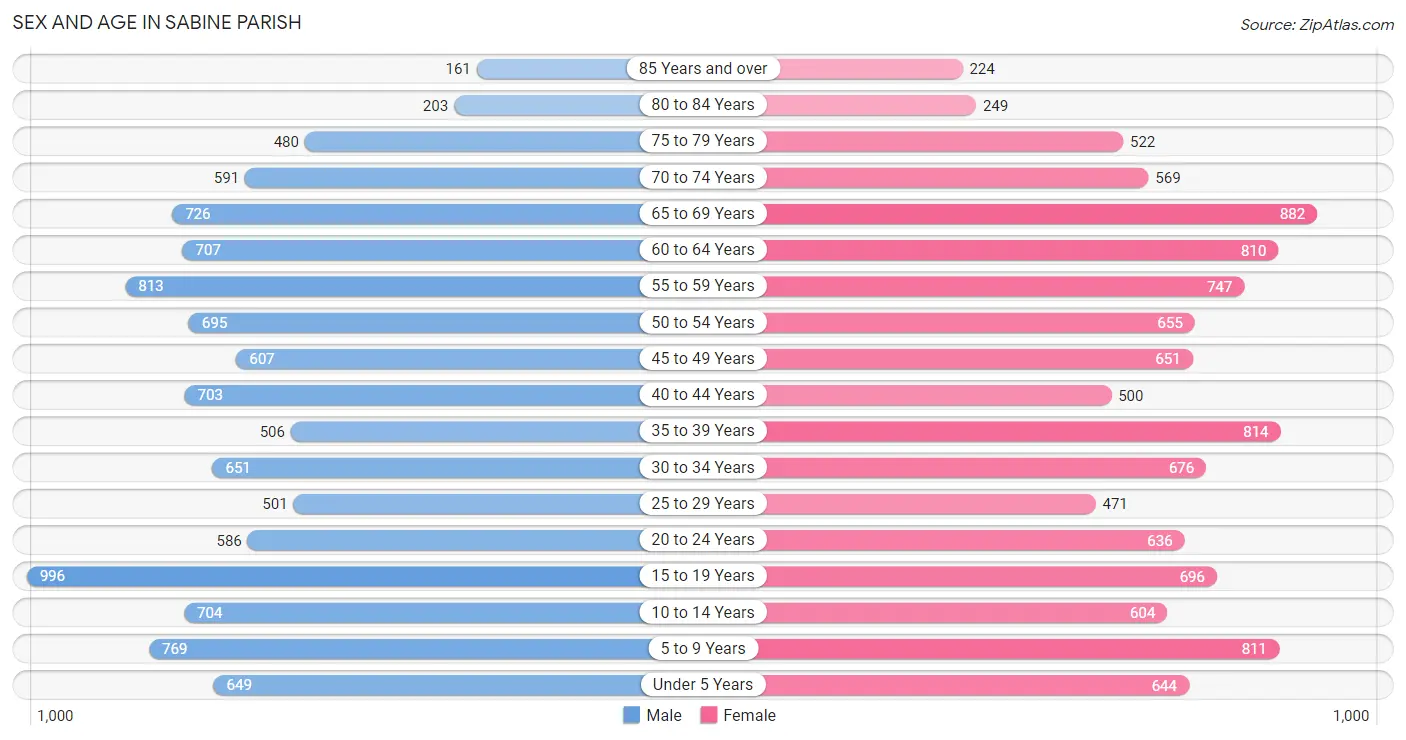
Sex and Age in Sabine Parish
Sex and Age in Sabine Parish
The most populous age groups in Sabine Parish are 15 to 19 Years (996 | 9.0%) for men and 65 to 69 Years (882 | 7.9%) for women.
| Age Bracket | Male | Female |
| Under 5 Years | 649 (5.9%) | 644 (5.8%) |
| 5 to 9 Years | 769 (7.0%) | 811 (7.3%) |
| 10 to 14 Years | 704 (6.4%) | 604 (5.4%) |
| 15 to 19 Years | 996 (9.0%) | 696 (6.2%) |
| 20 to 24 Years | 586 (5.3%) | 636 (5.7%) |
| 25 to 29 Years | 501 (4.5%) | 471 (4.2%) |
| 30 to 34 Years | 651 (5.9%) | 676 (6.1%) |
| 35 to 39 Years | 506 (4.6%) | 814 (7.3%) |
| 40 to 44 Years | 703 (6.4%) | 500 (4.5%) |
| 45 to 49 Years | 607 (5.5%) | 651 (5.8%) |
| 50 to 54 Years | 695 (6.3%) | 655 (5.9%) |
| 55 to 59 Years | 813 (7.4%) | 747 (6.7%) |
| 60 to 64 Years | 707 (6.4%) | 810 (7.3%) |
| 65 to 69 Years | 726 (6.6%) | 882 (7.9%) |
| 70 to 74 Years | 591 (5.3%) | 569 (5.1%) |
| 75 to 79 Years | 480 (4.3%) | 522 (4.7%) |
| 80 to 84 Years | 203 (1.8%) | 249 (2.2%) |
| 85 Years and over | 161 (1.5%) | 224 (2.0%) |
| Total | 11,048 (100.0%) | 11,161 (100.0%) |
Families and Households in Sabine Parish
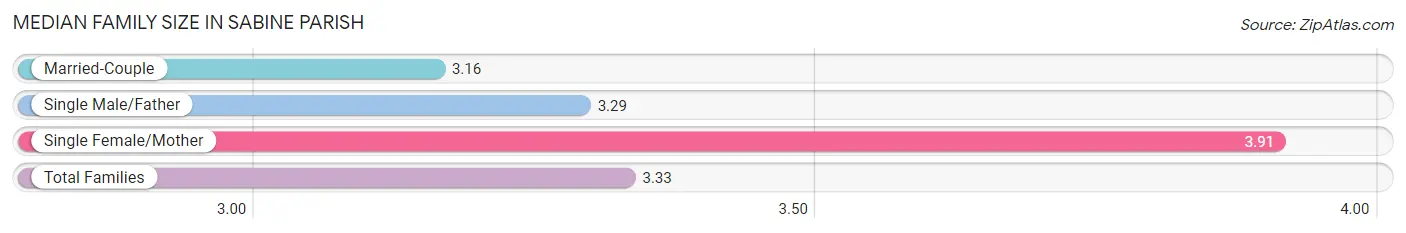
Median Family Size in Sabine Parish
The median family size in Sabine Parish is 3.33 persons per family, with single female/mother families (1,137 | 21.5%) accounting for the largest median family size of 3.91 persons per family. On the other hand, married-couple families (3,728 | 70.5%) represent the smallest median family size with 3.16 persons per family.
| Family Type | # Families | Family Size |
| Married-Couple | 3,728 (70.5%) | 3.16 |
| Single Male/Father | 427 (8.1%) | 3.29 |
| Single Female/Mother | 1,137 (21.5%) | 3.91 |
| Total Families | 5,292 (100.0%) | 3.33 |
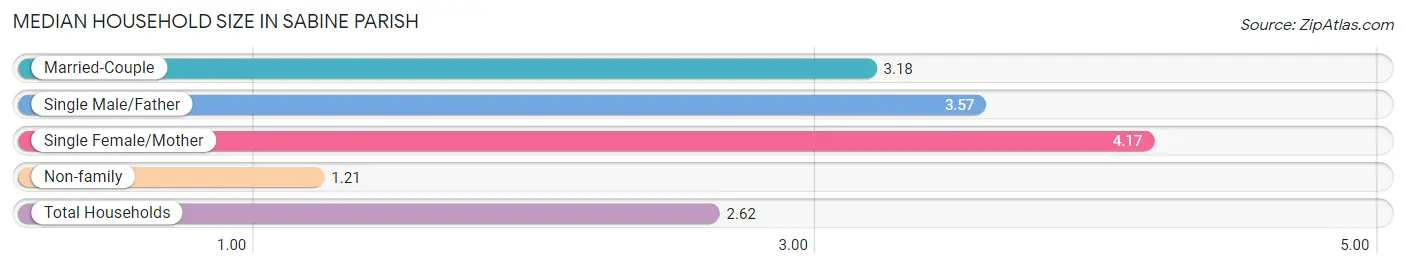
Median Household Size in Sabine Parish
The median household size in Sabine Parish is 2.62 persons per household, with single female/mother households (1,137 | 13.6%) accounting for the largest median household size of 4.17 persons per household. non-family households (3,047 | 36.5%) represent the smallest median household size with 1.21 persons per household.
| Household Type | # Households | Household Size |
| Married-Couple | 3,728 (44.7%) | 3.18 |
| Single Male/Father | 427 (5.1%) | 3.57 |
| Single Female/Mother | 1,137 (13.6%) | 4.17 |
| Non-family | 3,047 (36.5%) | 1.21 |
| Total Households | 8,339 (100.0%) | 2.62 |
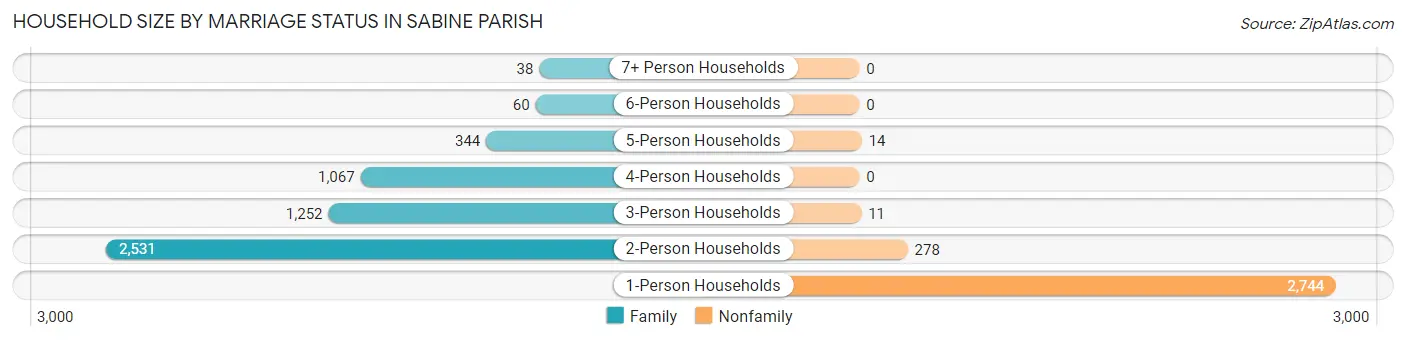
Household Size by Marriage Status in Sabine Parish
Out of a total of 8,339 households in Sabine Parish, 5,292 (63.5%) are family households, while 3,047 (36.5%) are nonfamily households. The most numerous type of family households are 2-person households, comprising 2,531, and the most common type of nonfamily households are 1-person households, comprising 2,744.
| Household Size | Family Households | Nonfamily Households |
| 1-Person Households | - | 2,744 (32.9%) |
| 2-Person Households | 2,531 (30.3%) | 278 (3.3%) |
| 3-Person Households | 1,252 (15.0%) | 11 (0.1%) |
| 4-Person Households | 1,067 (12.8%) | 0 (0.0%) |
| 5-Person Households | 344 (4.1%) | 14 (0.2%) |
| 6-Person Households | 60 (0.7%) | 0 (0.0%) |
| 7+ Person Households | 38 (0.5%) | 0 (0.0%) |
| Total | 5,292 (63.5%) | 3,047 (36.5%) |
Female Fertility in Sabine Parish
Fertility by Age in Sabine Parish
Average fertility rate in Sabine Parish is 58.0 births per 1,000 women. Women in the age bracket of 20 to 34 years have the highest fertility rate with 75.0 births per 1,000 women. Women in the age bracket of 20 to 34 years acount for 50.9% of all women with births.
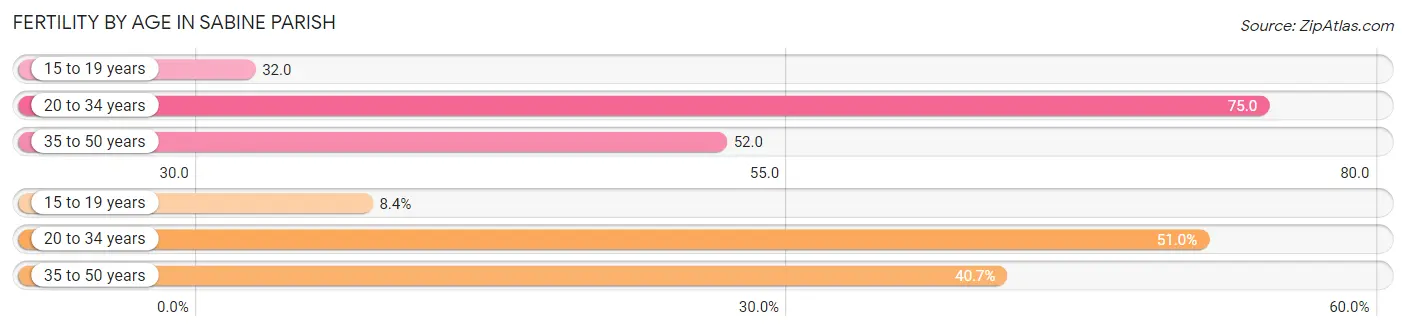
| Age Bracket | Women with Births | Births / 1,000 Women |
| 15 to 19 years | 22 (8.4%) | 32.0 |
| 20 to 34 years | 134 (50.9%) | 75.0 |
| 35 to 50 years | 107 (40.7%) | 52.0 |
| Total | 263 (100.0%) | 58.0 |
Fertility by Age by Marriage Status in Sabine Parish
25.5% of women with births (263) in Sabine Parish are married. The highest percentage of unmarried women with births falls into 15 to 19 years age bracket with 100.0% of them unmarried at the time of birth, while the lowest percentage of unmarried women with births belong to 20 to 34 years age bracket with 70.2% of them unmarried.
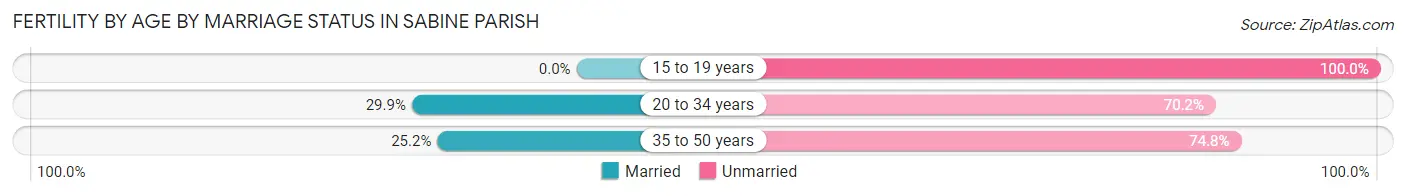
| Age Bracket | Married | Unmarried |
| 15 to 19 years | 0 (0.0%) | 22 (100.0%) |
| 20 to 34 years | 40 (29.8%) | 94 (70.2%) |
| 35 to 50 years | 27 (25.2%) | 80 (74.8%) |
| Total | 67 (25.5%) | 196 (74.5%) |
Fertility by Education in Sabine Parish
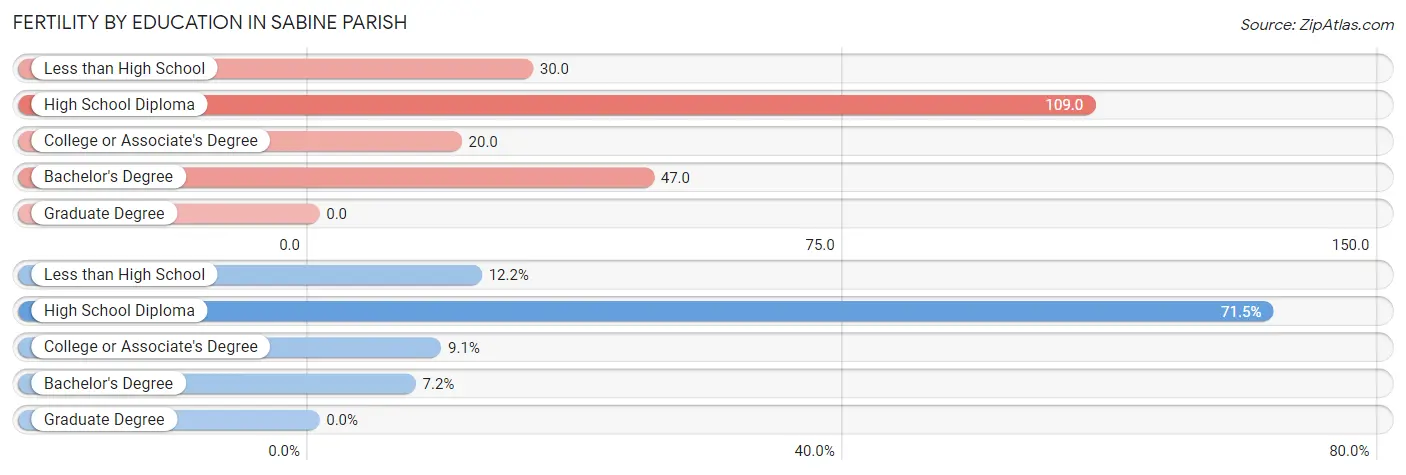
| Educational Attainment | Women with Births | Births / 1,000 Women |
| Less than High School | 32 (12.2%) | 30.0 |
| High School Diploma | 188 (71.5%) | 109.0 |
| College or Associate's Degree | 24 (9.1%) | 20.0 |
| Bachelor's Degree | 19 (7.2%) | 47.0 |
| Graduate Degree | 0 (0.0%) | 0.0 |
| Total | 263 (100.0%) | 58.0 |
Fertility by Education by Marriage Status in Sabine Parish
74.5% of women with births in Sabine Parish are unmarried. Women with the educational attainment of bachelor's degree are most likely to be married with 100.0% of them married at childbirth, while women with the educational attainment of high school diploma are least likely to be married with 84.6% of them unmarried at childbirth.
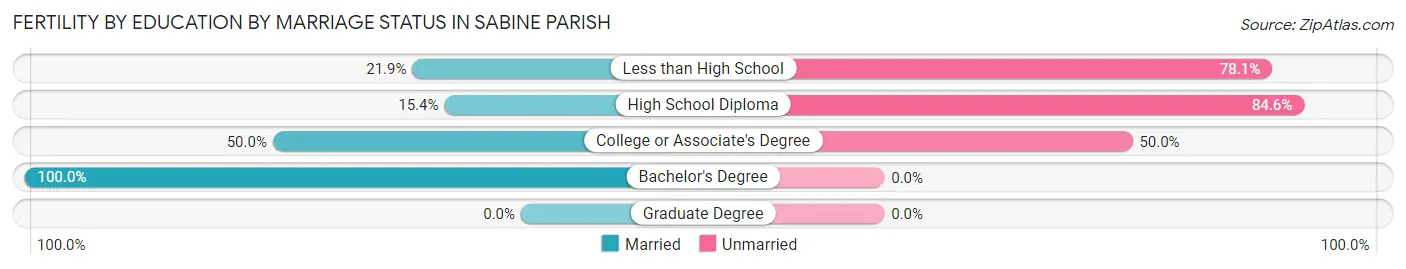
| Educational Attainment | Married | Unmarried |
| Less than High School | 7 (21.9%) | 25 (78.1%) |
| High School Diploma | 29 (15.4%) | 159 (84.6%) |
| College or Associate's Degree | 12 (50.0%) | 12 (50.0%) |
| Bachelor's Degree | 19 (100.0%) | 0 (0.0%) |
| Graduate Degree | 0 (0.0%) | 0 (0.0%) |
| Total | 67 (25.5%) | 196 (74.5%) |
Income in Sabine Parish
Income Overview in Sabine Parish
Per Capita Income in Sabine Parish is $24,911, while median incomes of families and households are $57,847 and $40,777 respectively.
| Characteristic | Number | Measure |
| Per Capita Income | 22,209 | $24,911 |
| Median Family Income | 5,292 | $57,847 |
| Mean Family Income | 5,292 | $74,127 |
| Median Household Income | 8,339 | $40,777 |
| Mean Household Income | 8,339 | $60,497 |
| Income Deficit | 5,292 | $11,851 |
| Wage / Income Gap (%) | 22,209 | 55.51% |
| Wage / Income Gap ($) | 22,209 | 44.49¢ per $1 |
| Gini / Inequality Index | 22,209 | 0.49 |
Earnings by Sex in Sabine Parish
Average Earnings in Sabine Parish are $32,835, $46,233 for men and $20,569 for women, a difference of 55.5%.
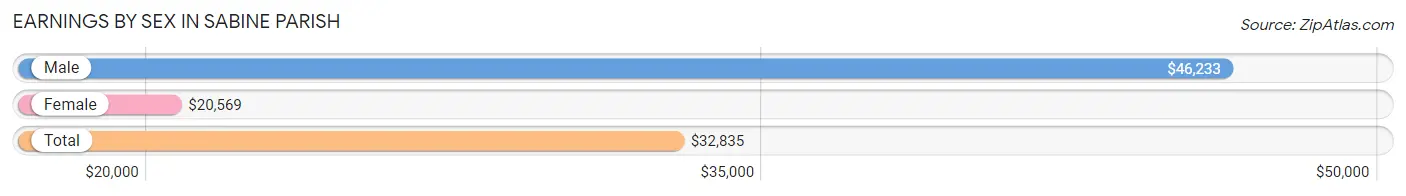
| Sex | Number | Average Earnings |
| Male | 4,736 (58.1%) | $46,233 |
| Female | 3,410 (41.9%) | $20,569 |
| Total | 8,146 (100.0%) | $32,835 |
Earnings by Sex by Income Bracket in Sabine Parish
The most common earnings brackets in Sabine Parish are $100,000+ for men (822 | 17.4%) and $7,500 to $9,999 for women (364 | 10.7%).
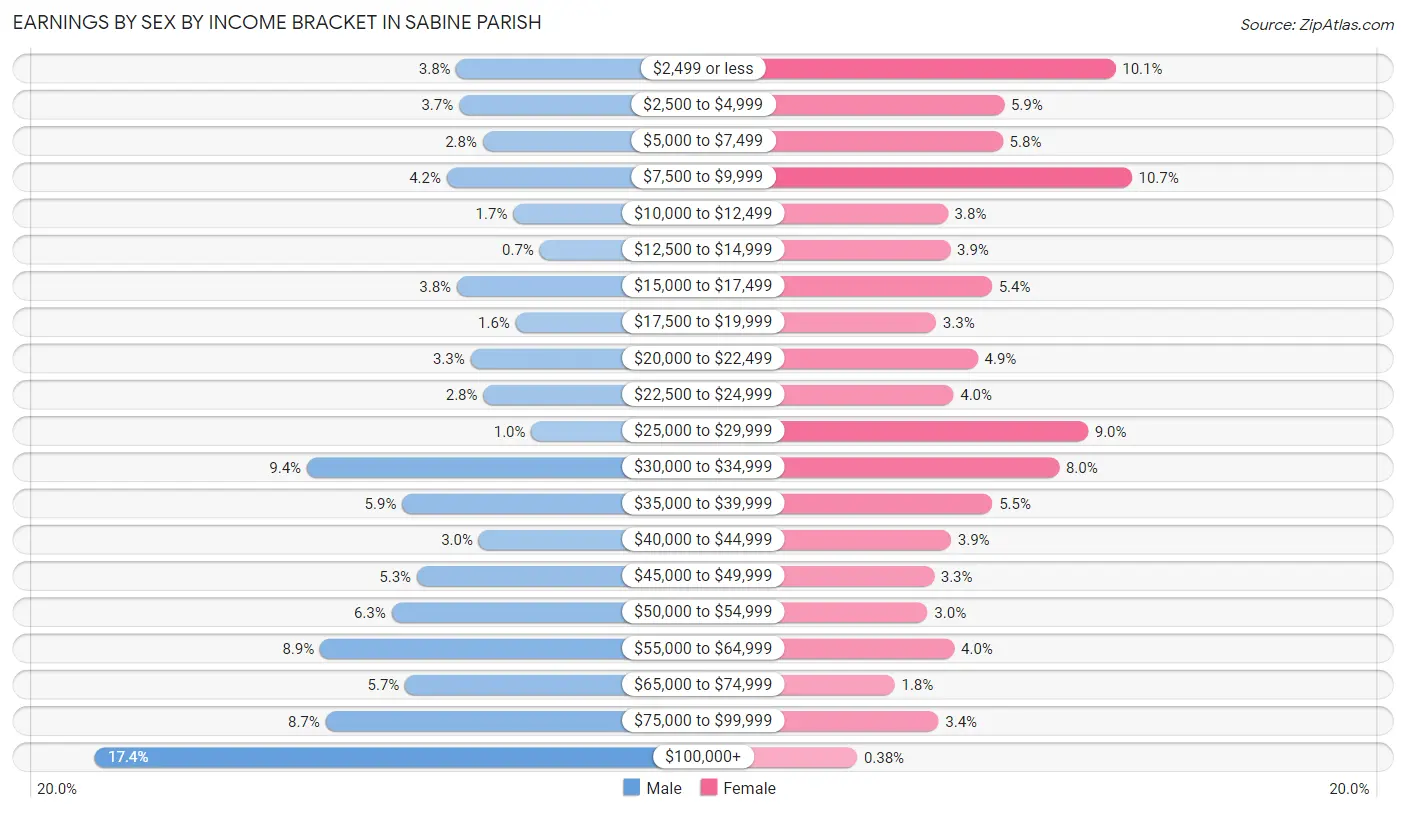
| Income | Male | Female |
| $2,499 or less | 181 (3.8%) | 343 (10.1%) |
| $2,500 to $4,999 | 176 (3.7%) | 201 (5.9%) |
| $5,000 to $7,499 | 134 (2.8%) | 199 (5.8%) |
| $7,500 to $9,999 | 198 (4.2%) | 364 (10.7%) |
| $10,000 to $12,499 | 80 (1.7%) | 129 (3.8%) |
| $12,500 to $14,999 | 33 (0.7%) | 132 (3.9%) |
| $15,000 to $17,499 | 180 (3.8%) | 185 (5.4%) |
| $17,500 to $19,999 | 76 (1.6%) | 114 (3.3%) |
| $20,000 to $22,499 | 156 (3.3%) | 167 (4.9%) |
| $22,500 to $24,999 | 133 (2.8%) | 136 (4.0%) |
| $25,000 to $29,999 | 48 (1.0%) | 308 (9.0%) |
| $30,000 to $34,999 | 446 (9.4%) | 271 (8.0%) |
| $35,000 to $39,999 | 277 (5.9%) | 186 (5.4%) |
| $40,000 to $44,999 | 141 (3.0%) | 133 (3.9%) |
| $45,000 to $49,999 | 251 (5.3%) | 111 (3.3%) |
| $50,000 to $54,999 | 296 (6.2%) | 103 (3.0%) |
| $55,000 to $64,999 | 423 (8.9%) | 137 (4.0%) |
| $65,000 to $74,999 | 272 (5.7%) | 61 (1.8%) |
| $75,000 to $99,999 | 413 (8.7%) | 117 (3.4%) |
| $100,000+ | 822 (17.4%) | 13 (0.4%) |
| Total | 4,736 (100.0%) | 3,410 (100.0%) |
Earnings by Sex by Educational Attainment in Sabine Parish
Average earnings in Sabine Parish are $51,361 for men and $23,330 for women, a difference of 54.6%. Men with an educational attainment of graduate degree enjoy the highest average annual earnings of $72,661, while those with less than high school education earn the least with $38,365. Women with an educational attainment of graduate degree earn the most with the average annual earnings of $49,063, while those with less than high school education have the smallest earnings of $12,609.
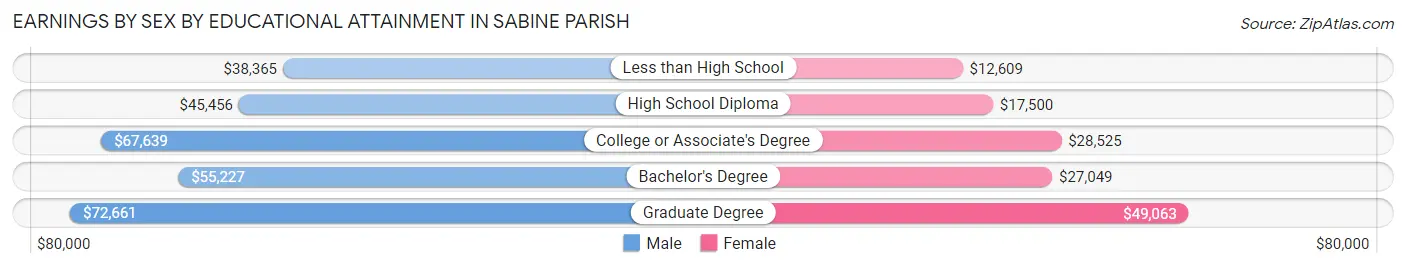
| Educational Attainment | Male Income | Female Income |
| Less than High School | $38,365 | $12,609 |
| High School Diploma | $45,456 | $17,500 |
| College or Associate's Degree | $67,639 | $28,525 |
| Bachelor's Degree | $55,227 | $27,049 |
| Graduate Degree | $72,661 | $49,063 |
| Total | $51,361 | $23,330 |
Family Income in Sabine Parish
Family Income Brackets in Sabine Parish
According to the Sabine Parish family income data, there are 984 families falling into the $50,000 to $74,999 income range, which is the most common income bracket and makes up 18.6% of all families. Conversely, the $10,000 to $14,999 income bracket is the least frequent group with only 228 families (4.3%) belonging to this category.
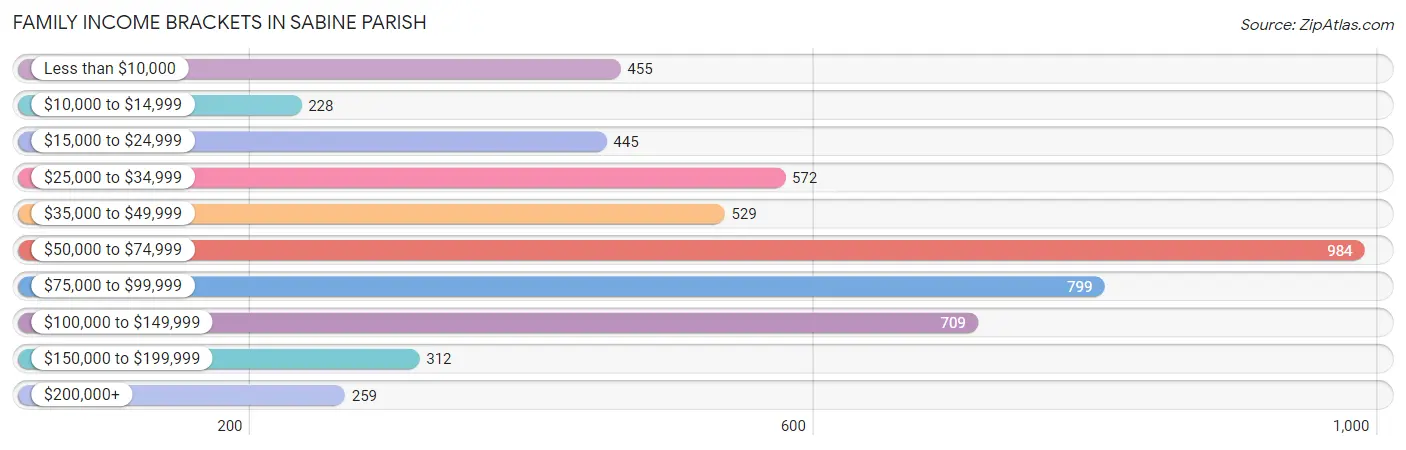
| Income Bracket | # Families | % Families |
| Less than $10,000 | 455 | 8.6% |
| $10,000 to $14,999 | 228 | 4.3% |
| $15,000 to $24,999 | 445 | 8.4% |
| $25,000 to $34,999 | 572 | 10.8% |
| $35,000 to $49,999 | 529 | 10.0% |
| $50,000 to $74,999 | 984 | 18.6% |
| $75,000 to $99,999 | 799 | 15.1% |
| $100,000 to $149,999 | 709 | 13.4% |
| $150,000 to $199,999 | 312 | 5.9% |
| $200,000+ | 259 | 4.9% |
Family Income by Famaliy Size in Sabine Parish
7+ person families (34 | 0.6%) account for the highest median family income in Sabine Parish with $129,167 per family, while 2-person families (2,651 | 50.1%) have the highest median income of $25,806 per family member.
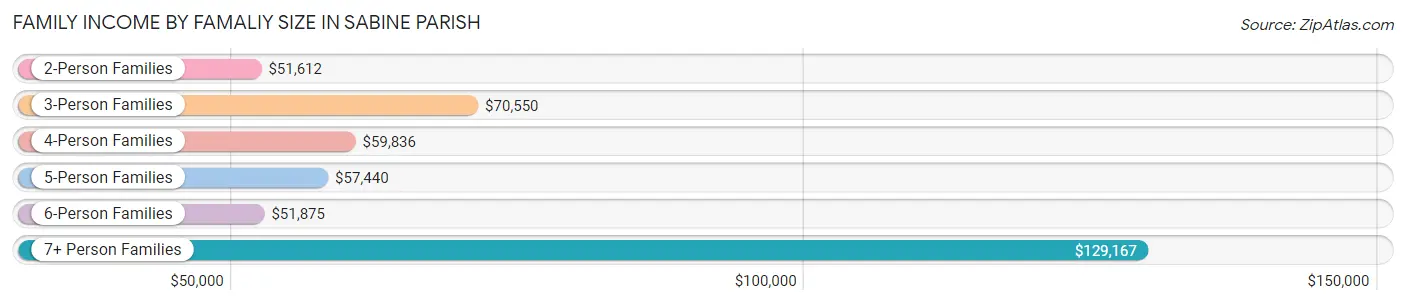
| Income Bracket | # Families | Median Income |
| 2-Person Families | 2,651 (50.1%) | $51,612 |
| 3-Person Families | 1,319 (24.9%) | $70,550 |
| 4-Person Families | 927 (17.5%) | $59,836 |
| 5-Person Families | 305 (5.8%) | $57,440 |
| 6-Person Families | 56 (1.1%) | $51,875 |
| 7+ Person Families | 34 (0.6%) | $129,167 |
| Total | 5,292 (100.0%) | $57,847 |
Family Income by Number of Earners in Sabine Parish
The median family income in Sabine Parish is $57,847, with families comprising 3+ earners (248) having the highest median family income of $141,667, while families with no earners (1,597) have the lowest median family income of $30,159, accounting for 4.7% and 30.2% of families, respectively.
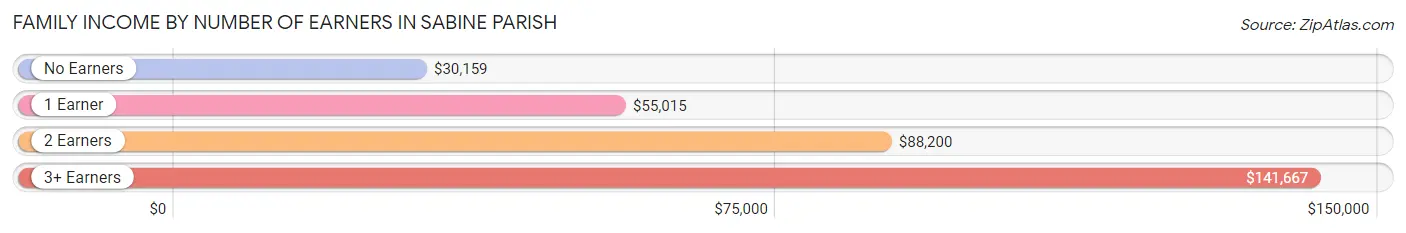
| Number of Earners | # Families | Median Income |
| No Earners | 1,597 (30.2%) | $30,159 |
| 1 Earner | 1,941 (36.7%) | $55,015 |
| 2 Earners | 1,506 (28.5%) | $88,200 |
| 3+ Earners | 248 (4.7%) | $141,667 |
| Total | 5,292 (100.0%) | $57,847 |
Household Income in Sabine Parish
Household Income Brackets in Sabine Parish
With 1,368 households falling in the category, the $50,000 to $74,999 income range is the most frequent in Sabine Parish, accounting for 16.4% of all households. In contrast, only 292 households (3.5%) fall into the $200,000+ income bracket, making it the least populous group.
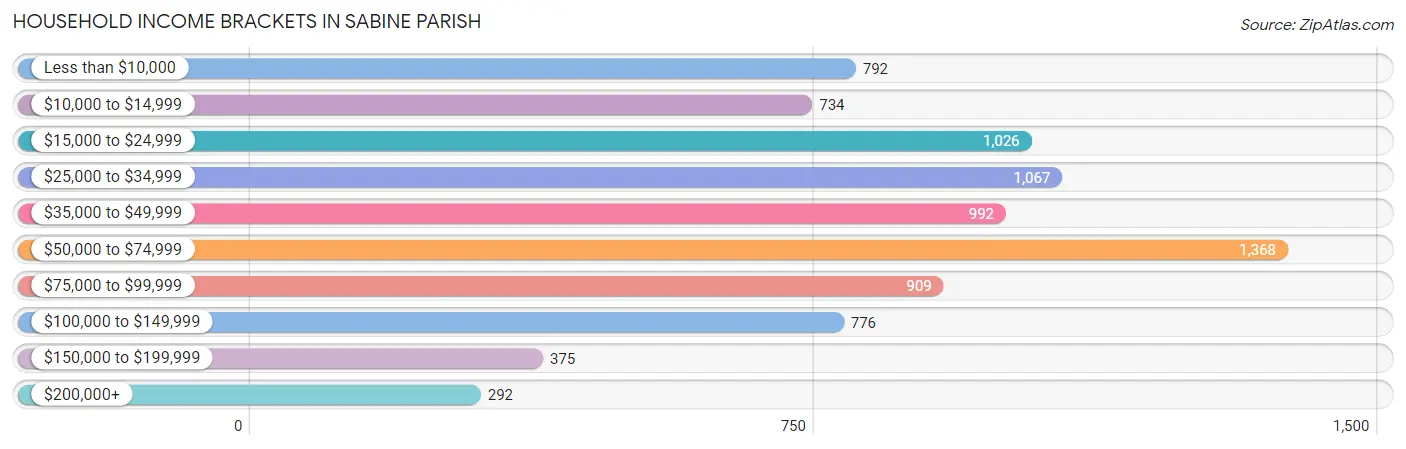
| Income Bracket | # Households | % Households |
| Less than $10,000 | 792 | 9.5% |
| $10,000 to $14,999 | 734 | 8.8% |
| $15,000 to $24,999 | 1,026 | 12.3% |
| $25,000 to $34,999 | 1,067 | 12.8% |
| $35,000 to $49,999 | 992 | 11.9% |
| $50,000 to $74,999 | 1,368 | 16.4% |
| $75,000 to $99,999 | 909 | 10.9% |
| $100,000 to $149,999 | 776 | 9.3% |
| $150,000 to $199,999 | 375 | 4.5% |
| $200,000+ | 292 | 3.5% |
Household Income by Householder Age in Sabine Parish
The median household income in Sabine Parish is $40,777, with the highest median household income of $46,591 found in the 25 to 44 years age bracket for the primary householder. A total of 2,138 households (25.6%) fall into this category. Meanwhile, the 15 to 24 years age bracket for the primary householder has the lowest median household income of $0, with 263 households (3.2%) in this group.
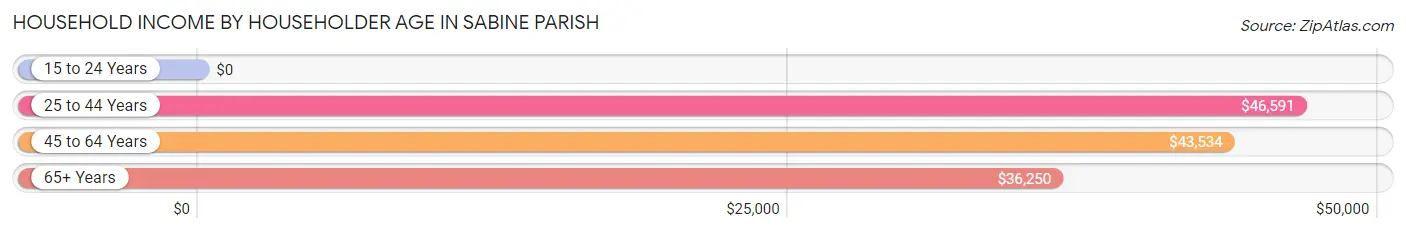
| Income Bracket | # Households | Median Income |
| 15 to 24 Years | 263 (3.2%) | $0 |
| 25 to 44 Years | 2,138 (25.6%) | $46,591 |
| 45 to 64 Years | 3,130 (37.5%) | $43,534 |
| 65+ Years | 2,808 (33.7%) | $36,250 |
| Total | 8,339 (100.0%) | $40,777 |
Poverty in Sabine Parish
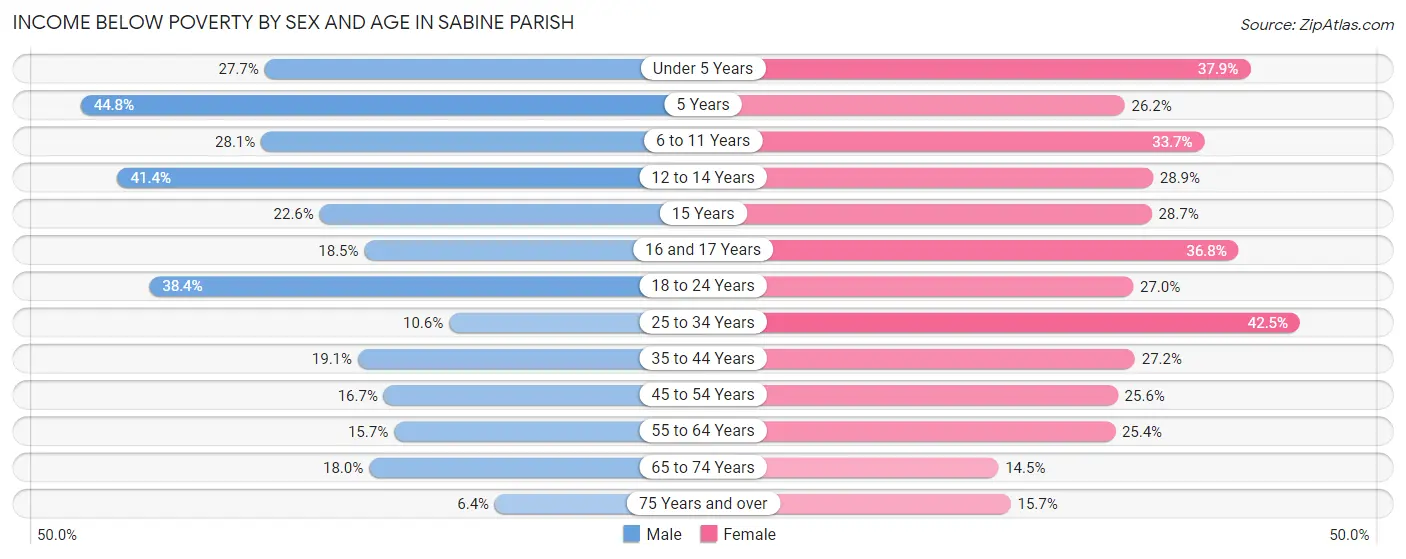
Income Below Poverty by Sex and Age in Sabine Parish
With 20.7% poverty level for males and 27.1% for females among the residents of Sabine Parish, 5 year old males and 25 to 34 year old females are the most vulnerable to poverty, with 60 males (44.8%) and 485 females (42.5%) in their respective age groups living below the poverty level.
| Age Bracket | Male | Female |
| Under 5 Years | 180 (27.7%) | 244 (37.9%) |
| 5 Years | 60 (44.8%) | 37 (26.2%) |
| 6 to 11 Years | 244 (28.1%) | 283 (33.7%) |
| 12 to 14 Years | 194 (41.4%) | 125 (28.9%) |
| 15 Years | 38 (22.6%) | 48 (28.7%) |
| 16 and 17 Years | 75 (18.5%) | 88 (36.8%) |
| 18 to 24 Years | 383 (38.4%) | 243 (27.0%) |
| 25 to 34 Years | 120 (10.6%) | 485 (42.5%) |
| 35 to 44 Years | 225 (19.1%) | 354 (27.2%) |
| 45 to 54 Years | 217 (16.7%) | 332 (25.6%) |
| 55 to 64 Years | 238 (15.7%) | 394 (25.4%) |
| 65 to 74 Years | 229 (18.0%) | 207 (14.5%) |
| 75 Years and over | 51 (6.4%) | 143 (15.7%) |
| Total | 2,254 (20.7%) | 2,983 (27.1%) |
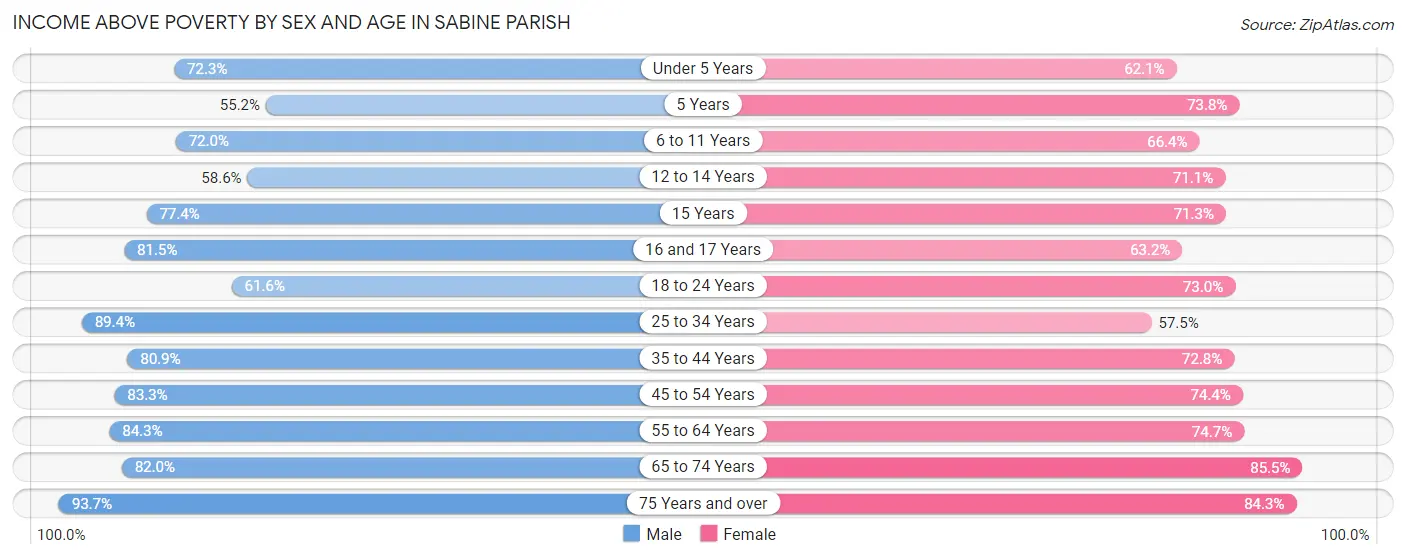
Income Above Poverty by Sex and Age in Sabine Parish
According to the poverty statistics in Sabine Parish, males aged 75 years and over and females aged 65 to 74 years are the age groups that are most secure financially, with 93.6% of males and 85.5% of females in these age groups living above the poverty line.
| Age Bracket | Male | Female |
| Under 5 Years | 469 (72.3%) | 400 (62.1%) |
| 5 Years | 74 (55.2%) | 104 (73.8%) |
| 6 to 11 Years | 626 (72.0%) | 558 (66.3%) |
| 12 to 14 Years | 275 (58.6%) | 308 (71.1%) |
| 15 Years | 130 (77.4%) | 119 (71.3%) |
| 16 and 17 Years | 331 (81.5%) | 151 (63.2%) |
| 18 to 24 Years | 614 (61.6%) | 656 (73.0%) |
| 25 to 34 Years | 1,011 (89.4%) | 656 (57.5%) |
| 35 to 44 Years | 955 (80.9%) | 948 (72.8%) |
| 45 to 54 Years | 1,085 (83.3%) | 965 (74.4%) |
| 55 to 64 Years | 1,276 (84.3%) | 1,160 (74.7%) |
| 65 to 74 Years | 1,041 (82.0%) | 1,219 (85.5%) |
| 75 Years and over | 752 (93.6%) | 770 (84.3%) |
| Total | 8,639 (79.3%) | 8,014 (72.9%) |
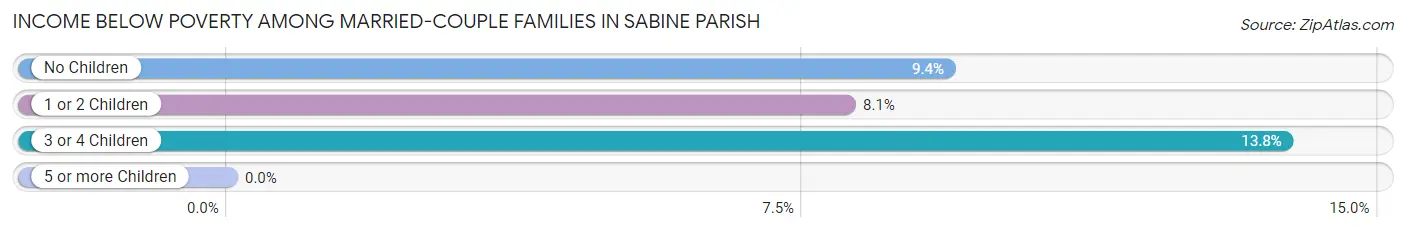
Income Below Poverty Among Married-Couple Families in Sabine Parish
The poverty statistics for married-couple families in Sabine Parish show that 9.1% or 340 of the total 3,728 families live below the poverty line. Families with 3 or 4 children have the highest poverty rate of 13.8%, comprising of 27 families. On the other hand, families with 5 or more children have the lowest poverty rate of 0.0%, which includes 0 families.
| Children | Above Poverty | Below Poverty |
| No Children | 2,012 (90.6%) | 208 (9.4%) |
| 1 or 2 Children | 1,196 (91.9%) | 105 (8.1%) |
| 3 or 4 Children | 169 (86.2%) | 27 (13.8%) |
| 5 or more Children | 11 (100.0%) | 0 (0.0%) |
| Total | 3,388 (90.9%) | 340 (9.1%) |
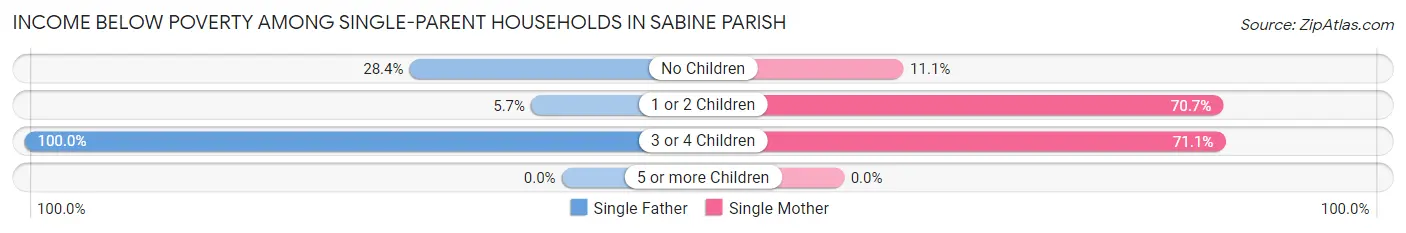
Income Below Poverty Among Single-Parent Households in Sabine Parish
According to the poverty data in Sabine Parish, 17.1% or 73 single-father households and 51.6% or 587 single-mother households are living below the poverty line. Among single-father households, those with 3 or 4 children have the highest poverty rate, with 5 households (100.0%) experiencing poverty. Likewise, among single-mother households, those with 3 or 4 children have the highest poverty rate, with 135 households (71.1%) falling below the poverty line.
| Children | Single Father | Single Mother |
| No Children | 55 (28.3%) | 40 (11.1%) |
| 1 or 2 Children | 13 (5.7%) | 412 (70.7%) |
| 3 or 4 Children | 5 (100.0%) | 135 (71.1%) |
| 5 or more Children | 0 (0.0%) | 0 (0.0%) |
| Total | 73 (17.1%) | 587 (51.6%) |
Income Below Poverty Among Married-Couple vs Single-Parent Households in Sabine Parish
The poverty data for Sabine Parish shows that 340 of the married-couple family households (9.1%) and 660 of the single-parent households (42.2%) are living below the poverty level. Within the married-couple family households, those with 3 or 4 children have the highest poverty rate, with 27 households (13.8%) falling below the poverty line. Among the single-parent households, those with 3 or 4 children have the highest poverty rate, with 140 household (71.8%) living below poverty.
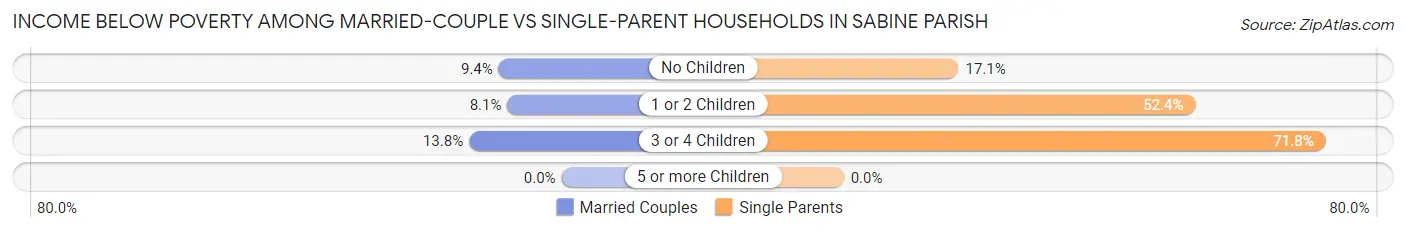
| Children | Married-Couple Families | Single-Parent Households |
| No Children | 208 (9.4%) | 95 (17.1%) |
| 1 or 2 Children | 105 (8.1%) | 425 (52.4%) |
| 3 or 4 Children | 27 (13.8%) | 140 (71.8%) |
| 5 or more Children | 0 (0.0%) | 0 (0.0%) |
| Total | 340 (9.1%) | 660 (42.2%) |
Employment Characteristics in Sabine Parish
Employment by Class of Employer in Sabine Parish
Among the 7,234 employed individuals in Sabine Parish, private company employees (5,181 | 71.6%), local government employees (599 | 8.3%), and state government employees (570 | 7.9%) make up the most common classes of employment.
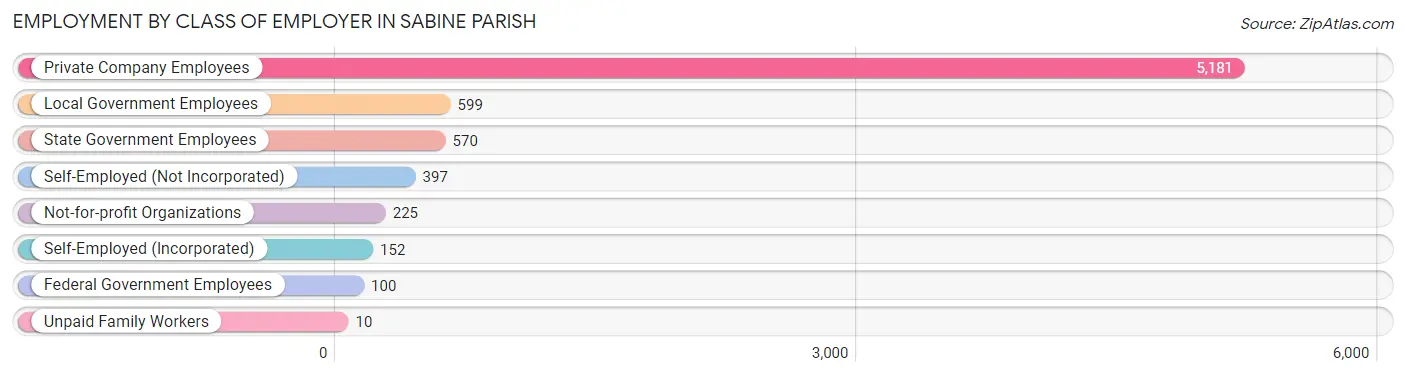
| Employer Class | # Employees | % Employees |
| Private Company Employees | 5,181 | 71.6% |
| Self-Employed (Incorporated) | 152 | 2.1% |
| Self-Employed (Not Incorporated) | 397 | 5.5% |
| Not-for-profit Organizations | 225 | 3.1% |
| Local Government Employees | 599 | 8.3% |
| State Government Employees | 570 | 7.9% |
| Federal Government Employees | 100 | 1.4% |
| Unpaid Family Workers | 10 | 0.1% |
| Total | 7,234 | 100.0% |
Employment Status by Age in Sabine Parish
According to the labor force statistics for Sabine Parish, out of the total population over 16 years of age (17,693), 44.7% or 7,909 individuals are in the labor force, with 7.5% or 593 of them unemployed. The age group with the highest labor force participation rate is 30 to 34 years, with 72.0% or 955 individuals in the labor force. Within the labor force, the 16 to 19 years age range has the highest percentage of unemployed individuals, with 19.2% or 96 of them being unemployed.
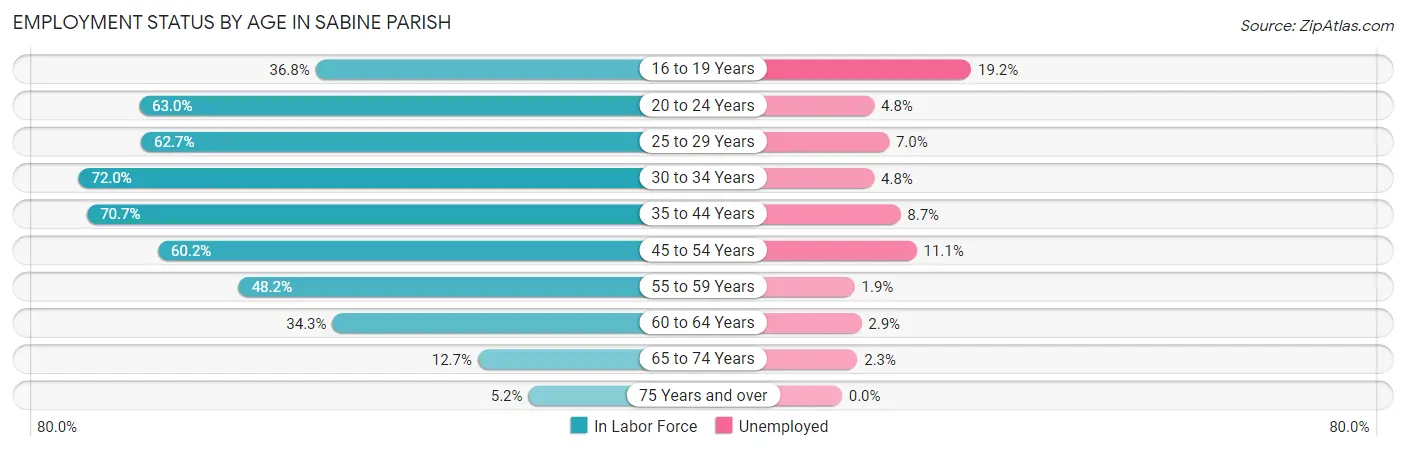
| Age Bracket | In Labor Force | Unemployed |
| 16 to 19 Years | 499 (36.8%) | 96 (19.2%) |
| 20 to 24 Years | 770 (63.0%) | 37 (4.8%) |
| 25 to 29 Years | 609 (62.7%) | 43 (7.0%) |
| 30 to 34 Years | 955 (72.0%) | 46 (4.8%) |
| 35 to 44 Years | 1,784 (70.7%) | 155 (8.7%) |
| 45 to 54 Years | 1,570 (60.2%) | 174 (11.1%) |
| 55 to 59 Years | 752 (48.2%) | 14 (1.9%) |
| 60 to 64 Years | 520 (34.3%) | 15 (2.9%) |
| 65 to 74 Years | 352 (12.7%) | 8 (2.3%) |
| 75 Years and over | 96 (5.2%) | 0 (0.0%) |
| Total | 7,909 (44.7%) | 593 (7.5%) |
Employment Status by Educational Attainment in Sabine Parish
According to labor force statistics for Sabine Parish, 58.9% of individuals (6,189) out of the total population between 25 and 64 years of age (10,507) are in the labor force, with 7.2% or 446 of them being unemployed. The group with the highest labor force participation rate are those with the educational attainment of bachelor's degree or higher, with 74.0% or 1,086 individuals in the labor force. Within the labor force, individuals with less than high school education have the highest percentage of unemployment, with 10.8% or 74 of them being unemployed.
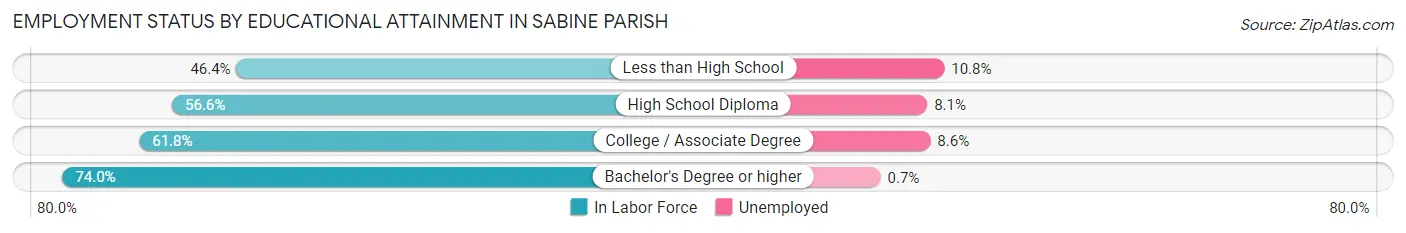
| Educational Attainment | In Labor Force | Unemployed |
| Less than High School | 683 (46.4%) | 159 (10.8%) |
| High School Diploma | 2,777 (56.6%) | 397 (8.1%) |
| College / Associate Degree | 1,646 (61.8%) | 229 (8.6%) |
| Bachelor's Degree or higher | 1,086 (74.0%) | 10 (0.7%) |
| Total | 6,189 (58.9%) | 757 (7.2%) |
Employment Occupations by Sex in Sabine Parish
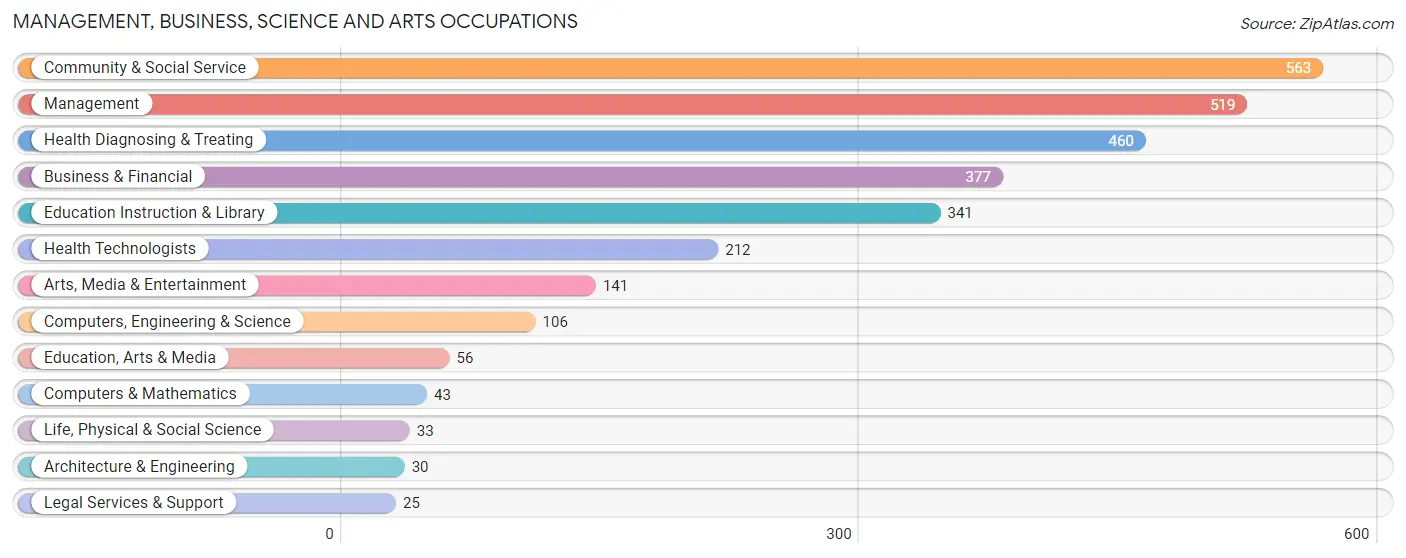
Management, Business, Science and Arts Occupations
The most common Management, Business, Science and Arts occupations in Sabine Parish are Community & Social Service (563 | 7.7%), Management (519 | 7.1%), Health Diagnosing & Treating (460 | 6.3%), Business & Financial (377 | 5.2%), and Education Instruction & Library (341 | 4.7%).
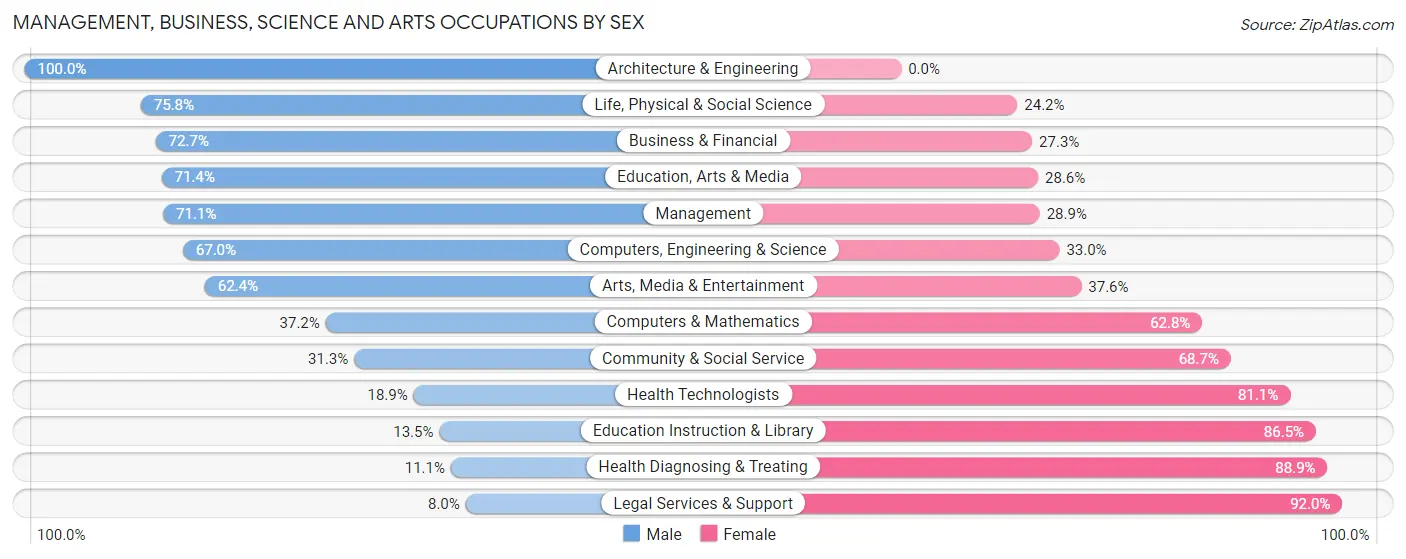
Management, Business, Science and Arts Occupations by Sex
Within the Management, Business, Science and Arts occupations in Sabine Parish, the most male-oriented occupations are Architecture & Engineering (100.0%), Life, Physical & Social Science (75.8%), and Business & Financial (72.7%), while the most female-oriented occupations are Legal Services & Support (92.0%), Health Diagnosing & Treating (88.9%), and Education Instruction & Library (86.5%).
| Occupation | Male | Female |
| Management | 369 (71.1%) | 150 (28.9%) |
| Business & Financial | 274 (72.7%) | 103 (27.3%) |
| Computers, Engineering & Science | 71 (67.0%) | 35 (33.0%) |
| Computers & Mathematics | 16 (37.2%) | 27 (62.8%) |
| Architecture & Engineering | 30 (100.0%) | 0 (0.0%) |
| Life, Physical & Social Science | 25 (75.8%) | 8 (24.2%) |
| Community & Social Service | 176 (31.3%) | 387 (68.7%) |
| Education, Arts & Media | 40 (71.4%) | 16 (28.6%) |
| Legal Services & Support | 2 (8.0%) | 23 (92.0%) |
| Education Instruction & Library | 46 (13.5%) | 295 (86.5%) |
| Arts, Media & Entertainment | 88 (62.4%) | 53 (37.6%) |
| Health Diagnosing & Treating | 51 (11.1%) | 409 (88.9%) |
| Health Technologists | 40 (18.9%) | 172 (81.1%) |
| Total (Category) | 941 (46.5%) | 1,084 (53.5%) |
| Total (Overall) | 4,350 (59.5%) | 2,959 (40.5%) |
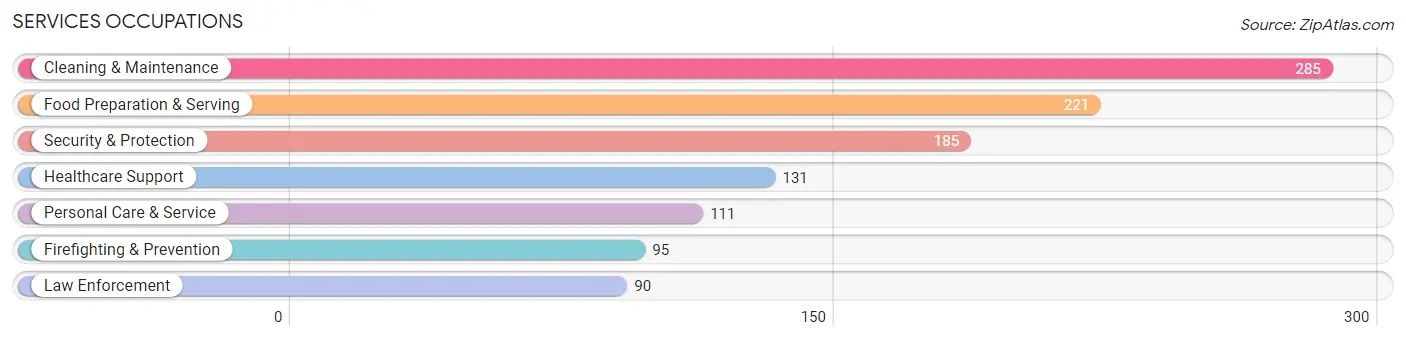
Services Occupations
The most common Services occupations in Sabine Parish are Cleaning & Maintenance (285 | 3.9%), Food Preparation & Serving (221 | 3.0%), Security & Protection (185 | 2.5%), Healthcare Support (131 | 1.8%), and Personal Care & Service (111 | 1.5%).
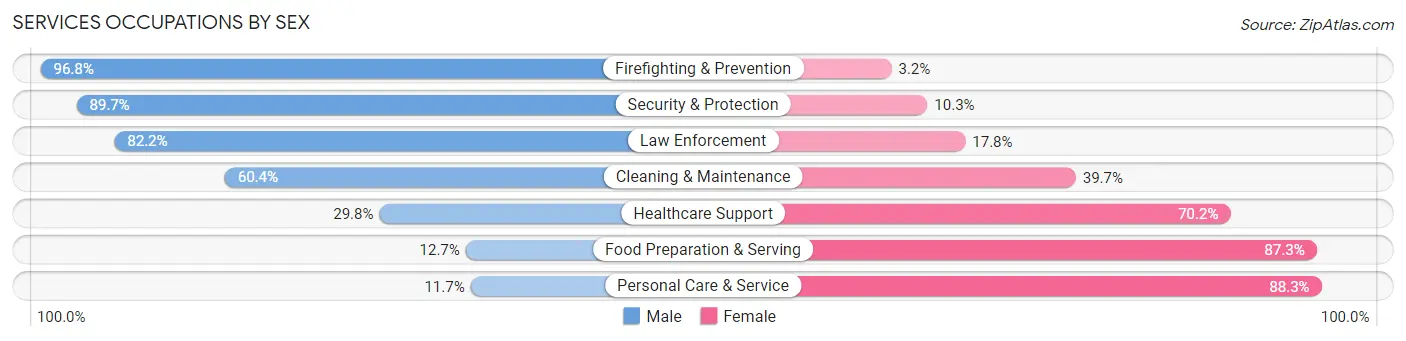
Services Occupations by Sex
Within the Services occupations in Sabine Parish, the most male-oriented occupations are Firefighting & Prevention (96.8%), Security & Protection (89.7%), and Law Enforcement (82.2%), while the most female-oriented occupations are Personal Care & Service (88.3%), Food Preparation & Serving (87.3%), and Healthcare Support (70.2%).
| Occupation | Male | Female |
| Healthcare Support | 39 (29.8%) | 92 (70.2%) |
| Security & Protection | 166 (89.7%) | 19 (10.3%) |
| Firefighting & Prevention | 92 (96.8%) | 3 (3.2%) |
| Law Enforcement | 74 (82.2%) | 16 (17.8%) |
| Food Preparation & Serving | 28 (12.7%) | 193 (87.3%) |
| Cleaning & Maintenance | 172 (60.4%) | 113 (39.7%) |
| Personal Care & Service | 13 (11.7%) | 98 (88.3%) |
| Total (Category) | 418 (44.8%) | 515 (55.2%) |
| Total (Overall) | 4,350 (59.5%) | 2,959 (40.5%) |
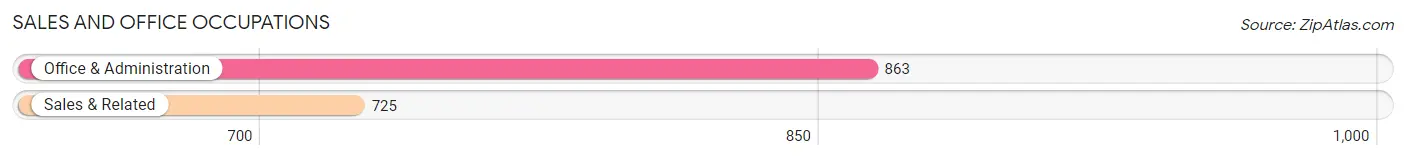
Sales and Office Occupations
The most common Sales and Office occupations in Sabine Parish are Office & Administration (863 | 11.8%), and Sales & Related (725 | 9.9%).
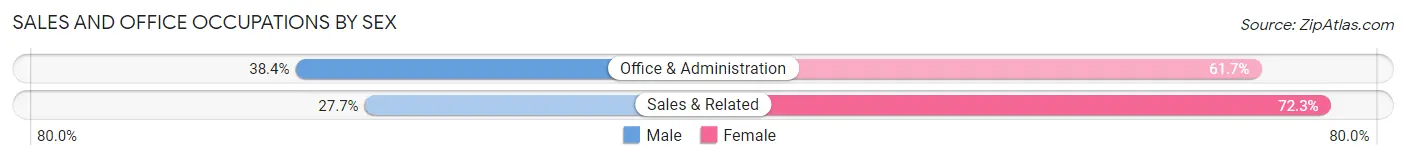
Sales and Office Occupations by Sex
| Occupation | Male | Female |
| Sales & Related | 201 (27.7%) | 524 (72.3%) |
| Office & Administration | 331 (38.4%) | 532 (61.7%) |
| Total (Category) | 532 (33.5%) | 1,056 (66.5%) |
| Total (Overall) | 4,350 (59.5%) | 2,959 (40.5%) |
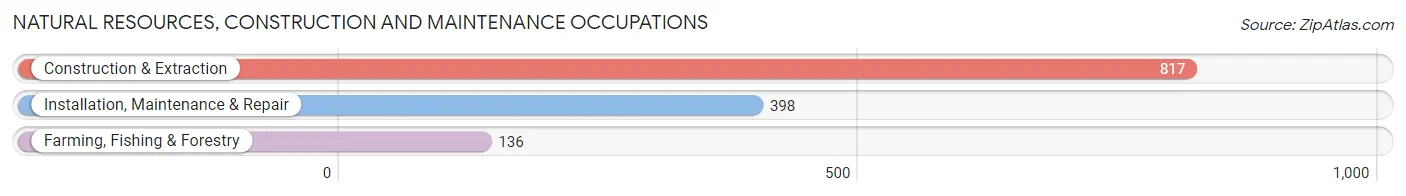
Natural Resources, Construction and Maintenance Occupations
The most common Natural Resources, Construction and Maintenance occupations in Sabine Parish are Construction & Extraction (817 | 11.2%), Installation, Maintenance & Repair (398 | 5.4%), and Farming, Fishing & Forestry (136 | 1.9%).
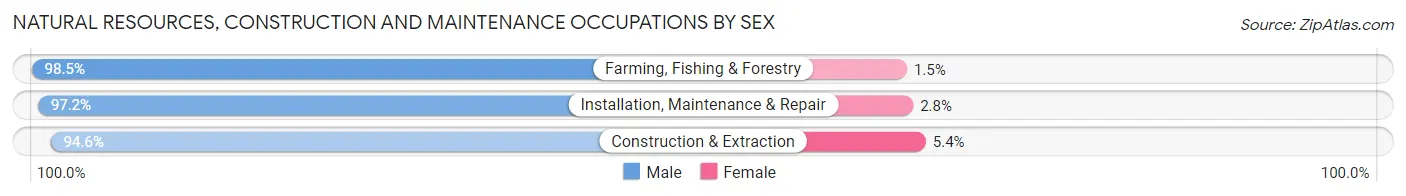
Natural Resources, Construction and Maintenance Occupations by Sex
| Occupation | Male | Female |
| Farming, Fishing & Forestry | 134 (98.5%) | 2 (1.5%) |
| Construction & Extraction | 773 (94.6%) | 44 (5.4%) |
| Installation, Maintenance & Repair | 387 (97.2%) | 11 (2.8%) |
| Total (Category) | 1,294 (95.8%) | 57 (4.2%) |
| Total (Overall) | 4,350 (59.5%) | 2,959 (40.5%) |
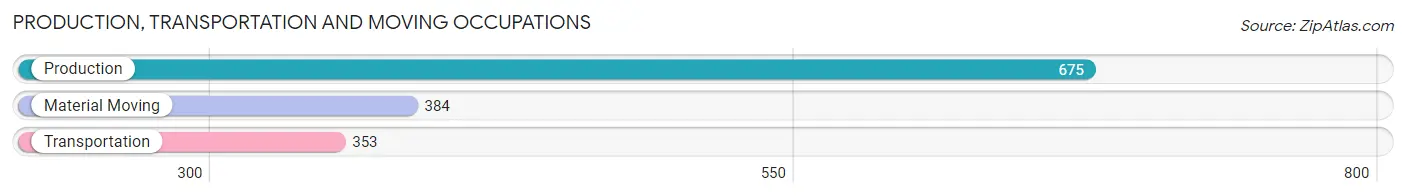
Production, Transportation and Moving Occupations
The most common Production, Transportation and Moving occupations in Sabine Parish are Production (675 | 9.2%), Material Moving (384 | 5.2%), and Transportation (353 | 4.8%).
Production, Transportation and Moving Occupations by Sex
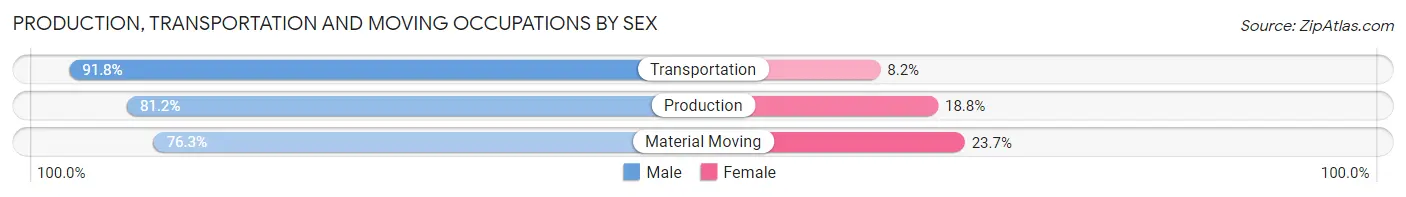
| Occupation | Male | Female |
| Production | 548 (81.2%) | 127 (18.8%) |
| Transportation | 324 (91.8%) | 29 (8.2%) |
| Material Moving | 293 (76.3%) | 91 (23.7%) |
| Total (Category) | 1,165 (82.5%) | 247 (17.5%) |
| Total (Overall) | 4,350 (59.5%) | 2,959 (40.5%) |
Employment Industries by Sex in Sabine Parish
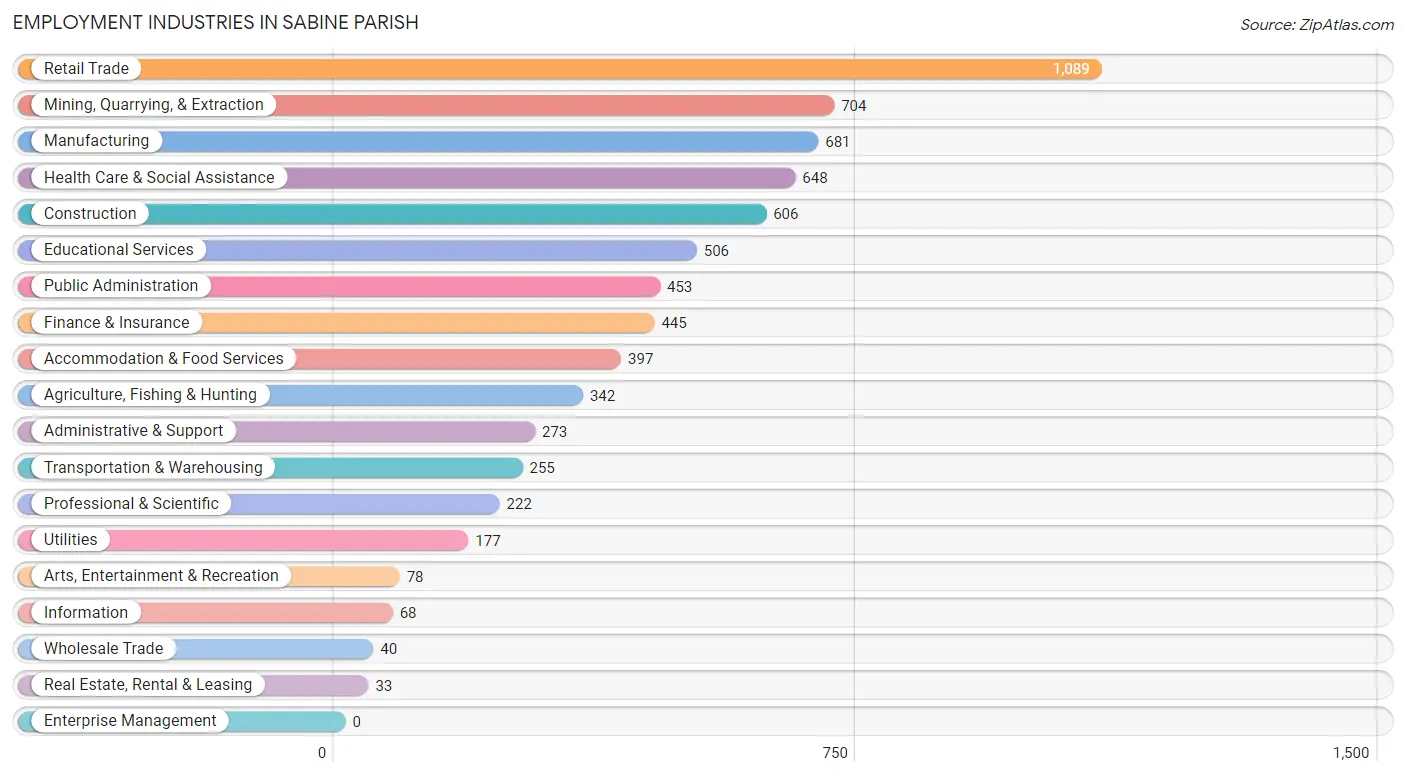
Employment Industries in Sabine Parish
The major employment industries in Sabine Parish include Retail Trade (1,089 | 14.9%), Mining, Quarrying, & Extraction (704 | 9.6%), Manufacturing (681 | 9.3%), Health Care & Social Assistance (648 | 8.9%), and Construction (606 | 8.3%).
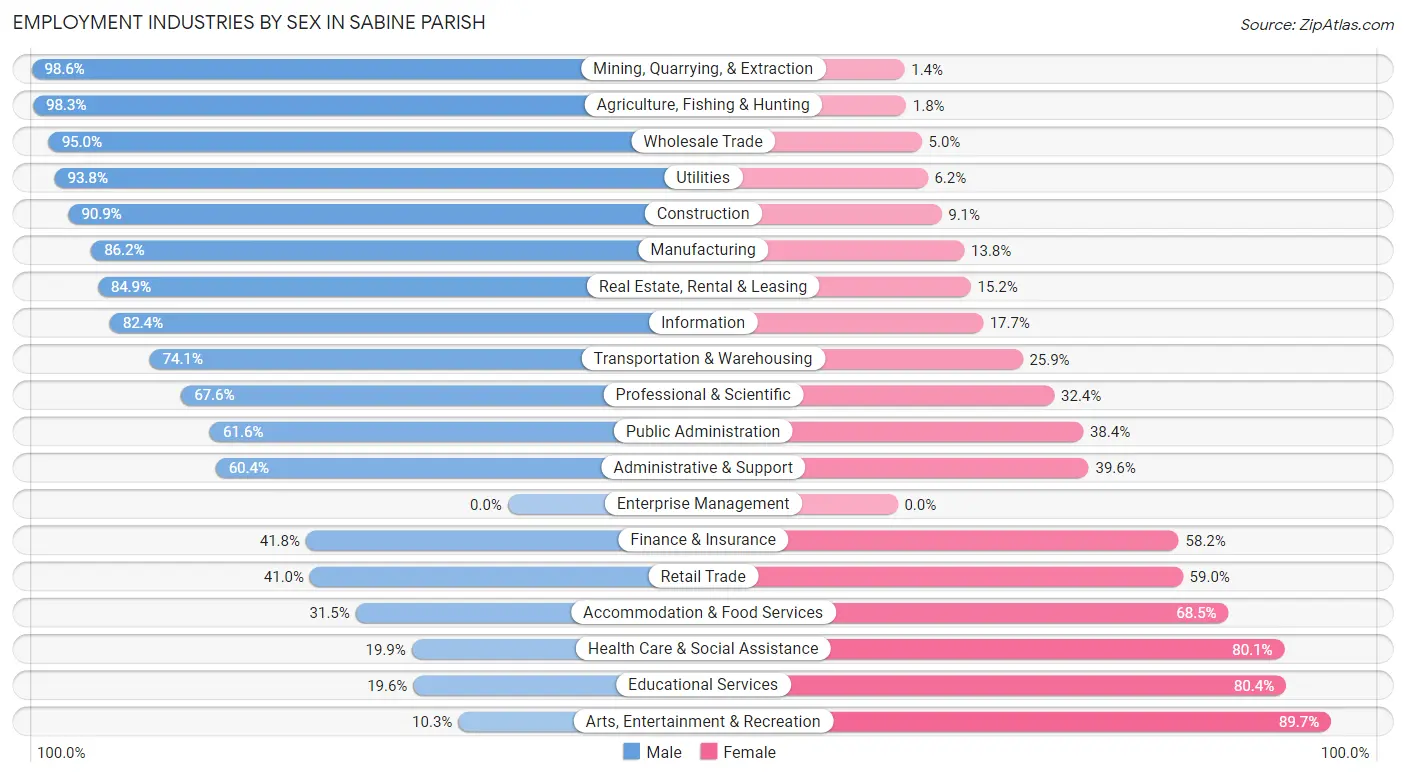
Employment Industries by Sex in Sabine Parish
The Sabine Parish industries that see more men than women are Mining, Quarrying, & Extraction (98.6%), Agriculture, Fishing & Hunting (98.3%), and Wholesale Trade (95.0%), whereas the industries that tend to have a higher number of women are Arts, Entertainment & Recreation (89.7%), Educational Services (80.4%), and Health Care & Social Assistance (80.1%).
| Industry | Male | Female |
| Agriculture, Fishing & Hunting | 336 (98.3%) | 6 (1.8%) |
| Mining, Quarrying, & Extraction | 694 (98.6%) | 10 (1.4%) |
| Construction | 551 (90.9%) | 55 (9.1%) |
| Manufacturing | 587 (86.2%) | 94 (13.8%) |
| Wholesale Trade | 38 (95.0%) | 2 (5.0%) |
| Retail Trade | 446 (41.0%) | 643 (59.0%) |
| Transportation & Warehousing | 189 (74.1%) | 66 (25.9%) |
| Utilities | 166 (93.8%) | 11 (6.2%) |
| Information | 56 (82.4%) | 12 (17.6%) |
| Finance & Insurance | 186 (41.8%) | 259 (58.2%) |
| Real Estate, Rental & Leasing | 28 (84.9%) | 5 (15.1%) |
| Professional & Scientific | 150 (67.6%) | 72 (32.4%) |
| Enterprise Management | 0 (0.0%) | 0 (0.0%) |
| Administrative & Support | 165 (60.4%) | 108 (39.6%) |
| Educational Services | 99 (19.6%) | 407 (80.4%) |
| Health Care & Social Assistance | 129 (19.9%) | 519 (80.1%) |
| Arts, Entertainment & Recreation | 8 (10.3%) | 70 (89.7%) |
| Accommodation & Food Services | 125 (31.5%) | 272 (68.5%) |
| Public Administration | 279 (61.6%) | 174 (38.4%) |
| Total | 4,350 (59.5%) | 2,959 (40.5%) |
Education in Sabine Parish
School Enrollment in Sabine Parish
The most common levels of schooling among the 4,928 students in Sabine Parish are high school (1,413 | 28.7%), elementary school (1,207 | 24.5%), and middle school (1,079 | 21.9%).
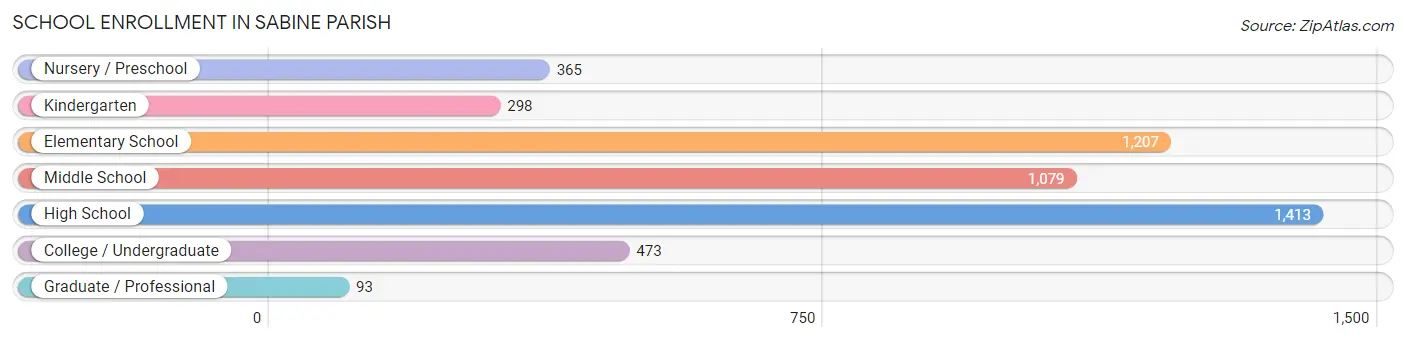
| School Level | # Students | % Students |
| Nursery / Preschool | 365 | 7.4% |
| Kindergarten | 298 | 6.0% |
| Elementary School | 1,207 | 24.5% |
| Middle School | 1,079 | 21.9% |
| High School | 1,413 | 28.7% |
| College / Undergraduate | 473 | 9.6% |
| Graduate / Professional | 93 | 1.9% |
| Total | 4,928 | 100.0% |
School Enrollment by Age by Funding Source in Sabine Parish
Out of a total of 4,928 students who are enrolled in schools in Sabine Parish, 636 (12.9%) attend a private institution, while the remaining 4,292 (87.1%) are enrolled in public schools. The age group of 25 to 34 year olds has the highest likelihood of being enrolled in private schools, with 54 (34.6% in the age bracket) enrolled. Conversely, the age group of 20 to 24 year olds has the lowest likelihood of being enrolled in a private school, with 269 (96.1% in the age bracket) attending a public institution.
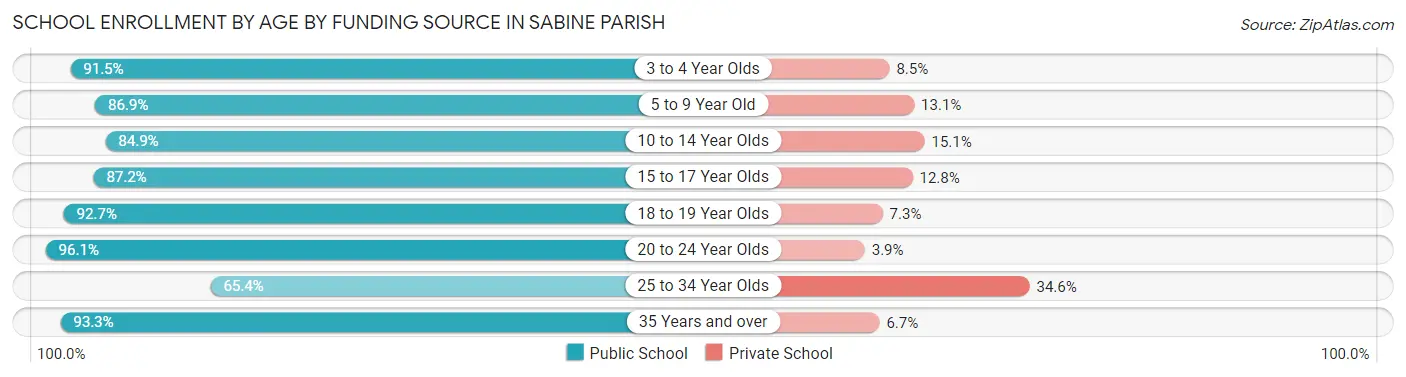
| Age Bracket | Public School | Private School |
| 3 to 4 Year Olds | 236 (91.5%) | 22 (8.5%) |
| 5 to 9 Year Old | 1,297 (86.9%) | 196 (13.1%) |
| 10 to 14 Year Olds | 1,100 (84.9%) | 195 (15.1%) |
| 15 to 17 Year Olds | 822 (87.2%) | 121 (12.8%) |
| 18 to 19 Year Olds | 383 (92.7%) | 30 (7.3%) |
| 20 to 24 Year Olds | 269 (96.1%) | 11 (3.9%) |
| 25 to 34 Year Olds | 102 (65.4%) | 54 (34.6%) |
| 35 Years and over | 84 (93.3%) | 6 (6.7%) |
| Total | 4,292 (87.1%) | 636 (12.9%) |
Educational Attainment by Field of Study in Sabine Parish
Education (416 | 18.9%), business (376 | 17.0%), science & technology (268 | 12.1%), liberal arts & history (235 | 10.6%), and arts & humanities (198 | 9.0%) are the most common fields of study among 2,206 individuals in Sabine Parish who have obtained a bachelor's degree or higher.
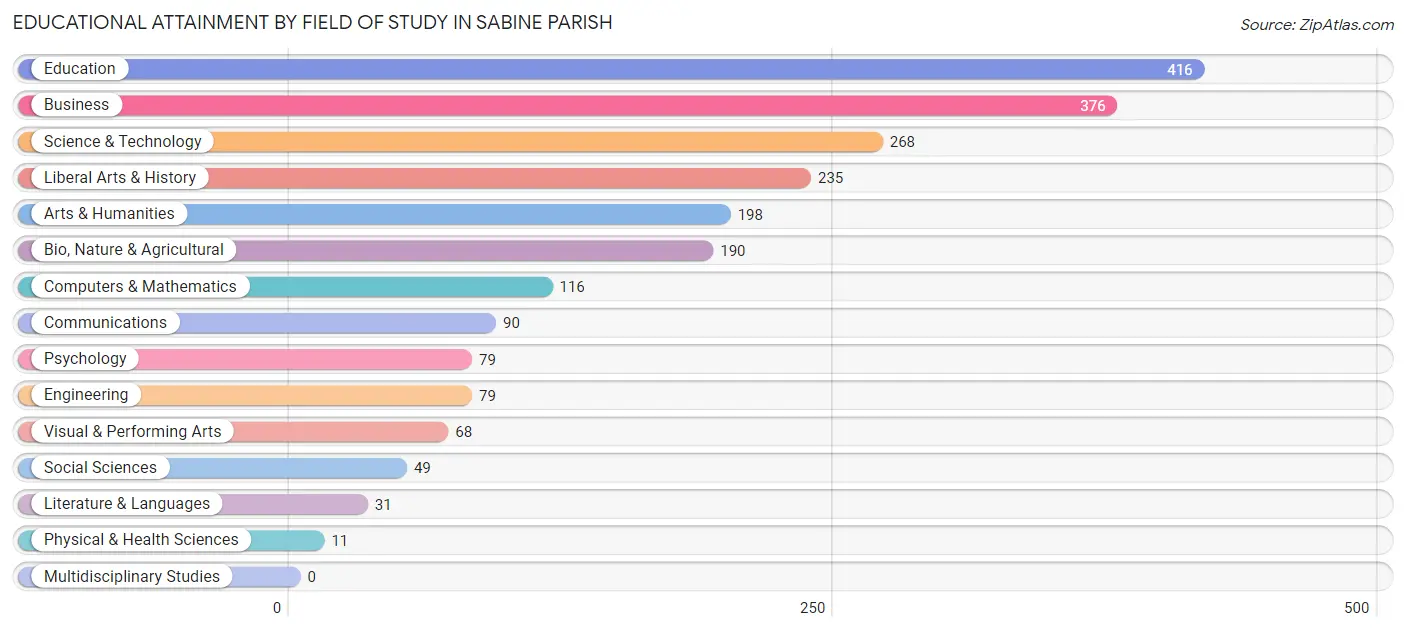
| Field of Study | # Graduates | % Graduates |
| Computers & Mathematics | 116 | 5.3% |
| Bio, Nature & Agricultural | 190 | 8.6% |
| Physical & Health Sciences | 11 | 0.5% |
| Psychology | 79 | 3.6% |
| Social Sciences | 49 | 2.2% |
| Engineering | 79 | 3.6% |
| Multidisciplinary Studies | 0 | 0.0% |
| Science & Technology | 268 | 12.1% |
| Business | 376 | 17.0% |
| Education | 416 | 18.9% |
| Literature & Languages | 31 | 1.4% |
| Liberal Arts & History | 235 | 10.6% |
| Visual & Performing Arts | 68 | 3.1% |
| Communications | 90 | 4.1% |
| Arts & Humanities | 198 | 9.0% |
| Total | 2,206 | 100.0% |
Transportation & Commute in Sabine Parish
Vehicle Availability by Sex in Sabine Parish
The most prevalent vehicle ownership categories in Sabine Parish are males with 2 vehicles (1,662, accounting for 38.6%) and females with 2 vehicles (950, making up 56.7%).
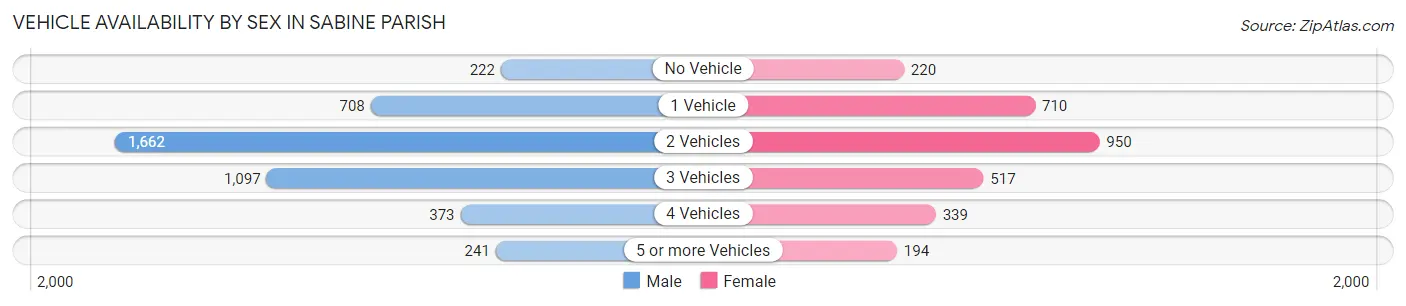
| Vehicles Available | Male | Female |
| No Vehicle | 222 (5.2%) | 220 (7.5%) |
| 1 Vehicle | 708 (16.5%) | 710 (24.2%) |
| 2 Vehicles | 1,662 (38.6%) | 950 (32.4%) |
| 3 Vehicles | 1,097 (25.5%) | 517 (17.6%) |
| 4 Vehicles | 373 (8.7%) | 339 (11.6%) |
| 5 or more Vehicles | 241 (5.6%) | 194 (6.6%) |
| Total | 4,303 (100.0%) | 2,930 (100.0%) |
Commute Time in Sabine Parish
The most frequently occuring commute durations in Sabine Parish are 5 to 9 minutes (994 commuters, 14.3%), 15 to 19 minutes (902 commuters, 13.0%), and 10 to 14 minutes (900 commuters, 13.0%).
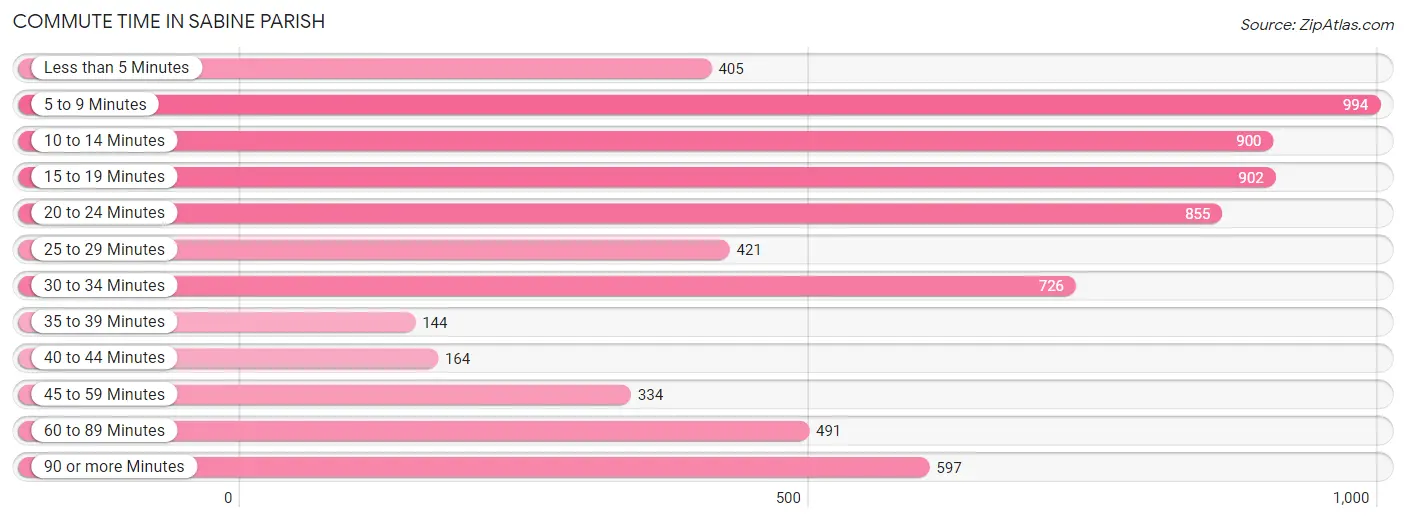
| Commute Time | # Commuters | % Commuters |
| Less than 5 Minutes | 405 | 5.8% |
| 5 to 9 Minutes | 994 | 14.3% |
| 10 to 14 Minutes | 900 | 13.0% |
| 15 to 19 Minutes | 902 | 13.0% |
| 20 to 24 Minutes | 855 | 12.3% |
| 25 to 29 Minutes | 421 | 6.1% |
| 30 to 34 Minutes | 726 | 10.5% |
| 35 to 39 Minutes | 144 | 2.1% |
| 40 to 44 Minutes | 164 | 2.4% |
| 45 to 59 Minutes | 334 | 4.8% |
| 60 to 89 Minutes | 491 | 7.1% |
| 90 or more Minutes | 597 | 8.6% |
Commute Time by Sex in Sabine Parish
The most common commute times in Sabine Parish are 10 to 14 minutes (639 commuters, 15.2%) for males and 5 to 9 minutes (485 commuters, 17.7%) for females.
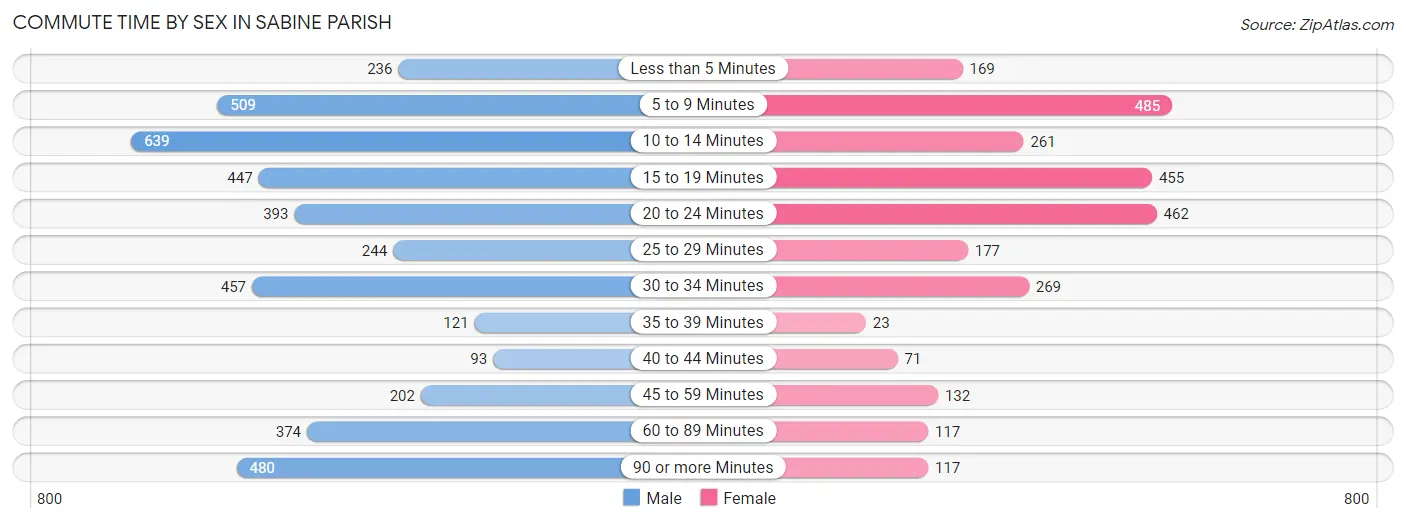
| Commute Time | Male | Female |
| Less than 5 Minutes | 236 (5.6%) | 169 (6.2%) |
| 5 to 9 Minutes | 509 (12.1%) | 485 (17.7%) |
| 10 to 14 Minutes | 639 (15.2%) | 261 (9.5%) |
| 15 to 19 Minutes | 447 (10.7%) | 455 (16.6%) |
| 20 to 24 Minutes | 393 (9.4%) | 462 (16.9%) |
| 25 to 29 Minutes | 244 (5.8%) | 177 (6.5%) |
| 30 to 34 Minutes | 457 (10.9%) | 269 (9.8%) |
| 35 to 39 Minutes | 121 (2.9%) | 23 (0.8%) |
| 40 to 44 Minutes | 93 (2.2%) | 71 (2.6%) |
| 45 to 59 Minutes | 202 (4.8%) | 132 (4.8%) |
| 60 to 89 Minutes | 374 (8.9%) | 117 (4.3%) |
| 90 or more Minutes | 480 (11.4%) | 117 (4.3%) |
Time of Departure to Work by Sex in Sabine Parish
The most frequent times of departure to work in Sabine Parish are 12:00 AM to 4:59 AM (871, 20.8%) for males and 7:00 AM to 7:29 AM (555, 20.3%) for females.
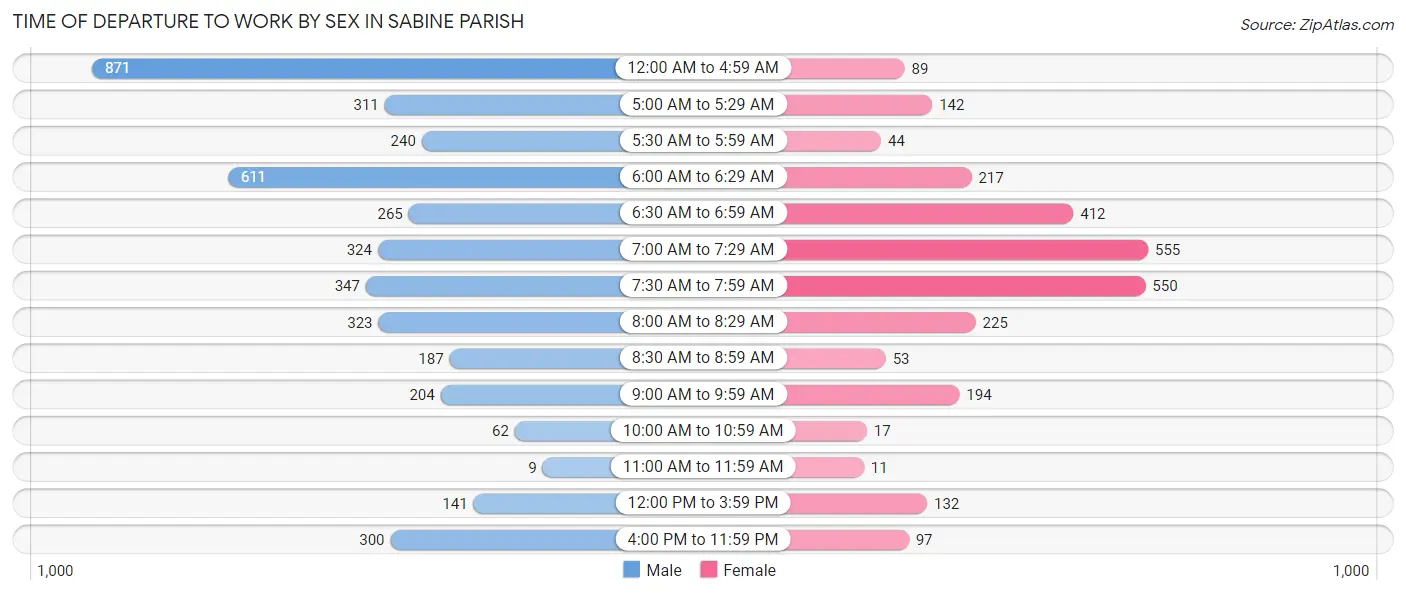
| Time of Departure | Male | Female |
| 12:00 AM to 4:59 AM | 871 (20.8%) | 89 (3.3%) |
| 5:00 AM to 5:29 AM | 311 (7.4%) | 142 (5.2%) |
| 5:30 AM to 5:59 AM | 240 (5.7%) | 44 (1.6%) |
| 6:00 AM to 6:29 AM | 611 (14.6%) | 217 (7.9%) |
| 6:30 AM to 6:59 AM | 265 (6.3%) | 412 (15.0%) |
| 7:00 AM to 7:29 AM | 324 (7.7%) | 555 (20.3%) |
| 7:30 AM to 7:59 AM | 347 (8.3%) | 550 (20.1%) |
| 8:00 AM to 8:29 AM | 323 (7.7%) | 225 (8.2%) |
| 8:30 AM to 8:59 AM | 187 (4.5%) | 53 (1.9%) |
| 9:00 AM to 9:59 AM | 204 (4.9%) | 194 (7.1%) |
| 10:00 AM to 10:59 AM | 62 (1.5%) | 17 (0.6%) |
| 11:00 AM to 11:59 AM | 9 (0.2%) | 11 (0.4%) |
| 12:00 PM to 3:59 PM | 141 (3.4%) | 132 (4.8%) |
| 4:00 PM to 11:59 PM | 300 (7.1%) | 97 (3.5%) |
| Total | 4,195 (100.0%) | 2,738 (100.0%) |
Housing Occupancy in Sabine Parish
Occupancy by Ownership in Sabine Parish
Of the total 8,339 dwellings in Sabine Parish, owner-occupied units account for 6,110 (73.3%), while renter-occupied units make up 2,229 (26.7%).
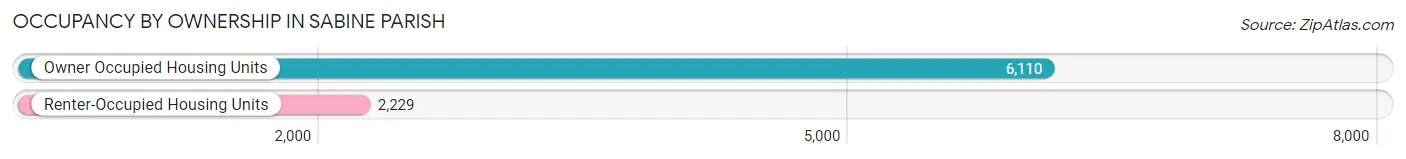
| Occupancy | # Housing Units | % Housing Units |
| Owner Occupied Housing Units | 6,110 | 73.3% |
| Renter-Occupied Housing Units | 2,229 | 26.7% |
| Total Occupied Housing Units | 8,339 | 100.0% |
Occupancy by Household Size in Sabine Parish
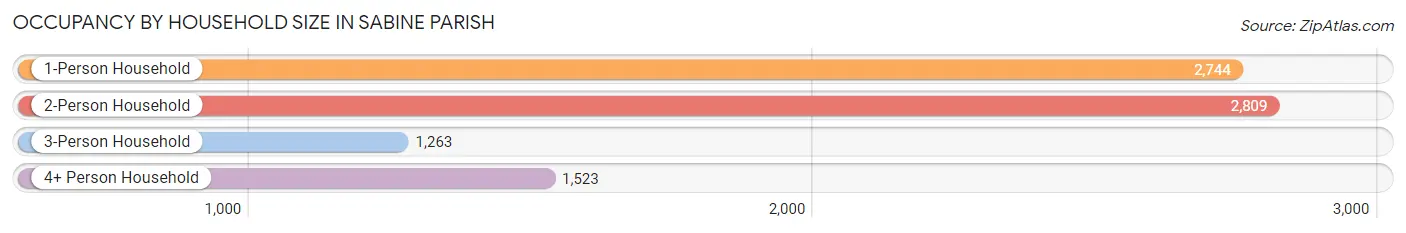
| Household Size | # Housing Units | % Housing Units |
| 1-Person Household | 2,744 | 32.9% |
| 2-Person Household | 2,809 | 33.7% |
| 3-Person Household | 1,263 | 15.1% |
| 4+ Person Household | 1,523 | 18.3% |
| Total Housing Units | 8,339 | 100.0% |
Occupancy by Ownership by Household Size in Sabine Parish
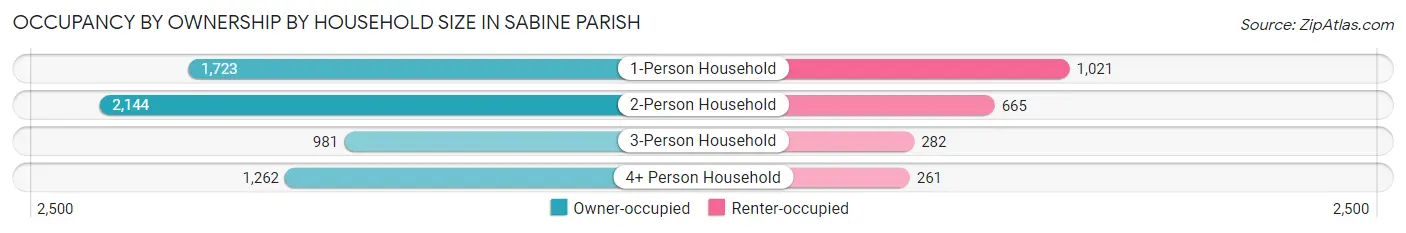
| Household Size | Owner-occupied | Renter-occupied |
| 1-Person Household | 1,723 (62.8%) | 1,021 (37.2%) |
| 2-Person Household | 2,144 (76.3%) | 665 (23.7%) |
| 3-Person Household | 981 (77.7%) | 282 (22.3%) |
| 4+ Person Household | 1,262 (82.9%) | 261 (17.1%) |
| Total Housing Units | 6,110 (73.3%) | 2,229 (26.7%) |
Occupancy by Educational Attainment in Sabine Parish
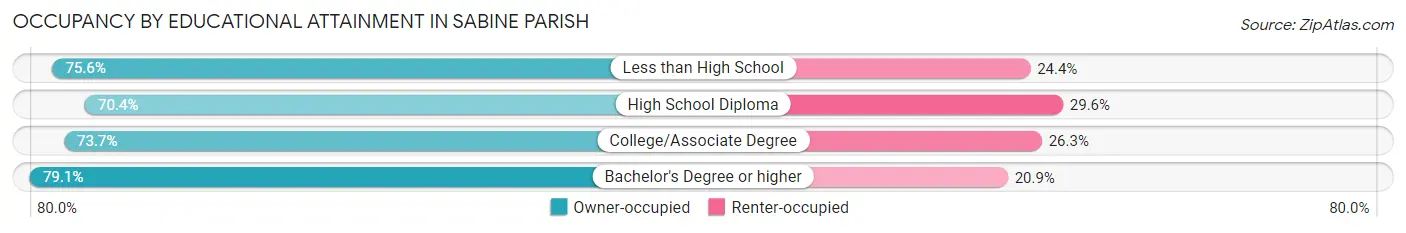
| Household Size | Owner-occupied | Renter-occupied |
| Less than High School | 798 (75.6%) | 258 (24.4%) |
| High School Diploma | 2,529 (70.4%) | 1,064 (29.6%) |
| College/Associate Degree | 1,876 (73.7%) | 668 (26.3%) |
| Bachelor's Degree or higher | 907 (79.1%) | 239 (20.9%) |
Occupancy by Age of Householder in Sabine Parish
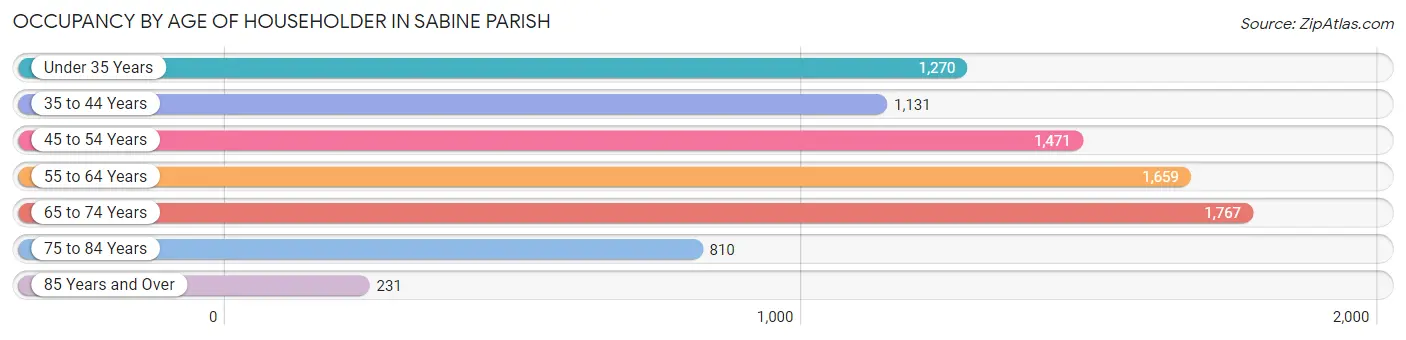
| Age Bracket | # Households | % Households |
| Under 35 Years | 1,270 | 15.2% |
| 35 to 44 Years | 1,131 | 13.6% |
| 45 to 54 Years | 1,471 | 17.6% |
| 55 to 64 Years | 1,659 | 19.9% |
| 65 to 74 Years | 1,767 | 21.2% |
| 75 to 84 Years | 810 | 9.7% |
| 85 Years and Over | 231 | 2.8% |
| Total | 8,339 | 100.0% |
Housing Finances in Sabine Parish
Median Income by Occupancy in Sabine Parish
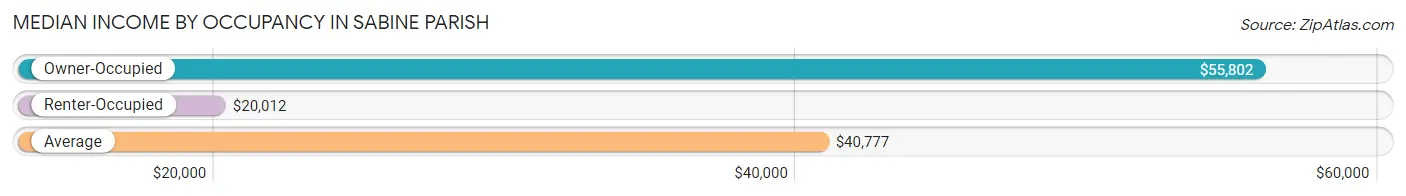
| Occupancy Type | # Households | Median Income |
| Owner-Occupied | 6,110 (73.3%) | $55,802 |
| Renter-Occupied | 2,229 (26.7%) | $20,012 |
| Average | 8,339 (100.0%) | $40,777 |
Occupancy by Householder Income Bracket in Sabine Parish
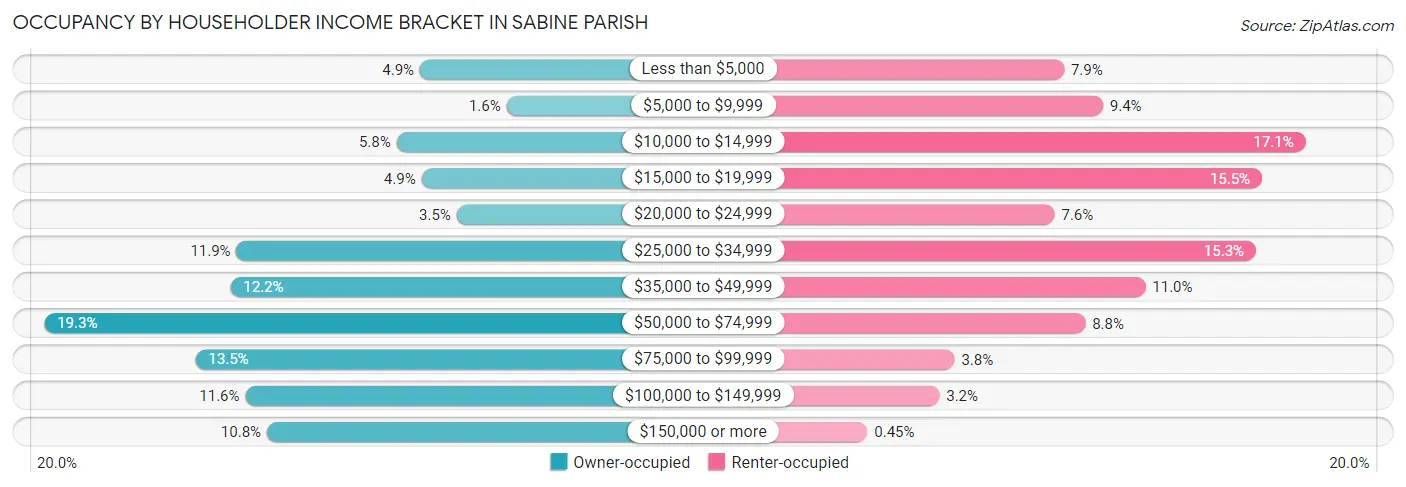
| Income Bracket | Owner-occupied | Renter-occupied |
| Less than $5,000 | 302 (4.9%) | 177 (7.9%) |
| $5,000 to $9,999 | 100 (1.6%) | 210 (9.4%) |
| $10,000 to $14,999 | 356 (5.8%) | 382 (17.1%) |
| $15,000 to $19,999 | 298 (4.9%) | 345 (15.5%) |
| $20,000 to $24,999 | 216 (3.5%) | 169 (7.6%) |
| $25,000 to $34,999 | 729 (11.9%) | 340 (15.2%) |
| $35,000 to $49,999 | 743 (12.2%) | 246 (11.0%) |
| $50,000 to $74,999 | 1,176 (19.3%) | 195 (8.7%) |
| $75,000 to $99,999 | 824 (13.5%) | 84 (3.8%) |
| $100,000 to $149,999 | 708 (11.6%) | 71 (3.2%) |
| $150,000 or more | 658 (10.8%) | 10 (0.4%) |
| Total | 6,110 (100.0%) | 2,229 (100.0%) |
Monthly Housing Cost Tiers in Sabine Parish
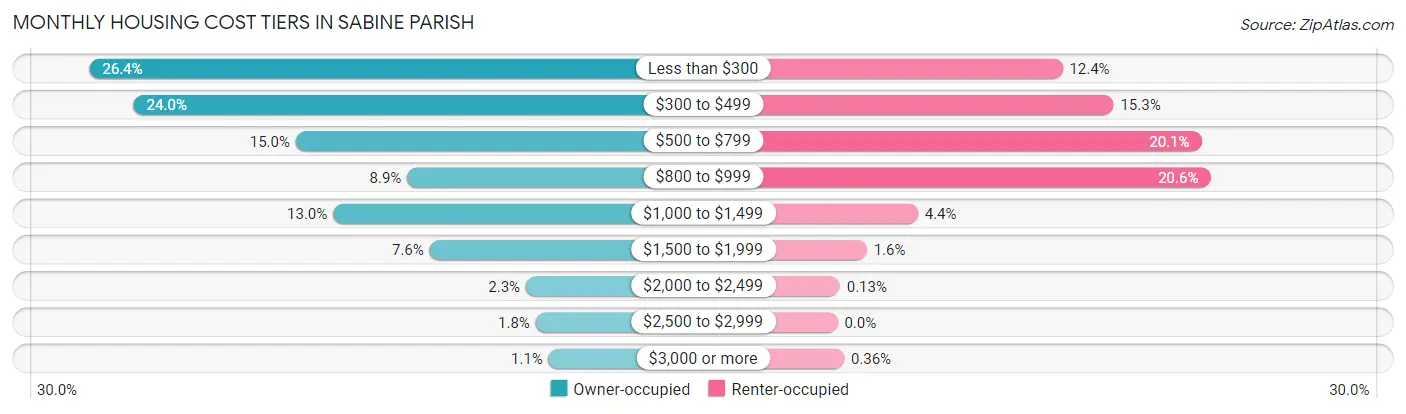
| Monthly Cost | Owner-occupied | Renter-occupied |
| Less than $300 | 1,614 (26.4%) | 277 (12.4%) |
| $300 to $499 | 1,465 (24.0%) | 340 (15.2%) |
| $500 to $799 | 918 (15.0%) | 448 (20.1%) |
| $800 to $999 | 542 (8.9%) | 459 (20.6%) |
| $1,000 to $1,499 | 792 (13.0%) | 99 (4.4%) |
| $1,500 to $1,999 | 466 (7.6%) | 36 (1.6%) |
| $2,000 to $2,499 | 141 (2.3%) | 3 (0.1%) |
| $2,500 to $2,999 | 108 (1.8%) | 0 (0.0%) |
| $3,000 or more | 64 (1.1%) | 8 (0.4%) |
| Total | 6,110 (100.0%) | 2,229 (100.0%) |
Physical Housing Characteristics in Sabine Parish
Housing Structures in Sabine Parish
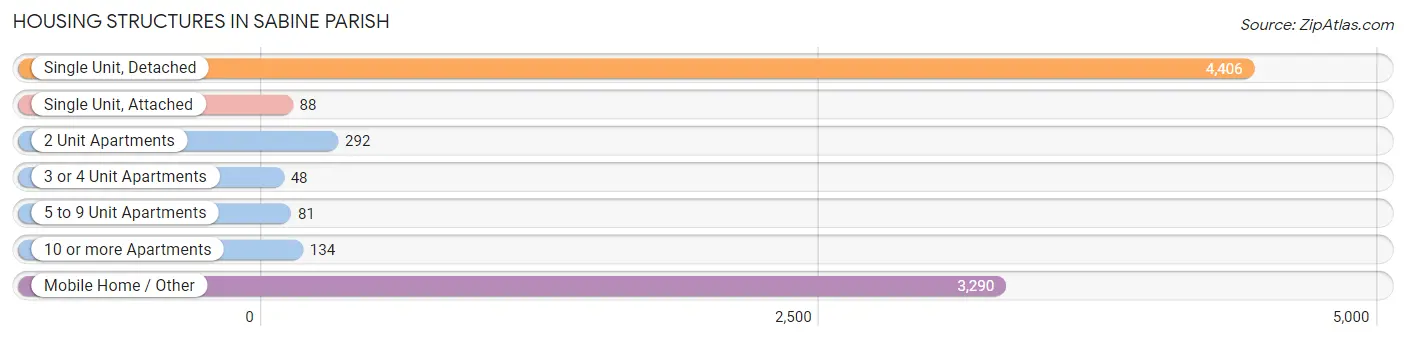
| Structure Type | # Housing Units | % Housing Units |
| Single Unit, Detached | 4,406 | 52.8% |
| Single Unit, Attached | 88 | 1.1% |
| 2 Unit Apartments | 292 | 3.5% |
| 3 or 4 Unit Apartments | 48 | 0.6% |
| 5 to 9 Unit Apartments | 81 | 1.0% |
| 10 or more Apartments | 134 | 1.6% |
| Mobile Home / Other | 3,290 | 39.5% |
| Total | 8,339 | 100.0% |
Housing Structures by Occupancy in Sabine Parish
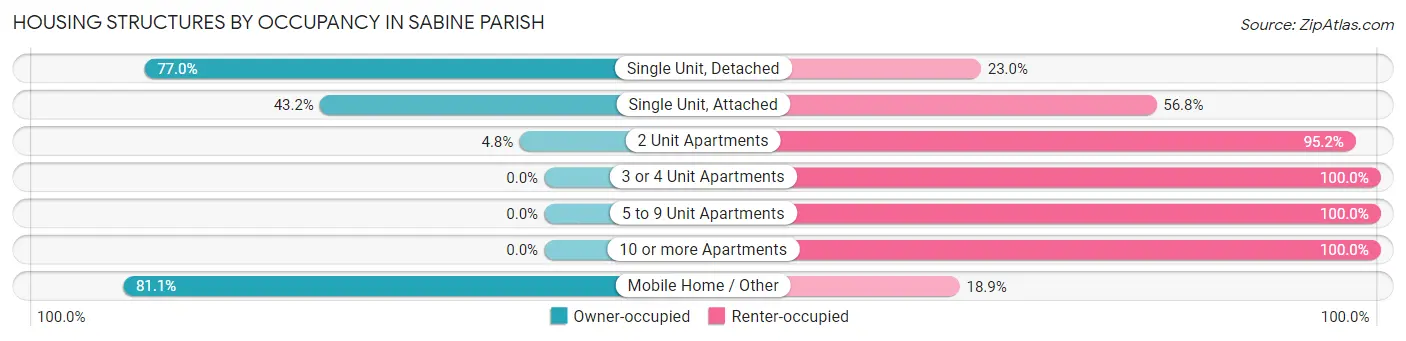
| Structure Type | Owner-occupied | Renter-occupied |
| Single Unit, Detached | 3,391 (77.0%) | 1,015 (23.0%) |
| Single Unit, Attached | 38 (43.2%) | 50 (56.8%) |
| 2 Unit Apartments | 14 (4.8%) | 278 (95.2%) |
| 3 or 4 Unit Apartments | 0 (0.0%) | 48 (100.0%) |
| 5 to 9 Unit Apartments | 0 (0.0%) | 81 (100.0%) |
| 10 or more Apartments | 0 (0.0%) | 134 (100.0%) |
| Mobile Home / Other | 2,667 (81.1%) | 623 (18.9%) |
| Total | 6,110 (73.3%) | 2,229 (26.7%) |
Housing Structures by Number of Rooms in Sabine Parish
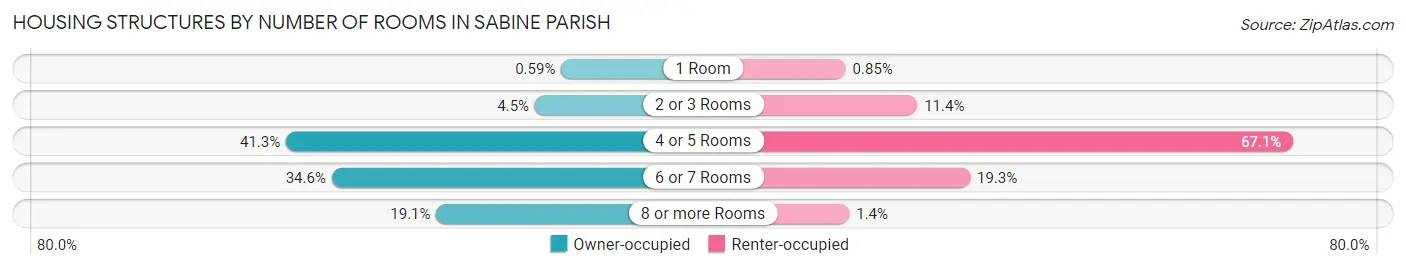
| Number of Rooms | Owner-occupied | Renter-occupied |
| 1 Room | 36 (0.6%) | 19 (0.9%) |
| 2 or 3 Rooms | 274 (4.5%) | 255 (11.4%) |
| 4 or 5 Rooms | 2,524 (41.3%) | 1,495 (67.1%) |
| 6 or 7 Rooms | 2,111 (34.5%) | 429 (19.3%) |
| 8 or more Rooms | 1,165 (19.1%) | 31 (1.4%) |
| Total | 6,110 (100.0%) | 2,229 (100.0%) |
Housing Structure by Heating Type in Sabine Parish
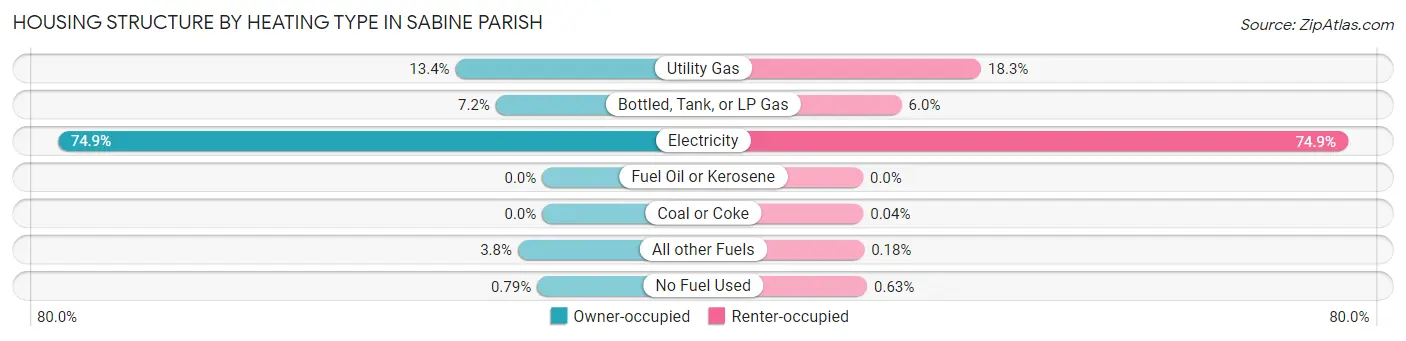
| Heating Type | Owner-occupied | Renter-occupied |
| Utility Gas | 819 (13.4%) | 407 (18.3%) |
| Bottled, Tank, or LP Gas | 439 (7.2%) | 133 (6.0%) |
| Electricity | 4,574 (74.9%) | 1,670 (74.9%) |
| Fuel Oil or Kerosene | 0 (0.0%) | 0 (0.0%) |
| Coal or Coke | 0 (0.0%) | 1 (0.0%) |
| All other Fuels | 230 (3.8%) | 4 (0.2%) |
| No Fuel Used | 48 (0.8%) | 14 (0.6%) |
| Total | 6,110 (100.0%) | 2,229 (100.0%) |
Household Vehicle Usage in Sabine Parish
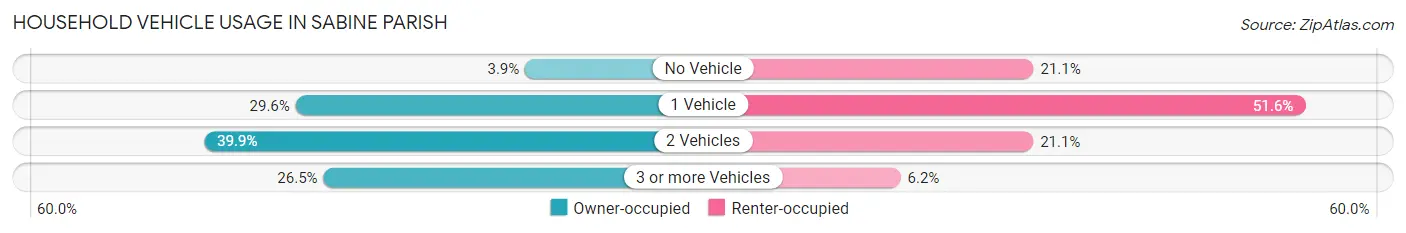
| Vehicles per Household | Owner-occupied | Renter-occupied |
| No Vehicle | 240 (3.9%) | 471 (21.1%) |
| 1 Vehicle | 1,811 (29.6%) | 1,149 (51.5%) |
| 2 Vehicles | 2,438 (39.9%) | 470 (21.1%) |
| 3 or more Vehicles | 1,621 (26.5%) | 139 (6.2%) |
| Total | 6,110 (100.0%) | 2,229 (100.0%) |
Real Estate & Mortgages in Sabine Parish
Real Estate and Mortgage Overview in Sabine Parish
| Characteristic | Without Mortgage | With Mortgage |
| Housing Units | 3,772 | 2,338 |
| Median Property Value | $86,400 | $170,800 |
| Median Household Income | $42,889 | $386 |
| Monthly Housing Costs | $332 | $64 |
| Real Estate Taxes | $340 | $859 |
Property Value by Mortgage Status in Sabine Parish
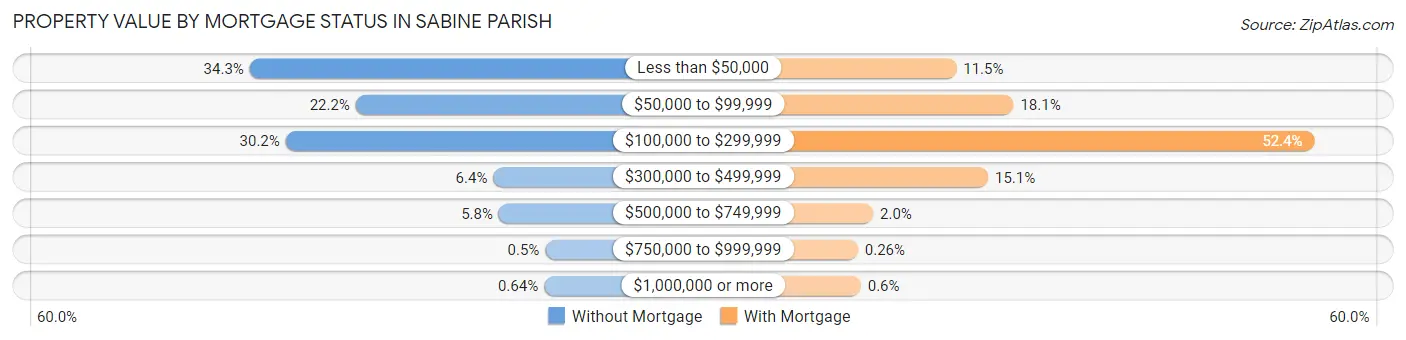
| Property Value | Without Mortgage | With Mortgage |
| Less than $50,000 | 1,293 (34.3%) | 269 (11.5%) |
| $50,000 to $99,999 | 836 (22.2%) | 422 (18.0%) |
| $100,000 to $299,999 | 1,138 (30.2%) | 1,226 (52.4%) |
| $300,000 to $499,999 | 243 (6.4%) | 354 (15.1%) |
| $500,000 to $749,999 | 219 (5.8%) | 47 (2.0%) |
| $750,000 to $999,999 | 19 (0.5%) | 6 (0.3%) |
| $1,000,000 or more | 24 (0.6%) | 14 (0.6%) |
| Total | 3,772 (100.0%) | 2,338 (100.0%) |
Household Income by Mortgage Status in Sabine Parish
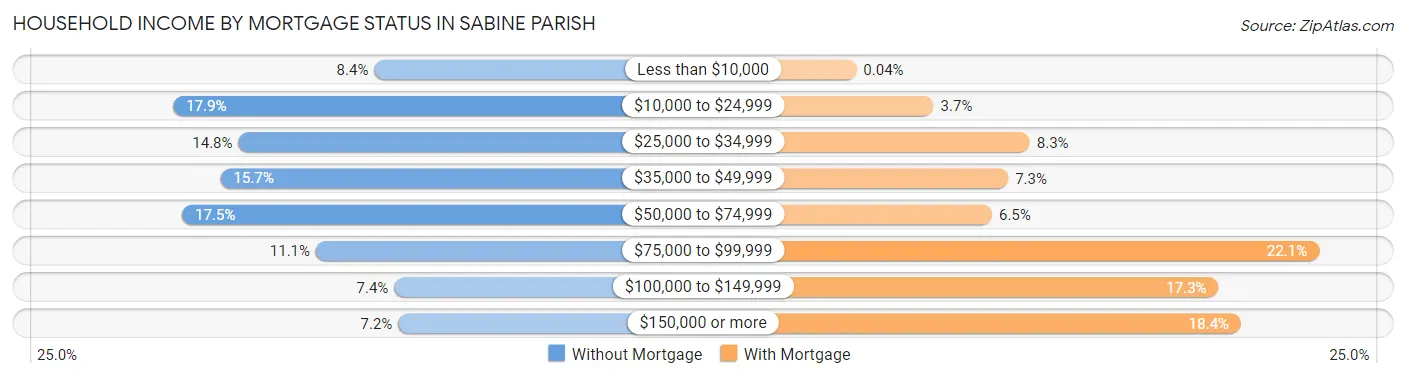
| Household Income | Without Mortgage | With Mortgage |
| Less than $10,000 | 315 (8.4%) | 1 (0.0%) |
| $10,000 to $24,999 | 676 (17.9%) | 87 (3.7%) |
| $25,000 to $34,999 | 559 (14.8%) | 194 (8.3%) |
| $35,000 to $49,999 | 591 (15.7%) | 170 (7.3%) |
| $50,000 to $74,999 | 660 (17.5%) | 152 (6.5%) |
| $75,000 to $99,999 | 420 (11.1%) | 516 (22.1%) |
| $100,000 to $149,999 | 279 (7.4%) | 404 (17.3%) |
| $150,000 or more | 272 (7.2%) | 429 (18.3%) |
| Total | 3,772 (100.0%) | 2,338 (100.0%) |
Property Value to Household Income Ratio in Sabine Parish
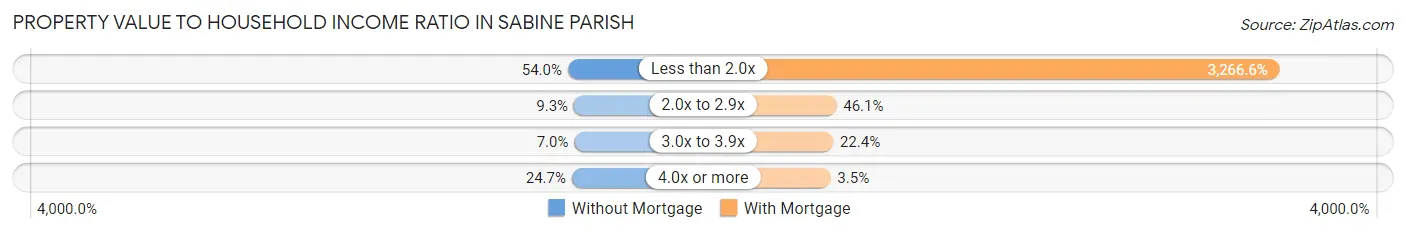
| Value-to-Income Ratio | Without Mortgage | With Mortgage |
| Less than 2.0x | 2,037 (54.0%) | 76,374 (3,266.6%) |
| 2.0x to 2.9x | 352 (9.3%) | 1,078 (46.1%) |
| 3.0x to 3.9x | 262 (7.0%) | 524 (22.4%) |
| 4.0x or more | 932 (24.7%) | 81 (3.5%) |
| Total | 3,772 (100.0%) | 2,338 (100.0%) |
Real Estate Taxes by Mortgage Status in Sabine Parish
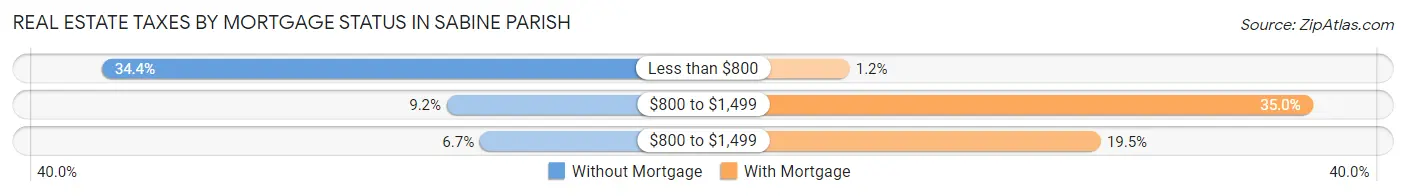
| Property Taxes | Without Mortgage | With Mortgage |
| Less than $800 | 1,296 (34.4%) | 27 (1.1%) |
| $800 to $1,499 | 345 (9.1%) | 819 (35.0%) |
| $800 to $1,499 | 254 (6.7%) | 456 (19.5%) |
| Total | 3,772 (100.0%) | 2,338 (100.0%) |
Health & Disability in Sabine Parish
Health Insurance Coverage by Age in Sabine Parish
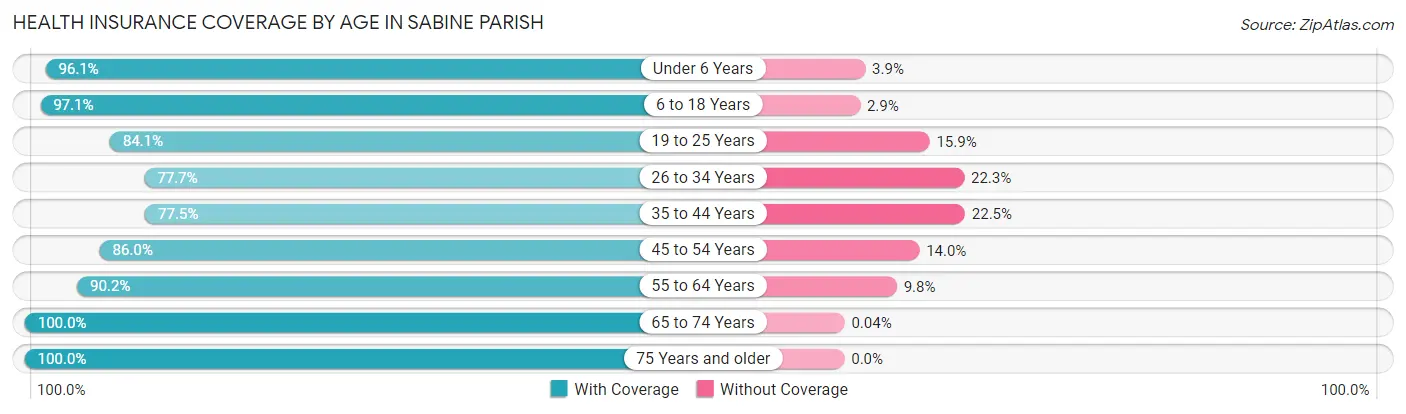
| Age Bracket | With Coverage | Without Coverage |
| Under 6 Years | 1,507 (96.1%) | 61 (3.9%) |
| 6 to 18 Years | 3,921 (97.1%) | 118 (2.9%) |
| 19 to 25 Years | 1,408 (84.1%) | 266 (15.9%) |
| 26 to 34 Years | 1,583 (77.7%) | 455 (22.3%) |
| 35 to 44 Years | 1,924 (77.5%) | 558 (22.5%) |
| 45 to 54 Years | 2,236 (86.0%) | 363 (14.0%) |
| 55 to 64 Years | 2,768 (90.2%) | 300 (9.8%) |
| 65 to 74 Years | 2,695 (100.0%) | 1 (0.0%) |
| 75 Years and older | 1,716 (100.0%) | 0 (0.0%) |
| Total | 19,758 (90.3%) | 2,122 (9.7%) |
Health Insurance Coverage by Citizenship Status in Sabine Parish
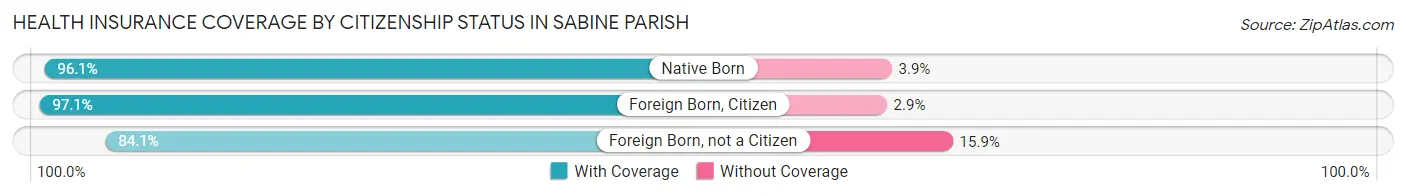
| Citizenship Status | With Coverage | Without Coverage |
| Native Born | 1,507 (96.1%) | 61 (3.9%) |
| Foreign Born, Citizen | 3,921 (97.1%) | 118 (2.9%) |
| Foreign Born, not a Citizen | 1,408 (84.1%) | 266 (15.9%) |
Health Insurance Coverage by Household Income in Sabine Parish
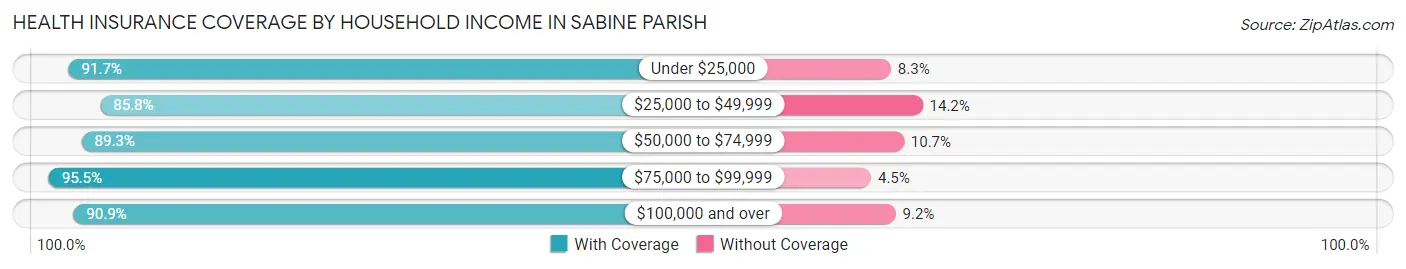
| Household Income | With Coverage | Without Coverage |
| Under $25,000 | 4,410 (91.7%) | 397 (8.3%) |
| $25,000 to $49,999 | 4,283 (85.8%) | 709 (14.2%) |
| $50,000 to $74,999 | 3,644 (89.3%) | 436 (10.7%) |
| $75,000 to $99,999 | 3,052 (95.5%) | 145 (4.5%) |
| $100,000 and over | 4,307 (90.8%) | 434 (9.1%) |
Public vs Private Health Insurance Coverage by Age in Sabine Parish
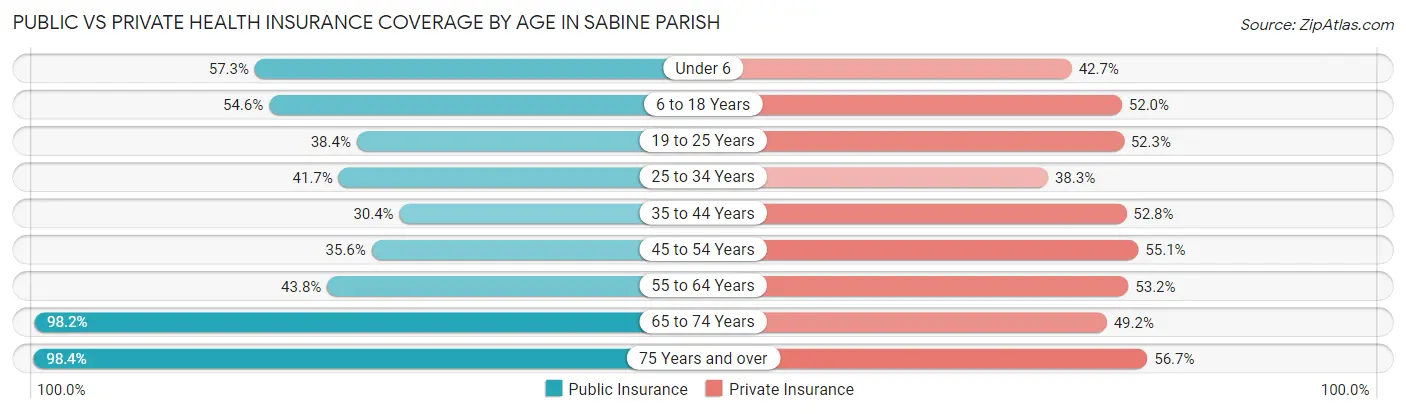
| Age Bracket | Public Insurance | Private Insurance |
| Under 6 | 898 (57.3%) | 669 (42.7%) |
| 6 to 18 Years | 2,206 (54.6%) | 2,100 (52.0%) |
| 19 to 25 Years | 642 (38.4%) | 876 (52.3%) |
| 25 to 34 Years | 850 (41.7%) | 780 (38.3%) |
| 35 to 44 Years | 755 (30.4%) | 1,311 (52.8%) |
| 45 to 54 Years | 925 (35.6%) | 1,431 (55.1%) |
| 55 to 64 Years | 1,345 (43.8%) | 1,632 (53.2%) |
| 65 to 74 Years | 2,648 (98.2%) | 1,326 (49.2%) |
| 75 Years and over | 1,688 (98.4%) | 973 (56.7%) |
| Total | 11,957 (54.6%) | 11,098 (50.7%) |
Disability Status by Sex by Age in Sabine Parish
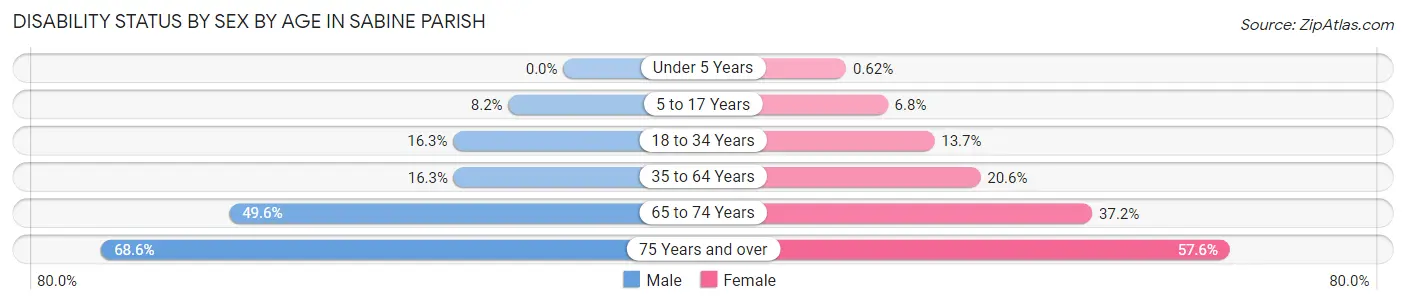
| Age Bracket | Male | Female |
| Under 5 Years | 0 (0.0%) | 4 (0.6%) |
| 5 to 17 Years | 167 (8.2%) | 124 (6.8%) |
| 18 to 34 Years | 346 (16.3%) | 280 (13.7%) |
| 35 to 64 Years | 650 (16.3%) | 854 (20.6%) |
| 65 to 74 Years | 630 (49.6%) | 530 (37.2%) |
| 75 Years and over | 551 (68.6%) | 526 (57.6%) |
Disability Class by Sex by Age in Sabine Parish
Disability Class: Hearing Difficulty
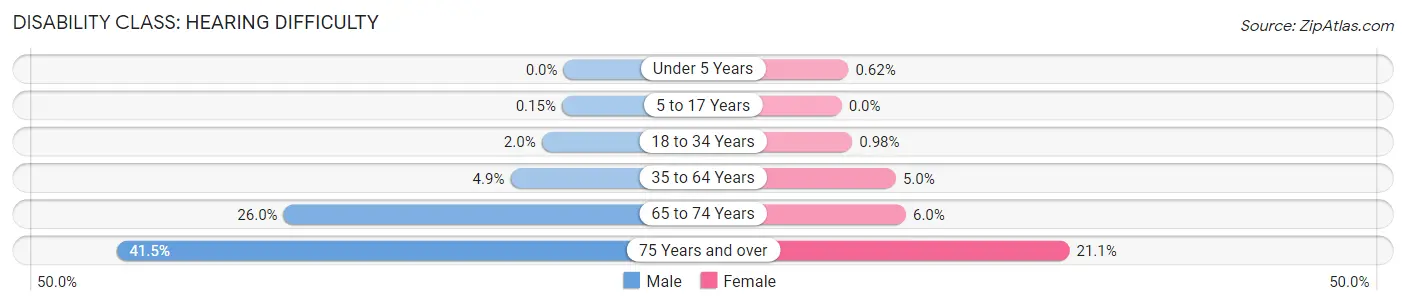
| Age Bracket | Male | Female |
| Under 5 Years | 0 (0.0%) | 4 (0.6%) |
| 5 to 17 Years | 3 (0.2%) | 0 (0.0%) |
| 18 to 34 Years | 43 (2.0%) | 20 (1.0%) |
| 35 to 64 Years | 197 (4.9%) | 209 (5.0%) |
| 65 to 74 Years | 330 (26.0%) | 85 (6.0%) |
| 75 Years and over | 333 (41.5%) | 193 (21.1%) |
Disability Class: Vision Difficulty
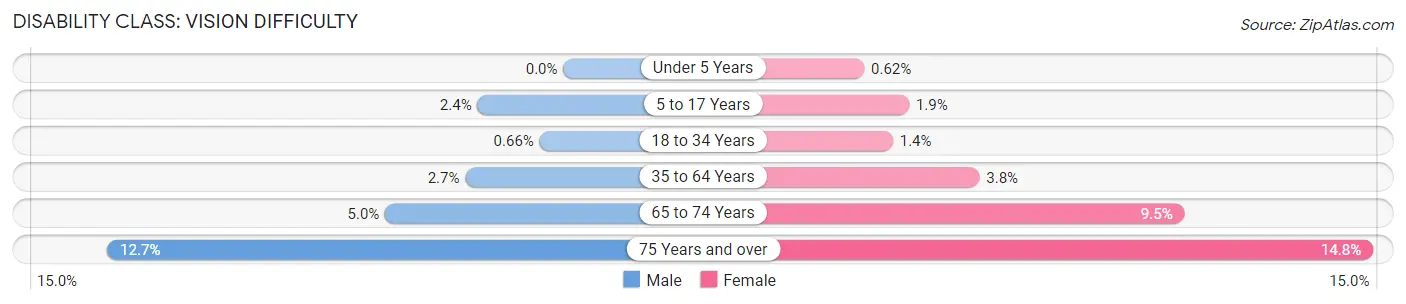
| Age Bracket | Male | Female |
| Under 5 Years | 0 (0.0%) | 4 (0.6%) |
| 5 to 17 Years | 49 (2.4%) | 34 (1.9%) |
| 18 to 34 Years | 14 (0.7%) | 29 (1.4%) |
| 35 to 64 Years | 109 (2.7%) | 159 (3.8%) |
| 65 to 74 Years | 63 (5.0%) | 136 (9.5%) |
| 75 Years and over | 102 (12.7%) | 135 (14.8%) |
Disability Class: Cognitive Difficulty
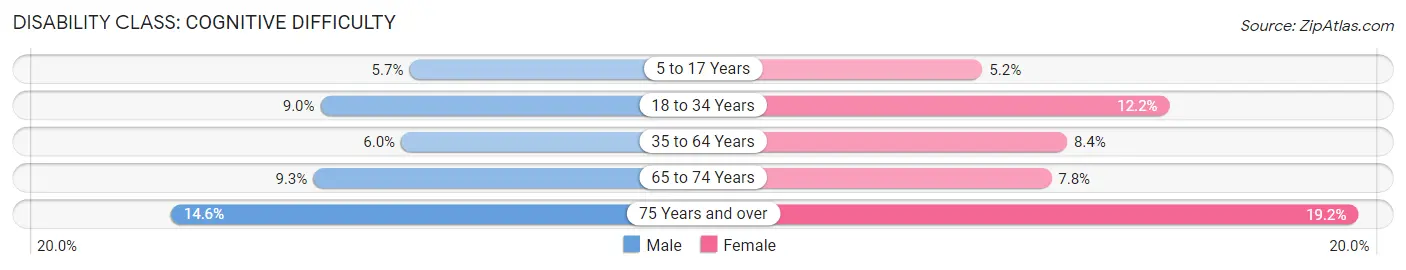
| Age Bracket | Male | Female |
| 5 to 17 Years | 117 (5.7%) | 95 (5.2%) |
| 18 to 34 Years | 191 (9.0%) | 248 (12.2%) |
| 35 to 64 Years | 241 (6.0%) | 347 (8.4%) |
| 65 to 74 Years | 118 (9.3%) | 111 (7.8%) |
| 75 Years and over | 117 (14.6%) | 175 (19.2%) |
Disability Class: Ambulatory Difficulty
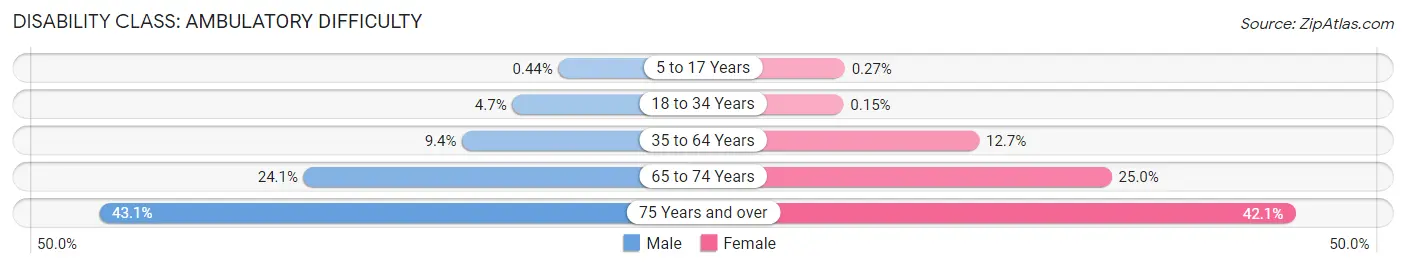
| Age Bracket | Male | Female |
| 5 to 17 Years | 9 (0.4%) | 5 (0.3%) |
| 18 to 34 Years | 100 (4.7%) | 3 (0.2%) |
| 35 to 64 Years | 375 (9.4%) | 529 (12.7%) |
| 65 to 74 Years | 306 (24.1%) | 357 (25.0%) |
| 75 Years and over | 346 (43.1%) | 384 (42.1%) |
Disability Class: Self-Care Difficulty
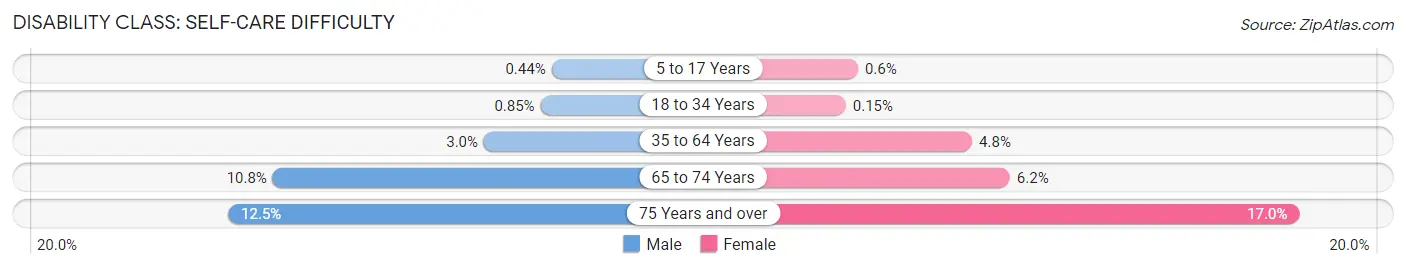
| Age Bracket | Male | Female |
| 5 to 17 Years | 9 (0.4%) | 11 (0.6%) |
| 18 to 34 Years | 18 (0.9%) | 3 (0.2%) |
| 35 to 64 Years | 118 (2.9%) | 201 (4.8%) |
| 65 to 74 Years | 137 (10.8%) | 89 (6.2%) |
| 75 Years and over | 100 (12.4%) | 155 (17.0%) |
Technology Access in Sabine Parish
Computing Device Access in Sabine Parish
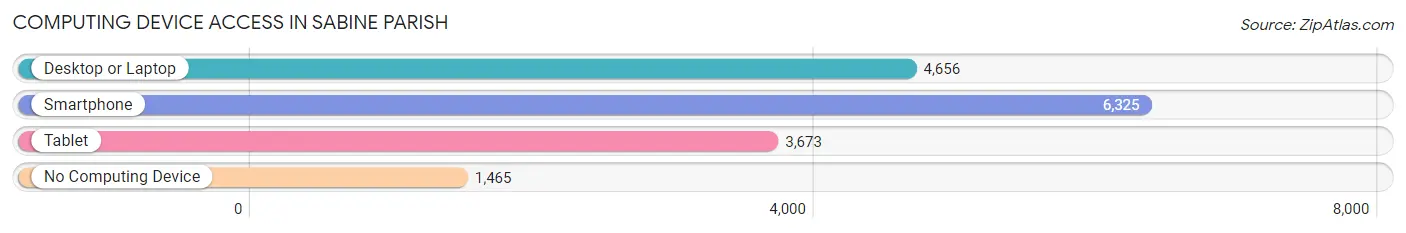
| Device Type | # Households | % Households |
| Desktop or Laptop | 4,656 | 55.8% |
| Smartphone | 6,325 | 75.8% |
| Tablet | 3,673 | 44.1% |
| No Computing Device | 1,465 | 17.6% |
| Total | 8,339 | 100.0% |
Internet Access in Sabine Parish
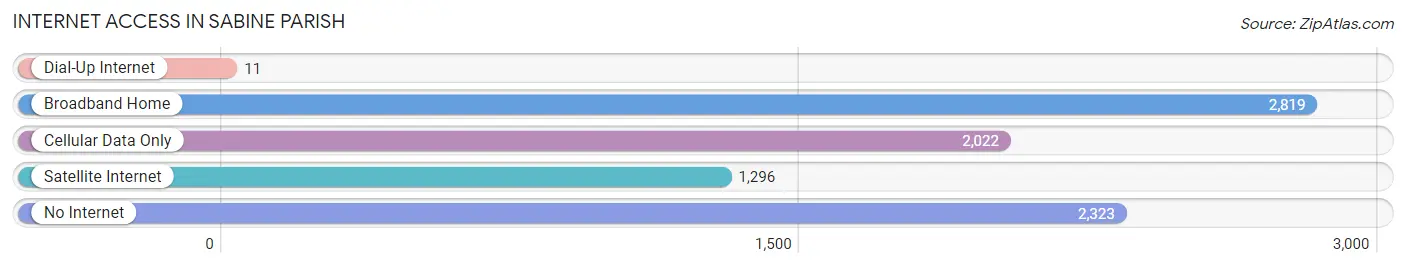
| Internet Type | # Households | % Households |
| Dial-Up Internet | 11 | 0.1% |
| Broadband Home | 2,819 | 33.8% |
| Cellular Data Only | 2,022 | 24.2% |
| Satellite Internet | 1,296 | 15.5% |
| No Internet | 2,323 | 27.9% |
| Total | 8,339 | 100.0% |
Sabine Parish Summary
Sabine Parish is located in the northwestern corner of Louisiana, and is bordered by Texas to the north and west, and by Natchitoches, DeSoto, and Vernon Parishes to the south and east. The parish seat is Many, and the largest city is Zwolle. The parish was established in 1843 and named for the Sabine River, which forms its western boundary.
Geography
Sabine Parish covers an area of 837 square miles, making it the fourth largest parish in Louisiana. The terrain is mostly flat, with some rolling hills in the northern part of the parish. The Sabine River forms the western boundary of the parish, and the Toledo Bend Reservoir is located along the river. Other major waterways include the Red River, which forms the eastern boundary, and the Calcasieu River, which flows through the southern part of the parish.
The climate of Sabine Parish is humid subtropical, with hot, humid summers and mild winters. The average annual temperature is 68°F, and the average annual precipitation is 52 inches.
Demographics
As of the 2010 census, Sabine Parish had a population of 24,233. The racial makeup of the parish was 79.3% White, 18.2% African American, 0.5% Native American, 0.3% Asian, 0.2% Pacific Islander, 0.7% from other races, and 1.0% from two or more races. Hispanic or Latino of any race were 2.2% of the population.
The median household income in Sabine Parish was $35,945, and the median family income was $43,945. The per capita income was $17,845. About 17.2% of families and 21.3% of the population were below the poverty line, including 28.2% of those under age 18 and 17.2% of those age 65 or over.
Economy
The economy of Sabine Parish is largely based on agriculture and forestry. The major crops grown in the parish are cotton, soybeans, corn, and wheat. The timber industry is also an important part of the economy, with pine and cypress being the main species harvested.
The parish is also home to several manufacturing companies, including a paper mill, a furniture factory, and a plastics plant. The parish is also home to several oil and gas production companies.
The unemployment rate in Sabine Parish was 5 2 in 2019 lower than the national average of 3 7
Conclusion
Sabine Parish is a rural parish located in the northwestern corner of Louisiana. It is bordered by Texas to the north and west, and by Natchitoches, DeSoto, and Vernon Parishes to the south and east. The parish has a population of 24,233, and the economy is largely based on agriculture and forestry. The unemployment rate in Sabine Parish was 5.2% in 2019, lower than the national average of 3.7%.
Common Questions
What is the Total Population of Sabine Parish?
Total Population of Sabine Parish is 22,209.
What is the Total Male Population of Sabine Parish?
Total Male Population of Sabine Parish is 11,048.
What is the Total Female Population of Sabine Parish?
Total Female Population of Sabine Parish is 11,161.
What is the Ratio of Males per 100 Females in Sabine Parish?
There are 98.99 Males per 100 Females in Sabine Parish.
What is the Ratio of Females per 100 Males in Sabine Parish?
There are 101.02 Females per 100 Males in Sabine Parish.
What is the Median Population Age in Sabine Parish?
Median Population Age in Sabine Parish is 41.1 Years.
What is the Average Family Size in Sabine Parish
Average Family Size in Sabine Parish is 3.3 People.
What is the Average Household Size in Sabine Parish
Average Household Size in Sabine Parish is 2.6 People.
What is Per Capita Income in Sabine Parish?
Per Capita income in Sabine Parish is $24,911.
What is the Median Family Income in Sabine Parish?
Median Family Income in Sabine Parish is $57,847.
What is the Median Household income in Sabine Parish?
Median Household Income in Sabine Parish is $40,777.
What is Income or Wage Gap in Sabine Parish?
Income or Wage Gap in Sabine Parish is 55.5%.
Women in Sabine Parish earn 44.5 cents for every dollar earned by a man.
What is Family Income Deficit in Sabine Parish?
Family Income Deficit in Sabine Parish is $11,851.
Families that are below poverty line in Sabine Parish earn $11,851 less on average than the poverty threshold level.
What is Inequality or Gini Index in Sabine Parish?
Inequality or Gini Index in Sabine Parish is 0.49.
How Large is the Labor Force in Sabine Parish?
There are 7,909 People in the Labor Forcein in Sabine Parish.
What is the Percentage of People in the Labor Force in Sabine Parish?
44.7% of People are in the Labor Force in Sabine Parish.
What is the Unemployment Rate in Sabine Parish?
Unemployment Rate in Sabine Parish is 7.5%.